 Jiong Qiu
- Department of Physics, Montana State University, Bozeman, MT, United States
The explosive release of energy in the solar atmosphere is driven magnetically, but the mechanisms that trigger the onset of the eruption remain controversial. In the case of flares and coronal mass ejections (CMEs), ideal or non-ideal instabilities usually occur in the corona, but it is difficult to obtain direct observations and diagnostics there. To overcome this difficulty, we analyze observational signatures in the upper chromosphere or transition region, particularly brightening and dimming at the base of coronal magnetic structures. In this paper, we examine the time evolution of spatially resolved light curves in two eruptive flares and identify a variety of tempo-spatial sequences of brightening and dimming, such as dimming followed by brightening and dimming preceded by brightening. These brightening–dimming sequences are indicative of the configuration of energy release in the form of plasma heating or bulk motion. We demonstrate the potential of using these analyses to diagnose the properties of magnetic reconnection and plasma expansion in the corona during the early stages of the eruption.
1 Introduction
It is well known that explosive energy releases in the form of solar flares and coronal mass ejections (CMEs) are driven magnetically. In this process, magnetic energy is converted to the kinetic energy of particles and the heat and bulk motion of plasmas (Thompson et al., 2021). CMEs open up a portion of the solar corona, along which energetic particles are released into interplanetary space and can impact the space weather. At present, routine measurements of the full disk magnetic field are available only in the lower solar atmosphere, the photosphere. Therefore, the capability to identify the solar surface signatures of an open magnetic structure and track magnetic field evolution prior to eruption will help us explore mechanisms governing the onset of the eruption and predict space weather.
Traditionally, coronal holes (Cranmer, 2009), or regions of persistent lack of emission at soft X-ray (SXR) and extreme ultraviolet (EUV) wavelengths, are considered to map the feet of open field lines on the solar surface. The lifetimes of coronal holes range from many days to multiple weeks (Lowder et al., 2017, and references therein). The temporary, and often abrupt, opening up of the magnetic structure associated with a CME produces transient coronal holes, also called coronal dimmings (Sterling and Hudson, 1997). A comprehensive review of observational signatures and an interpretation of coronal dimmings has been provided by Veronig et al. (2024, in press). Mechanisms causing the explosive “opening up” of the corona include the onset of an ideal instability, in which the global force balance is lost during the quasi-equilibrium evolution of the system (Forbes and Isenberg, 1991; Török and Kliem, 2005; Kliem and Török, 2006; Isenberg and Forbes, 2007), or the onset of a non-ideal instability, often referred to as magnetic reconnection, which abruptly changes the connectivity of the field lines and, in this way, removes or weakens the constraints that would maintain the force balance of a coronal structure. The “tether-cutting” (Moore et al., 2001) and “break-out” (Antiochos et al., 1999) configurations have been the most well-known reconnection geometry, which occurs either below or above the erupting structure, be it a magnetic flux rope or a sheared arcade (Patsourakos et al., 2020).
In the case of major solar eruptive events, the onset of the eruption, either due to ideal or non-ideal instabilities, takes place in the corona, but perturbations propagate along magnetic field lines to reach the lower atmosphere on Alfvénic timescales. In this paper, we focus on dimming and brightening signatures observed at the foot or base of magnetic structures that are undergoing dynamic evolution, such as magnetic reconnection or plasma expansion/eruption. As a direct consequence of magnetic reconnection, energy flux, via particle beams (Fisher et al., 1985), thermal conduction (Longcope, 2014), or Alfvén waves (Fletcher and Hudson, 2008), is transported along newly reconnected field lines to be deposited in the denser lower atmosphere, producing enhanced brightening there. On the other hand, dimming at the base of the corona is primarily an effect of plasma rarefaction due to the expansion of the overlying coronal structures such as a CME, which reduces the pressure of the overlying corona. The expansion or eruption of a coronal structure may occur before or after the onset of magnetic reconnection; therefore, dimming may be observed either before or after brightening in the lower atmosphere.
A solar eruptive event involves a rather complex magnetic configuration, and different parts of the system undergo different dynamics and also interact with each other, such as through reconnection. The spatially resolved, full-disk observations, like those provided by the Solar Dynamics Observatory (SDO; Pesnell et al., 2012), allow us to infer the evolution of different parts of the coronal structures during or before the eruption by examining the behavior at their base in the lower atmosphere. In this paper, we conduct such an experiment on two eruptive flares, using the tempo-spatial sequence of brightening and dimming to reconstruct the evolution of coronal structures in the early phase of their eruption. In the following section, we describe the strategy to identify dimming signatures at the base of the corona (S2). We apply the analysis to observations of an X-class eruptive event SOL20120712, which shows post-eruption dimming (S3), and of a C-class eruptive event SOL20110621, which also exhibits pre-eruption dimming (S4), and use these signatures to infer the properties of the overlying coronal structure. We summarize what is learned from this experiment and discuss the potential to reconstruct the evolution of overlying coronal structures from the brightening and dimming signatures at their base (S5).
2 Tempo-spatial sequence of brightening and dimming
In this paper, we analyze the brightening and dimming signatures in the lower atmosphere of two eruptive events. They exhibit a variety of dimming–brightening sequences that can be used to diagnose the dynamic evolution of overlying coronal structures in the early phase of the eruption.
2.1 Impulsive and prolonged brightening
We identify brightening in the lower atmosphere, as these locations usually map the feet of reconnecting field lines along which energy flux is transported and deposited in the denser lower atmosphere. It has been a well-adopted practice to integrate magnetic flux in these areas of brightening in the lower atmosphere as an estimate of the amount of reconnection flux
When magnetic reconnection occurs in the corona, energy flux along newly reconnected field lines travels to the lower atmosphere on Alfvénic timescales and produces a rapid or impulsive brightening there. If reconnection forms closed field lines (post-reconnection flare loops), the impulsive energy release in these loops drives chromospheric evaporation, which significantly increases the density (and temperature) of the plasmas trapped in the loops. As a result, prolonged brightening is often observed at the base of the post-reconnection flare loops for an extended duration of more than 10 min, before the brightness is attenuated to a pre-flare level, reflecting the timescales of chromospheric evaporation, cooling of the heated corona, and often, continuous gradual heating (Qiu et al., 2013; Qiu and Longcope, 2016). Therefore, light curves similar to those shown in Figure 1A are indicative of reconnection forming closed field lines or flare loops. On the other hand, reconnection leading to open field lines, which do not trap plasmas, would produce only impulsive brightening at its base, as shown in Figure 1B. The pixel light curves are, therefore, indicative of the reconnection geometry.

Figure 1. Light curves of the brightness in the UV 1,600 or EUV 304 Å passbands in several pixels from various flares observed by the AIA, showing (A) impulsive brightening followed by prolonged brightening, (B) rapid dimming following impulsive brightening, or (C) gradual dimming before brightening.
In this study, we identify brightening pixels in the UV 1,600 Å passband or EUV 304 Å passband when the pixel brightness
2.2 Rapid and gradual dimming
The majority of coronal dimming is observed in the soft X-ray and EUV wavelengths (Sterling and Hudson, 1997; Thompson et al., 1998; Mandrini et al., 2007; Qiu et al., 2007; Temmer et al., 2017; Dissauer et al., 2018; Wang et al., 2019). In this study, we examine signatures in the upper chromosphere, or transition region, where coronal structures undergoing dynamic evolution are anchored. We identify dimming signatures at the base of the corona primarily using observations in the He II 304 passband on the AIA, complemented by analysis of more conventional observations in the EUV passbands, including the EUV 171, 193, and 211 Å passbands. The other EUV passbands are sensitive to temperatures
We examine the time evolution of the brightness at each pixel, normalized to its base brightness. The base brightness is the mean brightness over 20–30 min prior to the eruption. The dimming pixels are identified if the brightness is reduced to
We assume that these dimming pixels map the feet of the magnetic structures that are expanding or erupting in the corona. Here, we define “expansion” and “eruption” as the global or average bulk motion of the plasma in a magnetic structure, the former referring to motion at subsonic speeds and the latter at super-sonic speeds. If dimming is preceded by brightening at the same or adjacent locations, this is likely an indication that reconnection is opening overlying field lines, and the magnetic flux integrated into the brightening area provides an estimate of the amount of flux removed from above. Furthermore, the dynamic properties, such as the mean speed of the expansion of the overlying corona, can be also estimated from the evolution of the dimming depth.
The pixel light curves given in Figure 1 show various dimming signatures, such as rapid dimming following impulsive brightening (b), indicative of reconnection of the opening up of field lines along which plasmas rapidly expand, or gradual dimming over tens of minutes, followed by brightening or rapid dimming (panel c), suggesting the quasi-equilibrium expansion of the overlying coronal structure before the onset of reconnection or eruption. The tempo-spatial sequence of dimming and brightening therefore provides clues to the dynamic evolution of the corona.
3 Reconnection-driven post-eruption dimming
An X-class eruptive flare occurred on 12 July 2012 in NOAA-11520. The flare was accompanied by a fast CME with its early-phase motion best captured by STEREO-A (Cheng et al., 2014; Dudík et al., 2014; Zhu et al., 2020). Figure 2 shows several snapshots of the event observed by the AIA. The eruption occurred in the core active region, forming two bright ribbons in magnetic fields of opposite polarities, outlining the feet of post-reconnection flare loops or closed field lines produced by reconnection. We refer to these two ribbons as flare ribbons. Shortly afterward, another set of two long ribbons extended from the flare ribbons in the core region, first briefly brightening and then quickly dimming. We call these two ribbons that became dark dimming ribbons, and they were also located in magnetic fields of opposite polarities.
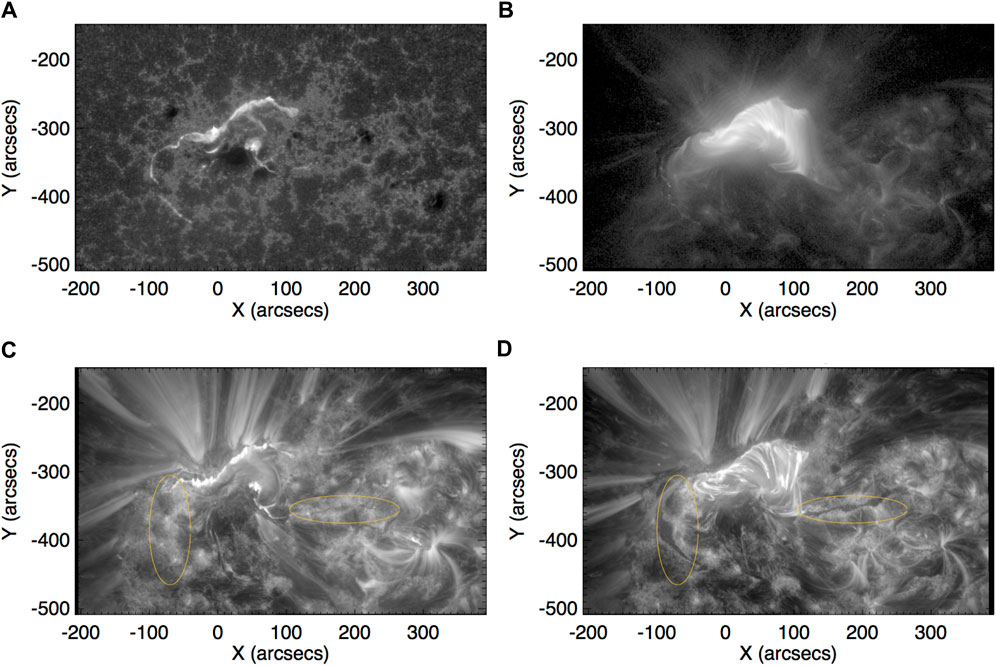
Figure 2. Overview of the SOL20120712 eruptive flare observed by the AIA. Top: flare ribbons observed in the UV 1,600 Åpassband (A) and flare loops observed in the EUV 131 Åpassband (B). Bottom: flare ribbons and loops observed in the EUV 171 Åpassband at two times (C,D), showing a pair of post-eruption dimming ribbons (their locations indicated by the two orange ovals) extending from the ends of the two flare ribbons. All images are co-aligned to 17:00 UT.
Figure 3A shows, in red, the time sequence of the brightening in the flare ribbons in the core region and also the brightening adjacent to the dimming ribbons away from the core region. This reconnection mask is derived using the UV 1,600 Å observations, with the method described by Qiu et al. (2007, 2010). In the same figure, blue indicates the time sequence of the dimming as the brightness is reduced to 80% of the base level (see S2 for identification of the dimming pixels). The dimming (and the preceding brightening) appears to spread rapidly along the dimming ribbons at an apparent speed of more than 100 km s −1, which was noted as a signature of “slipping reconnection” by Dudík et al. (2014).

Figure 3. Evolution of brightening and dimming. (A) Mapping of the brightening evolution (from AIA 1,600 Å) on a photospheric magnetogram (grayscale) of the longitudinal magnetic field component
The magnetic flux integrated in the brightening pixels and in the dimming pixels is measured and shown in Figure 3B, showing that, in this event, the onset of flare reconnection starts at approximately 16 UT, prior to the rapid increase in the dimming. The flare reconnection rate peaks at 16:20 UT and stops at approximately 17 UT, when a total amount of 7
The dimming ribbons are most prominently observed in the EUV 304, 171, and 193 Å passbands. Figure 4 shows the time–distance diagrams of the normalized brightness produced along five slits across each dimming ribbon; the locations of the slits are indicated by horizontal or vertical bars in Figure 3A. In particular, the diagrams of the 304 Å passband clearly demonstrate dimming after impulsive brightening. Figure 5 shows the epoch plot of the pixel light curves in the two dimming ribbons, or the evolution of the brightness (normalized to the base brightness) with respect to the time of the peak brightness. The figure illustrates the timescales of impulsive brightening, followed by rapid dimming, both within a couple of minutes. In most of these places, dimming does not recover for more than a few hours.

Figure 4. Time–distance diagrams of the normalized brightness along the five slits from top to bottom across the dimming ribbon in the east (left) and along the five slits from left to right across the dimming ribbon in the west (right), in the 304 Å (A), 171 Å (B), and 193 Å (C) passbands, respectively, all showing rapid dimming after impulsive brightening.
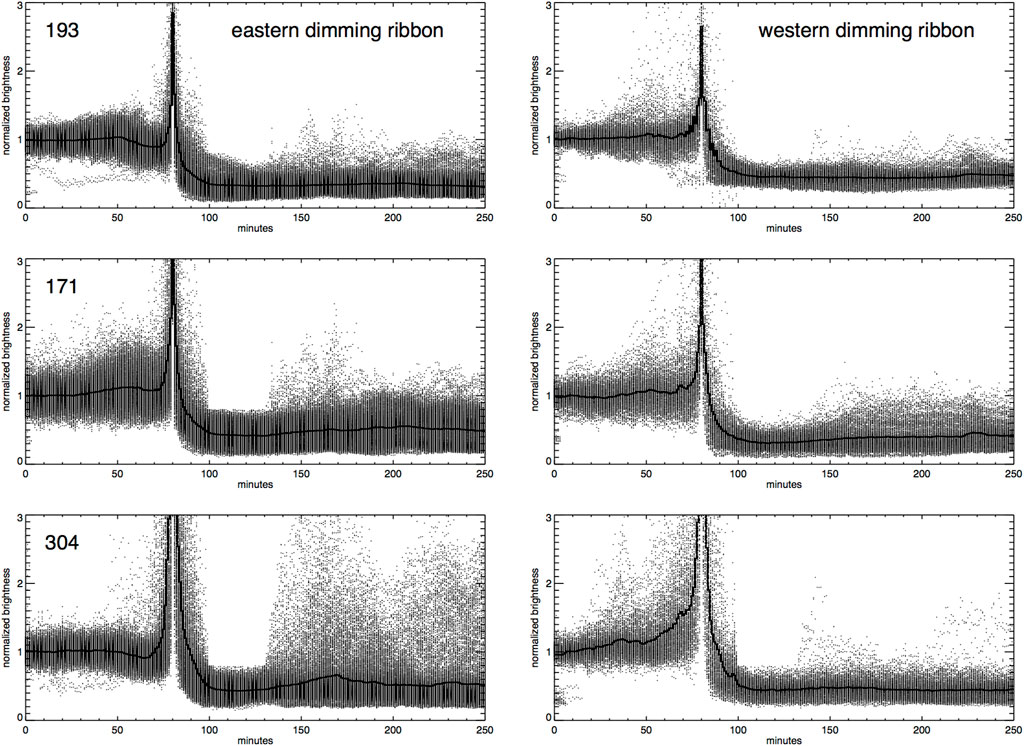
Figure 5. Epoch plots of the normalized brightness light curves of approximately 1,000 pixels in the eastern dimming ribbon (left) and of approximately 300 pixels in the western dimming ribbon (right), observed in the EUV 193 Å, 171 Å, and 304 Å passbands, respectively.
The tempo–spatial sequence of the brightening and dimming in this event suggests the scenario of magnetic reconnection between an erupting structure from the core region and the overlying arcades or the strapping field. The two dimming ribbons outline the photospheric intersection of separatrices in the complex multi-polar magnetic field where reconnection tends to occur (Dudík et al., 2014). In particular, a potential field extrapolation suggests that the dimming ribbon in the negative magnetic field to the east outlines the feet of an arcade connecting the dimming ribbon to the outer edge of the flare ribbon in the positive magnetic field, and the dimming ribbon in the positive magnetic field to the west maps the feet of another set of arcades with their conjugate feet in the negative magnetic field north of the flare ribbon (Cooper Downs, personal communication). These overlying arcades have to open up for the underlying structure to escape the solar corona.
In summary, in this eruptive event, the dimming analysis does not reveal any significant pre-eruption dynamics of the coronal magnetic structures. Dimming occurs after the onset of flare reconnection in the core region. The pair of dimming ribbons extending outward from the flare ribbons most likely map the feet of several overlying arcades that open up by reconnecting with the erupting structure. In this course, an overlying flux of 5
4 Pre-eruption dimming indicative of gradual expansion
A C-class eruptive flare occurred on 21 June 2011. It has been studied by Zhu et al. (2020) and Vievering et al. (2023). The associated CME is best observed by STEREO-A from the limb during its early phase; following the trajectory of the CME, its onset is determined to be at 2:15 UT (Zhu et al., 2020). Figure 6 shows the evolution of the event observed in the EUV 304 Å (left) and 211 Å (right) passbands. A filament is visible prior to the eruption and is erupted around the time of the CME onset. During the eruption, two flare ribbons are brightened as depicted in a standard model; the eruption also causes coronal dimming in a large area to the south of the source region. In this study, we focus on the core region where the eruption originates, attempting to understand the early-phase evolution.
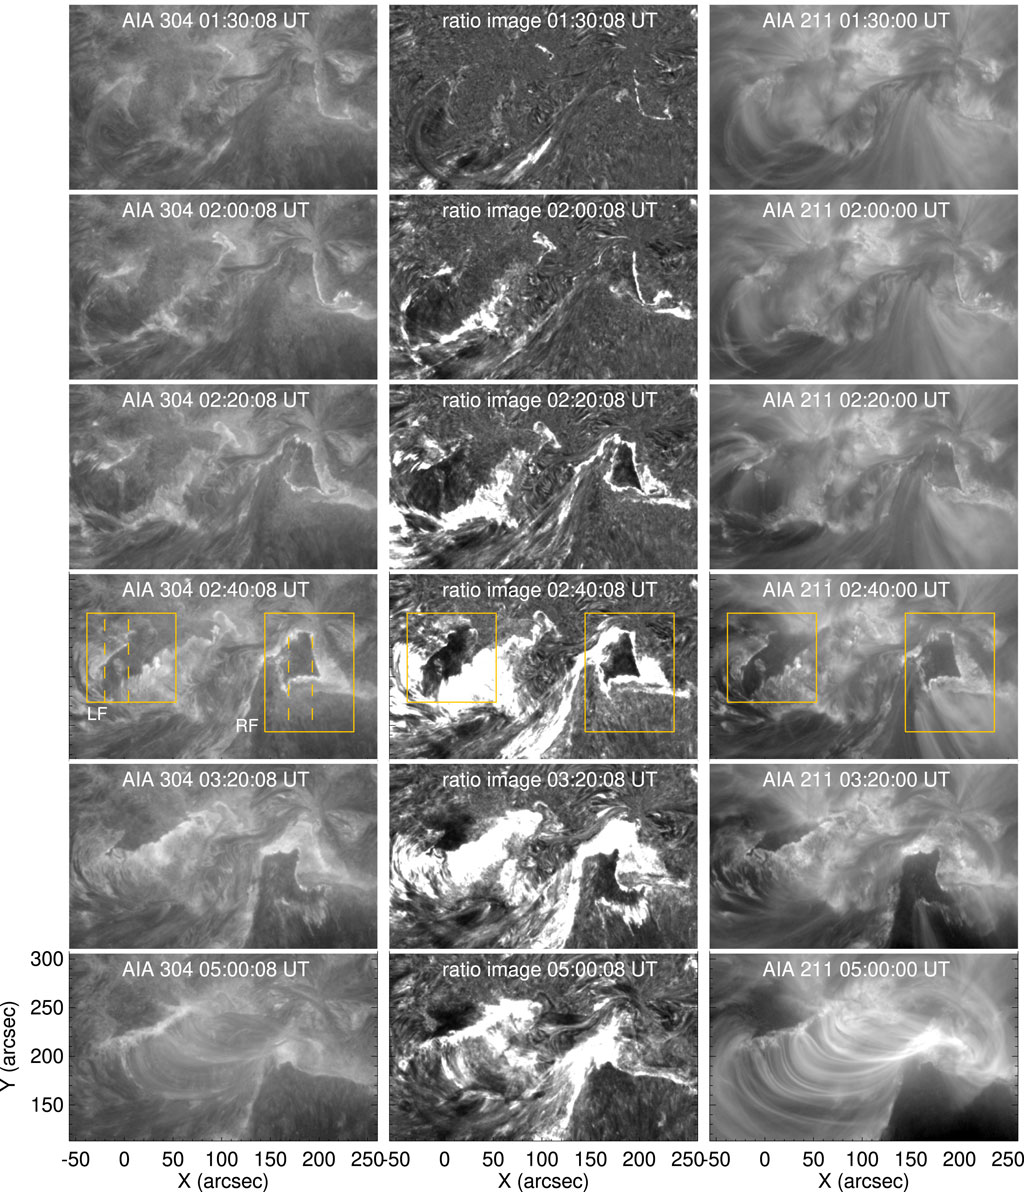
Figure 6. Overview of the SOL20110621 eruptive flare observed by the AIA, in the EUV 304 Å passband (left) and 211 Å passband (right). Also shown are base ratio images in the 304 Å passband (middle), with the images normalized to the base image, which is the average of the images from 1:00 UT to 1:20 UT. The two orange boxes denote regions of prominent dimming at the left (LF) and right (RF) feet of a filament visible in the EUV images. The four vertical dashed bars in the left panel mark the slits, along which the time–distance diagrams are produced in Figure 8.
This event exhibits a variety of brightening and dimming signatures different from those of the SOL20120712 event. As shown in Figure 6, prominent dimming signatures are observed in both passbands and, in particular, in the EUV 304 Å base ratio images (middle panels). The dimming primarily occurs in two regions demarcated by the orange boxes that are located at the two ends of the filament. The dimming morphology resembles the twin-dimming or core-dimming geometry, similar to the events reported by Webb et al. (2000), Cheng and Qiu (2016), and Wang et al. (2019), suggesting that the twin-dimming regions may map the feet of a flux rope. It is also noted that along the edge of the dimming cores at the far ends of the two flare ribbons, brightening occurs as early as 1:30 UT, well before the onset of the eruption and flare reconnection that produced the two ribbons.
In this event, the brightening is relatively weak compared with the X-class flare studied in S3; therefore, we use EUV 304 Å passband observations, which are more sensitive to weak brightening than the 1,600 Å passband, to identify brightening signatures at the base of the corona. Two kinds of brightening signatures are observed: flare ribbons underlying closed flare loops exhibit impulsive brightening, followed by a prolonged brightening that gradually decays for over 10 min; on the other hand, several pixels of weak and brief brightening are also identified. Figure 7B shows the timing of brightening1 superimposed on a photospheric magnetogram of
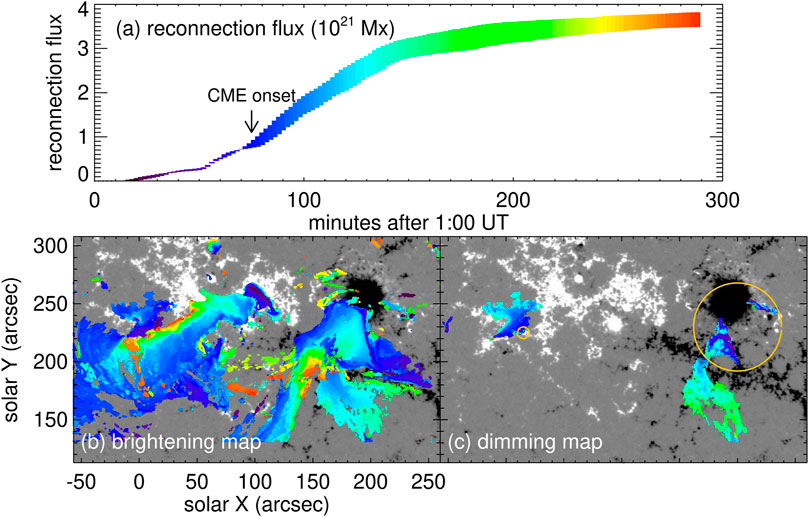
Figure 7. (A) Magnetic flux, or reconnection flux, measured in brightening pixels. (B–C) Time evolution of the brightening and dimming mapped on a photospheric magnetogram of the line-of-sight magnetic field component. At each location, the color indicates the time of the onset of the brightening (B) or dimming (C) as defined in the text. The time of the color scheme is shown in (A).
We identify dimming using EUV 304 Å imaging observations following the method outlined in S2. We form the base image as the average of the images between 1:00 and 1:20 UT and define dimming as persistent attenuation at
Figure 8 shows the time–distance diagrams of the normalized brightness along a few slits shown in Figure 6 and the light curves of a few selected pixels along the slits exhibiting various dimming–brightening sequences similar to those shown in Figure 1. The epoch plots of the two groups of dimming light curves are given in Figure 9, showing the evolution of the pixel brightness with respect to their peak time. The first group exhibits gradual dimming (Figure 9A), with the observed onset of the dimming ranging between 10 and 100 min (average at
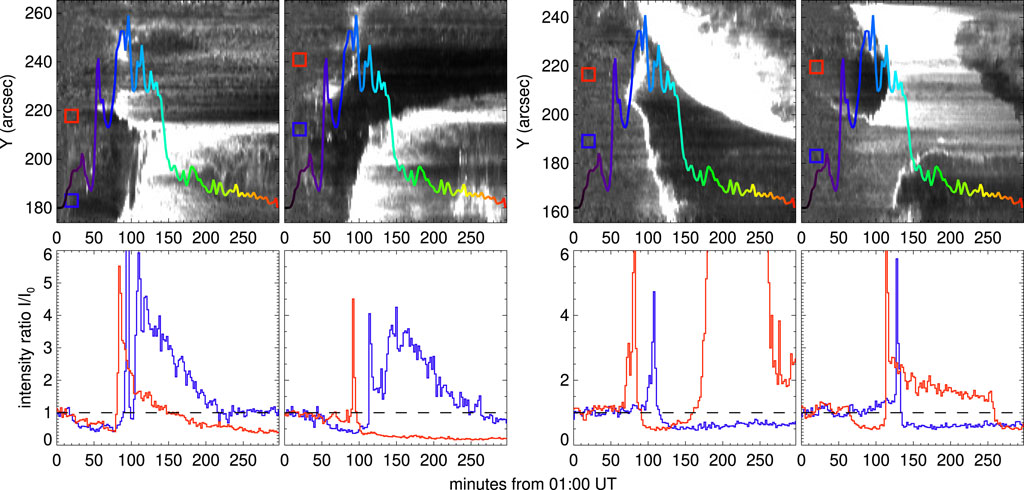
Figure 8. Top: time–distance diagrams of the normalized brightness along the four slits shown in Figure 6, two in the left foot region (left) and two in the right foot region (right), superimposed with the reconnection rate

Figure 9. Epoch plots of dimming light curves in two groups showing the pre-eruption gradual dimming (left) and the post-eruption impulsive dimming (right). Solid black and red curves indicate the average and median light curves, respectively, of all light curves in a group.
The locations of the two groups of dimmings are shown in Figure 7C. The pre-eruption gradual dimmings are within the orange circles; they are mostly clustered in the right region in negative magnetic fields and are bounded by early brightening that outlines a triangle-shaped hook. In the left region in positive magnetic fields, only a small area right next to the flare ribbon exhibits pre-eruption gradual dimming. The post-eruption dimming occupies a larger area in both the left and right feet regions. It appears that, at the onset of the eruption, the pre-eruption dimming spread out into the post-eruption dimming, with a rapid brightening during the transition.
The post-eruption dimming light curves in the second group are similar to those in the SOL20120712 event, suggesting that the erupting structure reconnects with overlying fields and escapes from the corona. However, the geometry of the dimming is different; in this event, the post-eruption dimming appears to map the feet of the erupting structure that has shifted outward after the onset of the flare reconnection, rather than the feet of overlying arcades. This should be confirmed with future data-driven MHD modeling.
The pre-eruption gradual dimming at the feet of the filament is likely a signature of the quasi-equilibrium expansion of a coronal structure. We can estimate the mean speed of the expansion from the slope of the dimming depth (Qiu and Cheng, 2017). At the base of the corona, the optically thin transition-region emission can be modeled as the “pressure gauge” (Qiu et al., 2013, and references therein) so that the brightness is proportional to the mean pressure of the overlying corona. As the overlying corona gradually expands, the dimming in terms of the ratio of the brightness to the base brightness,
In summary, the eruptive event SOL20110621 displays different brightening–dimming geometries and sequences from those of the SOL20120712 event. Both pre-eruption and post-eruption dimming occur at the feet of a filament adjacent to flare ribbons, and its geometry resembles the core twin dimming. The twin dimming likely maps the conjugate feet of a coronal structure that gradually expands and then erupts, and this structure carries the total (axial) flux of up to a few times
5 Summary
In this paper, we present an experiment that analyzes the brightening and dimming signatures in the lower atmosphere and uses the tempo-spatial sequence of these signatures to identify overlying magnetic structures that are undergoing dynamic evolution in the early phase of their eruption, such as reconnection or expansion. The experiment is applied to two eruptive events, in which pixel light curves exhibit a variety of brightening–dimming sequences.
For the SOL20120712 event, we did not find signatures indicative of dynamic evolution prior to flare reconnection, which occurs nearly simultaneously with the eruption. The erupting structure then reconnects with the overlying arcades, producing impulsive brightening and rapid dimming at the feet of the arcades as the overlying field lines are opened up and removed from their path. We did not find any signatures likely to map the feet of the erupting structure in this event (e.g., Gou et al., 2023). This is possibly due to the stringent criteria for selecting dimming pixels in this study, which require persistent dimming (for more than 10 min) observed with low-temperature lines characterizing signatures at the base of the corona, such as in the transition region. These requirements are reinforced to help minimize projection effects and noise fluctuations; on the other hand, dimming at these lines, particularly in the EUV 304 Å passband, is relatively weak. Therefore, dynamic dimming variations on short timescales may not be detected with the method used in this paper, and the estimated dimming flux is likely to be the lower limit.
The SOL20110621 event exhibits gradual pre-eruption dimming at the feet of a filament that erupts later, and the pre-eruption dimming is accompanied by early brightening that outlines the boundary of the gradual dimming at the far ends of flare ribbons formed later. These are likely signatures of the quasi-equilibrium expansion of a coronal structure through the ambient field, which persists for tens of minutes before the explosive loss of equilibrium, leading to eruption. If this structure embodies a pre-existing flux rope, then its gradual expansion and accompanying reconnection with the overlying fields (e.g., Longcope and Forbes, 2014) would bring it to a larger height in favor of the onset of the ideal instabilities, such as the torus instability (Kliem et al., 2014).
Comprehensive modeling (e.g., Rempel et al., 2023) is needed to reconstruct the three-dimensional magnetic configuration and the evolution toward eruption in both events. The identified tempo-spatial sequence of dimming and brightening provides additional observational constraints, or the observed boundary conditions, for the successful modeling of real eruptive events.
Data availability statement
The raw data supporting the conclusion of this article will be made available by the authors, without undue reservation.
Author contributions
JQ: conceptualization, data curation, formal analysis, funding acquisition, investigation, methodology, software, and writing–original draft.
Funding
The author(s) declare that financial support was received for the research, authorship, and/or publication of this article. This work was motivated by discussions during the coronal dimming workshop sponsored by the International Space Science Institute (ISSI) at Bern, Switzerland, and during the magnetic flux rope workshop sponsored by the Institute for Space–Earth Environmental (ISEE) Research in Nagoya University of Japan. JQ was supported by NASA grant nos 80NSSC22K0519 and 80NSSC23K0414. SDO is a mission of NASA’s Living With a Star program.
Conflict of interest
The author declares that the research was conducted in the absence of any commercial or financial relationships that could be construed as a potential conflict of interest.
Publisher’s note
All claims expressed in this article are solely those of the authors and do not necessarily represent those of their affiliated organizations, or those of the publisher, the editors, and the reviewers. Any product that may be evaluated in this article, or claim that may be made by its manufacturer, is not guaranteed or endorsed by the publisher.
Footnotes
1The onset time of the brightening depends on the empirical threshold used to identify the brightening, and it is typically within 0–3 min of the time of peak brightness.
References
Antiochos, S. K., DeVore, C. R., and Klimchuk, J. A. (1999). A model for solar coronal mass ejections. ApJ 510, 485–493. doi:10.1086/306563
Asai, A., Yokoyama, T., Shimojo, M., Masuda, S., Kurokawa, H., and Shibata, K. (2004). Flare ribbon expansion and energy release rate. ApJ 611, 557–567. doi:10.1086/422159
Cheng, X., Ding, M. D., Zhang, J., Sun, X. D., Guo, Y., Wang, Y. M., et al. (2014). ApJ 789, 93. doi:10.1088/0004-637X/789/2/93
Dissauer, K., Veronig, A. M., Temmer, M., Podladchikova, T., and Vanninathan, K. (2018). On the detection of coronal dimmings and the extraction of their characteristic properties. ApJ 855, 137. doi:10.3847/1538-4357/aaadb5
Downs, C., Török, T., Titov, V., Liu, W., Linker, J., and Mikic, Z. (2015). AAS/AGU triennial earth-sun summit, 1. Indianapolis, IN: AAS/AGU Triennial Earth-Sun Summit. 304.01.
Dudík, J., Janvier, M., Aulanier, G., Del Zanna, G., Karlický, M., Mason, H. E., et al. (2014). SLIPPING MAGNETIC RECONNECTION DURING AN X-CLASS SOLAR FLARE OBSERVED BYSDO/AIA. ApJ 784, 144. doi:10.1088/0004-637X/784/2/144
Fisher, G. H., Canfield, R. C., and McClymont, A. N. (1985). Flare loop radiative hydrodynamics - Part Six - chromospheric evaporation due to heating by nonthermal electrons. ApJ 289, 425. doi:10.1086/162902
Fletcher, L., and Hudson, H. S. (2008). Impulsive phase flare energy transport by large-scale Alfvén waves and the electron acceleration problem. ApJ 675, 1645–1655. doi:10.1086/527044
Forbes, T. G., and Isenberg, P. A. (1991). A catastrophe mechanism for coronal mass ejections. ApJ 373, 294. doi:10.1086/170051
Gou, T., Liu, R., Veronig, A. M., Zhuang, B., Li, T., Wang, W., et al. (2023). Complete replacement of magnetic flux in a flux rope during a coronal mass ejection. Nat. Astron. 7, 815–824. doi:10.1038/s41550-023-01966-2
Harra, L. K., Hara, H., Imada, S., Young, P., Williams, D. R., Sterling, A. C., et al. (2007). PASJ 59–S801. doi:10.1093/pasj/59.sp3.S801
Isenberg, P. A., and Forbes, T. G. (2007). A three-dimensional line-tied magnetic field model for solar eruptions. ApJ 670, 1453–1466. doi:10.1086/522025
Kazachenko, M. D., Lynch, B. J., Welsch, B. T., and Sun, X. (2017). A database of flare ribbon properties from the solar dynamics observatory. I. Reconnection flux. ApJ 845, 49. doi:10.3847/1538-4357/aa7ed6
Kliem, B., Lin, J., Forbes, T. G., Priest, E. R., and Török, T. (2014). ApJ 789, 46. doi:10.1088/0004-637X/789/1/46
Kliem, B., and Török, T. (2006). Torus instability. PhRvL 96, 255002. doi:10.1103/PhysRevLett.96.255002
Lemen, J. R., Title, A. M., Akin, D. J., Boerner, P. F., Chou, C., Drake, J. F., et al. (2012). The atmospheric imaging assembly (AIA) on the solar dynamics observatory (SDO). SoPh 275, 17–40. doi:10.1007/s11207-011-9776-8
Longcope, D. W., and Forbes, T. G. (2014). Breakout and tether-cutting eruption models are both catastrophic (sometimes). SoPh 289, 2091–2122. doi:10.1007/s11207-013-0464-8
Lowder, C., Qiu, J., and Leamon, R. (2017). Coronal holes and open magnetic flux over cycles 23 and 24. SoPh 292, 18. doi:10.1007/s11207-016-1041-8
Mandrini, C. H., Nakwacki, M. S., Attrill, G., van Driel-Gesztelyi, L., Démoulin, P., Dasso, S., et al. (2007). SoPh 244, 25–43. doi:10.1007/s11207-007-9020-8
Moore, R. L., Sterling, A. C., Hudson, H. S., and Lemen, J. R. (2001). Onset of the magnetic explosion in solar flares and coronal mass ejections. ApJ 552, 833–848. doi:10.1086/320559
O’Dwyer, B., Del Zanna, G., Mason, H. E., Weber, M. A., and Tripathi, D. (2010). SDO/AIA response to coronal hole, quiet Sun, active region, and flare plasma. A&A 521, A21. doi:10.1051/0004-6361/201014872
Patsourakos, S., Vourlidas, A., Török, T., Kliem, B., Antiochos, S. K., Archontis, V., et al. (2020). Decoding the pre-eruptive magnetic field configurations of coronal mass ejections. SSRv 216, 131. doi:10.1007/s11214-020-00757-9
Pesnell, W. D., Thompson, B. J., and Chamberlin, P. C. (2012). The solar dynamics observatory (SDO). SoPh 275, 3–15. doi:10.1007/s11207-011-9841-3
Qiu, J., and Cheng, J. (2017). Gradual solar coronal dimming and evolution of coronal mass ejectionin the early phase. ApJL 838, L6. doi:10.3847/2041-8213/aa6798
Qiu, J., Hu, Q., Howard, T. A., and Yurchyshyn, V. B. (2007). On the magnetic flux budget in low-corona magnetic reconnection and interplanetary coronal mass ejections. ApJ 659, 758–772. doi:10.1086/512060
Qiu, J., Liu, W., Hill, N., and Kazachenko, M. (2010). ApJ 725, 319–330. doi:10.1088/0004-637X/725/1/319
Qiu, J., Sturrock, Z., Longcope, D. W., Klimchuk, J. A., and Liu, W.-J. (2013). ApJ 774, 14. doi:10.1088/0004-637X/774/1/14
Qiu, J., Wang, H., Cheng, C. Z., and Gary, D. E. (2004). Magnetic reconnection and mass acceleration in flare–coronal mass ejection events. ApJ 604, 900–905. doi:10.1086/382122
Rempel, M., Chintzoglou, G., Cheung, M. C. M., Fan, Y., and Kleint, L. (2023). Comprehensive radiative MHD simulations of eruptive flares above collisional polarity inversion lines. ApJ 955, 105. doi:10.3847/1538-4357/aced4d
Simões, P. J. A., Reid, H. A. S., Milligan, R. O., and Fletcher, L. (2019). The spectral content of SDO/AIA 1600 and 1700 Å filters from flare and plage observations. ApJ 870, 114. doi:10.3847/1538-4357/aaf28d
Sterling, A. C., and Hudson, H. S. (1997). [ITAL]Yohkoh[/ITAL] SXT observations of X-ray “dimming” associated with a halo coronal mass ejection. ApJL 491, L55–L58. doi:10.1086/311043
Temmer, M., Thalmann, J. K., Dissauer, K., Veronig, A. M., Tschernitz, J., Hinterreiter, J., et al. (2017). On flare-CME characteristics from sun to earth combining remote-sensing image data with in situ measurements supported by modeling. SoPh 292, 93. doi:10.1007/s11207-017-1112-5
Thompson, B. J., Plunkett, S. P., Gurman, J. B., Newmark, J. S., St. Cyr, O. C., and Michels, D. J. (1998). SOHO/EIT observations of an Earth-directed coronal mass ejection on May 12, 1997. Geophys. Res. Lett. 25, 2465–2468. doi:10.1029/98GL50429
Thompson, B. J., Qiu, J., Lugaz, N., and Webb, D. F. (2021). “Solar flares and coronal mass ejections,” in Solar physics and solar wind. Editors N. E. Raouafi, and A. Vourlidas, 1, 179–220. doi:10.1002/9781119815600.ch5
Török, T., and Kliem, B. (2005). Confined and ejective eruptions of kink-unstable flux ropes. ApJL 630, L97–L100. doi:10.1086/462412
Vievering, J. T., Vourlidas, A., Zhu, C., Qiu, J., and Glesener, L. (2023). Evolution of solar eruptive events: investigating the relationships among magnetic reconnection, flare energy release, and coronal mass ejections. ApJ 946, 81. doi:10.3847/1538-4357/acbe3d
Wang, W., Zhu, C., Qiu, J., Liu, R., Yang, K. E., and Hu, Q. (2019). Evolution of a magnetic flux rope toward eruption. ApJ 871, 25. doi:10.3847/1538-4357/aaf3ba
Webb, D. F., Lepping, R. P., Burlaga, L. F., DeForest, C. E., Larson, D. E., Martin, S. F., et al. (2000). The origin and development of the May 1997 magnetic cloud. J. Geophys. Res. 105, 27251–27259. doi:10.1029/2000JA000021
Keywords: magnetic reconnection, solar flares, coronal mass ejections, solar eruptions, ultraviolet radiation
Citation: Qiu J (2024) Tracing field lines that are reconnecting, or expanding, or both. Front. Astron. Space Sci. 11:1401846. doi: 10.3389/fspas.2024.1401846
Received: 16 March 2024; Accepted: 29 May 2024;
Published: 22 July 2024.
Edited by:
Xiangliang Kong, Shandong University, Weihai, ChinaReviewed by:
Sijie Yu, New Jersey Institute of Technology, United StatesTingyu Gou, Harvard University, United States
Yulei Wang, Nanjing University, China
Copyright © 2024 Qiu. This is an open-access article distributed under the terms of the Creative Commons Attribution License (CC BY). The use, distribution or reproduction in other forums is permitted, provided the original author(s) and the copyright owner(s) are credited and that the original publication in this journal is cited, in accordance with accepted academic practice. No use, distribution or reproduction is permitted which does not comply with these terms.
*Correspondence: Jiong Qiu, cWl1QG1vbnRhbmEuZWR1