 K. C. Barik
 C. C. Chaston
- Space Sciences Laboratory, University of California, Berkeley, Berkeley, CA, United States
A statistical analysis of energy transport through Earth’s plasma sheet is performed using 6 years of Magnetospheric Multi-Scale (MMS) mission observations. The analysis entails a complete decomposition of the contributions to transport including the ion heat flux and enthalpy flux derived from the full ion pressure tensor to provide a three-dimensional (3-D) picture of plasma sheet energy transport. It is shown that the Poynting flux and enthalpy flux compete to dominate the total energy transport, while the heretofore ignored heat flux generally contributes a larger fraction of the total energy flux than the bulk kinetic energy flux. The spatial distribution of these fluxes are consistent with magnetic reconnection driven transport from an X-line statistically located at
1 Introduction
Energy transport through Earth’s magnetotail occurs primarily in fast flows. It is believed that more than
The primary role of magnetic reconnection in driving magnetotail transport has been demonstrated in a number of studies that characterize the energy and momentum flux in high speed flows emanating from reconnection sites (Birn and Hesse, 2005; McPherron et al., 2020). For example, local energy release from reconnection X-lines has been shown to be primarily in the form of the enthalpy flux of outward streaming ion jets (Eastwood et al., 2013). On the other hand, at dipolarization fronts (DFs), the primary form of energy transport is the enthalpy flux of heated electrons (Liu et al., 2021). Below the ion cyclotron frequency, a broad spectrum Alfvén waves extending from MHD to kinetic scales plays an important role in energy transport (Perraut et al., 2000; Contel et al., 2001). Angelopoulos et al. (2002) found large Poynting fluxes carried by kinetic Alfvén waves (KAWs) in the frequency range
The relationship between the different forms of energy transport is intrinsic to understanding energy release through the magnetotail and its manifestation in space weather events. Kinetic energy and Poynting flux carried by flows and field variations, for example, transport mass and energy Earthward to power the aurorae (Wygant et al., 2000; Keiling et al., 2003), pump up the ring current (Sandhu et al., 2018), and modulate the radiation belts (Baker, 2000). These manifestations are consequences of different forms of transport and the distribution of the corresponding fluxes through the magnetotail. Statistical studies exploring these distributions have for instance, demonstrated that the kinetic energy flux (the sum of enthalpy and bulk kinetic energy flux) exceeded the Poynting flux in the inner plasma sheet (IPS) (Angelopoulos et al., 1994), while the statistical analysis by Miyashita et al. (2012) suggested that in the plasma sheet (PS), the bulk kinetic energy flux is much smaller than the Poynting flux and enthalpy flux. Conversely, during substorm periods in the tail-lobe region, the Poynting flux was found to surpass the enthalpy flux (Ohtani, 2019). The statistical study by Kaufmann and Paterson (2008) predicted heat flux near the neutral sheet
Here we extend these studies by decomposing the energy flux observed through Earth’s plasma sheet into its elemental ion kinetic and electromagnetic contributions. This is performed using the full vector fields and ion pressure tensor measured from the Magnetospheric Multi-Scale Spacecraft (MMS) over 6 years of operation. This decomposition provides a 3-D picture of the distribution of the various modes of energy transport through the plasma sheet not previously realised.
2 Data and methodology
2.1 Event selection
We use measurements recorded along traversals through Earth’s magnetotail by the MMS spacecraft over the years 2017–2022. These traversals are identified based on the information provided by the new mission phases and science region of interest of MMS (https://lasp.colorado.edu/galaxy/display/MFDPG/1.3+Mission+Phases+and+Science+Regions+of+Interest) and by visual inspection when no such information is available. In what follows field and particle measurements from MMS1 alone are shown noting that the results returned from the other spacecraft are for our purposes identical. Survey mode magnetic field data from the Flux-gate Magnetometer (FGM) (Russell et al., 2014) and fast-mode electric field data (Ergun et al., 2014; Lindqvist et al., 2014) from the Electric Double Probe (EDP) instrument (Torbert et al., 2014) are employed to evaluate the Poynting flux in GSM coordinates. Measurements from the Fast Plasma Investigation (FPI) instrument (Pollock et al., 2016) in the form of velocity moments evaluated over the energy range above the spacecraft potential and below the 30 keV upper limit of the instrument are employed to derive the kinetic terms. These data are returned every of 4.5 s. This cadence defines the “base” time resolution of the measurements we report. The evaluation of these moments incorporates corrections due to spacecraft charging to eliminate spurious contributions from secondaries and photo-electrons.
From these measurements a database is created by averaging over consecutive intervals defined by advection in the flow corresponding to a distance of
2.2 Analysis
The energy flux is decomposed into the electromagnetic energy, or Poynting flux, kinetic fluxes including the enthalpy flux and heat flux, and the bulk kinetic energy flux. The temporal evolution of total energy density
Here, we evaluate each term on the RHS, where the first term represents the bulk kinetic energy flux, where
3 Results
3.1 Energy transport topology
A representative interval measured from MMS1 on 1 August 2018 is presented in Figure 1 showing time-series fields and plasma parameters and the corresponding derived energy flux components on which the database is based. As shown, the spacecraft journeys from
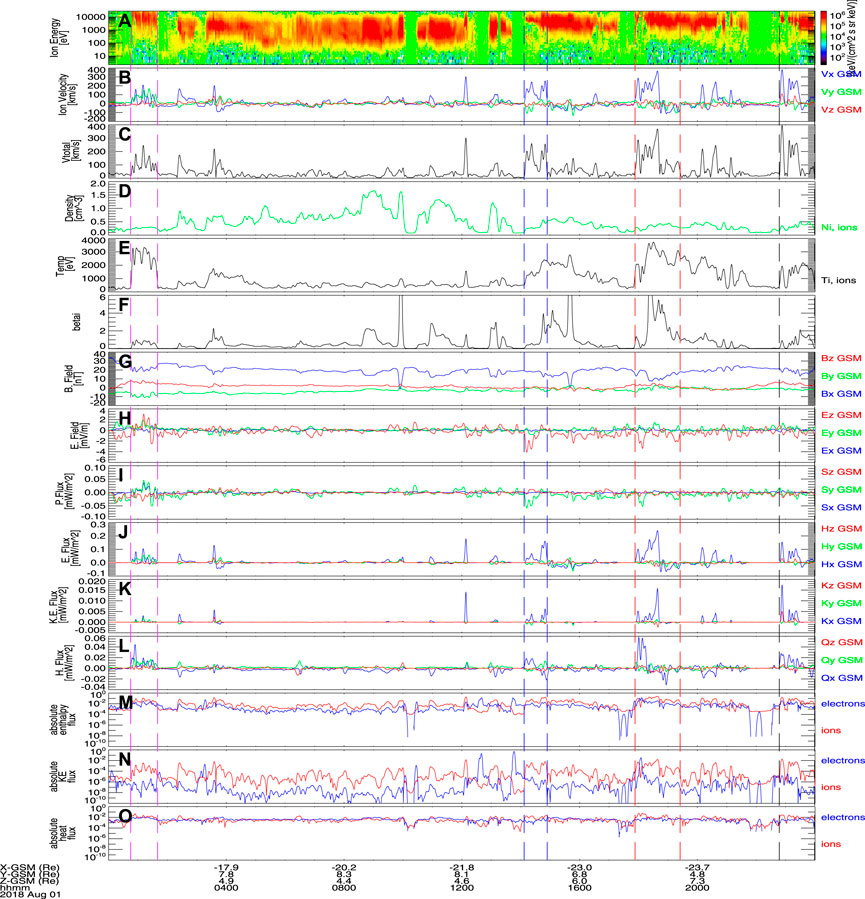
Figure 1. Shows (A) differential energy flux of ions, (B) three components of ion flow speed in geocentric solar magnetospheric (GSM) coordinate, (C) absolute value of ion flow speed, (D) ion density, (E) ion temperature, (F) ion plasma beta, (G) magnetic field, (H) electric field, and three components of the (I) Poynting flux, ion (J) enthalpy flux (K) bulk kinetic energy flux, and (L) heat flux in GSM coordinates, respectively. Absolute values of (M) enthalpy flux (N) bulk kinetic energy flux, and (O) heat flux of electrons and ions are shown in blue and red curves, respectively for comparison. Regions identified by dashed vertical lines indicate absolute ion bulk flow speed exceeding 50 km/s for extended period of time.
Figures 1M–O presents a comparison of absolute values of enthalpy flux, bulk kinetic energy flux and heat flux for electrons (blue curve) and ions (red curve), respectively. As discussed in Section 2.2, the contributions of ion enthalpy and bulk kinetic energy fluxes are generally higher than those of the electrons, and the electron and ion heat flux contributions are nearly equal over this interval.
Using the procedures outlined in Section 2.1, statistics describing the decomposed energy transport contributions in GSM coordinates were compiled over the spatial range covered by the MMS spacecraft within Earth’s magnetotail. For the purpose of presenting summary distributions in this report, each GSM plane in the magnetotail (i.e., XY, XZ, and YZ planes) is partitioned into bins with a window size of

Figure 2. Shows the distribution of the absolute value of (A) Poynting flux, (B) enthalpy flux, (C) bulk kinetic energy flux, and (D) heat flux in XY-plane. The color-blind friendly version of Figures 2–4 can be found in the Supplementary Figures S5-S7.
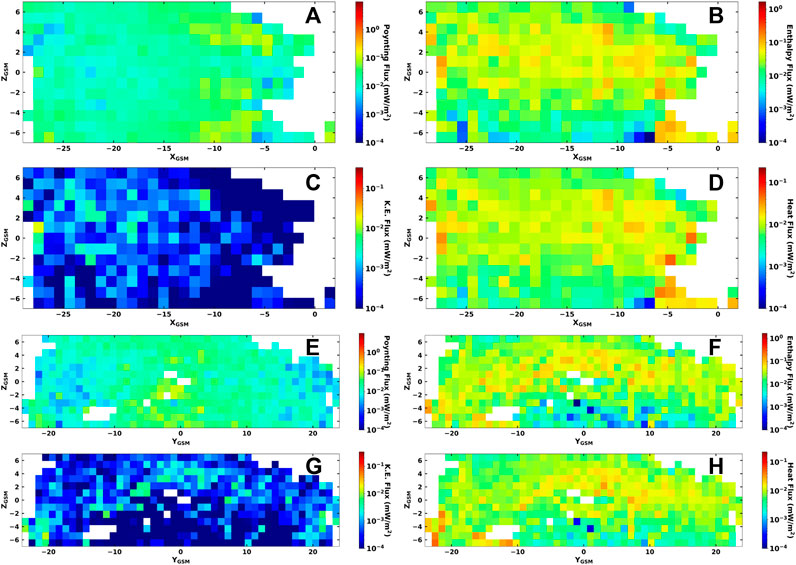
Figure 3. Shows the distribution of the absolute value of (A) Poynting flux, (B) enthalpy flux, (C) bulk kinetic energy flux, and (D) heat flux in XZ-plane. Furthermore, in YZ-plane, the distribution of the absolute value of (E) Poynting flux, (F) enthalpy flux, (G) bulk kinetic energy flux, and (H) heat flux.
Figure 2A illustrates the distribution of Poynting flux in the equatorial plane (XY-plane). The Poynting flux exhibits a gradual increase from the distant tail region to the near-Earth region, attaining its maximum value in the near-Earth region. Further, Poynting flux decreases from the central region towards the edges of the XY-plane. The corresponding distribution of enthalpy flux shown in Figure 2B is more irregular or patchy with comparatively larger values than the Poynting flux in the distant magnetotail. Moreover, in contrast to the Poynting flux distribution, the enthalpy flux is somewhat enhanced on the flanks of the near-Earth region, and most prominently in the dusk-ward sector. Additionally, unlike the Poynting flux, where the flux is maximum close to the origin in
The distribution of the energy fluxes in the GSM XZ-plane, is depicted in Figures 3A–D. The Poynting flux increases gradually from the distant magnetotail to the near-Earth region, as previously identified (cf. Figure 2A). There is a general depletion at low values of
The distributions in the YZ-plane are presented in Figures 3E–H. In Figure 3E, the distribution shows that most of the Poynting flux is concentrated within the range
3.2 Energy transport in pressure balance coordinates
To provide physical insight into the distribution of these energy fluxes, we resample the statistics into a 2-D coordinate system defined by pressure balance (Baumjohann et al., 1990; Xing et al., 2010) and the magnitude and orientation of the magnetic field in the X-Z plane. Following the formulation outlined by Watanabe et al. (2019) the magnetic field in the lobes is defined as
where,
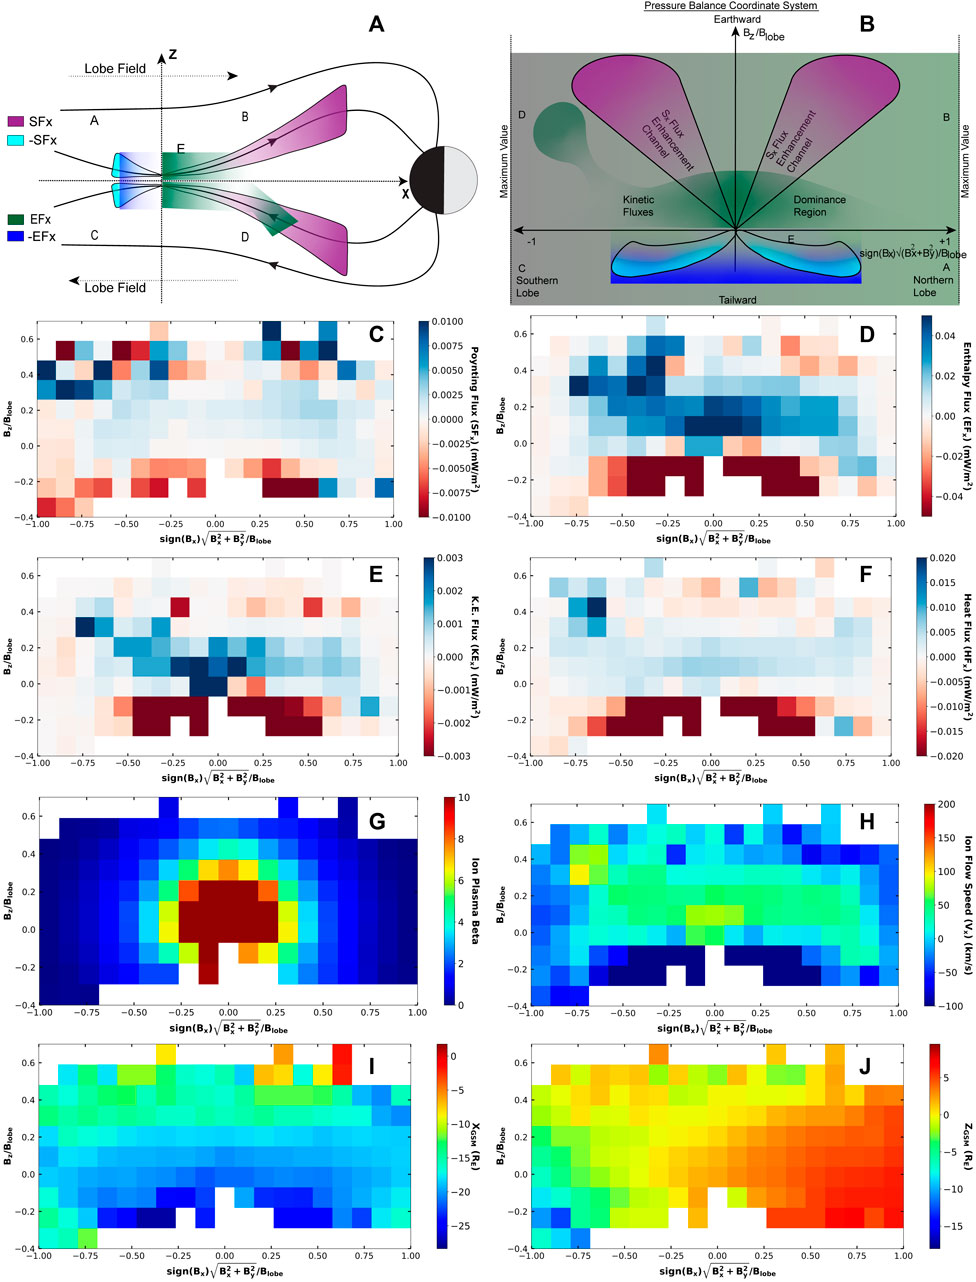
Figure 4. Shows (A) Physical Coordinate plane XZ of magnetotail, (B) Overview of pressure balance coordinate system. In the
Several salient features of the energy transport distributions emerge in this coordinate system (Equation 2). Firstly, near the x-line, the fluxes in the tail-ward direction (i.e., negative
4 Conclusion
We used 6 years (2017–2022) of measurements from the MMS mission to statistically map the distribution of energy transport through Earth’s magnetotail. The use of the full pressure tensor and 3-D electromagnetic fields provide a more complete account of energy transport through this region than previously possible. It is found that the ion heat flux, previously overlooked in earlier studies, makes a substantial contribution to the total ion energy flux within Earth’s magnetotail and is found to have larger contribution than the bulk kinetic energy flux most of the time. While earlier studies of ion heat flux were limited to the neutral sheet represented as a 2-D projection in the equatorial plane (Kaufmann and Paterson, 2008), our study resolves the distribution of ion heat flux throughout the plasma sheet and reports results in 3-D. In the XY-GSM plane, the Poynting flux exhibits a smooth variation, increasing gradually from the distant magnetotail to the near-Earth region. Meanwhile, both the ion enthalpy and heat fluxes in the same plane display a slight enhancement on the dusk side near the inner edge of the plasma sheet but are otherwise nearly uniform, albeit patchy or intermittent in their distribution over the spatial range considered. On the other hand, the ion bulk kinetic energy flux in the XY-plane generally decreases with proximity to Earth with an abrupt fall off inside
In closing, we note that a persistent feature throughout the statistics reported here is the anti-correlation between the Poynting and ion kinetic fluxes. When organized in a coordinate system relative to an empirically inferred X-line a pattern emerges suggestive of results returned via large scale MHD simulations of the magnetotail (Birn and Hesse, 2005). In this coordinate system the kinetic contributions transport energy Earthward through the central plasma sheet mostly within channels of X-directed Poynting flux displaced in Z that peak at the inner edge of the plasma sheet and extend to high latitudes. An examination of the physical relationship between the ion kinetic and electromagnetic fluxes suggested by this picture goes beyond what can be considered here. However, a consideration of the vector fluxes and corresponding spatial gradients inherent to conversion between these modes of transport may be pursued in a later study.
Data availability statement
The datasets presented in this study can be found in online repositories. The names of the repository/repositories and accession number(s) can be found below: https://figshare.com/s/2abfa217a8e75dc5bdd5.
Author contributions
KB: Conceptualization, Investigation, Methodology, Visualization, Writing–original draft, Writing–review and editing. CC: Conceptualization, Funding acquisition, Supervision, Writing–review and editing.
Funding
The author(s) declare that financial support was received for the research, authorship, and/or publication of this article. This research was supported by NASA Grant 80NSSC21K0580.
Acknowledgments
The data provided through NASA Magnetospheric Multi-Scale mission MODA.
Conflict of interest
The authors declare that the research was conducted in the absence of any commercial or financial relationships that could be construed as a potential conflict of interest.
Publisher’s note
All claims expressed in this article are solely those of the authors and do not necessarily represent those of their affiliated organizations, or those of the publisher, the editors and the reviewers. Any product that may be evaluated in this article, or claim that may be made by its manufacturer, is not guaranteed or endorsed by the publisher.
Supplementary material
The Supplementary Material for this article can be found online at: https://www.frontiersin.org/articles/10.3389/fspas.2024.1481448/full#supplementary-material
References
Angelopoulos, V., Baumjohann, W., Kennel, C. F., Coroniti, F. V., Kivelson, M. G., Pellat, R., et al. (1992). Bursty bulk flows in the inner central plasma sheet. J. Geophys. Res. Space Phys. 97, 4027–4039. doi:10.1029/91JA02701
Angelopoulos, V., Chapman, J. A., Mozer, F. S., Scudder, J. D., Russell, C. T., Tsuruda, K., et al. (2002). Plasma sheet electromagnetic power generation and its dissipation along auroral field lines. J. Geophys. Res. Space Phys. 107, 14–20. doi:10.1029/2001JA900136
Angelopoulos, V., Kennel, C. F., Coroniti, F. V., Pellat, R., Kivelson, M. G., Walker, R. J., et al. (1994). Statistical characteristics of bursty bulk flow events. J. Geophys. Res. Space Phys. 99, 21257–21280. doi:10.1029/94JA01263
Baker, D. (2000). The role of magnetospheric substorms in high-energy particle production within the 1. earth’s Magnetos. 443, 419.
Baumjohann, W., Paschmann, G., and Lühr, H. (1990). Pressure balance between lobe and plasma sheet. Geophys. Res. Lett. 17, 45–48. doi:10.1029/GL017i001p00045
Birn, J., and Hesse, M. (2005). Energy release and conversion by reconnection in the magnetotail. Ann. Geophys. 23, 3365–3373. doi:10.5194/angeo-23-3365-2005
Chaston, C. C., Bonnell, J. W., Clausen, L., and Angelopoulos, V. (2012). Energy transport by kinetic-scale electromagnetic waves in fast plasma sheet flows. J. Geophys. Res. Space Phys. 117. doi:10.1029/2012JA017863
Chaston, C. C., Johnson, J. R., Wilber, M., Acuna, M., Goldstein, M. L., and Reme, H. (2009). Kinetic alfvén wave turbulence and transport through a reconnection diffusion region. Phys. Rev. Lett. 102, 015001. doi:10.1103/PhysRevLett.102.015001
Contel, O. L., Roux, A., Perraut, S., Pellat, R., Holter, Ø., Pedersen, A., et al. (2001). Possible control of plasma transport in the near-Earth plasma sheet via current-driven Alfvén waves (ƒ ∼ = ƒH+). J. Geophys. Res. Space Phys. 106, 10817–10827. doi:10.1029/2001JA900013
Eastwood, J. P., Phan, T. D., Drake, J. F., Shay, M. A., Borg, A. L., Lavraud, B., et al. (2013). Energy partition in magnetic reconnection in earth’s magnetotail. Phys. Rev. Lett. 110, 225001. doi:10.1103/PhysRevLett.110.225001
Ergun, R. E., Tucker, S., Westfall, J., Goodrich, K. A., Malaspina, D. M., Summers, D., et al. (2014). The axial double probe and fields signal processing for the MMS mission. Space Sci. Rev. 199, 167–188. doi:10.1007/s11214-014-0115-x
Ergun, R. E., Usanova, M. E., Turner, D. L., and Stawarz, J. E. (2022). Bursty bulk flow turbulence as a source of energetic particles to the outer radiation belt. Geophys. Res. Lett. 49. doi:10.1029/2022GL098113
Hasegawa, H. (2012). Structure and dynamics of the magnetopause and its boundary layers. Monogr. Environ. Earth Planets 1, 71–119. doi:10.5047/meep.2012.00102.0071
Hesse, M., and Birn, J. (1991). On dipolarization and its relation to the substorm current wedge. J. Geophys. Res. Space Phys. 96, 19417–19426. doi:10.1029/91JA01953
Juusola, L., Østgaard, N., and Tanskanen, E. (2011a). Statistics of plasma sheet convection: ps statistics. J. Geophys. Res. Space Phys. 116, n/a. doi:10.1029/2011JA016479
Juusola, L., Østgaard, N., Tanskanen, E., Partamies, N., and Snekvik, K. (2011b). Earthward plasma sheet flows during substorm phases: ps flows during substorms. J. Geophys. Res. Space Phys. 116. doi:10.1029/2011JA016852
Kaufmann, R. L., and Paterson, W. R. (2008). Ion heat flux and energy transport near the magnetotail neutral sheet. J. Geophys. Res. Space Phys. 113. doi:10.1029/2007JA012929
Kaufmann, R. L., Paterson, W. R., and Frank, L. A. (2005). Relationships between the ion flow speed, magnetic flux transport rate, and other plasma sheet parameters. J. Geophys. Res. Space Phys. 110. doi:10.1029/2005JA011068
Keiling, A., Wygant, J. R., Cattell, C. A., Mozer, F. S., and Russell, C. T. (2003). The global morphology of wave Poynting flux: powering the aurora. Science 299, 383–386. doi:10.1126/science.1080073
Kissinger, J., McPherron, R. L., Hsu, T., and Angelopoulos, V. (2012). Diversion of plasma due to high pressure in the inner magnetosphere during steady magnetospheric convection. J. Geophys. Res. Space Phys. 117. doi:10.1029/2012JA017579
Lindqvist, P.-A., Olsson, G., Torbert, R. B., King, B., Granoff, M., Rau, D., et al. (2014). The spin-plane double probe electric field instrument for MMS. Space Sci. Rev. 199, 137–165. doi:10.1007/s11214-014-0116-9
Liu, C. M., Fu, H. S., Yu, Y. Q., Lu, H. Y., Liu, W. L., Xu, Y., et al. (2021). Energy flux densities at dipolarization fronts. Geophys. Res. Lett. 48. doi:10.1029/2021GL094932
Liu, J., Angelopoulos, V., Zhou, X., Runov, A., and Yao, Z. (2013). On the role of pressure and flow perturbations around dipolarizing flux bundles. J. Geophys. Res. Space Phys. 118, 7104–7118. doi:10.1002/2013JA019256
Liu, J., Angelopoulos, V., Zhou, X.-Z., and Runov, A. (2014). Magnetic flux transport by dipolarizing flux bundles. J. Geophys. Res. Space Phys. 119, 909–926. doi:10.1002/2013JA019395
Lui, A. T. Y. (2024). Dipolarizing flux bundles and magnetic flux transport. J. Geophys. Res. Space Phys. 129, e2024JA032632. doi:10.1029/2024ja032632
McPherron, R. L., El-Alaoui, M., Walker, R. J., and Richard, R. (2020). Characteristics of reconnection sites and fast flow channels in an mhd simulation. J. Geophys. Res. Space Phys. 125, e2019JA027701. doi:10.1029/2019ja027701
Miyashita, Y., Machida, S., Nosé, M., Liou, K., Saito, Y., and Paterson, W. R. (2012). A statistical study of energy release and transport midway between the magnetic reconnection and initial dipolarization regions in the near-earth magnetotail associated with substorm expansion onsets. J. Geophys. Res. Space Phys. 117. doi:10.1029/2012JA017925
Ohtani, S. (2019). Substorm energy transport from the magnetotail to the nightside ionosphere. J. Geophys. Res. Space Phys. 124, 8669–8684. doi:10.1029/2019JA026964
Perraut, S., Contel, O. L., Roux, A., Pellat, R., Korth, A., Holter, Ø., et al. (2000). Disruption of parallel current at substorm breakup. Geophys. Res. Lett. 27, 4041–4044. doi:10.1029/2000GL000054
Pollock, C., Moore, T., Jacques, A., Burch, J., Gliese, U., Saito, Y., et al. (2016). Fast plasma investigation for magnetospheric multiscale. Space Sci. Rev. 199, 331–406. doi:10.1007/s11214-016-0245-4
Qin, P., Ge, Y., Du, A., Huang, C., Zhang, Y., Luo, H., et al. (2020). Coupling between the magnetospheric dipolarization front and the earth’s ionosphere by ultralow-frequency waves. Astrophysical J. 895, L13. doi:10.3847/2041-8213/ab8e48
Russell, C. T., Anderson, B. J., Baumjohann, W., Bromund, K. R., Dearborn, D., Fischer, D., et al. (2014). The magnetospheric multiscale magnetometers. Space Sci. Rev. 199, 189–256. doi:10.1007/s11214-014-0057-3
Sandhu, J. K., Rae, I. J., Freeman, M. P., Forsyth, C., Gkioulidou, M., Reeves, G. D., et al. (2018). Energization of the ring current by substorms. J. Geophys. Res. Space Phys. 123, 8131–8148. doi:10.1029/2018JA025766
Shiokawa, K., Baumjohann, W., and Haerendel, G. (1997). Braking of high-speed flows in the near-earth tail. Geophys. Res. Lett. 24, 1179–1182. doi:10.1029/97gl01062
Smith, A. W., Rae, I. J., Forsyth, C., Watt, C. E. J., and Murphy, K. R. (2023). Statistical characterization of the dynamic near-earth plasma sheet relative to ultra-low frequency (ulf) wave growth at substorm onset. J. Geophys. Res. Space Phys. 128. doi:10.1029/2022JA030491
Torbert, R. B., Russell, C. T., Magnes, W., Ergun, R. E., Lindqvist, P.-A., LeContel, O., et al. (2014). The FIELDS instrument suite on MMS: scientific objectives, measurements, and data products. Space Sci. Rev. 199, 105–135. doi:10.1007/s11214-014-0109-8
Watanabe, K., Keika, K., Hoshino, M., Kitamura, N., Saito, Y., Giles, B. L., et al. (2019). Statistical study on electron and ion temperatures in the near-earth reconnection and magnetic pileup regions. Geophys. Res. Lett. 46, 14223–14229. doi:10.1029/2019GL084837
Wygant, J. R., Keiling, A., Cattell, C. A., Johnson, M., Lysak, R. L., Temerin, M., et al. (2000). Polar spacecraft based comparisons of intense electric fields and Poynting flux near and within the plasma sheet-tail lobe boundary to uvi images: an energy source for the aurora. J. Geophys. Res. Space Phys. 105, 18675–18692. doi:10.1029/1999JA900500
Keywords: energy transport, plasma sheet, magnetotail, magnetic reconnection, ion flow
Citation: Barik KC and Chaston CC (2025) Energy transport through Earth’s plasma sheet in 3-D. Front. Astron. Space Sci. 11:1481448. doi: 10.3389/fspas.2024.1481448
Received: 15 August 2024; Accepted: 29 November 2024;
Published: 06 January 2025.
Edited by:
Larry Lyons, University of California, Los Angeles, United StatesReviewed by:
Colin Forsyth, University College London, United KingdomJason TenBarge, Princeton University, United States
Copyright © 2025 Barik and Chaston. This is an open-access article distributed under the terms of the Creative Commons Attribution License (CC BY). The use, distribution or reproduction in other forums is permitted, provided the original author(s) and the copyright owner(s) are credited and that the original publication in this journal is cited, in accordance with accepted academic practice. No use, distribution or reproduction is permitted which does not comply with these terms.
*Correspondence: K. C. Barik, a2NiYXJpa0BiZXJrZWxleS5lZHU=