 E. Lawrence1*
 C. D. Beggan1
 G. S. Richardson1
 S. Reay1
 V. Thompson1
 E. Clarke1
 L. Orr1
 J. Hübert1
 A. R. D Smedley2
- 1Geomagnetism, British Geological Survey, Geomagnetism Group, Edinburgh, United Kingdom
- 2Department of Earth and Environmental Sciences, University of Manchester, Manchester, United Kingdom
The “Gannon” geomagnetic storm of 10 −12 May 2024 was the first extreme storm of the solar cycle 25 and the largest storm in more than 20years. The auroral electrojet, driven by a strong negative interplanetary magnetic field exceeding −50nT, moved towards the equator in the evening of the 10th May reaching the latitudes of central and southern England (below 54N) for several hours. Widespread sightings of the aurora were observed across the country, and rapid variations of the magnetic field were recorded in the United ingdom (UK). Here we present the geomagnetic and geoelectric data recorded during the storm in the UK together with models of ground effects and images of auroral displays around the country. We compare the May 2024 storm with geomagnetic data from the September 2017, October 2003, March 1989 as well as September 1859 Carrington event to demonstrate the differences in magnitude, timings and latitudinal extent between these events. We use the geomagnetic observations, and a ground electric field model based on magnetotelluric data combined with the high-voltage power grid network information to estimate geomagnetically induced currents (GICs) at substation level during the storm. The highest modelled GICs exceeded 60 A in substations in southwest and east−central England as well as northern Wales. Substation GICs modelled in higher latitude stations in Scotland exhibited lower values because the leading edge of the auroral oval rapidly moved to lower latitudes. The “Gannon” storm compared to historical storms on a global scale in terms of the aa* index, ranks third since 1868, after March 1989 and September 1941. However locally, the maximum magnetic field rate of change suggests it is closer to a 1−in−30 years event. Hence, there was relatively little impact on grounded technology in the United Kingdom.
1 Introduction
Solar activity in the current solar cycle 25 exceeded prior forecasts, with monthly average sunspot number and F10.7 cm radio flux reaching much higher values than initially predicted (Nandy, 2021). This could indicate the end of the longer-term trend of declining activity observed throughout the last four cycles (McIntosh et al., 2020). In the first 6 months of 2024 the Sun produced more solar flares than observed in a full year during the previous solar maximum in 2014 (according to NOAA SWPC solar flares count1). On 15 October 2024, NOAA and the Solar Cycle Prediction Panel announced the official start of the solar maximum. Activity had started to reach its peak in early May 2024, when a large active region (AR13664) located at the centre of the solar disc just below the equator produced multiple M-class and X-class solar flares, most of which had an associated Earth-directed coronal mass ejection (CME). Spogli et al. (2024) provides a detailed description of the solar activity of May 2024. The combination of up to seven fast CMEs arrived just after 17:00 UT on the 10th May, leading to a significant increase in geomagnetic activity, lasting over 30 h (Hayakawa et al., 2025). The “Gannon” storm (named after Dr. Jennifer Gannon, a leading figure in space weather research, who passed away a week before the event) was the most extreme space weather event since the Halloween storm of October 2003, based on its duration, prolonged periods of high Kp index (Bartels, 1949) and minimum Dst index observed (Gonzalez et al., 1994). The duration and intensity of the storm rapidly pushed the auroral oval to lower latitudes, resulting in beautiful displays of the ‘northern lights’ (aurora borealis) across all of the United Kingdom which popularized the topic of space weather with the general public.
However, space weather poses a potentially serious threat to our technology-dependent society. Geomagnetically induced currents (GICs) flowing in ground-based systems during periods of enhanced geomagnetic activity can cause damage to power grids (Boteler et al., 1989; Pulkkinen et al., 2017; Rodger et al., 2017), railways (Liu et al., 2016; Love et al., 2019; Patterson et al., 2023), oil and gas pipelines (Khanal et al., 2019; Ingham et al., 2022; Oliveira et al., 2024) and potentially submarine cables (Chakraborty et al., 2022; Boteler et al., 2024). Extreme space weather can also disrupt satellite-based navigation by distorting or delaying signal transmission through the ionosphere (Roy and Paul, 2013; Hapgood, 2017; Demyanov and Yasyukevich, 2021). Various impacts of May 2024 storm have been summarized in several studies: Parker and Linares (2024) describes how the perturbations during the event affected satellite trajectories in low Earth orbit; Schennetten et al. (2024) outlines the impacts of the event on radiation fields at aviation altitudes; Aa et al. (2024) and Themens et al. (2024) investigate ionospheric disturbances and storm-enhanced density during the storm at high and mid latitudes; Diaz (2024) shows how the May storm disturbances affected seismic measurements.
After 20 years of predominantly mild geomagnetic conditions, solar cycle 25 has produced an increased frequency of eruptive events on the Sun and will likely cause further geomagnetic storms and, potentially, severe space weather. Therefore, recording information from extreme events, such as the ‘Gannon’ storm, is important for understanding their true impact on both a global and local scale. Continuous observations and further research in solar activity, propagation of CMEs in the solar wind and the resulting space and ground effects are essential in improving forecasting and nowcasting capabilities in order to reduce the impacts of extreme geomagnetic storms in the future.
In Section 2, 3.1, we present a detailed description of the local geomagnetic and geoelectric field during the May 2024 event using available measurements in the United Kingdom (UK). The geoelectric field across the United Kingdom was modelled using magnetotelluric data (Section 3.2) and then used to estimate the GICs in the high-voltage power grid to highlight potential vulnerabilities in the network (Section 4). Section 5 shows the aurora observations across the United Kingdom, indicating the wide spread of the auroral oval during the May storm in fortuitously clear skies. In Section 6 we compare the ‘Gannon’ storm with storm levels dating back to 1868 as well as with selected events in September 2017, October 2003, March 1989 and the Carrington event from September 1859, to examine their differences in severity and ground impacts. Final remarks and discussion points can be found in Section 7.
2 Geomagnetic field
The British Geological Survey (BGS) Geomagnetism group operates three INTERMAGNET-standard magnetic observatories in the United Kingdom - Lerwick (LER) in the Shetland Islands, Eskdalemuir (ESK) in the Southern Uplands of Scotland, and Hartland (HAD) in North Devon. The data are recorded by a number of suspended or non-suspended fluxgate magnetometers, with a sampling rate of 1-s. The observatories also measure absolute strength using Overhauser proton precession magnetometers (GEM Systems GSM-90), with a sampling rate of either 1, 5 or 10 s. Weekly absolute observations ensure baseline control and that high accuracy is maintained (Clarke et al., 2013).
In addition, three new variometer sites equipped with tri-axial fluxgate magnetometers only were set up during the United Kingdom Space Weather Instrumentation, Measurement, Modelling and Risk (SWIMMR) programme. This was a £20 million, 4-year programme which aimed to improve the UK’s capabilities for space weather monitoring and prediction. In 2022, as part of the SWIMMR Activities in Ground Effects (SAGE) project, the BGS installed variometers at sites in Florence Court, Enniskillen [FLO], Market Harborough, Leicestershire [LEI], and Herstmonceux Castle, Sussex [HTX], to measure magnetic field variation with a 1-s cadence. This filled in a spatial ‘gap’ between existing observatories and decreased the distance between observation points to below 200 km. The new sites predominantly improve the East-West extension compared to the North-South coverage offered by the existing United Kingdom observatories. The variometer systems installed are based on the design of the Space Weather Impact on Ground-based Systems (SWIGS) differential magnetometer systems (Hübert et al., 2020). The locations of the current United Kingdom observatories and variometer stations are shown in Figure 1.
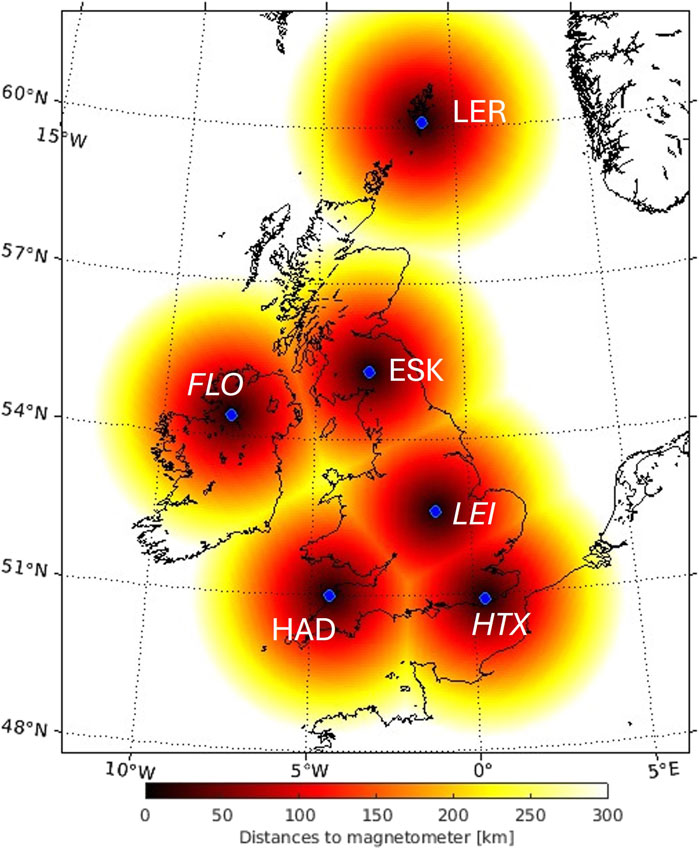
Figure 1. Locations of BGS magnetic observatories (LER, ESK, HAD) and variometer stations (FLO, HTX, LEI). Colors indicate the distance to the closest site.
The northward (Bx), eastward (By) and downward (Bz) ground magnetic field variations measured during the ‘Gannon’ storm are shown in Figures 2–4, respectively. The traces correspond to the six BGS magnetic sites located across the United Kingdom, arranged by descending latitude. To analyze space weather effects, only the external field components are needed and their values at 1-min resolution are plotted. The core and crustal field contributions were removed from each time series to isolate variations caused by magnetospheric and ionospheric currents. The arrival of the CMEs from early May resulted in compression of the magnetopause which lead to a rapid increase in horizontal, mainly northward ground magnetic field. This process is often referred to as a sudden storm commencement (SSC), if followed by enhanced geomagnetic activity, or as a sudden impulse (SI) if no further disturbance occurs (Matsushita, 1962; Araki, 1994). The ‘Gannon’ storm SSC occurred at 17:08 UT on the 10th May, with the strongest ground response of Bx = 320 nT observed at ESK. All remaining United Kingdom magnetic stations measured variations in Bx between 200 nT and 300 nT. The lowest variation associated with the SSC (Bx = 217 nT) was recorded at LER, the highest latitude observatory. The eastward component overall reached much lower values during the SSC, with the highest variation of By = 122 nT also measured at ESK and the smallest By = 48 nT observed at HAD. The vertical component response to the SSC was not as significant, with maximum values reaching between around Bz = 20 nT at ESK and LEI, and up to 90 nT at LER.
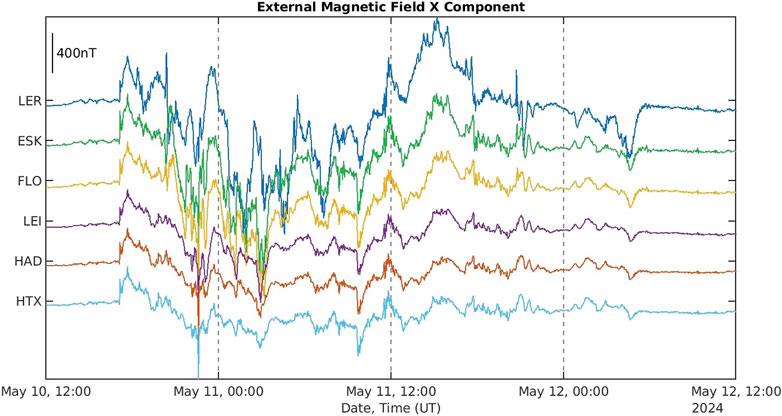
Figure 2. External geomagnetic field measurements (X/Bx component) from six United Kingdom magnetic monitors for 10–12 May 2024.
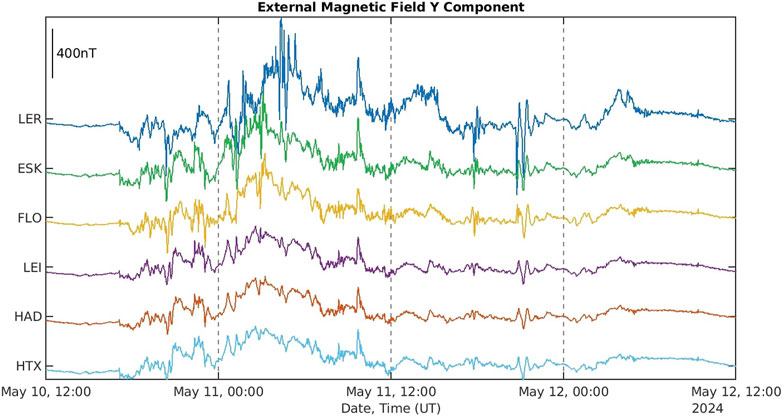
Figure 3. External geomagnetic field measurements (Y/By component) from six United Kingdom magnetic monitors for 10–12 May 2024.
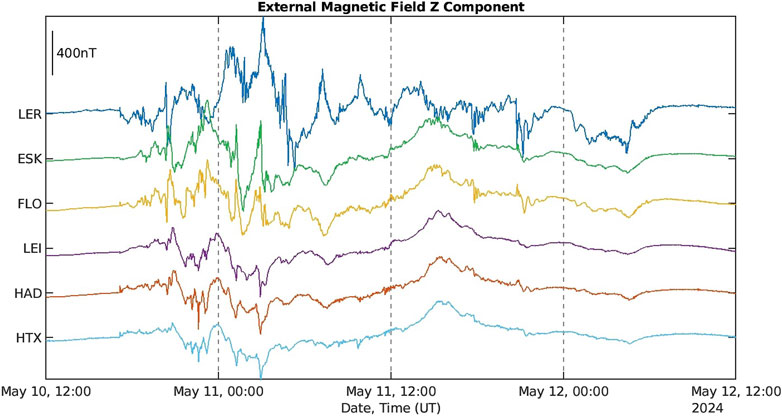
Figure 4. External geomagnetic field measurements (Z/Bz component) from six United Kingdom magnetic monitors for 10–12 May 2024.
A significant decrease in the horizontal magnetic field is typically observed during the main phase of a geomagnetic storm, usually shortly after the SSC, when the disturbance storm time (Dst) index reaches values below −50 nT (Gonzalez et al., 1994). At United Kingdom latitudes the minimum Bx values during the ‘Gannon’ event main phase (after 10 May 19:00 UT) varied between −770 nT and −1,340 nT, with the largest decrease measured at LER (Bx = −1,339 nT) and smallest at HAD (Bx = −775 nT), showing a gradual trend towards less negative values with decreasing latitude. The geomagnetic field remained highly disturbed throughout the 11th May and early morning hours of the 12th May before returning to predominantly quiet levels around 12:00 UT. Another noticeable sharp increase in the horizontal components, up to 65 nT in Bx and 25 nT in By measured at LER, can be observed at 09:20 UT on the 12th which is likely to be an SI response to one of many additional CMEs that arrived during the May 2024 storm.
Rapid fluctuations of the ground magnetic field during severe space weather events can be observed not only in the horizontal components but also in declination - the angle between True North and the field vector on the horizontal plane, measured positive eastward. Figure 5 shows how the ‘Gannon’ storm affected the compass variations at the three United Kingdom observatories. The largest deviation from True North, reaching almost 4
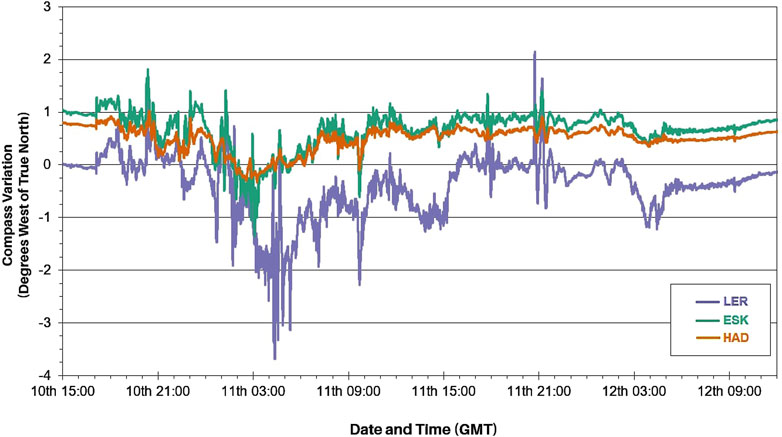
Figure 5. Compass variation for LER (blue), ESK (green) and HAD (orange) during 10–12 May 2024, given in degrees West of True North.
3 Geoelectric field
3.1 Measurements
BGS operates ground electric field monitoring systems at the three magnetic observatories in the United Kingdom. These measure the changing electric field generated at the Earth’s surface (Beggan et al., 2021). Electric field data are recorded at 10 Hz along East-West and North-South electrode lines. The measurements for the May 2024 storm are shown in Figure 6. Unfortunately, the ESK site was affected by lightning the week before the May storm, damaging the electronics on the recording equipment of the electric field sensors. Therefore, ESK electric field data were not recorded during the event. The temporary loss of the electric field monitoring during such an extreme space weather event was disappointing and may have been a valuable data point in extreme value analysis and worst-case scenario studies, for example.
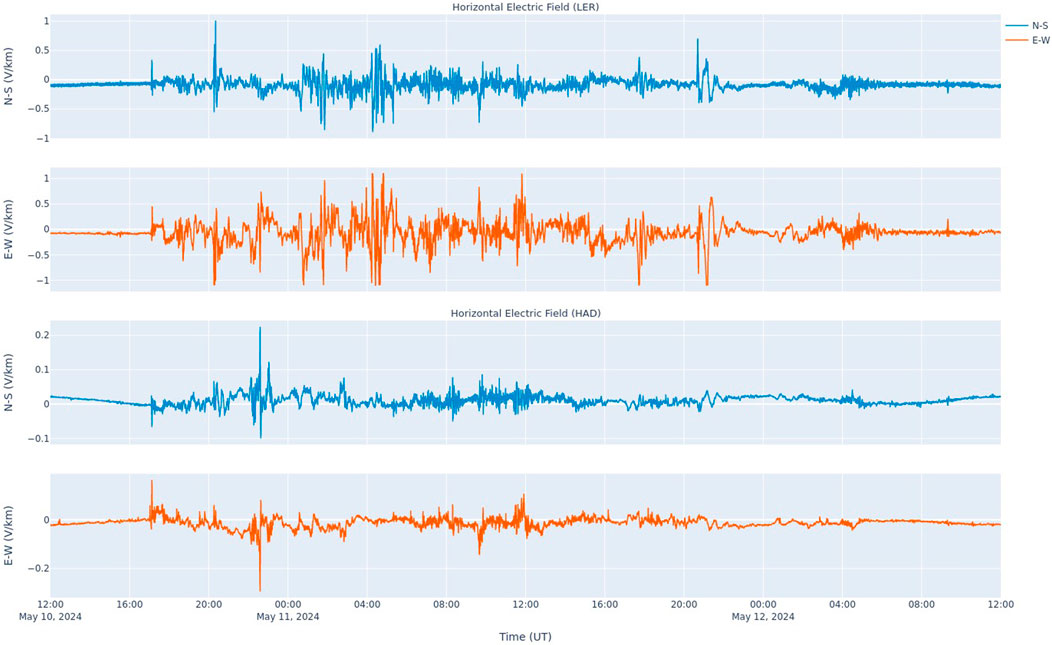
Figure 6. Horizontal electric field data for LER (top) and HAD (bottom) during 10–12 May 2024. North-South component plotted in blue, East-West component plotted in orange, units V/km.
Both northward and eastward geoelectric fields measured at the other sites (LER and HAD) show a distinct response to the SSC at 17:08 UT on the 10th May, reaching 0.24 V/km and 0.44 V/km at LER, and 0.06 V/km and 0.13 V/km at HAD, respectively. The electric field remained disturbed during the evening of the 10th and all day on the 11th May before gradually declining to ambient levels in the morning on the 12th, clearly following the storm variations seen in the magnetic field. Measurements from HAD show noticeable peaks of 0.21 V/km in the northward, and 0.28 V/km in the eastward field at 22:36 UT on the 10th May. Disturbances at LER were more regular; however there is one distinctive peak of over 1 V/km in the North-South component at 20:20 UT on the 10th. The East-West field reached over 1 V/km on multiple occasions throughout the main phase of the storm. Slightly higher values in the East-West orientation correspond to the overall larger variations in the horizontal magnetic field observed during the storm. The brief and sharp SI variation seen in the magnetic field at 09:20 UT on the 12th was also observed in the electric field measurements, particularly at LER, reaching over 0.20 V/km.
3.2 Modelling
Electric field variations during geomagnetic storm times differ greatly across the country due to, not only the magnetic field variations, but importantly, also the electrical conductivity of the subsurface. The electrical conductivity of rocks at depth can be inferred with the magnetotelluric (MT) method. MT measurements comprise of simultaneous recordings of the horizontal magnetic and electric field variations. In the United Kingdom, long-period MT data have been collected in the past years to improve the geoelectric field model needed for space weather ground impact studies (Hübert et al., 2024c). The modelling approach follows the methodology described in Kelbert et al. (2017); Campanyà et al. (2019); Malone-Leigh et al. (2023); Hübert et al. (2024a).
Using the MT data at 70 sites across the country and spherical elementary current system analysis (Amm, 1997; McLay and Beggan, 2010) to interpolate the magnetic field variations every minute based on the United Kingdom geomagnetic observatories and variometer sites, the geoelectric field variations during the ‘Gannon’ storm were modelled. Figure 7 shows the interpolated geoelectric field in N-S (Ex) and E-W (Ey) direction based on the convolution of MT transfer functions with the interpolated geomagnetic field at the peak of the storm 10 May 2024 22:36 UT, when the total geoelectric field estimated across Britain reached its maximum value. The highest amplitudes for the geoelectric field (
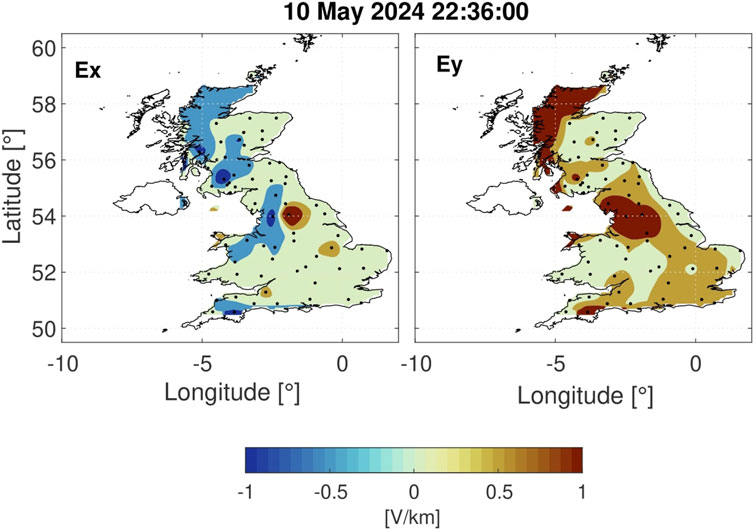
Figure 7. Modelled horizontal electric fields in the United Kingdom (Ex = North-South, Ey = East-West) during the main phase of the May 2024 storm (10 May 2024 22:36 UT) derived from long-period MT data. The dots on the Ex and Ey maps indicate the MT site locations.
4 Geomagnetically induced currents (GIC)
Rapid variations in the magnetic field, particularly during severe space weather events, induce electric fields in the conductive subsurface which generate quasi-steady direct currents known as geomagnetically induced currents (GICs) (Thomson et al., 2005). The induced currents can flow through low-resistance grounded infrastructure such as the high-voltage power transmission network (Pirjola, 1985), gas pipelines (Pulkkinen et al., 2001) and railways (Patterson et al., 2024), causing damage via overheating and even harmonic disturbances (Rodger et al., 2020; Clilverd et al., 2020). GICs in the United Kingdom high-voltage power grid are computed based on a representation of the network topology provided by the Electricity Ten Year Statement (ETYS) 2022. The network model consists of over 430 substations with approximately 1,300 connections for the 400 and 275 kV electrical networks across the whole of the United Kingdom and the 132 kV network in Scotland, and 2044 transformer windings (Kelly et al., 2017). Using the modelled electric field values, described in the previous section, the size of GIC flowing through each substation in that power network can then be estimated during the geomagnetic storm. The assumptions of the model and validation are discussed in Hübert et al. (2024b) who validated the grid model using the differential magnetometer method (DMM) and demonstrated that knowledge of the geoelectric field is the major limiting factor at the present time. The geoelectric field used to compute GIC is not uniform in this simulation, as we use the MT transfer functions from 70 sites in Britain to build up a measurement-based map of the geoelectric field (Figure 7).
The estimated maximum absolute GIC values at each substation (
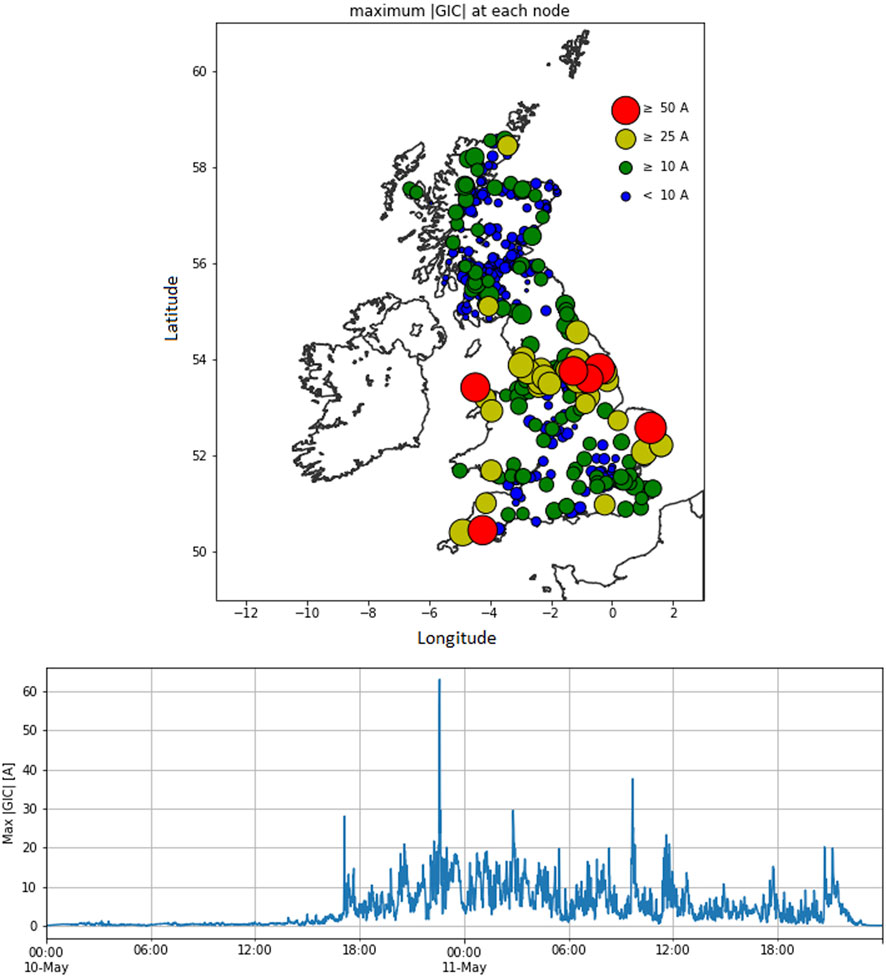
Figure 8. Top: Modelled maximum
GIC measurements are only available from a few substations in Scotland, but the validity of the GIC model was previously provided by the comparison with line GIC measurements (Thomson et al., 2005; Hübert et al., 2020). There are, at present, no GIC measurements in England and Wales. This inhibits our capability to fully validate the modelled results during the May 2024 storm. The lack of GIC measurements at substations is a limitation and will be addressed in future years; this aspect of the modelling should improve when more data are available to compare with (e.g., Mac Manus et al., 2022).
5 Auroral observations
During periods of enhanced solar activity, electrically charged particles within the solar wind collide with the magnetosphere and travel along the magnetic field lines down to the magnetic poles, where they interact with atoms in the Earth’s atmosphere. The collisions and interactions between solar particles and atmospheric molecules result in excitation (heating) which causes them to glow with different colours depending on the molecular species. This phenomenon is commonly known as the northern lights or aurora borealis (when observed in the northern hemisphere). Although auroral displays are usually concentrated around the polar regions, they can sometimes be seen at lower latitudes when geomagnetic activity is significantly elevated. The best chances for aurora observations are during severe geomagnetic storms, such as the ‘Gannon’ 2024 event (Hayakawa et al., 2025). Thanks to the various aurora alert services available around the world, including the BGS aurora alert predictions for the United Kingdom issued on the afternoon of the 9th May2, millions of people had the opportunity to observe and photograph the auroral displays during the May storm. The Skywarden catalogue3 contains over 180 observations recorded across a wide range of latitudes, between 30
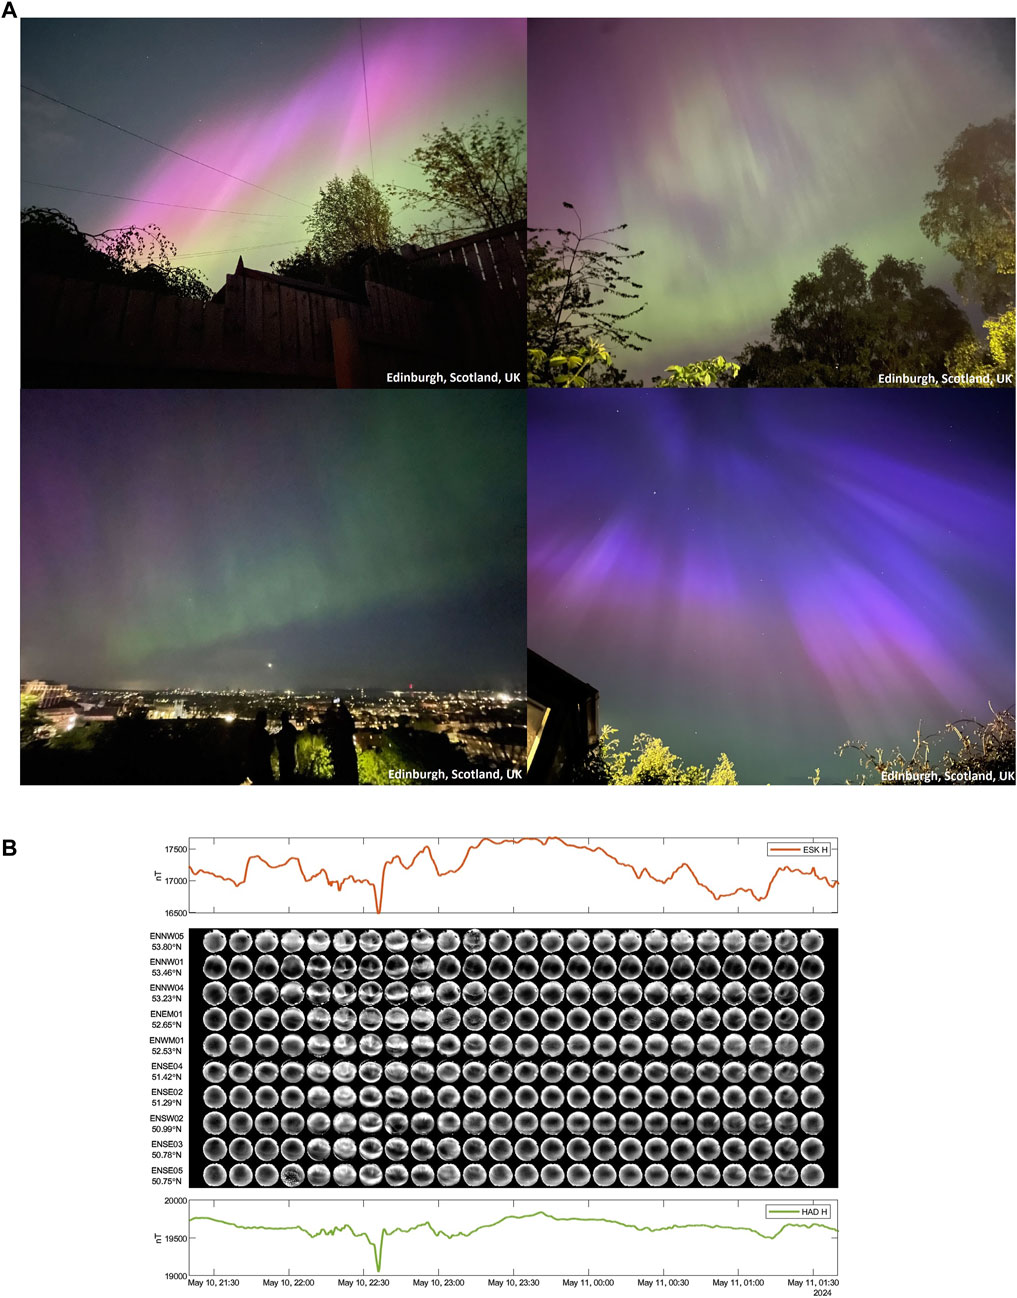
Figure 9. (A) Photos of the northern lights on 10–11 May 2024 provided by BGS colleagues. Credit: Natalia Gomez-Perez (top left), Victoria Thompson (top right, bottom left), Chris Turbitt (bottom right). (B) SCAMP-FRIPON 10-min images from meteorite cameras captured at Alston (top row) in order of descending latitude to Cowes (bottom row) from 21:30 to 01:30 UT on the 10–11 May 2024 showing the rapid expansion of the auroral oval. The time series show the Eskdalemuir (upper) and Hartland (lower) geomagnetic observations of the horizontal component with 1-s cadence.
The System for Capture of Asteroid and Meteorite Paths (SCAMP) United Kingdom, part of the FRIPON network (Colas et al., 2020) consisting of 17 cameras located across England and Wales between 54.7
6 Extreme storms comparison
Analysis of previous severe space weather events can help understand how different features of a geomagnetic storm (such as its solar origin, timing of commencement, main phase duration) can result in varied level of impact on ground-based infrastructure. Lessons learned from past events help further develop efficient forecasting and nowcasting systems and improve current mitigation strategies employed by industry. In this section we present a comparison, locally in the United Kingdom, between the May 2024 storm and other extensively studied events: September 2017 (Dimmock et al., 2019; Piersanti et al., 2019; Alfonsi et al., 2021), October 2003 (Pulkkinen et al., 2005; Thomson et al., 2005; Xue et al., 2023), March 1989 (Allen et al., 1989; Shirochkov et al., 2015; Boteler, 2019; Love et al., 2022), as well as the Carrington storm of September 1859 (Tsurutani et al., 2003; Giegengack, 2015; Hayakawa et al., 2023; Beggan et al., 2024; Thomas et al., 2024). We also present the overall storm ranking on a global scale in terms of the aa* index, dating back to 1868.
6.1 Geomagnetic aa and aa* index
The K index is a measure of disturbance in the horizontal magnetic field component over a 3-h interval, ranging from 0 to 9, with 4 or less being quiet and 5 or more indicating a storm (Bartels et al., 1939). The 3-hourly aa index is derived from the K indices from two approximately antipodal observatories and has units of nT (Mayaud, 1972; Mayaud, 1980). Over the years, to ensure data quality and continuity, the observatories used in the index derivation, were replaced with new observatories. These often operated concurrently to minimize any non-homogeneity of the time series (Clilverd et al., 2002). At present, the observatories are Hartland in the United Kingdom, operated by the BGS, and Canberra in Australia, operated by Geoscience Australia. The index extends further back in time (to 1868) than any other planetary index time series. The aa indices are estimated in real-time by BGS with final values available weekly following the publication of the Canberra K indices. Definitive aa are published by the International Service for Geomagnetic Indices (ISGI)4, a service of the International Association of Geomagnetism and Aeronomy (IAGA). The aa indices for each geomagnetic storm are presented in Figure 10. Note that values for 2024 are still provisional at the time of writing, though will not change significantly. The aa index usually follows the same pattern as the K index, however it shows more variation throughout each storm since it is not restricted to a specific maximum value. Therefore, different peak aa indices can be observed depending on the level of geomagnetic disturbance of each event, which arguably serves as a better indicator of space weather severity. However, unlike ap, the aa index is limited as a true planetary activity measure, as it is based on only two positions on the Earth’s surface. For statistical studies and to estimate global levels, this can be overcome by computing eight-point running means to generate 24-h average values of aa, denoted aa*, while retaining the same 3-h resolution (Clilverd et al., 2002).
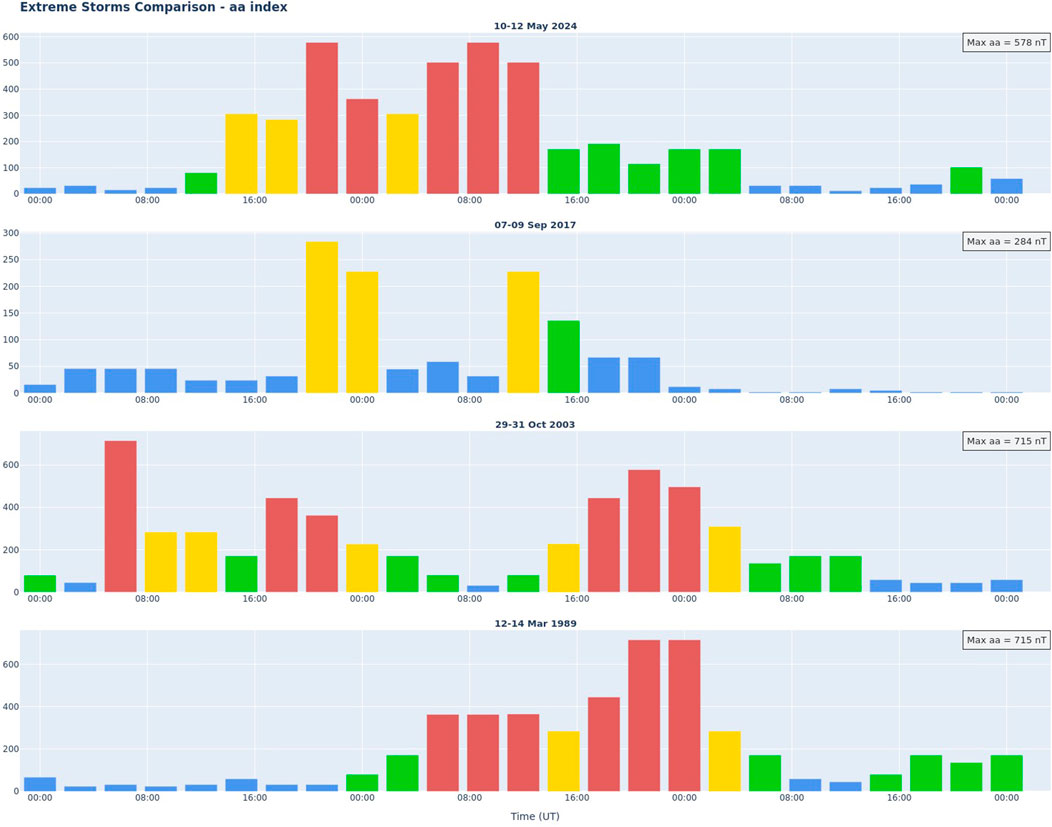
Figure 10. The aa index values for each extreme event. Storm levels are indicated as follows: blue aa
In the afternoon (all times are provided in UT) of the 10 May 2024 the aa index gradually increased to storm levels (
The aa* geomagnetic index is computed back to 1868 and used to identify the most extreme events. Figure 11 shows the index values for any events that exceeded 80 nT throughout the entire aa* time series. Three most extreme storms are highlighted in red, all of which reached over 400 nT. In comparison with other historical events, the ‘Gannon’ 2024 storm ranks third (403 nT) in terms of the aa* index, after March 1989 (442 nT) and September 1941 (429 nT). Note that the Carrington 1859 storm cannot be included as it predates the start of the aa and aa* time series.
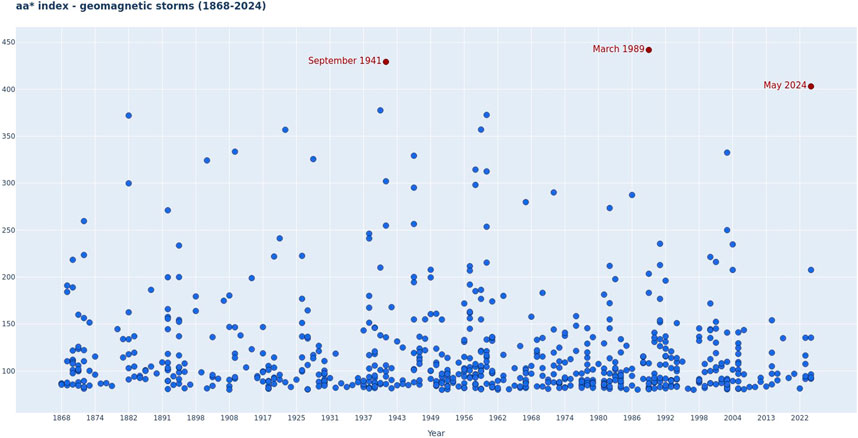
Figure 11. The aa* index values showing extreme geomagnetic storms (aa*
6.2 Horizontal magnetic field variation
The horizontal magnetic field intensity variation
where
Figure 12 shows the calculated rate of change of the external
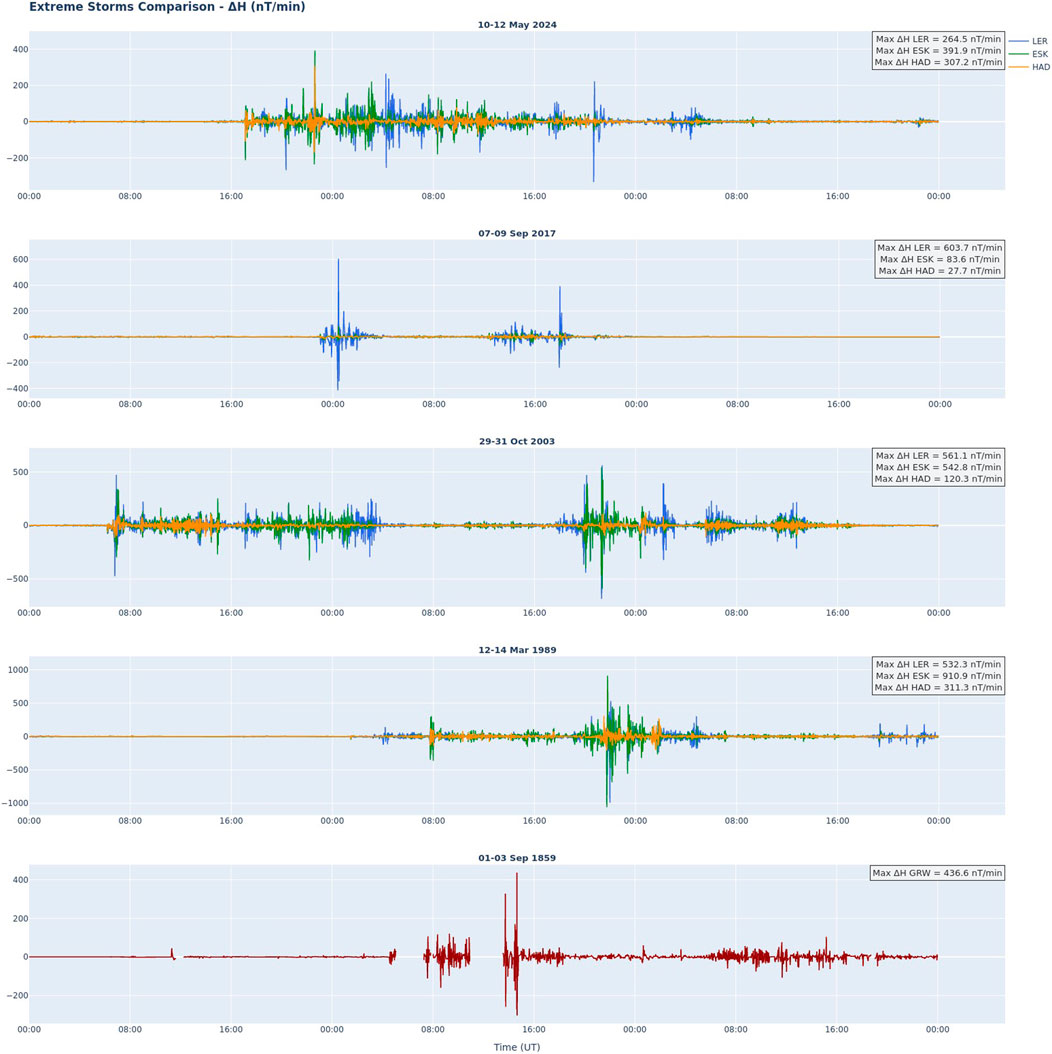
Figure 12. Horizontal field rate of change
The geomagnetic storms of May 2024 and March 1989 are similar in terms of duration and morphology, both lasting more than 30 h with continuous progression and largest disturbances observed during the main phase. The September 2017 and Halloween 2003 events include two distinct enhancements in geomagnetic activity, several hours apart, with strong variations seen in the early stages of each storm. Higher latitudes tend to be more susceptible to space weather effects due to the expansion of the auroral oval and substorm occurrence (Skone and De Jong, 2000; Pirjola, 2005). The analysis of the geographical latitudinal differences (for United Kingdom observatories, around 10
There remain large uncertainties regarding the fidelity and quality of GRW data during the Carrington event due to the unknown response of the historic instrumentation compared to modern sensors. There are also long gaps throughout the main phase of the storm where the field intensity was off the scale of the chart. The horizontal field at GRW shows a sharp response to the solar flare around 11:15 UT on the 1st September, followed by a clear SSC in the morning of the 2nd September. It is important to note that it is not possible to determine the true maximum
7 Discussion and summary
Geomagnetic field measurements from the three United Kingdom geomagnetic observatories and three variometers sites indicate a clear SSC at 17:08 UT on 10 May 2024. Magnetic field values show a strong, long-lasting response to the main phase of the ‘Gannon’ storm before gradual return to quiet activity levels around 12:00 UT on the 12th May, over 30 h after the shock arrival. The geoelectric field data from two available monitors also follows a similar pattern, reaching maximum values in the early stages of the storm progression on the 10th May, at 22:36 UT. Modelled electric fields across the United Kingdom, based on the MT measurements and transfer functions, also show the strongest response at that time, with the most extreme values estimated in the northwest of Scotland and northern England, and higher variations observed in the East-West component.
Based on the real-time magnetic field measurements and the modelled geoelectric fields, GICs flowing in the United Kingdom high-voltage power network during the ‘Gannon’ event were estimated. Peak GIC values were observed in long transmission lines and corner nodes, usually situated at coast lines. Several substations in southwest and east-central England, as well as northern Wales showed GICs exceeding 60 A, with largest value of 63 A at a substation near Norwich (East coast of England). Since the leading edge of the auroral oval moved quickly to lower latitudes, GICs in the Scottish part of the network (above 55
The comparison, locally in the United Kingdom, with previous extreme events, namely, September 2017, October 2003, March 1989 and September 1859 storms, shows how diverse a storm progression can be, and how different aspects of storm morphology can result in varied impacts. Globally, the ‘Gannon’ event ranks third in severity since 1868, based solely on the aa* index, and was more in line with a 1-in-30 years storm based on rate of change of the magnetic field. Analysis of other indices suggests that its magnitude puts it closer to a 1-in-12.5 years event, and a 1-in-41 years event based on duration (Elvidge and Themens, 2025). However, the magnetic field rate of change was not sufficiently large or rapid to cause any reported issues or damage to technical infrastructure in the United Kingdom.
Data availability statement
The raw data supporting the conclusions of this article will be made available by the authors, without undue reservation.
Author contributions
EL: Data curation, Investigation, Visualization, Writing–original draft, Writing–review and editing. CB: Data curation, Investigation, Visualization, Writing–original draft, Writing–review and editing. GR: Data curation, Methodology, Visualization, Writing–review and editing Writing-original draft, Software. SR: Data curation, Investigation, Visualization, Writing–review and editing. VT: Data curation, Visualization, Writing–review and editing. EC: Data curation, Investigation, Methodology, Writing–review and editing. LO: Data curation, Visualization, Writing–review and editing. JH: Data curation, Investigation, Methodology, Software, Visualization, Writing–original draft, Writing–review and editing. AS: Visualization, Writing–review and editing, Data curation.
Funding
The author(s) declare that financial support was received for the research, authorship, and/or publication of this article. The United Kingdom variometers were funded through the NERC SWIMMR SAGE project under grant NE/V002694/1. The United Kingdom Fireball Alliance meteor camera observatory was supported by the Science and Technology Facilities Council (grant ST/Y004817/1).
Acknowledgments
We thank the hosts of the Alston, Manchester, Jodrell Bank, Leicester Space Park, Longville-in-the-Dale, Royal Holloway, Canterbury, Eastbourne and Cowes stations for their assistance and their continued support. We thank our BGS colleagues (Chris Turbitt and Natalia Gomez-Perez) for the aurora photographs around Edinburgh, Scotland. We also thank the three reviewers for their constructive comments. This paper is published with the permission of the Director of the British Geological Survey (UKRI). The aa index results rely on geomagnetic indices calculated and made available by ISGI Collaborating Institutes from data collected at magnetic observatories. We thank the involved national institutes, the INTERMAGNET network (https://www.intermagnet.org) and ISGI (isgi.unistra.fr). The meteor camera images used were obtained and made available by the FRIPON network (https://www.fripon.org) with support from Service Informatique de l’OSU Institut Pythéas (Aix-Marseille Université/CNRS).
Conflict of interest
The authors declare that the research was conducted in the absence of any commercial or financial relationships that could be construed as a potential conflict of interest.
The handling editor Walach declared a past co-authorship with the author LO.
Generative AI statement
The author(s) declare that no Generative AI was used in the creation of this manuscript.
Publisher’s note
All claims expressed in this article are solely those of the authors and do not necessarily represent those of their affiliated organizations, or those of the publisher, the editors and the reviewers. Any product that may be evaluated in this article, or claim that may be made by its manufacturer, is not guaranteed or endorsed by the publisher.
Footnotes
1https://www.spaceweatherlive.com/en/solar-activity/solar-cycle.html
2https://geomag.bgs.ac.uk/data_service/space_weather/alerts/alert_2024-05-09.html
References
Aa, E., Zhang, S.-R., Lei, J., Huang, F., Erickson, P. J., Coster, A. J., et al. (2024). Significant midlatitude plasma density peaks and dual-hemisphere SED during the 10–11 May 2024 super geomagnetic storm. J. Geophys. Res. Space Phys. 129, e2024JA033360. doi:10.1029/2024ja033360
Alfonsi, L., Cesaroni, C., Spogli, L., Regi, M., Paul, A., Ray, S., et al. (2021). Ionospheric disturbances over the Indian sector during 8 September 2017 geomagnetic storm: plasma structuring and propagation. Space weather. 19, e2020SW002607. doi:10.1029/2020sw002607
Allen, J., Sauer, H., Frank, L., and Reiff, P. (1989). Effects of the March 1989 solar activity. Eos, Trans. Am. Geophys. Union 70, 1479–1488. doi:10.1029/89eo00409
Amm, O. (1997). Ionospheric elementary current systems in spherical coordinates and their application. J. geomagnetism Geoelectr. 49, 947–955. doi:10.5636/jgg.49.947
Araki, T. (1994). A physical model of the geomagnetic sudden commencement. Geophys. Monograph-American Geophys. Union 81, 183.
Bartels, J., Heck, N., and Johnston, H. (1939). The three-hour-range index measuring geomagnetic activity. Terr. Magnetism Atmos. Electr. 44, 411–454. doi:10.1029/te044i004p00411
Beggan, C., Clarke, E., Lawrence, E., Eaton, E., Williamson, J., Matsumoto, K., et al. (2024). Digitized continuous magnetic recordings for the August/September 1859 storms from London, UK. Space weather. 22, e2023SW003807. doi:10.1029/2023sw003807
Beggan, C. D., Richardson, G. S., Baillie, O., Hübert, J., and Thomson, A. W. P. (2021). Geolectric field measurement, modelling and validation during geomagnetic storms in the UK. J. Space Weather Space Clim. 11, 37. doi:10.1051/swsc/2021022
Bolduc, L. (2002). GIC observations and studies in the Hydro-Québec power system. J. Atmos. solar-terrestrial Phys. 64, 1793–1802. doi:10.1016/s1364-6826(02)00128-1
Boteler, D., Shier, R., Watanabe, T., and Horita, R. (1989). Effects of geomagnetically induced currents in the BC Hydro 500 kV system. IEEE Trans. Power Deliv. 4, 818–823. doi:10.1109/61.19275
Boteler, D. H. (2019). A 21st century view of the March 1989 magnetic storm. Space weather. 17, 1427–1441. doi:10.1029/2019sw002278
Boteler, D. H., Chakraborty, S., Shi, X., Hartinger, M. D., and Wang, X. (2024). An examination of geomagnetic induction in submarine cables. Space weather. 22, e2023SW003687. doi:10.1029/2023sw003687
Campanyà, J., Gallagher, P., Blake, S., Gibbs, M., Jackson, D., Beggan, C., et al. (2019). Modeling geoelectric fields in Ireland and the UK for space weather applications. Space weather. 17, 216–237. doi:10.1029/2018sw001999
Chakraborty, S., Boteler, D. H., Shi, X., Murphy, B. S., Hartinger, M. D., Wang, X., et al. (2022). Modeling geomagnetic induction in submarine cables. Front. Phys. 10, 1022475. doi:10.3389/fphy.2022.1022475
Clarke, E., Baillie, O., J. Reay, S., and Turbitt, C. W. (2013). A method for the near real-time production of quasi-definitive magnetic observatory data. Earth, Planets Space 65, 1363–1374. doi:10.5047/eps.2013.10.001
Clilverd, M. A., Clark, T. D. G., Clarke, E., Henry, R., and Thomas, U. (2002). The causes of long-term change in the aa index. J. Geophys. Res. 107, 1441–1447. doi:10.1029/2001JA000501
Clilverd, M. A., Rodger, C. J., Brundell, J. B., Dalzell, M., Martin, I., Mac Manus, D. H., et al. (2020). Geomagnetically induced currents and harmonic distortion: high time resolution case studies. Space weather. 18, e2020SW002594. doi:10.1029/2020sw002594
Colas, F., Zanda, B., Bouley, S., Jeanne, S., Malgoyre, A., Birlan, M., et al. (2020). Fripon: a worldwide network to track incoming meteoroids. Astronomy and Astrophysics 644, A53. doi:10.1051/0004-6361/202038649
Demyanov, V., and Yasyukevich, Y. V. (2021). Space weather: risk factors for global navigation satellite systems. Solar-Terrestrial Phys. 7, 28–47. doi:10.12737/stp-72202104
Diaz, J. (2024). Monitoring May 2024 solar and geomagnetic storm using broadband seismometers. Sci. Rep. 14, 30066–30113. doi:10.1038/s41598-024-81079-6
Dimmock, A. P., Rosenqvist, L., Hall, J.-O., Viljanen, A., Yordanova, E., Honkonen, I., et al. (2019). The GIC and geomagnetic response over Fennoscandia to the 7–8 September 2017 geomagnetic storm. Space weather. 17, 989–1010. doi:10.1029/2018sw002132
Elvidge, S., and Themens, D. R. (2025). The probability of the May 2024 geomagnetic superstorm. Space weather. 23, e2024SW004113. doi:10.1029/2024sw004113
Fiori, R., Boteler, D. H., and Gillies, D. M. (2014). Assessment of GIC risk due to geomagnetic sudden commencements and identification of the current systems responsible. Space weather. 12, 76–91. doi:10.1002/2013sw000967
Giegengack, R. (2015). The Carrington coronal mass ejection of 1859. Proc. Am. Philosophical Soc. 159 (4), 421–433.
Gonzalez, W., Joselyn, J.-A., Kamide, Y., Kroehl, H. W., Rostoker, G., Tsurutani, B., et al. (1994). What is a geomagnetic storm? J. Geophys. Res. Space Phys. 99, 5771–5792. doi:10.1029/93ja02867
Hapgood, M. (2017). Satellite navigation—amazing technology but insidious risk: why everyone needs to understand space weather. Space weather. 15, 545–548. doi:10.1002/2017sw001638
Hayakawa, H., Bechet, S., Clette, F., Hudson, H. S., Maehara, H., Namekata, K., et al. (2023). Magnitude estimates for the Carrington flare in 1859 September: as seen from the original records. Astrophysical J. Lett. 954, L3. doi:10.3847/2041-8213/acd853
Hayakawa, H., Ebihara, Y., Mishev, A., Koldobskiy, S., Kusano, K., Bechet, S., et al. (2025). The solar and geomagnetic storms in 2024 May: a flash data report. Astrophysical J. 979, 49. doi:10.3847/1538-4357/ad9335
Hubert, J., Beggan, C., Richardson, G., Eaton, E., Orr, L., Kiyan, D., et al. (2024a). A new geoelectric field model for the UK based on long-period magnetotelluric data to assess and forecast ground-based space weather effects. Vienna, Austria: EGU General Assembly. doi:10.5194/egusphere-egu24-20497
Hübert, J., Beggan, C., Richardson, G., Gomez-Perez, N., Collins, A., and Thomson, A. (2024b). Validating a UK geomagnetically induced current model using differential magnetometer measurements. Space weather. 22, e2023SW003769. doi:10.1029/2023sw003769
Hübert, J., Beggan, C. D., Richardson, G. S., Martyn, T., and Thomson, A. W. P. (2020). Differential Magnetometer Measurements of geomagnetically induced currents in a complex high voltage network. Space weather. 18, e2019SW002421. doi:10.1029/2019SW002421
Hübert, J., Eaton, E., and Beggan, C. (2024c). Developing a new ground electric field model for the UK based on long-period magnetotelluric data for the SWIMMR N4 (SAGE) framework. Tech. Rep.
Ingham, M., Divett, T., Rodger, C., and Sigley, M. (2022). Impacts of GIC on the New Zealand gas pipeline network. Space weather. 20, e2022SW003298. doi:10.1029/2022sw003298
Kelbert, A., Balch, C. C., Pulkkinen, A., Egbert, G. D., Love, J. J., Rigler, E. J., et al. (2017). Methodology for time-domain estimation of storm time geoelectric fields using the 3-D magnetotelluric response tensors. Space weather. 15, 874–894. doi:10.1002/2017sw001594
Kelly, G. S., Viljanen, A., Beggan, C. D., and Thomson, A. W. P. (2017). Understanding GIC in the UK and French high-voltage transmission systems during severe magnetic storms. Space weather. 15, 99–114. doi:10.1002/2016SW001469
Khanal, K., Adhikari, B., Chapagain, N. P., and Bhattarai, B. (2019). HILDCAA-related GIC and possible corrosion hazard in underground pipelines: a comparison based on wavelet transform. Space weather. 17, 238–251. doi:10.1029/2018sw001879
Liu, L., Ge, X., Zong, W., Zhou, Y., and Liu, M. (2016). Analysis of the monitoring data of geomagnetic storm interference in the electrification system of a high-speed railway. Space weather. 14, 754–763. doi:10.1002/2016sw001411
Love, J. J., Hayakawa, H., and Cliver, E. W. (2019). Intensity and impact of the New York railroad superstorm of may 1921. Space weather. 17, 1281–1292. doi:10.1029/2019sw002250
Love, J. J., Lucas, G. M., Rigler, E. J., Murphy, B. S., Kelbert, A., and Bedrosian, P. A. (2022). Mapping a magnetic superstorm: March 1989 geoelectric hazards and impacts on United States power systems. Space weather. 20, e2021SW003030. doi:10.1029/2021sw003030
Mac Manus, D. H., Rodger, C. J., Ingham, M., Clilverd, M. A., Dalzell, M., Divett, T., et al. (2022). Geomagnetically induced current model in New Zealand across multiple disturbances: validation and extension to non-monitored transformers. Space weather. 20, e2021SW002955. doi:10.1029/2021SW002955
Malone-Leigh, J., Campanyà, J., Gallagher, P. T., Neukirch, M., Hogg, C., and Hodgson, J. (2023). Nowcasting geoelectric fields in Ireland using magnetotelluric transfer functions. J. Space Weather Space Clim. 13 (6), 6. doi:10.1051/swsc/2023004
Matsushita, S. (1962). On geomagnetic sudden commencements, sudden impulses, and storm durations. J. Geophys. Res. 67, 3753–3777. doi:10.1029/jz067i010p03753
Mayaud, P.-N. (1972). The aa indices: a 100-year series characterizing the magnetic activity. J. Geophys. Res. 77, 6870–6874. doi:10.1029/ja077i034p06870
Mayaud, P.-N. (1980). Derivation, meaning, and use of geomagnetic indices, 22. Wiley Online Library.
McIntosh, S. W., Chapman, S., Leamon, R. J., Egeland, R., and Watkins, N. W. (2020). Overlapping magnetic activity cycles and the sunspot number: forecasting sunspot cycle 25 amplitude. Sol. Phys. 295, 163. doi:10.1007/s11207-020-01723-y
McLay, S., and Beggan, C. (2010). Interpolation of externally-caused magnetic fields over large sparse arrays using Spherical Elementary Current Systems. Ann. Geophys. 28, 1795–1805. doi:10.5194/angeo-28-1795-2010
Nandy, D. (2021). Progress in solar cycle predictions: sunspot cycles 24–25 in perspective. Sol. Phys. 296, 54. doi:10.1007/s11207-021-01797-2
Oliveira, D. M., Zesta, E., and Vidal-Luengo, S. (2024). First direct observations of interplanetary shock impact angle effects on actual geomagnetically induced currents: the case of the Finnish natural gas pipeline system. arXiv Prepr. arXiv:2405.04647 11. doi:10.3389/fspas.2024.1392697
Parker, W. E., and Linares, R. (2024). Satellite drag analysis during the May 2024 geomagnetic storm.
Patterson, C., Wild, J., and Boteler, D. (2023). Modeling the impact of geomagnetically induced currents on electrified railway signaling systems in the United Kingdom. Space weather. 21. doi:10.1029/2022sw003385
Patterson, C. J., Wild, J. A., Beggan, C. D., Richardson, G. S., and Boteler, D. H. (2024). Modelling electrified railway signalling misoperations during extreme space weather events in the UK. Sci. Rep. 14, 1583. doi:10.1038/s41598-024-51390-3
Piersanti, M., Di Matteo, S., Carter, B., Currie, J., and D’Angelo, G. (2019). Geoelectric field evaluation during the September 2017 geomagnetic storm: MA. I. GIC. model. Space weather. 17, 1241–1256. doi:10.1029/2019sw002202
Pirjola, R. (1985). On currents induced in power transmission systems during geomagnetic variations. IEEE Trans. Power Apparatus Syst. 2825–2831. doi:10.1109/tpas.1985.319126
Pirjola, R. (2005). Effects of space weather on high-latitude ground systems. Adv. Space Res. 36, 2231–2240. doi:10.1016/j.asr.2003.04.074
Pulkkinen, A., Bernabeu, E., Thomson, A., Viljanen, A., Pirjola, R., Boteler, D., et al. (2017). Geomagnetically induced currents: Science, engineering, and applications readiness. Space weather. 15, 828–856. doi:10.1002/2016sw001501
Pulkkinen, A., Lindahl, S., Viljanen, A., and Pirjola, R. (2005). Geomagnetic storm of 29–31 October 2003: geomagnetically induced currents and their relation to problems in the Swedish high-voltage power transmission system. Space weather. 3. doi:10.1029/2004sw000123
Pulkkinen, A., Viljanen, A., Pajunpää, K., and Pirjola, R. (2001). Recordings and occurrence of geomagnetically induced currents in the Finnish natural gas pipeline network. J. Appl. Geophys. 48, 219–231. doi:10.1016/s0926-9851(01)00108-2
Rodger, C. J., Clilverd, M. A., Mac Manus, D. H., Martin, I., Dalzell, M., Brundell, J. B., et al. (2020). Geomagnetically induced currents and harmonic distortion: storm-time observations from New Zealand. Space weather. 18, e2019SW002387. doi:10.1029/2019sw002387
Rodger, C. J., Mac Manus, D. H., Dalzell, M., Thomson, A. W., Clarke, E., Petersen, T., et al. (2017). Long-term geomagnetically induced current observations from New Zealand: peak current estimates for extreme geomagnetic storms. Space weather. 15, 1447–1460. doi:10.1002/2017sw001691
Roy, B., and Paul, A. (2013). Impact of space weather events on satellite-based navigation. Space weather. 11, 680–686. doi:10.1002/2013sw001001
Schennetten, K., Matthiä, D., Meier, M. M., Berger, T., and Wirtz, M. (2024). The impact of the Gannon storm of May 2024 on the radiation fields at aviation altitudes and in low Earth orbits. Front. Astronomy Space Sci. 11, 1498910. doi:10.3389/fspas.2024.1498910
Shirochkov, A., Makarova, L., Nikolaeva, V., and Kotikov, A. (2015). The storm of March 1989 revisited: a fresh look at the event. Adv. Space Res. 55, 211–219. doi:10.1016/j.asr.2014.09.010
Skone, S., and De Jong, M. (2000). The impact of geomagnetic substorms on GPS receiver performance. Earth, Planets Space 52, 1067–1071. doi:10.1186/bf03352332
Spogli, L., Alberti, T., Bagiacchi, P., Cafarella, L., Cesaroni, C., Cianchini, G., et al. (2024). The effects of the May 2024 Mother’s Day superstorm over the Mediterranean sector: from data to public communication. Ann. Geophys. 67, PA218. doi:10.4401/ag-9117
Stewart, B. (1861). XXII. on the great magnetic disturbance which extended from August 28 to September 7, 1859, as recorded by photography at the Kew Observatory. Philosophical Trans. R. Soc. Lond. 423–430. doi:10.1098/rstl.1861.0023
Themens, D. R., Elvidge, S., McCaffrey, A., Jayachandran, P., Coster, A., Varney, R. H., et al. (2024). The high latitude ionospheric response to the major May 2024 geomagnetic storm: a synoptic view. Geophys. Res. Lett. 51. doi:10.1029/2024gl111677
Thomas, D., Weigel, R. S., Pulkkinen, A., Schuck, P. W., Welling, D. T., and Ngwira, C. M. (2024). What drove the Carrington event? An analysis of currents and geospace regions. J. Geophys. Res. Space Phys. 129. doi:10.1029/2024JA032556
Thomson, A. W., McKay, A. J., Clarke, E., and Reay, S. J. (2005). Surface electric fields and geomagnetically induced currents in the Scottish Power grid during the 30 October 2003 geomagnetic storm. Space weather. 3. doi:10.1029/2005sw000156
Tsurutani, B. T., Gonzalez, W. D., Lakhina, G. S., and Alex, S. (2003). The extreme magnetic storm of 1–2 September 1859. J. Geophys. Res. Space Phys. 108. doi:10.1029/2002JA009504
Keywords: space weather, geomagnetic storm, geomagnetic field, geoelectric field, geomagnetically induced currents
Citation: Lawrence E, Beggan CD, Richardson GS, Reay S, Thompson V, Clarke E, Orr L, Hübert J and Smedley ARD (2025) The geomagnetic and geoelectric response to the May 2024 geomagnetic storm in the United Kingdom. Front. Astron. Space Sci. 12:1550923. doi: 10.3389/fspas.2025.1550923
Received: 24 December 2024; Accepted: 19 February 2025;
Published: 24 April 2025.
Edited by:
Maria-Theresia Walach, Lancaster University, United KingdomReviewed by:
Alexei V. Dmitriev, Lomonosov Moscow State University, RussiaZhonghua Xu, Virginia Tech, United States
Daniel Mac Manus, University of Otago, New Zealand
Copyright © 2025 Lawrence, Beggan, Richardson, Reay, Thompson, Clarke, Orr, Hübert and Smedley. This is an open-access article distributed under the terms of the Creative Commons Attribution License (CC BY). The use, distribution or reproduction in other forums is permitted, provided the original author(s) and the copyright owner(s) are credited and that the original publication in this journal is cited, in accordance with accepted academic practice. No use, distribution or reproduction is permitted which does not comply with these terms.
*Correspondence: E. Lawrence, ZWZsb3JjemFrQGJncy5hYy51aw==