 Megha Pandya1,2*
 Ankush Bhaskar3
 Marilia Samara1
 Robert Michell1Emma Mirizio1,4Suk-Bin Kang1,2
 Lauren W. Blum5
- 1HelioPhysics Division, NASA Goddard Space Flight Center, Greenbelt, MD, United States
- 2Department of Physics, The Catholic University of America, Washington, DC, United States
- 3Space Physics Laboratory, ISRO/Vikram Sarabhai Space Center, Thiruvananthapuram, India
- 4Department of Astronomy, University of Maryland, College Park, College Park, MD, United States
- 5Laboratory for Atmospheric and Space Physics, University of Colorado, Boulder, CO, United States
We investigated the pulsating aurora observed on 7 January 2014, by a narrow field-of-view (FOV) high-time resolution ground-based white-light imager and all-sky low-time-resolution imager operated at Poker Flat, AK (geographic: 65.1
1 Introduction
Pulsating auroras (PAs) are unique optical phenomena that are characterized by a quasi-periodic rise and fall in auroral intensities over a period of 2–20 s with a typical scale size of
Several mechanisms have been proposed to explain the precipitation of energetic electrons associated with PA. Modulation of the rate of pitch angle scattering due to wave-particle interactions near the equator causes the pulsations (Nishimura et al., 2010; Nishimura et al., 2011; Coroniti and Kennel, 1970). So, the rate of change of pitch angle scattering could directly affect the pulsation frequency. Considering that the characteristic energy of the PA electrons is of the order of 100s of keV, their cyclotron resonance with whistler mode chorus waves, lower band chorus (LBC) waves especially, is a plausible candidate to cause such high energy electron precipitations (e.g., Thorne et al. (2010), Nishimura et al. (2010), Nishiyama et al. (2011) showed that auroral intensity from all-sky imager (ASI) data closely correlates with chorus wave amplitude measurements from THEMIS spacecraft, confirming that 100 eV to 10 keV electrons resonate with electron cyclotron harmonic and whistler mode waves. In addition to chorus waves, electromagnetic ion cyclotron (EMIC) waves are plasma waves that can scatter energetic protons and electrons into Earth’s atmosphere (e.g., Cornwall, 1965; Summers et al., 1998; Halford et al., 2016; Yahnin et al., 2021). They are typically generated near the magnetic equator in the inner magnetosphere by anisotropic ions, primarily at lower
Pickett et al. (2010) observed EMIC rising tone emissions in association with Pc-1 waves. The characteristic of Pc-1 waves, observed by the Cluster spacecraft on 30 March 2002, are consistent with their identification as EMIC triggered chorus emissions. These Pc-1-triggered chorus waves could potentially cause electron scattering into the loss cone, leading to the generation of PAs. Ultra-low frequency (ULF) waves, with periods ranging from tens of seconds to a few minutes, can influence the generation of PA by modulating whistler-mode chorus waves. Li et al. (2011) demonstrated that these waves affect chorus wave growth by altering electron density or the anisotropy of the resonant electrons. This periodic modulation aligns with the pulsation period of typical PA. Li et al. (2011) highlighted that density variations, whether induced by ULF modulations or other mechanisms, play a critical role in driving PA.
The dynamics of PAs often exhibit a clear post-midnight drift pattern, moving eastward at speeds ranging from a few hundred meters per second to a few kilometers per second. This drift is dawnward after midnight and shifts to duskward behavior before midnight (Nakamura and Oguti, 1987). Importantly, the speed of patch drift has been reported to align closely with the
Estimating the size of pulsating auroral patches provides insight into the regions of chorus intensification near the magnetic equator. Previous research has suggested that the transverse scale of individual chorus elements varies significantly, with estimates of approximately 100 km at L
Previous studies, such as Samara et al. (2017), have provided valuable insights into the PA observed on 7 January 2014, highlighting the presence of high-frequency peaks in the PA and linking these features to electron dynamics, including electrons that bounce back and forth between the two hemispheres. Khazanov et al. (2017), Khazanov et al. (2021b) further suggested that the auroral emissions are not solely driven by magnetospheric processes, indicating a more complex interaction. These studies have contributed to the understanding of PAs, yet the factors influencing the spatial and temporal drift of their pulsation frequencies remain poorly understood for this event. Our study builds upon these previous works by providing more detailed spatial and temporal characterization of the pulsating aurora through high-resolution ground-based imaging data from Poker Flat, AK. We incorporate additional in situ observations from the ground-based magnetometer data from Dawson, which share similar magnetic local time (MLT) and L-values, to offer new insights into the role of Pc-1 waves, in modulating the pulsation frequency. Section 2 presents the event and datasets, while Section 3 provides details on the observations and analysis. Sections 4 and Section 5 discuss the results, and the conclusions are summarized in the final section.
2 Data and methodology
The PA event on 7 January 2014, was analyzed using the Multi-spectral Observatory Of Sensitive EMCCD (MOOSE) imagers, equipped with Andor Ixon DU-888 EMCCD (Electron Multiplying Charge Coupled Device) cameras. Two white-light imagers with varying fields-of-view (FOV) were deployed at Poker Flat, AK (geographic:
The Canadian Array for Realtime InvestigationS of Magnetic Activity (CARISMA) is a network of ground-based magnetometers deployed across North America Mann et al. (2008). The array includes induction coil magnetometers that monitors 3-D vector magnetic fields and fluctuations at the Earth’s surface, which are sensitive to EMIC wave activity. These magnetometers have a resolution of
The Super Dual Auroral Radar Network (SuperDARN) is utilized to measure ionospheric plasma convection by detecting Doppler-shifted radio signals reflected from field-aligned irregularities in the F-region ionosphere (Greenwald et al., 1995; Chisham et al., 2007). In this study, we use data from the Prince George (PGR) radar, located at (53.9812°N, 122.5920°W), near the ground-based imagers in British Columbia, Canada to analyze the plasma flow in the region near the ground-based auroral imagers. The radar operates by transmitting high-frequency radio waves and measuring the Doppler shift of returned signals to determine line-of-sight plasma velocities. For this analysis, we focus on beams 1, 2, 12, 14, and 28 of the PGR radar, as it aligns with the observed auroral structures and provides a clear view of the plasma convection dynamics. The beams having a significant number of data points during this interval have been selected. The use of a limited number of beam ensures consistency in tracking velocity variations along a fixed direction, minimizing uncertainties associated with multi-beam averaging (Ruohoniemi and Baker, 1998).
3 Observation and analysis
The solar wind and geomagnetic conditions during 1,600–1,800 UT on 7 January 2014 are shown in Figure 1. The panels represent 1-min resolution data from the OMNI database (King and Papitashvili, 2005) for (a) solar wind velocity (Vsw), (b) the z-component of the interplanetary magnetic field (IMF Bz), and (c) solar wind dynamic pressure (Psw). The geomagnetic activity indices shown in (d) AL-index and (e) AU-index are obtained from Davis and Sugiura (1966). A weak substorm with AL
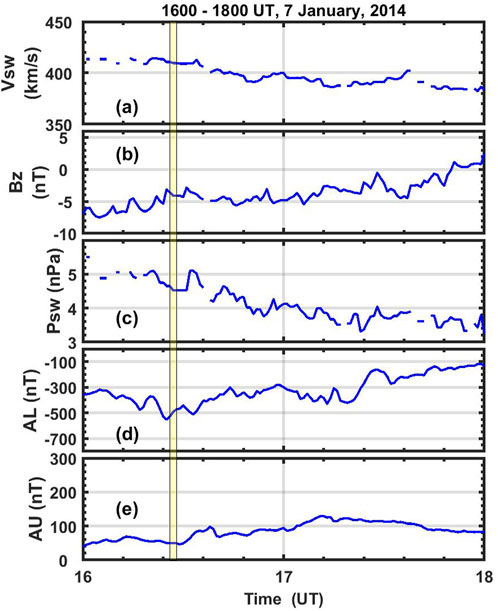
Figure 1. (a) Solar wind velocity (Vsw), (b) interplanetary magnetic field (IMF) z-component (Bz), (c) solar wind dynamic pressure (Psw), (d) AL-index and (e) AU-index for the period of between 1,600–1,800 UT on 7 January 2014. The shaded yellow region indicates the duration of the PA observed in the ground-based auroral imager at Poker Flat, AK.
Figure 2 presents the auroral observations that combine the white-light images from both (a) all-sky and (b) narrow FOV cameras, captured simultaneously during the pulsation-on phase of the study. The keogram cut location is marked as a colored vertical line in both images. Panel (c-f) represents the snapshots of the PAs at different times, taken from the narrow FOV imager. This study investigates the movement of auroral structures to capture their spatial evolution. At the same time, it analyzes rapid temporal variations using a narrow FOV with high frame rates.
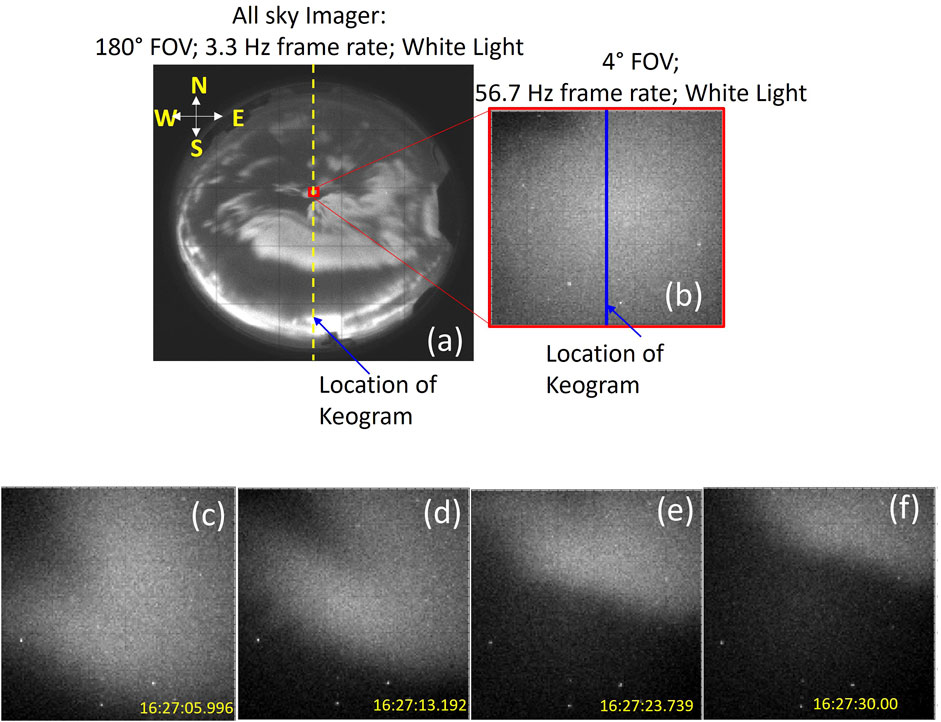
Figure 2. (a) Images of the PA event that captured at 16:26:21 UT on 7 January 2014. All sky image with 180
Figure 3 provides a multiscale view of a 3-min keogram of the PA observed at Poker Flat, AK, on 7 January 2014. Panel (a) displays the PA captured with a 0.33 s exposure using the all-sky white-light imager, showing multiple patch-like features near the zenith in the north-south keogram. Panel (b) presents a zoomed section between the two black dashed horizontal lines in panel (a), focusing on the region between 109 and 129 km. The black dashed horizontal lines in panel (b) indicate the region shown in panel (c). Panel (c) depicts a high-time-resolution keogram from the narrow FOV white light imager at the same location, revealing quasi-periodic oscillations beginning at 16:26:20 UT.
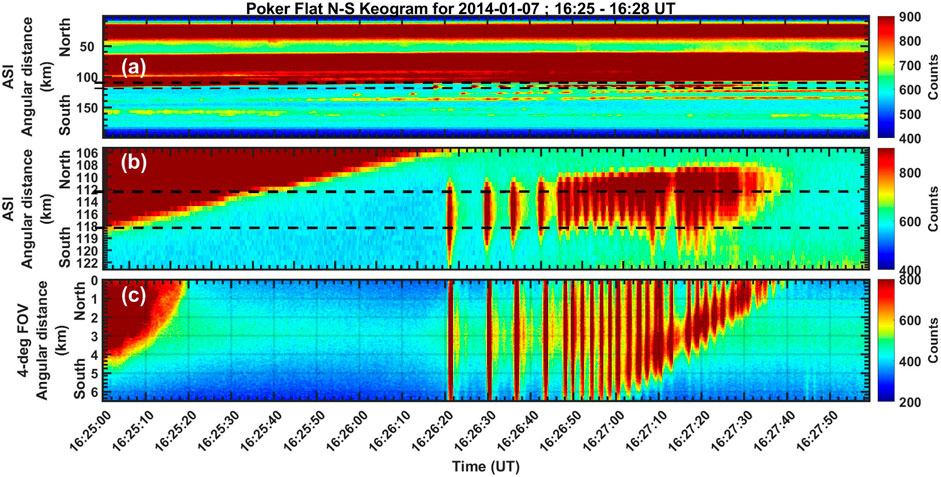
Figure 3. Multi-scale representation of the PA that occurred on 7 January 2014. (a) N-S Keogram from the all-sky white light imager located at Poker Flat, AK, recorded at 0.33 s exposure. (b) Magnified keogram from the black dashed lines in panel (a) showing the PA signature. The black dashed rectangle shows the zoomed section shown in (c). (c) Simultaneous observation of PA recorded by the narrow FOV white light imager at 56 fps frame rate at the same location.
We observe three key dynamic features that evolve in both space and time. The first and most prominent feature is the northward movement of the pulsating auroral patch. The second is the duration of persistence of each individual pulse within the PA, and the third is the variation in the PA frequency over time. The spatial location of the maximum intensity and a slight time delay in pulsating aurora peaks are observed in Figures 3b,c. The observed differences between Figures 3b,c can be attributed to several factors related to instrumental characteristics, viewing geometry, and optical distortions. The temporal resolution disparity between the two imagers plays a key role, as the 180° FOV imager operates at 3.3 Hz, while the narrow 4° FOV imager runs at 56 Hz. The higher frame rate of the narrow FOV imager allows it to capture rapid variations in auroral intensity with greater precision, whereas the lower frame rate of the wide FOV imager may introduce a small lag in detecting peak intensities, leading to the observed
To calculate the drift velocity of the PA, we employ an algorithm that systematically tracks pulsation-on patches in the imager. First, we identify these patches by detecting pulsations with intensities exceeding 700 counts, marked by blue dots in Figure 4 (top). Next, we determine the maximum intensity for each pulsation at each time instant, represented by magenta dots. To refine the analysis, we extract the maximum values within 0.1-s intervals and identify the corresponding pixel locations at peak intensity for each time step. These values, shown as red data points in Figure 4 (bottom), are then converted into distance measurements. A regression line (blue) is fitted to these data points, and its slope provides a drift velocity of 76.41 m/s, indicating northward motion of the pulsating patch. Overall, the PA patch predominantly drifts northeast, with a weaker eastward component. This eastward drift is further evident in Figures 2c–f, where a gradual shift in the patch’s position over time can be observed.
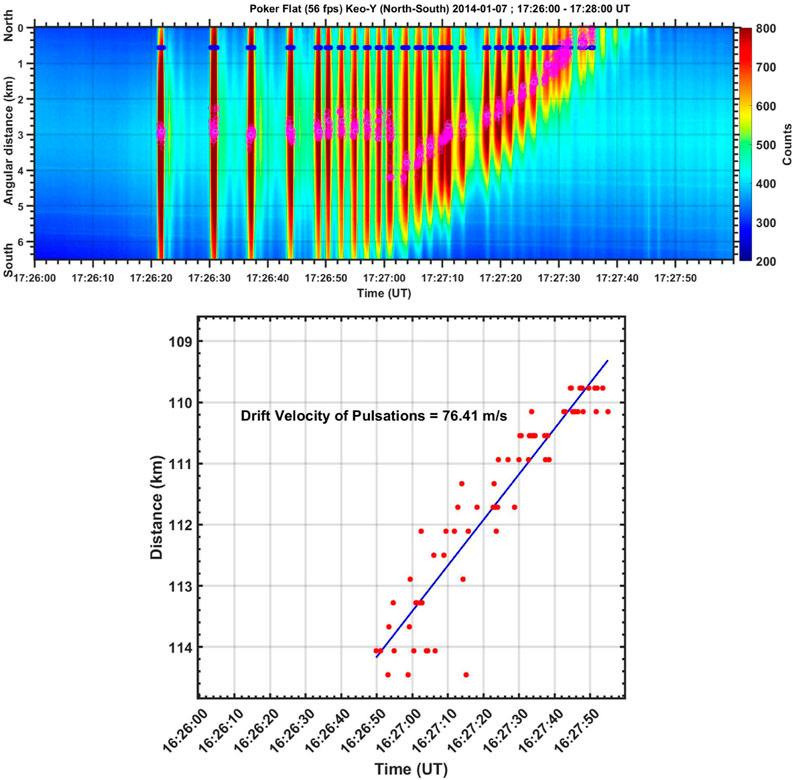
Figure 4. Top panel: N-S keogram from the narrow FOv imager showing the 2-min interval of the PA. The blue dots on each pulsations at the top indicates the identified peaks, while the magneta dots represnts the maximum intensity points at each time interval. Bottom panel: Distance versus time obtained from the ASI data showing the drift in the pulsating auroral patch after 16:27:00 UT. The red data points refer to the points of maximum intensity at a given instant of time inside the pulsating patch. The blue line is the best fit for the data points.
Figure 5 (left) provides a detailed visualization of the observational setup, highlighting key regions and instruments involved in the study. The map projection displays the FOV of the PGR radar in red, overlaid with the FOV of the MOOSE ASIs at PFRR in blue, allowing for a comparison of the areas covered by both instruments. This layout is crucial for understanding the spatial relationship between the two FOVs and how they complement each other. The map also incorporates the MLT, which is essential for contextualizing the timing of observations in relation to the Earth’s magnetic field. Additionally, the figure marks the location of the DAWS (green), a vital ground-based station, providing further context for the observations. Together, these elements offer a comprehensive understanding of the observational context and the geographic positioning of key instruments in the study. Figure 5 (right) represents the velocity versus time plot recorded by beam 1, 2, 12, 14 and 28 of the Prince George (PGR) radar between 16:27-16:28 UT. The beams having a significant number of data points have been selected. Negative values of the velocity indicate westward plasma flow, while positive values represent eastward plasma flow. During the observed period, the velocity measurements show a strong eastward flow aligning well with the movement of the PAs shown in Figure 3c. The confidence levels of these measurements are determined by the signal-to-noise ratio (SNR) and the fitting accuracy of the radar echoes, both of which fall within the standard acceptable range for SuperDARN measurements. This agreement reinforces the reliability of the velocity measurements and supports the interpretation of the ionospheric plasma motion during the observed interval.
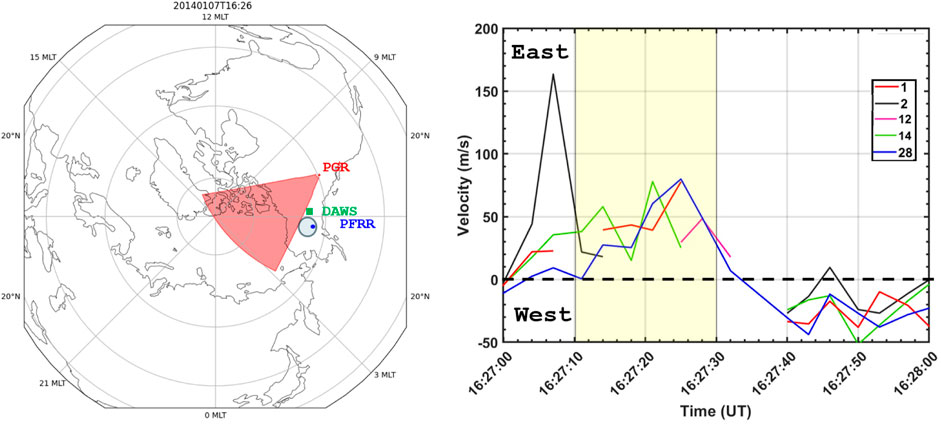
Figure 5. left: A comprehensive view of the observational setup showing the map projection of the PGR radar FOV (red), overlaid with the FOV of the MOOSE ASIs at PFRR (blue). The map provides a clear context for the observed region, showing the magnetic local time (MLT) alongside the location of DAWS (green). right: Velocity plots for diffreent beam numbers of the SuperDARN PGR, Canada HF radar for the time during which the PAs were observed to be drifting.
Figure 6 (top) displays the keogram intercept taken
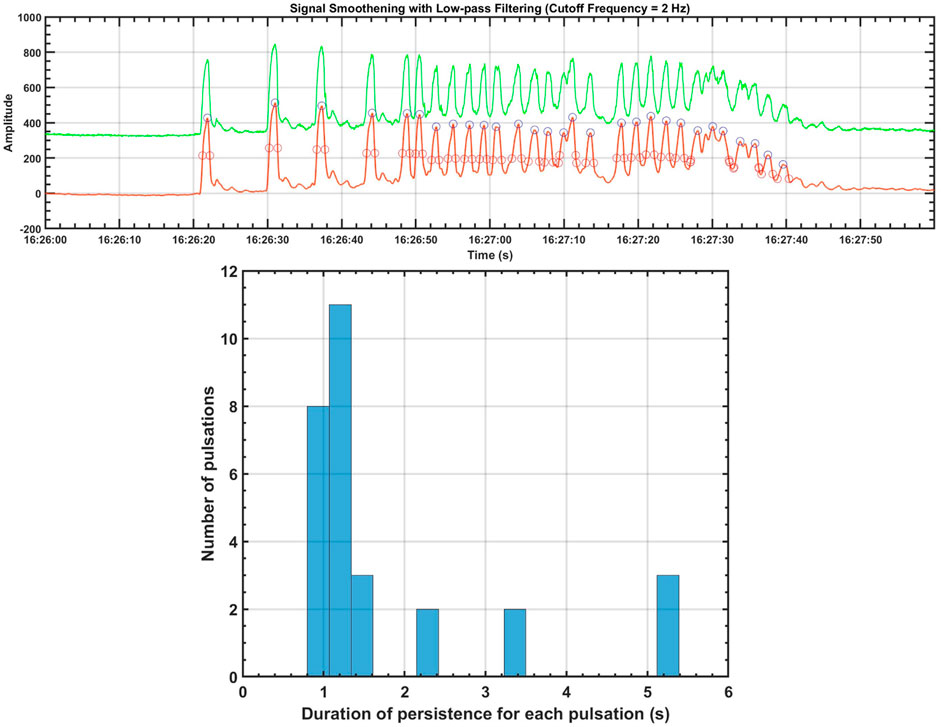
Figure 6. Top: A green line plot shows the keogram intercept taken at 3.25 km over a 2-min interval. The red curve represents the smoothed green line plot after applying a low-pass filter and removing the background counts. Blue circles indicate the identified peaks, while magenta circles represent their FWHM. bottom: Histogram of the pulsation-on time for the PAs that occurred between 16:26:00 UT-16:28:00 UT.
To analyze the temporal evolution in the pulsation frequency, we present Figure 7a1 which is same as the green curve in Figure 6 (top). To investigate the temporal evolution of pulsations we have performed wavelet transform of the data by following the methodology of Torrence and Compo (1998). Figure 7a2 shows the continuous wavelet transform of the auroral intensity data after applying a Butterworth band-pass filter of 0.1–8 Hz. During 16:26:20 UT to 16:26:50 UT, the PA spans a broad frequency range, approximately from 0.0625 Hz to 0.5 Hz. However, during 16:26:50 UT-16:27:30 UT the frequency of the pulsation abruptly narrows around 0.5 Hz, with no low-frequency (
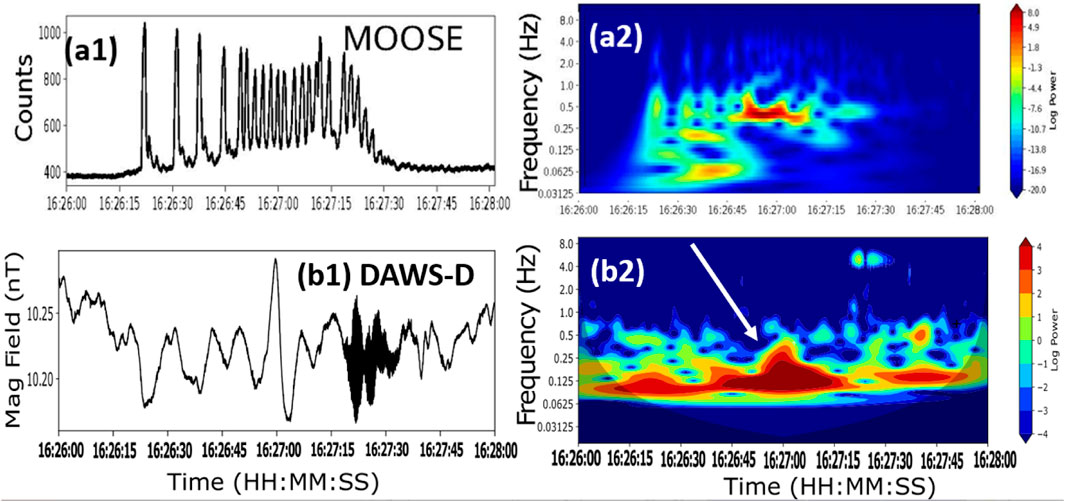
Figure 7. (a1) Auroral intensity versus time, and (a2) continuous wavelet transform of the north-south cut of the keogram centered at zenith from the narrow FOV MOOSE imager. (b1) the magnitude of the D-component of the magnetic field, and (b2) its wavelet from the DAWS station on the ground.
Figure 7b1 displays the D-component of the ground magnetic field data from the DAWS station, while Figure 7b2 presents the corresponding wavelet after applying a band-pass filter ranging from 0.1 to 0.9 Hz. During 16:26:50–16:27:00 UT interval, a significant wave power enhancement is observed with a broad band of frequncies within the 0.125–0.5 Hz range. In addition to this, we also observe strong Pc-1 waves with a dominant frequency of 4 Hz between 16:27:15 and 16:27:30 UT, which does not appear to have any significant impact on the observed PA. This alignment suggests a potential connection between the Pc-1 waves and the observed features in the auroral intensity curve.
4 Discussion
Our observations of the pulsating aurora on 7 January 2014 provide valuable insights into the spatio-temporal evolution of the pulsating aurora and their characteristics. The frequency drift and spatial drift observed in the pulsating aurora are suggestive of the magnetospheric dynamics such as wave-particle interactions. The combination of ASI and narrow FOV imagers having high time and space resolution helps distinguish unique features of auroral forms, identifying their locations and motion patterns, and correlating them with the magnetospheric processes. For example, the PAs observed on 7 January 2014 is spatially localized until 16:27:00 UT as shown in Figures 3b,c. After this, a rapid movement of the pulsating structure appears in the northeast direction through both ASI and narrow FOV imagers Figures 2c–f. The PA events examined in this study occur during the recovery phase of the substorm, aligning with the findings of Partamies et al. (2019), which reported that a majority (64%) of events with decreasing patch sizes also take place during this phase. The spatial drift motion of the PAs, with speeds of thousands of m/s, cannot be explained by obliquely propagating chorus waves, which typically cause the 3
We estimate that the FWHM for most pulsations is close to 1 s. The duration of the pulsation observed in this study closely aligns with previous findings on the precipitation time of electrons with 5 keV–500 keV at
During 16:26:50–16:27:00 UT, the PAs exhibited a distinct frequency drift from 0.0625 Hz to 0.5 Hz (Figure 7a2). This frequency increase coincided with an intensification and broadening of wave power in the D-component of the magnetic field, which falls within the Pc-1 range. Since EMIC waves are a key source of Pc-1 waves and are typically generated near the magnetic equator (Sakaguchi et al., 2013; Pickett et al., 2010; Nomura et al., 2016), understanding their role in modulating PA characteristics is important. Unfortunately, the absence of conjugate satellite observations for this event limits our ability to determine the exact location and mechanism of wave-particle interactions and their propagation in the magnetosphere. Investigating these processes remains an important subject for future studies.
Although the white-light auroral imagers used in this study do not distinguish between proton and electron precipitation, the observed Pc-1 activity suggests a possible connection between the pulsating aurora and proton precipitation (Sakaguchi et al., 2008; Nomura et al., 2012; Yahnin et al., 2007; Yahnin et al., 2016). Since PAs exhibit quasi-periodic intensity variations on timescales of seconds (Yamamoto, 1988; Nishiyama et al., 2014), their modulation could be driven by (i) chorus wave intensity (Trakhtengerts, 1999; Li et al., 2011), (ii) electron cyclotron harmonic waves (Meredith et al., 2009; Liang et al., 2010), or (iii) EMIC waves (Yahnin et al., 2007; Sakaguchi et al., 2008; Nomura et al., 2012). Our findings align with Nomura et al. (2016), who observed proton auroral pulsations using an all-sky imager and a ground magnetometer in Athabasca, Canada, showing a one-to-one correlation with Pc-1 rising tones. However, due to limited observational detail, clear rising tone signatures are not evident in our event, making the association between the waves and PAs less conclusive. These rising tones intermittently scatter magnetospheric protons in the equatorial region, supporting the hypothesis that Pc-1 waves modulate auroral pulsation frequencies.
Another possible explanation involves Pc-1 wave interactions with energetic protons, which may trigger chorus emissions (Pickett et al., 2010), similar to the non-linear VLF chorus generation mechanism proposed by Omura et al. (2008), Omura et al. (2009). EMIC-triggered emissions can result from a non-linear absolute instability of L-mode EMIC waves interacting with energetic protons (Omura et al., 2010). The subsequent modulation of chorus waves could enhance electron scattering, producing high-frequency PAs. Figure 8 provides a schematic representation of the observed Pc-1 waves and their conjugate pulsating aurora signatures on the ground. Previous studies have demonstrated that wave modes, such as Pc-1 waves, can modulate the precipitation of energetic electrons and influence auroral dynamics. Specifically, Pc-1 waves have been shown to trigger chorus waves that could scatter electrons into the loss cone, leading to the generation of PAs (Pickett et al., 2010; Nishimura et al., 2010). Our findings of the modulation of the pulsating aurora’s frequency drift align with the hypothesis that interactions between Pc-1 waves and chorus waves drive electron precipitation (Thorne et al., 2010; Li et al., 2011). This connection reinforces the notion that the modulation of chorus waves by Pc-1 waves could drive the observed drift in pulsation frequency, offering a deeper understanding of the mechanisms governing highly structured auroral precipitation.
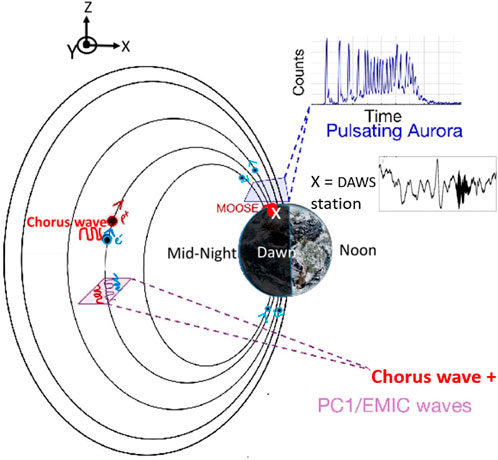
Figure 8. Schematic shows a connection between the Pc-1 waves observed by DAWS with the Pulsating auroral intensity variation observed by the MOOSE EMCCD at AK.
Samara et al. (2017) demonstrated that the peaks in PAs are caused by electrons that bounce back and forth between the two hemispheres. Although our and Samara et al. (2017) studies analyze the same event and utilize similar imaging data, our focus differs from that of Samara et al. (2017) in exploring the role of structured primary precipitation in shaping these features. Khazanov et al. (2017), Khazanov et al. (2021b) suggested that the aurora is not only driven by pure magnetospheric processes. The magnetosphere-Ionosphere-Atmosphere (MIA) coupling of the precipitated electrons and their interplay between the northern and southern hemispheres is also an additional mechanism that proves to be an important contributor in the formation of different kinds of aurora (Khazanov et al., 2020; Khazanov et al., 2021a). While this mechanism explains the presence of high-frequency faint peaks, our study investigates whether the observed low-frequncy main peaks in PAs are driven by temporally structured wave-particle interactions.
5 Conclusion
This study has presented high-speed, narrow FOV imaging observations of auroras in the zenith associated with a weak substorm. The observations were made with a narrow FOV camera incorporating an electron-multiplying CCD (EMCCD) detector and a prompt emission filter. The high resolution of the instrument has allowed for a quantitative analysis of spatial and temporal phase coherence in the elemental pulsating auroral patch. The strength of EMCCD lies in its ability to resolve signals that are both faint and highly short-lived. To complement the bigger picture of the observed auroral emission, we also employed data analysis from the ASI at the same location.
We observed that the auroral frequency suddenly increased from approximately 0.0625 Hz–0.5 Hz, whereas the pulsating auroral patch itself spatially drifted in the northern direction at a velocity of 76.41 m/s. The persistence of each pulsation was calculated to be around 1 s, which is consistent with electron precipitation driven by chorus waves.
Wavelet analysis of the ground magnetometer data from DAWS station suggests that the observed waves in the Pc-1 band. This alignment suggests that EMIC waves in equatorial region could be influencing the auroral modulation. Thus, the results indicate a potential interaction between PAs and Pc-1 waves.
In conclusion, the observed PAs’s frequency drift and spatial movement, along with the wavelet analysis of magnetometer data, suggest that the Pc-1 frequency band, play a significant role in modulating the auroral emissions. This interaction likely contributes to the observed pulsation frequency drift, providing important insights into the dynamic coupling between magnetospheric waves and ionospheric auroral processes.
Data availability statement
The raw data supporting the conclusions of this article will be made available by the authors, without undue reservation.
Author contributions
MP: Writing – original draft, Writing – review and editing. AB: Writing – review and editing, Writing – original draft. MS: Funding acquisition, Writing – review and editing. RM: Data curation, Writing – review and editing. EM: Writing – review and editing. S-BK: Writing – review and editing. LB: Writing – review and editing.
Funding
The author(s) declare that financial support was received for the research and/or publication of this article. This work is supported by NASA Goddard Space Flight Center through cooperative agreement 80NSSC21M0180, Partnership for Heliophysics and Space Environment Research (PHaSER).
Acknowledgments
MP thanks Yusuke Ebihara (RISH, Kyoto University) and Alex Hoffmann (NASA-GSFC) for their valuable scientific discussions and insights that contributed to this work. MP thanks both the reviewers for their constructive comments. The GOES 15 magnetic field data is produced in real time by the NOAA Space Weather Prediction Center (SWPC) and are distributed by the NOAA National Geophysical Data Center (NGDC). The authors acknowledge the use of SuperDARN data. SuperDARN is a collection of radars funded by national scientific funding agencies of Australia, Canada, China, France, Italy, Japan, Norway, South Africa, United Kingdom and the United States of America. The authors thank I.R. Mann, D.K. Milling and the rest of the CARISMA team for data. CARISMA is operated by the University of Alberta, funded by the Canadian Space Agency.
Conflict of interest
The authors declare that the research was conducted in the absence of any commercial or financial relationships that could be construed as a potential conflict of interest.
The author(s) declared that they were an editorial board member of Frontiers, at the time of submission. This had no impact on the peer review process and the final decision.
Generative AI statement
The author(s) declare that no Generative AI was used in the creation of this manuscript.
Publisher’s note
All claims expressed in this article are solely those of the authors and do not necessarily represent those of their affiliated organizations, or those of the publisher, the editors and the reviewers. Any product that may be evaluated in this article, or claim that may be made by its manufacturer, is not guaranteed or endorsed by the publisher.
References
Agapitov, O., Krasnoselskikh, V., Zaliznyak, Y., Angelopoulos, V., Le Contel, O., and Rolland, G. (2010). Chorus source region localization in the earth’s outer magnetosphere using themis measurements. In Annales geophysicae. (Copernicus Publications Göttingen, Germany), 28, 1377–1386. doi:10.5194/angeo-28-1377-2010
Blum, L., Bonnell, J., Agapitov, O., Paulson, K., and Kletzing, C. (2017). Emic wave scale size in the inner magnetosphere: observations from the dual van allen probes. Geophys. Res. Lett. 44, 1227–1233. doi:10.1002/2016gl072316
Blum, L., MacDonald, E., Clausen, L., and Li, X. (2012). A comparison of magnetic field measurements and a plasma-based proxy to infer emic wave distributions at geosynchronous orbit. J. Geophys. Res. Space Phys. 117. doi:10.1029/2011ja017474
Chaston, C., Bonnell, J., Carlson, C., Berthomier, M., Peticolas, L., Roth, I., et al. (2002). Electron acceleration in the ionospheric alfven resonator. J. Geophys. Res. Space Phys. 107, SMP–41. doi:10.1029/2002ja009272
Chisham, G., Lester, M., Milan, S., Freeman, M., Bristow, W., Grocott, A., et al. (2007). A decade of the super dual auroral radar network (superdarn): scientific achievements, new techniques and future directions. Surv. Geophys. 28, 33–109. doi:10.1007/s10712-007-9017-8
Cornwall, J. M. (1965). Cyclotron instabilities and electromagnetic emission in the ultra low frequency and very low frequency ranges. J. Geophys. Res. 70, 61–69. doi:10.1029/jz070i001p00061
Coroniti, F., and Kennel, C. (1970). Electron precipitation pulsations. J. Geophys. Res. 75, 1279–1289. doi:10.1029/ja075i007p01279
Davidson, G. (1986a). Pitch angle diffusion in morningside aurorae: 1. the role of the loss cone in the formation of impulsive bursts of precipitation. J. Geophys. Res. Space Phys. 91, 4413–4427. doi:10.1029/ja091ia04p04413
Davidson, G. (1986b). Pitch angle diffusion in morningside aurorae: 2. the formation of repetitive auroral pulsations. J. Geophys. Res. Space Phys. 91, 4429–4436. doi:10.1029/ja091ia04p04429
Davidson, G., and Chiu, Y. (1991). An unusual nonlinear system in the magnetosphere: a possible driver for auroral pulsations. J. Geophys. Res. Space Phys. 96, 19353–19362. doi:10.1029/91ja01826
Davis, T. N., and Sugiura, M. (1966). Auroral electrojet activity index ae and its universal time variations. J. Geophys. Res. 71, 785–801. doi:10.1029/jz071i003p00785
Fukuda, Y., Kataoka, R., Miyoshi, Y., Katoh, Y., Nishiyama, T., Shiokawa, K., et al. (2016). Quasi-periodic rapid motion of pulsating auroras. Polar Sci. 10, 183–191. doi:10.1016/j.polar.2016.03.005
Gary, S. P., Thomsen, M. F., Yin, L., and Winske, D. (1995). Electromagnetic proton cyclotron instability: interactions with magnetospheric protons. J. Geophys. Res. Space Phys. 100, 21961–21972. doi:10.1029/95ja01403
Greenwald, R., Baker, K., Dudeney, J., Pinnock, M., Jones, T., Thomas, E., et al. (1995). Darn/superdarn: a global view of the dynamics of high-latitude convection. Space Sci. Rev. 71, 761–796. doi:10.1007/bf00751350
Halford, A. J., Fraser, B. J., Morley, S. K., Elkington, S. R., and Chan, A. A. (2016). Dependence of emic wave parameters during quiet, geomagnetic storm, and geomagnetic storm phase times. J. Geophys. Res. Space Phys. 121, 6277–6291. doi:10.1002/2016ja022694
Hansen, H., and Scourfield, W. (1990). Associated ground-based observations of optical aurorae and discrete whistler waves. J. Geophys. Res. Space Phys. 95, 233–239. doi:10.1029/ja095ia01p00233
Huang, L., Hawkins, J., and Lee, L. (1990). On the generation of the pulsating aurora by the loss cone driven whistler instability in the equatorial region. J. Geophys. Res. Space Phys. 95, 3893–3906. doi:10.1029/JA095iA04p03893
Humberset, B. K., Gjerloev, J. W., Samara, M., Michell, R., and Mann, I. R. (2016). Temporal characteristics and energy deposition of pulsating auroral patches. J. Geophys. Res. Space Phys. 121, 7087–7107. doi:10.1002/2016ja022921
Jones, S., Lessard, M., Rychert, K., Spanswick, E., and Donovan, E. (2011). Large-scale aspects and temporal evolution of pulsating aurora. J. Geophys. Res. Space Phys. 116. doi:10.1029/2010ja015840
Khazanov, G., Sibeck, D., and Zesta, E. (2017). Is diffuse aurora driven from above or below? Geophys. Res. Lett. 44, 641–647. doi:10.1002/2016gl072063
Khazanov, G. V., Glocer, A., and Chu, M. (2020). The formation of electron heat flux in the region of diffuse aurora. J. Geophys. Res. Space Phys. 125, e2020JA028175. doi:10.1029/2020ja028175
Khazanov, G. V., Glocer, A., and Chu, M. (2021a). Electron energy interplay in the geomagnetic trap below the auroral acceleration region. J. Geophys. Res. Space Phys. 126, e2020JA028811. doi:10.1029/2020ja028811
Khazanov, G. V., Glocer, A., and Chu, M. (2021b). The precipitated electrons in the region of diffuse aurora driven by ionosphere-thermosphere collisional processes. Geophys. Res. Lett. 48, e2021GL094583. doi:10.1029/2021gl094583
King, J., and Papitashvili, N. (2005). Solar wind spatial scales in and comparisons of hourly wind and ace plasma and magnetic field data. J. Geophys. Res. Space Phys. 110. doi:10.1029/2004ja010649
Li, W., Bortnik, J., Thorne, R., Nishimura, Y., Angelopoulos, V., and Chen, L. (2011). Modulation of whistler mode chorus waves: 2. role of density variations. J. Geophys. Res. Space Phys. 116. doi:10.1029/2010ja016313
Liang, J., Uritsky, V., Donovan, E., Ni, B., Spanswick, E., Trondsen, T., et al. (2010). Themis observations of electron cyclotron harmonic emissions, ulf waves, and pulsating auroras. J. Geophys. Res. Space Phys. 115. doi:10.1029/2009ja015148
Mann, I., Milling, D., Rae, I., Ozeke, L., Kale, A., Kale, Z., et al. (2008). The upgraded carisma magnetometer array in the themis era. Space Sci. Rev. 141, 413–451. doi:10.1007/978-0-387-89820-9_18
Mann, I., Usanova, M., Murphy, K., Robertson, M., Milling, D., Kale, A., et al. (2014). Spatial localization and ducting of emic waves: van allen probes and ground-based observations. Geophys. Res. Lett. 41, 785–792. doi:10.1002/2013gl058581
McEwen, D. J., Duncan, C. N., and Montalbetti, R. (1981). Auroral electron energies: comparisons of in situ measurements with spectroscopically inferred energies. Can. J. Phys. 59, 1116–1123. doi:10.1139/p81-147
Meredith, N. P., Horne, R. B., Thorne, R. M., and Anderson, R. R. (2009). Survey of upper band chorus and ech waves: implications for the diffuse aurora. J. Geophys. Res. Space Phys. 114. doi:10.1029/2009ja014230
Michell, R., Grydeland, T., and Samara, M. (2014). Characteristics of poker flat incoherent scatter radar (pfisr) naturally enhanced ion-acoustic lines (neials) in relation to auroral forms. In Annales geophysicae (Copernicus Publications, Göttingen, Germany), vol. 32, 1333–1347. doi:10.5194/angeo-32-1333-2014
Michell, R., and Samara, M. (2015). Ground magnetic field fluctuations associated with pulsating aurora. J. Geophys. Res. Space Phys. 120, 9192–9201. doi:10.1002/2015ja021252
Miyoshi, Y., Katoh, Y., Nishiyama, T., Sakanoi, T., Asamura, K., and Hirahara, M. (2010). Time of flight analysis of pulsating aurora electrons, considering wave-particle interactions with propagating whistler mode waves. J. Geophys. Res. Space Phys. 115. doi:10.1029/2009ja015127
Miyoshi, Y., Oyama, S., Saito, S., Kurita, S., Fujiwara, H., Kataoka, R., et al. (2015). Energetic electron precipitation associated with pulsating aurora: eiscat and van allen probe observations. J. Geophys. Res. Space Phys. 120, 2754–2766. doi:10.1002/2014ja020690
Nakamura, R., and Oguti, T. (1987). Drifts of auroral structures and magnetospheric electric fields. J. Geophys. Res. Space Phys. 92, 11241–11247. doi:10.1029/ja092ia10p11241
Nishimura, Y., Bortnik, J., Li, W., Thorne, R., Chen, L., Lyons, L., et al. (2011). Multievent study of the correlation between pulsating aurora and whistler mode chorus emissions. J. Geophys. Res. Space Phys. 116. doi:10.1029/2011ja016876
Nishimura, Y., Bortnik, J., Li, W., Thorne, R. M., Lyons, L. R., Angelopoulos, V., et al. (2010). Identifying the driver of pulsating aurora. Science 330, 81–84. doi:10.1126/science.1193186
Nishiyama, T., Sakanoi, T., Miyoshi, Y., Hampton, D. L., Katoh, Y., Kataoka, R., et al. (2014). Multiscale temporal variations of pulsating auroras: on-off pulsation and a few hz modulation. J. Geophys. Res. Space Phys. 119, 3514–3527. doi:10.1002/2014ja019818
Nishiyama, T., Sakanoi, T., Miyoshi, Y., Katoh, Y., Asamura, K., Okano, S., et al. (2011). The source region and its characteristic of pulsating aurora based on the reimei observations. J. Geophys. Res. Space Phys. 116. doi:10.1029/2010ja015507
Nomura, R., Shiokawa, K., Omura, Y., Ebihara, Y., Miyoshi, Y., Sakaguchi, K., et al. (2016). Pulsating proton aurora caused by rising tone pc1 waves. J. Geophys. Res. Space Phys. 121, 1608–1618. doi:10.1002/2015ja021681
Nomura, R., Shiokawa, K., Sakaguchi, K., Otsuka, Y., and Connors, M. (2012). Polarization of pc1/emic waves and related proton auroras observed at subauroral latitudes. J. Geophys. Res. Space Phys. 117. doi:10.1029/2011ja017241
Oguti, T., Kokubun, S., Hayashi, K., Tsuruda, K., Machida, S., Kitamura, T., et al. (1981). Statistics of pulsating auroras on the basis of all-sky tv data from five stations. i. occurrence frequency. Can. J. Phys. 59, 1150–1157. doi:10.1139/p81-152
Oguti, T., and Watanabe, T. (1976). Quasi-periodic poleward propagation of on-off switching aurora and associated geomagnetic pulsations in the dawn. J. Atmos. Terr. Phys. 38, 543–551. doi:10.1016/0021-9169(76)90013-1
Omura, Y., Hikishima, M., Katoh, Y., Summers, D., and Yagitani, S. (2009). Nonlinear mechanisms of lower-band and upper-band vlf chorus emissions in the magnetosphere. J. Geophys. Res. Space Phys. 114. doi:10.1029/2009ja014206
Omura, Y., Katoh, Y., and Summers, D. (2008). Theory and simulation of the generation of whistler-mode chorus. J. Geophys. Res. Space Phys. 113. doi:10.1029/2007ja012622
Omura, Y., Pickett, J., Grison, B., Santolik, O., Dandouras, I., Engebretson, M., et al. (2010). Theory and observation of electromagnetic ion cyclotron triggered emissions in the magnetosphere. J. Geophys. Res. Space Phys. 115. doi:10.1029/2010ja015300
Ozaki, M., Yagitani, S., Ishizaka, K., Shiokawa, K., Miyoshi, Y., Kadokura, A., et al. (2012). Observed correlation between pulsating aurora and chorus waves at syowa station in Antarctica: a case study. J. Geophys. Res. Space Phys. 117. doi:10.1029/2011ja017478
Partamies, N., Bolmgren, K., Heino, E., Ivchenko, N., Borovsky, J. E., and Sundberg, H. (2019). Patch size evolution during pulsating aurora. J. Geophys. Res. Space Phys. 124, 4725–4738. doi:10.1029/2018ja026423
Pickett, J., Grison, B., Omura, Y., Engebretson, M., Dandouras, I., Masson, A., et al. (2010). Cluster observations of emic triggered emissions in association with pc1 waves near earth’s plasmapause. Geophys. Res. Lett. 37. doi:10.1029/2010gl042648
Royrvik, O., and Davis, T. (1977). Pulsating aurora: local and global morphology. J. Geophys. Res. 82, 4720–4740. doi:10.1029/ja082i029p04720
Ruohoniemi, J., and Baker, K. (1998). Large-scale imaging of high-latitude convection with super dual auroral radar network hf radar observations. J. Geophys. Res. Space Phys. 103, 20797–20811. doi:10.1029/98ja01288
Saikin, A., Zhang, J.-C., Allen, R., Smith, C., Kistler, L., Spence, H., et al. (2015). The occurrence and wave properties of h+-he+-and o+-band emic waves observed by the van allen probes. J. Geophys. Res. Space Phys. 120, 7477–7492. doi:10.1002/2015ja021358
Saito, S., Miyoshi, Y., and Seki, K. (2012). Relativistic electron microbursts associated with whistler chorus rising tone elements: gemsis-rbw simulations. J. Geophys. Res. Space Phys. 117. doi:10.1029/2012ja018020
Sakaguchi, K., Kasahara, Y., Shoji, M., Omura, Y., Miyoshi, Y., Nagatsuma, T., et al. (2013). Akebono observations of emic waves in the slot region of the radiation belts. Geophys. Res. Lett. 40, 5587–5591. doi:10.1002/2013gl058258
Sakaguchi, K., Shiokawa, K., Miyoshi, Y., Otsuka, Y., Ogawa, T., Asamura, K., et al. (2008). Simultaneous appearance of isolated auroral arcs and pc 1 geomagnetic pulsations at subauroral latitudes. J. Geophys. Res. Space Phys. 113. doi:10.1029/2007ja012888
Samara, M., Michell, R., Asamura, K., Hirahara, M., Hampton, D., and Stenbaek-Nielsen, H. (2010). Ground-based observations of diffuse auroral structures in conjunction with reimei measurements. Ann. Geophys. Copernic. Publ. Göttingen, Ger. 28, 873–881. doi:10.5194/angeo-28-873-2010
Samara, M., Michell, R., and Khazanov, G. V. (2017). First optical observations of interhemispheric electron reflections within pulsating aurora. Geophys. Res. Lett. 44, 2618–2623. doi:10.1002/2017gl072794
Samara, M., Michell, R. G., and Hampton, D. L. (2012). Bg3 glass filter effects on quantifying rapidly pulsating auroral structures 01, 53, 57. doi:10.4236/ars.2012.13005
Sandahl, I., Eliasson, L., and Lundin, R. (1980). Rocket observations of precipitating electrons over a pulsating aurora. Geophys. Res. Lett. 7, 309–312. doi:10.1029/gl007i005p00309
Santolík, O., Gurnett, D., and Pickett, J. (2004). Multipoint investigation of the source region of storm-time chorus. In Annales geophysicae (Copernicus Publications Göttingen, Germany), vol. 22, 2555–2563. doi:10.5194/angeo-22-2555-2004
Scourfield, M., Innes, W., and Parsons, N. (1972). Spatial coherency in pulsating aurora. Planet. Space Sci. 20, 1843–1848. doi:10.1016/0032-0633(72)90117-1
Scourfield, M., Keys, J., Nielsen, E., Goertz, C., and Collin, H. (1983). Evidence for the e× b drift of pulsating auroras. J. Geophys. Res. Space Phys. 88, 7983–7988. doi:10.1029/ja088ia10p07983
Semeter, J., Zettergren, M., Diaz, M., and Mende, S. (2008). Wave dispersion and the discrete aurora: new constraints derived from high-speed imagery. J. Geophys. Res. Space Phys. 113. doi:10.1029/2008ja013122
Smith, M., Bryant, D., and Edwards, T. (1980). Pulsations in auroral electrons and positive ions. J. Atmos. Terr. Phys. 42, 167–178. doi:10.1016/0021-9169(80)90077-x
Summers, D., Thorne, R. M., and Xiao, F. (1998). Relativistic theory of wave-particle resonant diffusion with application to electron acceleration in the magnetosphere. J. Geophys. Res. Space Phys. 103, 20487–20500. doi:10.1029/98ja01740
Tagirov, V., Ismagilov, V., Titova, E., Arinin, V., Perlikov, A., Manninen, J., et al. (1998). Auroral pulsations and accompanying vlf emissions. In Annales geophysicae (Springer), vol. 17, 66–78. doi:10.1007/s005850050737
Thorne, R. M., Ni, B., Tao, X., Horne, R. B., and Meredith, N. P. (2010). Scattering by chorus waves as the dominant cause of diffuse auroral precipitation. Nature 467, 943–946. doi:10.1038/nature09467
Torrence, C., and Compo, G. P. (1998). A practical guide to wavelet analysis. Bull. Am. Meteorological Soc. 79, 61–78. doi:10.1175/1520-0477(1998)079<0061:apgtwa>2.0.co;2
Trakhtengerts, V. Y. (1999). A generation mechanism for chorus emission. In Annales geophysicae (Springer Verlag Göttingen, Germany), vol. 17, 95–100. doi:10.1007/s00585-999-0095-4
Tsuruda, K., Machida, S., Oguti, T., Kokubun, S., Hayashi, K., Kitamura, T., et al. (1981). Correlations between the very low frequency chorus and pulsating aurora observed by low-light-level television at. Can. J. Phys. 59, 1042–1048. doi:10.1139/p81-137
Usanova, M., Ahmadi, N., Malaspina, D., Ergun, R., Trattner, K., Reece, Q., et al. (2018). Mms observations of harmonic electromagnetic ion cyclotron waves. Geophys. Res. Lett. 45, 8764–8772. doi:10.1029/2018gl079006
Usanova, M., Malaspina, D., Jaynes, A. N., Bruder, R., Mann, I. R., Wygant, J. R., et al. (2016). Van allen probes observations of oxygen cyclotron harmonic waves in the inner magnetosphere. Geophys. Res. Lett. 43, 8827–8834. doi:10.1002/2016gl070233
Yahnin, A., Popova, T., Demekhov, A., Lubchich, A., Matsuoka, A., Asamura, K., et al. (2021). Evening side emic waves and related proton precipitation induced by a substorm. J. Geophys. Res. Space Phys. 126, e2020JA029091. doi:10.1029/2020ja029091
Yahnin, A., Yahnina, T., and Frey, H. (2007). Subauroral proton spots visualize the pc1 source. J. Geophys. Res. Space Phys. 112. doi:10.1029/2007ja012501
Yahnin, A., Yahnina, T., Semenova, N., Gvozdevsky, B., and Pashin, A. (2016). Relativistic electron precipitation as seen by noaa poes. J. Geophys. Res. Space Phys. 121, 8286–8299. doi:10.1002/2016ja022765
Yamamoto, T. (1988). On the temporal fluctuations of pulsating auroral luminosity. J. Geophys. Res. Space Phys. 93, 897–911. doi:10.1029/ja093ia02p00897
Yang, B., Donovan, E., Liang, J., Ruohoniemi, J., and Spanswick, E. (2015). Using patchy pulsating aurora to remote sense magnetospheric convection. Geophys. Res. Lett. 42, 5083–5089. doi:10.1002/2015gl064700
Keywords: pulsating aurora, ground imagers, pulsation drift, inner magnetosphere, Pc-1 waves
Citation: Pandya M, Bhaskar A, Samara M, Michell R, Mirizio E, Kang S-B and Blum LW (2025) Spatio-temporal evolution of pulsating aurora observed using a ground-based imagers. Front. Astron. Space Sci. 12:1561439. doi: 10.3389/fspas.2025.1561439
Received: 15 January 2025; Accepted: 15 April 2025;
Published: 28 April 2025.
Edited by:
Raluca Ilie, University of Illinois at Urbana-Champaign, United StatesReviewed by:
Qianli Ma, Boston University, United StatesSarah Vines, Southwest Research Institute (SwRI), United States
Copyright © 2025 Pandya, Bhaskar, Samara, Michell, Mirizio, Kang and Blum. This is an open-access article distributed under the terms of the Creative Commons Attribution License (CC BY). The use, distribution or reproduction in other forums is permitted, provided the original author(s) and the copyright owner(s) are credited and that the original publication in this journal is cited, in accordance with accepted academic practice. No use, distribution or reproduction is permitted which does not comply with these terms.
*Correspondence: Megha Pandya, bWVnaGEubS5wYW5keWFAbmFzYS5nb3Y=