 Baodian Ling1
 Yushan Huang
 Junyun Huang
- 1Department of Laboratory Medicine, The First Affiliated Hospital of Gannan Medical University, Ganzhou, Jiangxi, China
- 2Department of Gastroenterology, The First Affiliated Hospital of Gannan Medical University, Ganzhou, Jiangxi, China
- 3Department of Scientific Research, The First Affiliated Hospital of Gannan Medical University, Ganzhou, Jiangxi, China
Clostridioides difficile (CD) has emerged as one of the most prevalent nosocomial infections in hospitals and is the primary causative agent of antibiotic-associated diarrhea and pseudomembranous colitis. In recent years, C. difficile-induced infections have resulted in significant morbidity and mortality worldwide, with a particularly rapid increase in incidence observed in China. C. difficile strains are categorized into toxin-producing and non-toxin-producing based on their ability to synthesize toxins, with the pathogenicity of C. difficile being strictly dependent on the protein toxins produced by the toxin-producing strains. Therefore, early and rapid identification of toxin-producing C. difficile is crucial for the diagnosis and prevention of Clostridioides difficile infection (CDI). Currently, the detection methods of C. difficile infection carried out by clinical laboratories in China mainly include C. difficile toxin-producing culture, cell culture toxin assay, toxin assay by immunological methods, glutamate dehydrogenase (GDH) assay and nucleic acid amplification assay.However, current detection methods for CDI in clinical laboratories in China exhibit significant limitations, such as being time-consuming, operationally complex, and lacking in specificity and sensitivity. Raman microspectroscopy has been shown to have the potential for rapid and reliable identification in microbial diagnostics, with the method reducing the time to results to less than 1 hour, including the processing of clinical samples, the measurement of single-cell Raman spectra, and the final diagnosis through the use of training models. In this study, we aimed to predict in situ strain identification and virulent strain identification of 24 raw clinical stool samples by constructing a reference single-cell Raman spectroscopy (SCRS) database of common intestinal flora and C. difficile, as well as a reference SCRS database of toxin-producing and non-toxin-producing C. difficile strains. The results showed that the accuracy of C. difficile strain identification in clinical stool samples was 83%, and the accuracy of virulent strain prediction was 80%. These findings suggest that Raman spectroscopy may be a viable method for the rapid in situ identification of virulent and non-virulent C. difficile strains and holds promise for clinical application in the rapid diagnosis of CDI.
1 Introduction
Clostridioides difficile (CD) is an anaerobic, Gram-positive clostridial bacillus (Antonelli et al., 2020). It is the primary pathogen responsible for antibiotic-associated diarrhea and pseudomembranous enteritis (Greenhill, 2010; Young and Hanna, 2014). The main clinical manifestation of Clostridioides difficile infection (CDI) is diarrhea, which is non-specific and can be self-limiting in mild cases. However, severe cases can present with pseudomembranous enterocolitis, toxic megacolon, intestinal perforation, and septicemia (Andersson and Hughes, 2014; Knight et al., 2015).C. difficile strains are classified into toxin-producing and non-toxin-producing categories. The toxin-producing strains harbor the tcdA and/or tcdB genes, which encode enterotoxin A and cytotoxin B (Geric et al., 2004). These toxins induce inflammatory responses and degradation of intestinal epithelial cells, leading to pseudomembrane formation (Carter et al., 2012; Rupnik and Janezic, 2016). As a conditionally pathogenic bacterium, C. difficile can cause severe infectious colitis and has high morbidity and mortality rates worldwide (Huang et al., 2009). Over the past decade, the incidence of CDI in China has shown a rapid increase. CDI is strictly dependent on the protein toxins produced by toxin-producing C. difficile (Slimings and Riley, 2014). Therefore, the rapid identification of toxin-producing strains and early diagnosis of CDI are of paramount importance for the effective diagnosis, treatment, and prevention of the disease.
The diagnosis of CDI is based on clinical symptoms (diarrhea without other identifiable causes) and the detection of toxin-producing C. difficile in stool samples using various microbiological examination methods. Currently, clinical laboratories in China primarily utilize methods such as C. difficile toxin-producing culture, cell culture toxin assays, immunological toxin assays, glutamate dehydrogenase (GDH) assays, and nucleic acid amplification tests. However, these methods have obvious limitations (Koya et al., 2019). Clostridioides difficile is difficult to culture and has a long period of time with low sensitivity; cytotoxicity assay is complicated, time-consuming and expensive (Planche and Wilcox, 2011); enzyme-linked immunoassay is not sensitive enough (Perelle et al., 1997; Carter et al., 2007) and is easily interfered with by the quality of specimens (Sakamoto et al., 2018); glutamate dehydrogenase (GDH) assay is usually used as a primary screening test for CDI diagnosis in the laboratory (Crobach et al., 2016);PCR method is specific, sensitive and fast, but it is difficult to be widely used under resource-limited conditions because of its cumbersome operation steps, dependence on expensive equipment and the need for specialized personnel to operate it. Additionally, the complex composition of stool samples can easily interfere with test results. Consequently, the development of novel, rapid, simple, accurate, and sensitive methods for detecting C. difficile is of paramount importance for the effective diagnosis of CDI.
Raman scattering was discovered by the Indian physicist Chandrasekhara Venkata Raman (C. V. Raman) in 1928 (Raman and Krishnan, 1928). This technique allows for the analysis of molecular structures based on the vibrational and rotational information of scattered spectra (Mosier-Boss, 2017; Tao et al., 2017). In recent years, Raman spectroscopy (RS) has rapidly developed in the field of microbiology as an emerging method for the identification of bacterial infections.RS is a rapid, non-destructive, label-free biochemical phenotyping technique (Huang et al., 2004; Huang et al., 2010; Li et al., 2012). It provides information on the unique molecular fingerprints of bacteria (Kanno et al., 2021), including nucleic acids, proteins, carbohydrates, lipids, and pigments (Flemming and Wingender, 2010), which are used to characterize the genotypes, phenotypes, and physiological states of microorganisms, thus identifying the microbial samples with a high degree of specificity (Kirchhoff et al., 2018; Ho et al., 2019; Xu et al., 2019; Uysal Ciloglu et al., 2020; Wang et al., 2021). Its labeling-free feature reduces sample destruction and complex pre-processing steps, while the detection process is rapid, usually within minutes, making it suitable for rapid screening and real-time monitoring (Xu et al., 2023). In addition, Raman spectroscopy requires less sample volume and only a trace amount of sample to be analyzed, which is particularly suitable for precious or limited samples, and is non-destructive, so that the sample can be retained after detection for subsequent analysis or research. Its wide applicability enables it to be applied to a wide range of sample forms, such as liquid and solid (Kloß et al., 2015; Liu et al., 2023; Xu et al., 2023), showing strong adaptability.
In this study, we screened 24 raw stool samples from clinical sources, confirmed by multiplex PCR, including 8 samples containing toxin-producing C. difficile, 5 containing non-toxin-producing C. difficile, and 11 without C. difficile. Additionally, 12 C. difficile strains were isolated and cultured from these clinical samples, comprising 6 toxigenic and 6 non-toxigenic strains (see Figure 1). By establishing a single-cell Raman spectroscopy (SCRS) database for C. difficile, we identified C. difficile in situ within the stool samples using Raman spectroscopy, distinguishing between toxin-producing and non-toxin-producing strains. The results demonstrated that the bacterial classification accuracy was 100% for isolated samples, 83% for clinical samples, 85% for isolated samples of toxin-producing and non-toxin-producing strains, and 80% for clinical samples of toxin-producing and non-toxin-producing strains. This study indicates that SCRS, with the assistance of deep learning algorithms, can achieve rapid and accurate identification of bacterial strains and effectively differentiate between virulent and non-virulent strains. This capability facilitates the rapid diagnosis, screening, and treatment of CDI, thereby mitigating its spread and enhancing public health.
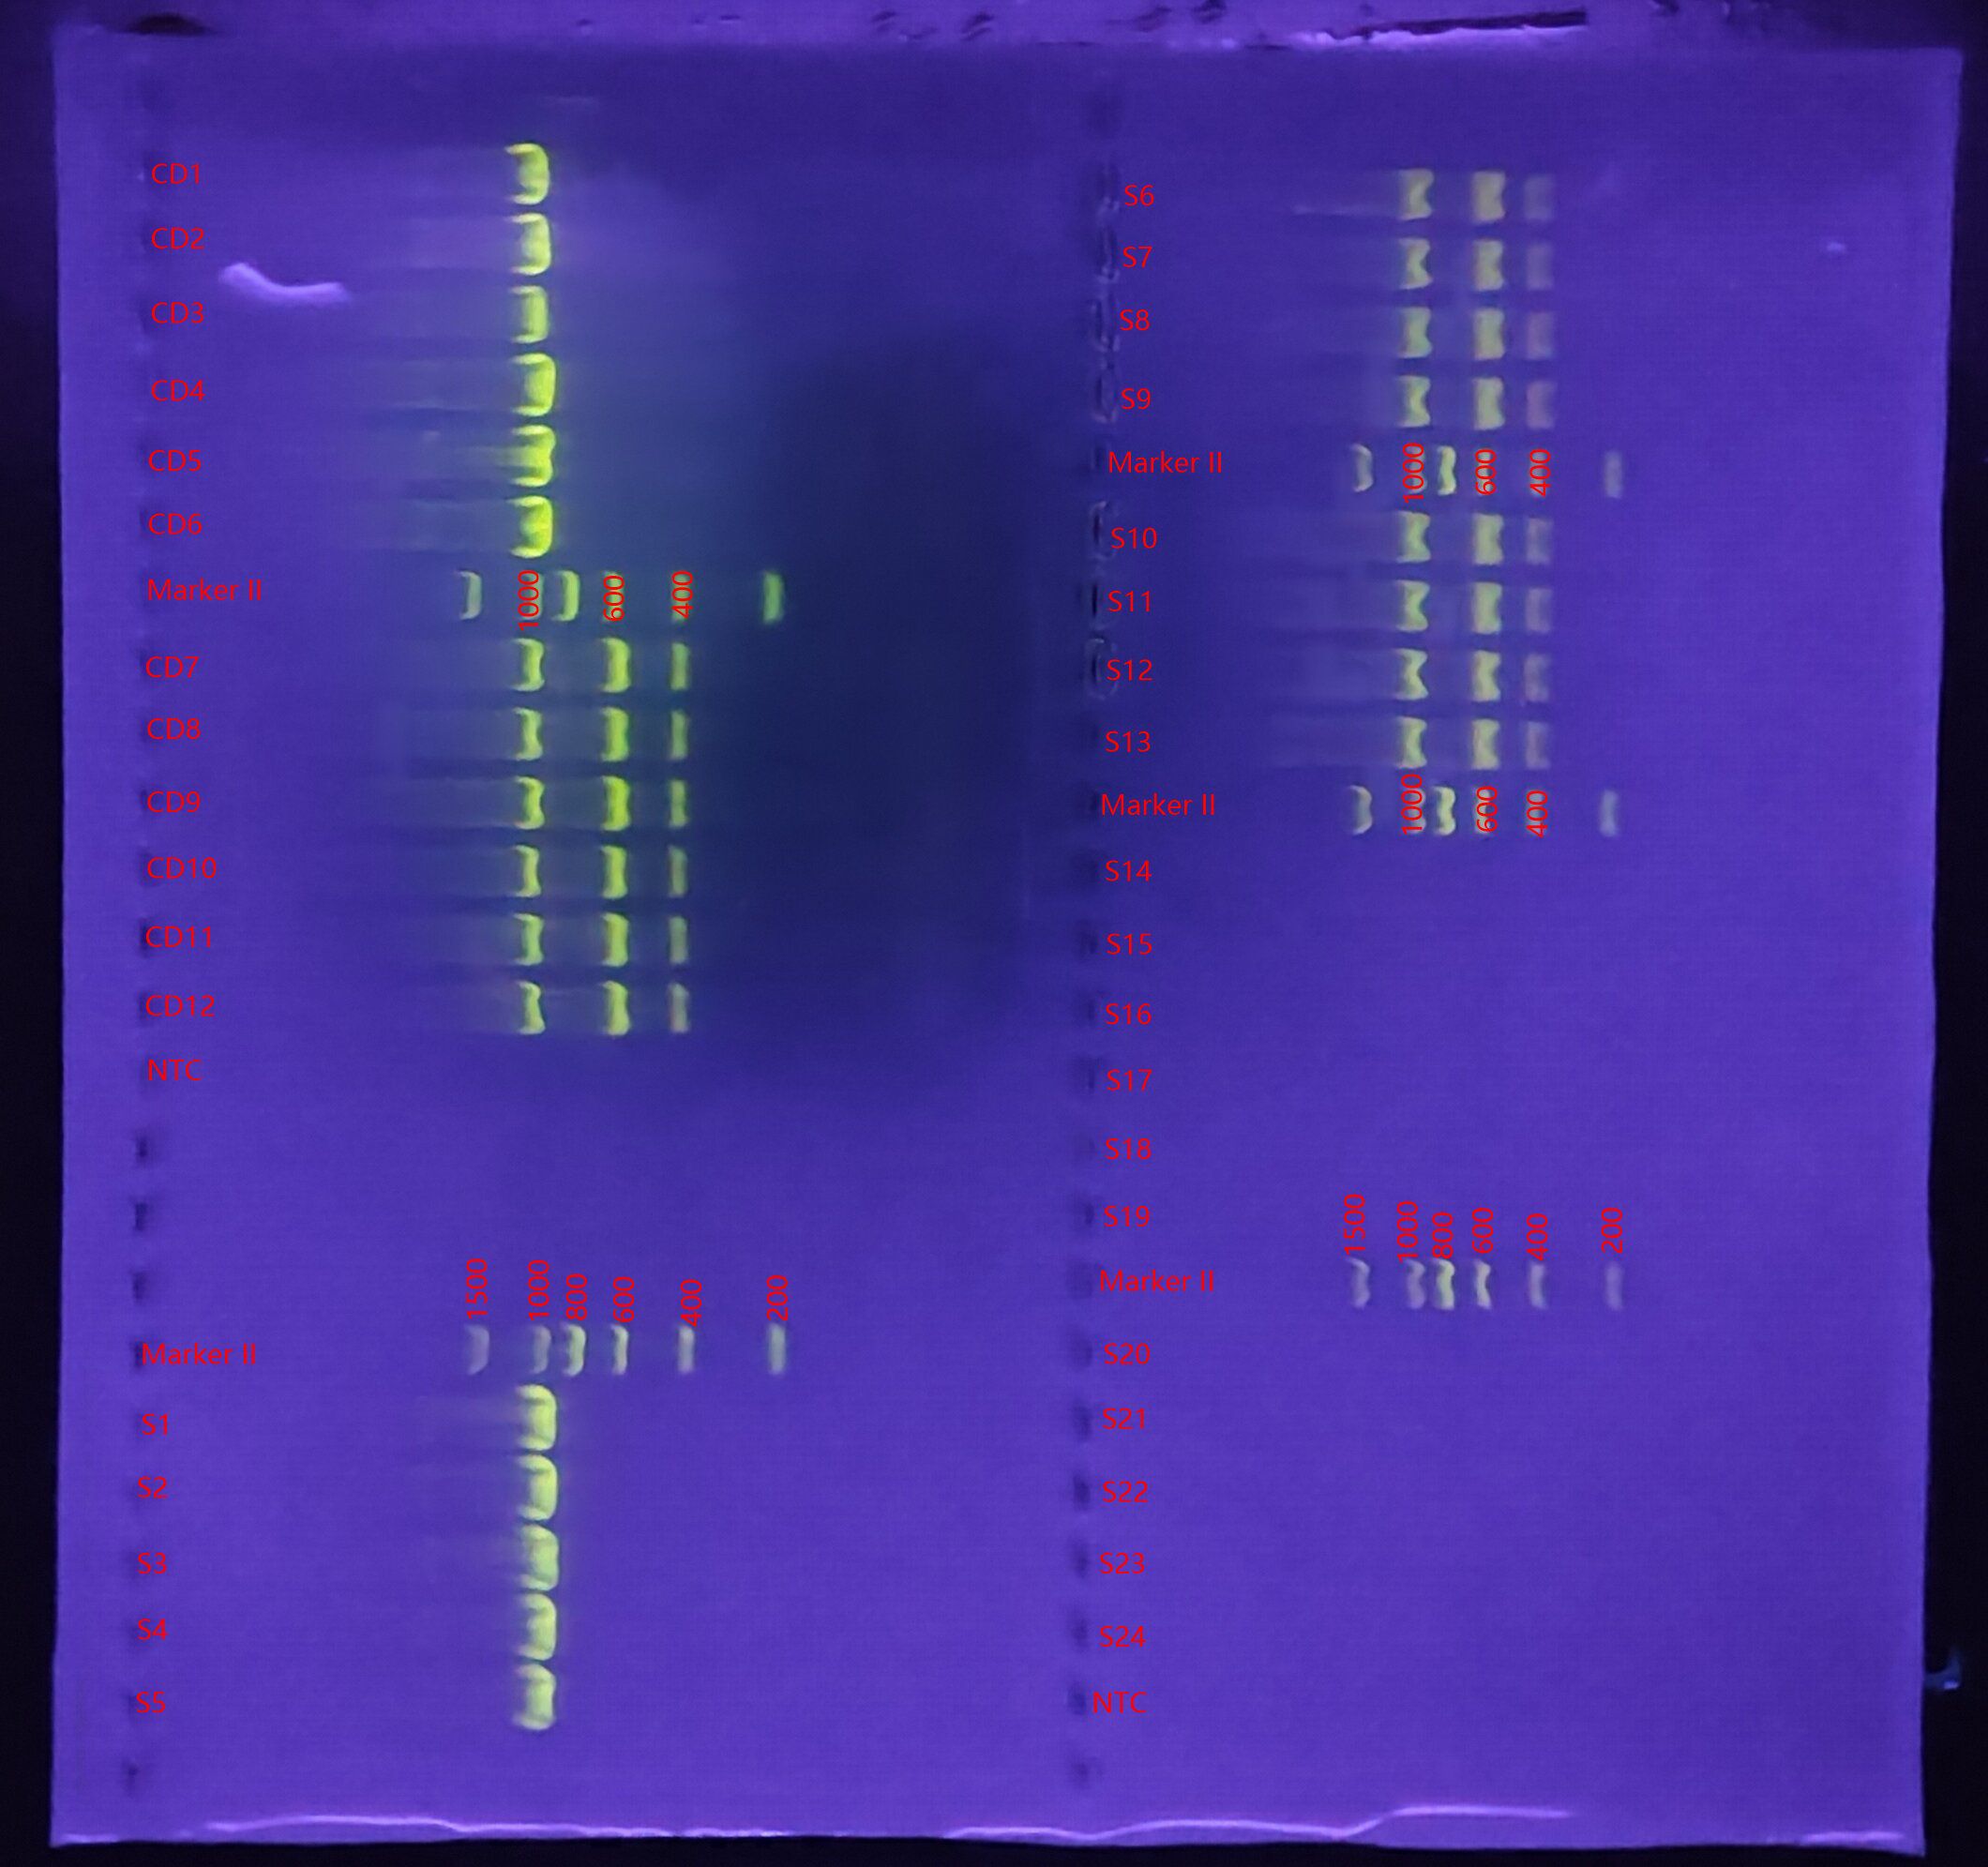
Figure 1. Genetic mapping of Clostridioides difficile toxins in selected C. difficile strains and fecal specimens. CD, Clostridioides difficile; S, stool; NTC, negative control; Marker:6 Each stripe is 200,400,600,800,1000,1500bp;S1-S13:CD+; S14-S24:CD-; S1-S5:tcdA-, tcdB-; S6-S13:tcdA+, tcdB+; CD1-CD6:tcdA-, tcdB-; CD7-CD12:tcdA+, tcdB+.
2 Materials and methods
2.1 Strains and stool samples
Ten strains of common intestinal bacteria and 12 strains of C. difficile were collected from the First Affiliated Hospital of Gannan Medical University. All strains were identified using MALDI-TOF MS (Bruker, Germany), as listed in Table 1. The C. difficile strains included 6 toxin-producing strains harboring the tcdA and/or tcdB genes, and 6 non-toxin-producing strains. The presence of the toxin A (tcdA) and toxin B (tcdB) genes in C. difficile was confirmed using multiplex PCR. Bacterial DNA from the C. difficile strains was extracted using the heat-excitation method, followed by amplification of the tcdA and tcdB toxin genes. The PCR cycles were performed under the following conditions: initial denaturation at 94°C for 5 minutes, followed by 32 cycles of denaturation at 94°C for 30 seconds, annealing at 56°C for 30 seconds, extension at 72°C for 1 minute, and a final extension at 72°C for 10 minutes. The PCR products were separated by agarose gel electrophoresis at 2.0% (180V, 80mA, 18 minutes), and the results were subsequently analyzed. The primers were obtained from S. Persson et al (Persson et al., 2008), and those used for the identification of C. difficile toxin genes were provided by Shanghai Sangong Bioengineering Co.
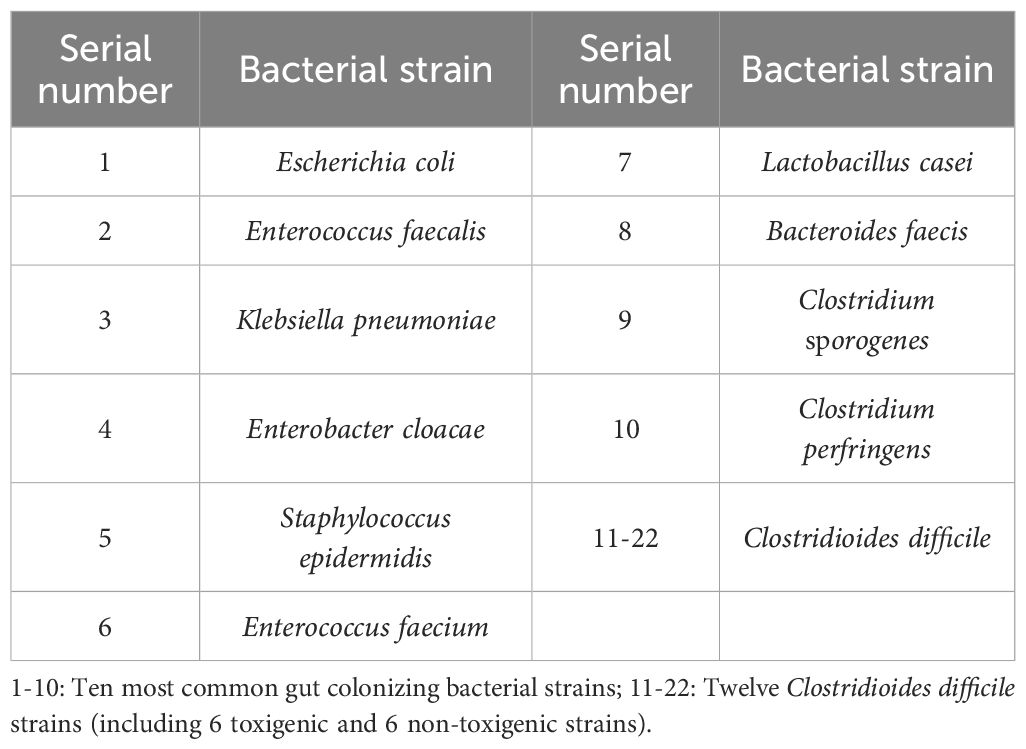
Table 1. Strain list.
Stool samples with suspected C. difficile infection were collected and cultured on C. difficile selective medium CCFA. Yellow colonies with rough surfaces and uneven edges were selected for strain identification using MALDI-TOF MS. Simultaneously, the toxin A (tcdA) and toxin B (tcdB) genes of C. difficile were determined by multiplex PCR. A total of 24 stool samples were screened, including 8 containing toxin-producing C. difficile, 5 containing non-toxin-producing C. difficile, and 11 containing no C. difficile. The results are shown in Figure 1.
2.2 Sample preparation
C. difficile strains were inoculated in CCFA medium and incubated in an anaerobic environment at 35°C for 24 hours. Bacteroides faecis, Clostridium perfringens, Lactobacillus casei, and Clostridium sporogenes strains were inoculated in anaerobic blood agar medium and also incubated in an anaerobic environment at 35°C for 24 hours. Escherichia coli, Enterococcus faecalis, Klebsiella pneumoniae, Enterobacter inguinalis, and Staphylococcus epidermidis strains were inoculated in Columbia blood agar and incubated in a carbon dioxide environment at 35°C for 24 hours. The pure colonies were isolated from the culture medium and resuspended in 5 mL of tryptic soy broth (TSB) by vortex mixing, followed by grinding against the test tube wall to remove any residual medium.1 mL of the bacterial suspension was centrifuged at 7000 rpm for 2 minutes, the supernatant was discarded, and the pellet was washed three times with sterile water to eliminate impurities and background material. Subsequently, 500 μL of sterile deionized water was added to the pellet, and the suspension was vortex-mixed to resuspend the bacterial cells. The bacterial concentration was adjusted to approximately 106-108 CFU/mL to ensure sufficient Raman signal intensity. A 2 μL aliquot of the suspension was placed on an aluminum-coated Raman microscope slide and air-dried by gently blowing sterile air for 5 minutes to form a homogeneous thin film suitable for spectroscopic analysis.
An appropriate amount of stool sample (approximately 0.5–1 g) was placed into a sterile centrifuge tube, and 10 times the volume of sterile water was added. The mixture was thoroughly homogenized using a vortex shaker until the feces were completely suspended, forming a homogeneous suspension. The suspension was then filtered through a sterile 100 μm filter to remove large particles, such as undigested food and fibers. The filtrate was collected and transferred to a new sterile centrifuge tube. The filtrate was centrifuged at medium speed (3000 × g for 5 minutes) to remove remaining large particles and cellular debris. The supernatant was collected and transferred to a new sterile centrifuge tube for further use. The supernatant was then subjected to high-speed centrifugation (8000 × g for 3 minutes), and the resulting supernatant was discarded, leaving the microbial pellet. This pellet was washed three times with sterile water to remove impurities and background material. Finally, 500 μL of sterile deionized water was added to the microbial sediment, which was vortex-mixed to resuspend the bacterial particles. A 2 μL aliquot of the suspension was then placed on an aluminum-coated Raman microscope slide and air-dried by gently blowing sterile air for 5 minutes, allowing the sample to form a homogeneous thin film suitable for spectroscopic analysis.
2.3 Raman data sets, single-cell Raman measurements and preprocessing
A total of 68 independent biological replicates were conducted in this study. To ensure the accuracy of the results, random sampling was employed to collect over 100 single-cell spectra for each sample, yielding a total of 6483 SCRS fingerprints.
Single-cell Raman spectra were acquired using a WITec Alpha300R Raman microspectrometer (WITec, Germany). The instrument was automatically calibrated in silico prior to each measurement, with the calibration peak set to 520 cm-1. For the WITec spectrometer, a 532 nm laser was focused onto the sample with a 100× objective(100×/NA = 0.9, ZEISS, Germany) with a power of approximately 15 mW on the sample. Cells were measured with a grating of 600 mm/g, spectral range of 331–3500 cm−1, and the spectral center set at 1700 cm−1. The Raman acquisition time was 7 s each cell. During measurements of cells that have a larger size compared to the laser spot size, the laser spot was made slightly out-of-focused to cover as much of the whole cell area. The same system was used for all collections, with consistent power settings and integration time to ensure the quality and comparability of the plots.
Preprocessing for the raw Raman spectra included quality control for eliminating abnormally/burnt high-intensity spectra, cosmic ray correction, baseline fitting (polyline fitting, degree at 8, 88 points) and subtraction for autofluorescence removal. The entire spectral area was area normalized so that the sum of all intensities equaled one to account for general instrumentation variability as well as sample and experimental factors without significantly changing the biological content. All model analyses were conducted using Python 3.9. The libraries utilized included, but were not limited to, SciPy for statistical tools, scikit-learn for machine learning models, TensorFlow and PyTorch for deep learning models, and Matplotlib and Seaborn for data visualization.
3 Result
3.1 Clostridioides difficile strain identification
To establish a SCRS-based method for the rapid identification of C. difficile directly under the microscope, we first developed a reference SCRS database comprising 12 different bacterial strains representing the most common colonizers of the intestinal tract, including 2 strains of C. difficile. To assess the ability of Raman spectroscopy to distinguish C. difficile within the species, we included other closely related clostridia, specifically Clostridium sporogenes and Clostridium perfringens. The list of strains is provided in Table 1. More than 100 single cells were measured for each strain, resulting in a total of 1,623 single-cell Raman spectra across the 12 bacterial strains. We grouped the strains into seven categories by family, namely Enterobacteriaceae, Enterococcaceae, Staphylococcillaceae, Lactobacillaceae, Bacteroidaceae, Clostridiaceae and Peptostreptococcacea.The average Raman spectra for these seven classes of pathogenic bacteria are presented in Figure 2. The figure shows that the Raman spectrum of C. difficile exhibits multiple characteristic peaks in the range of 1000–1600 cm-¹, especially the peaks near 1002 cm-¹, 1578 cm-¹ and 1662 cm-¹, which may be related to C. difficile’s protein secondary structure (e.g., α-helix and β-folding), cell wall components, pigments, and metabolites, and these characteristic peaks distinguish its Raman spectrum from other bacteria (Gelder et al., 2007). The spectral dataset was divided into a training set (80%) and a test set (20%) for classification purposes. Unsupervised t-SNE visualization with low-dimensional observed data showed that the cells of Enterobacteriaceae, Enterococcaceae, Staphylococcaceae, Lactobacillaceae, Bacteroidaceae, Clostridiaceae and Peptostreptococcacea cells formed obvious clusters in two-dimensional space, which could be effectively differentiated with high intra- and inter-group consistency (Figure 3). Linear discriminant analysis (LDA) dimensionality reduction visualization of Raman spectroscopic data demonstrated partial separability among the bacterial families Enterobacteriaceae, Enterococcaceae, Staphylococcaceae, Lactobacillaceae, Bacteroidaceae, Clostridiaceae, and Peptostreptococcaceae (Figure 4).
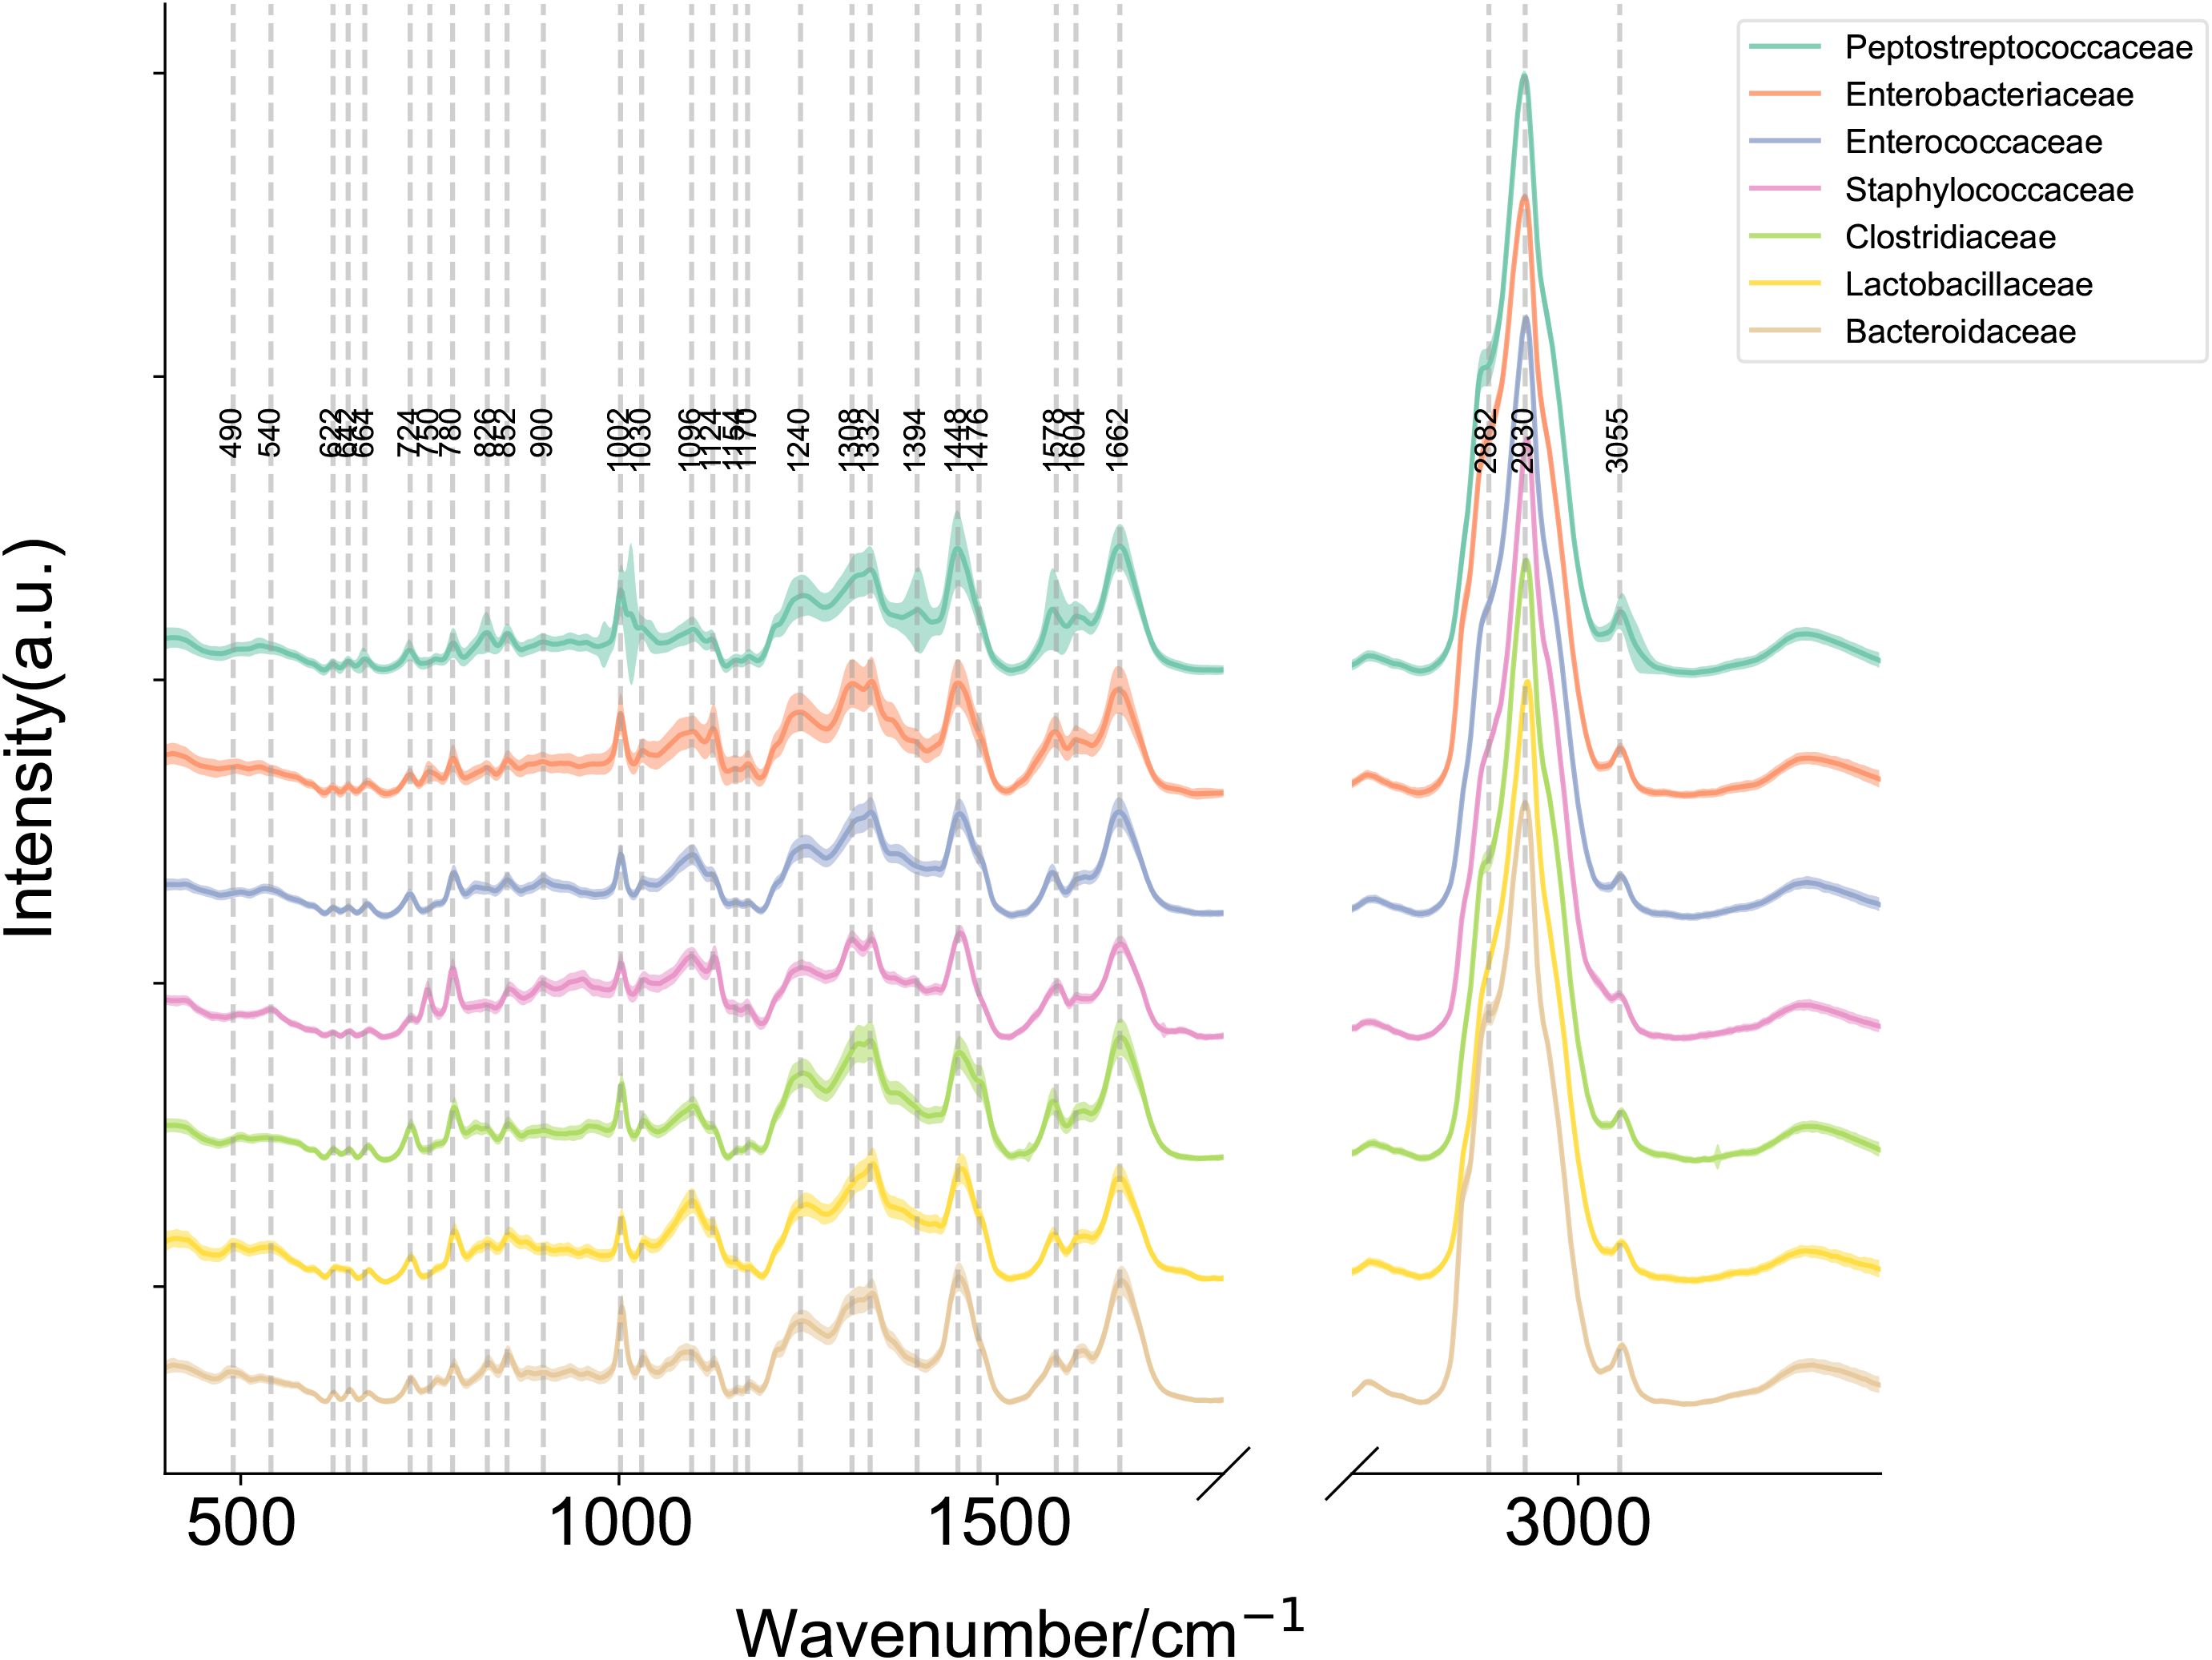
Figure 2. Raman plot for each label with mean and standard deviation. Mean Raman spectra of Enterobacteriaceae, Enterococcaceae, Staphylococcaceae, Lactobacillaceae, Bacteroidaceae, Clostridiaceae and Peptostreptococcaceae (Note: Clostridioides difficile has been reclassified within the family Peptostreptococcaceae under current taxonomic revisions, diverging from its historical classification in Clostridiaceae.). The shaded area around each spectrum indicates the standard deviation of the single-cell measurements. (Note: The silent region of Raman spectra (1800–2800 cm-1) was omitted from display.).
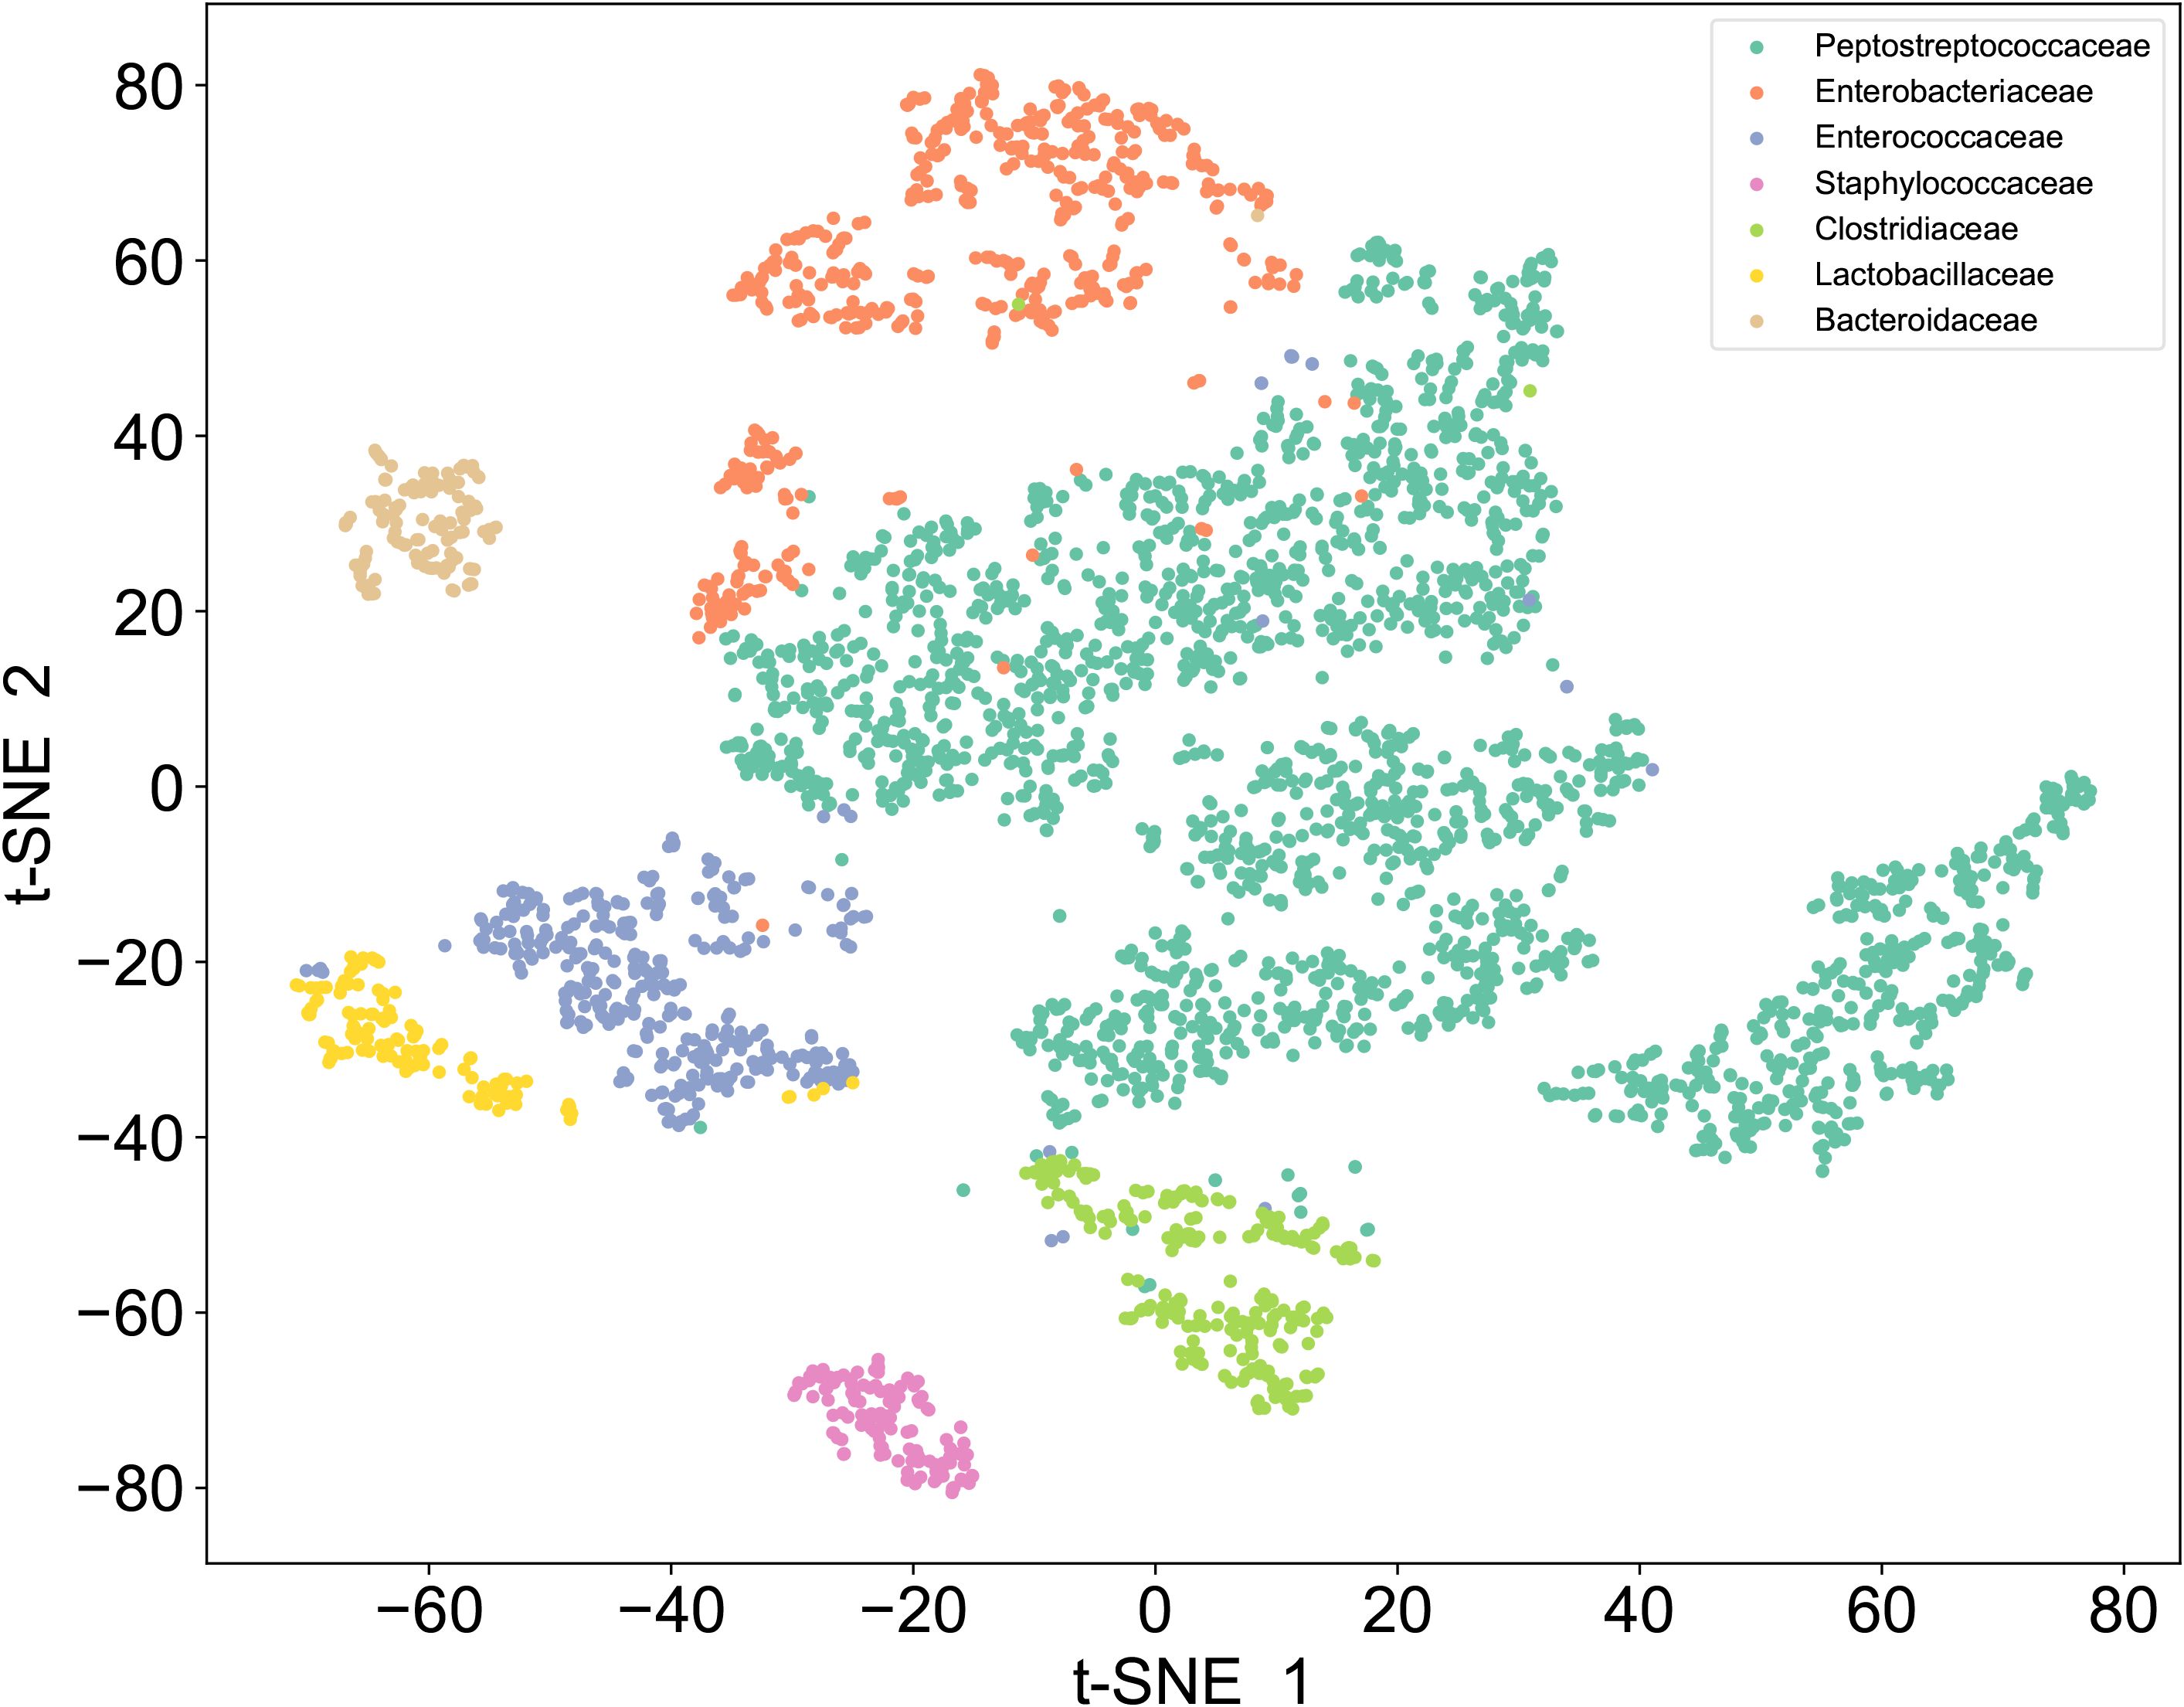
Figure 3. t-SNE of Raman dataset. Unsupervised t-SNE visualization of single-cell Raman spectra reveals seven distinct clusters corresponding to Enterobacteriaceae, Enterococcaceae, Staphylococcaceae, Lactobacillaceae, Bacteroidaceae, Clostridiaceae, and Peptostreptococcaceae.
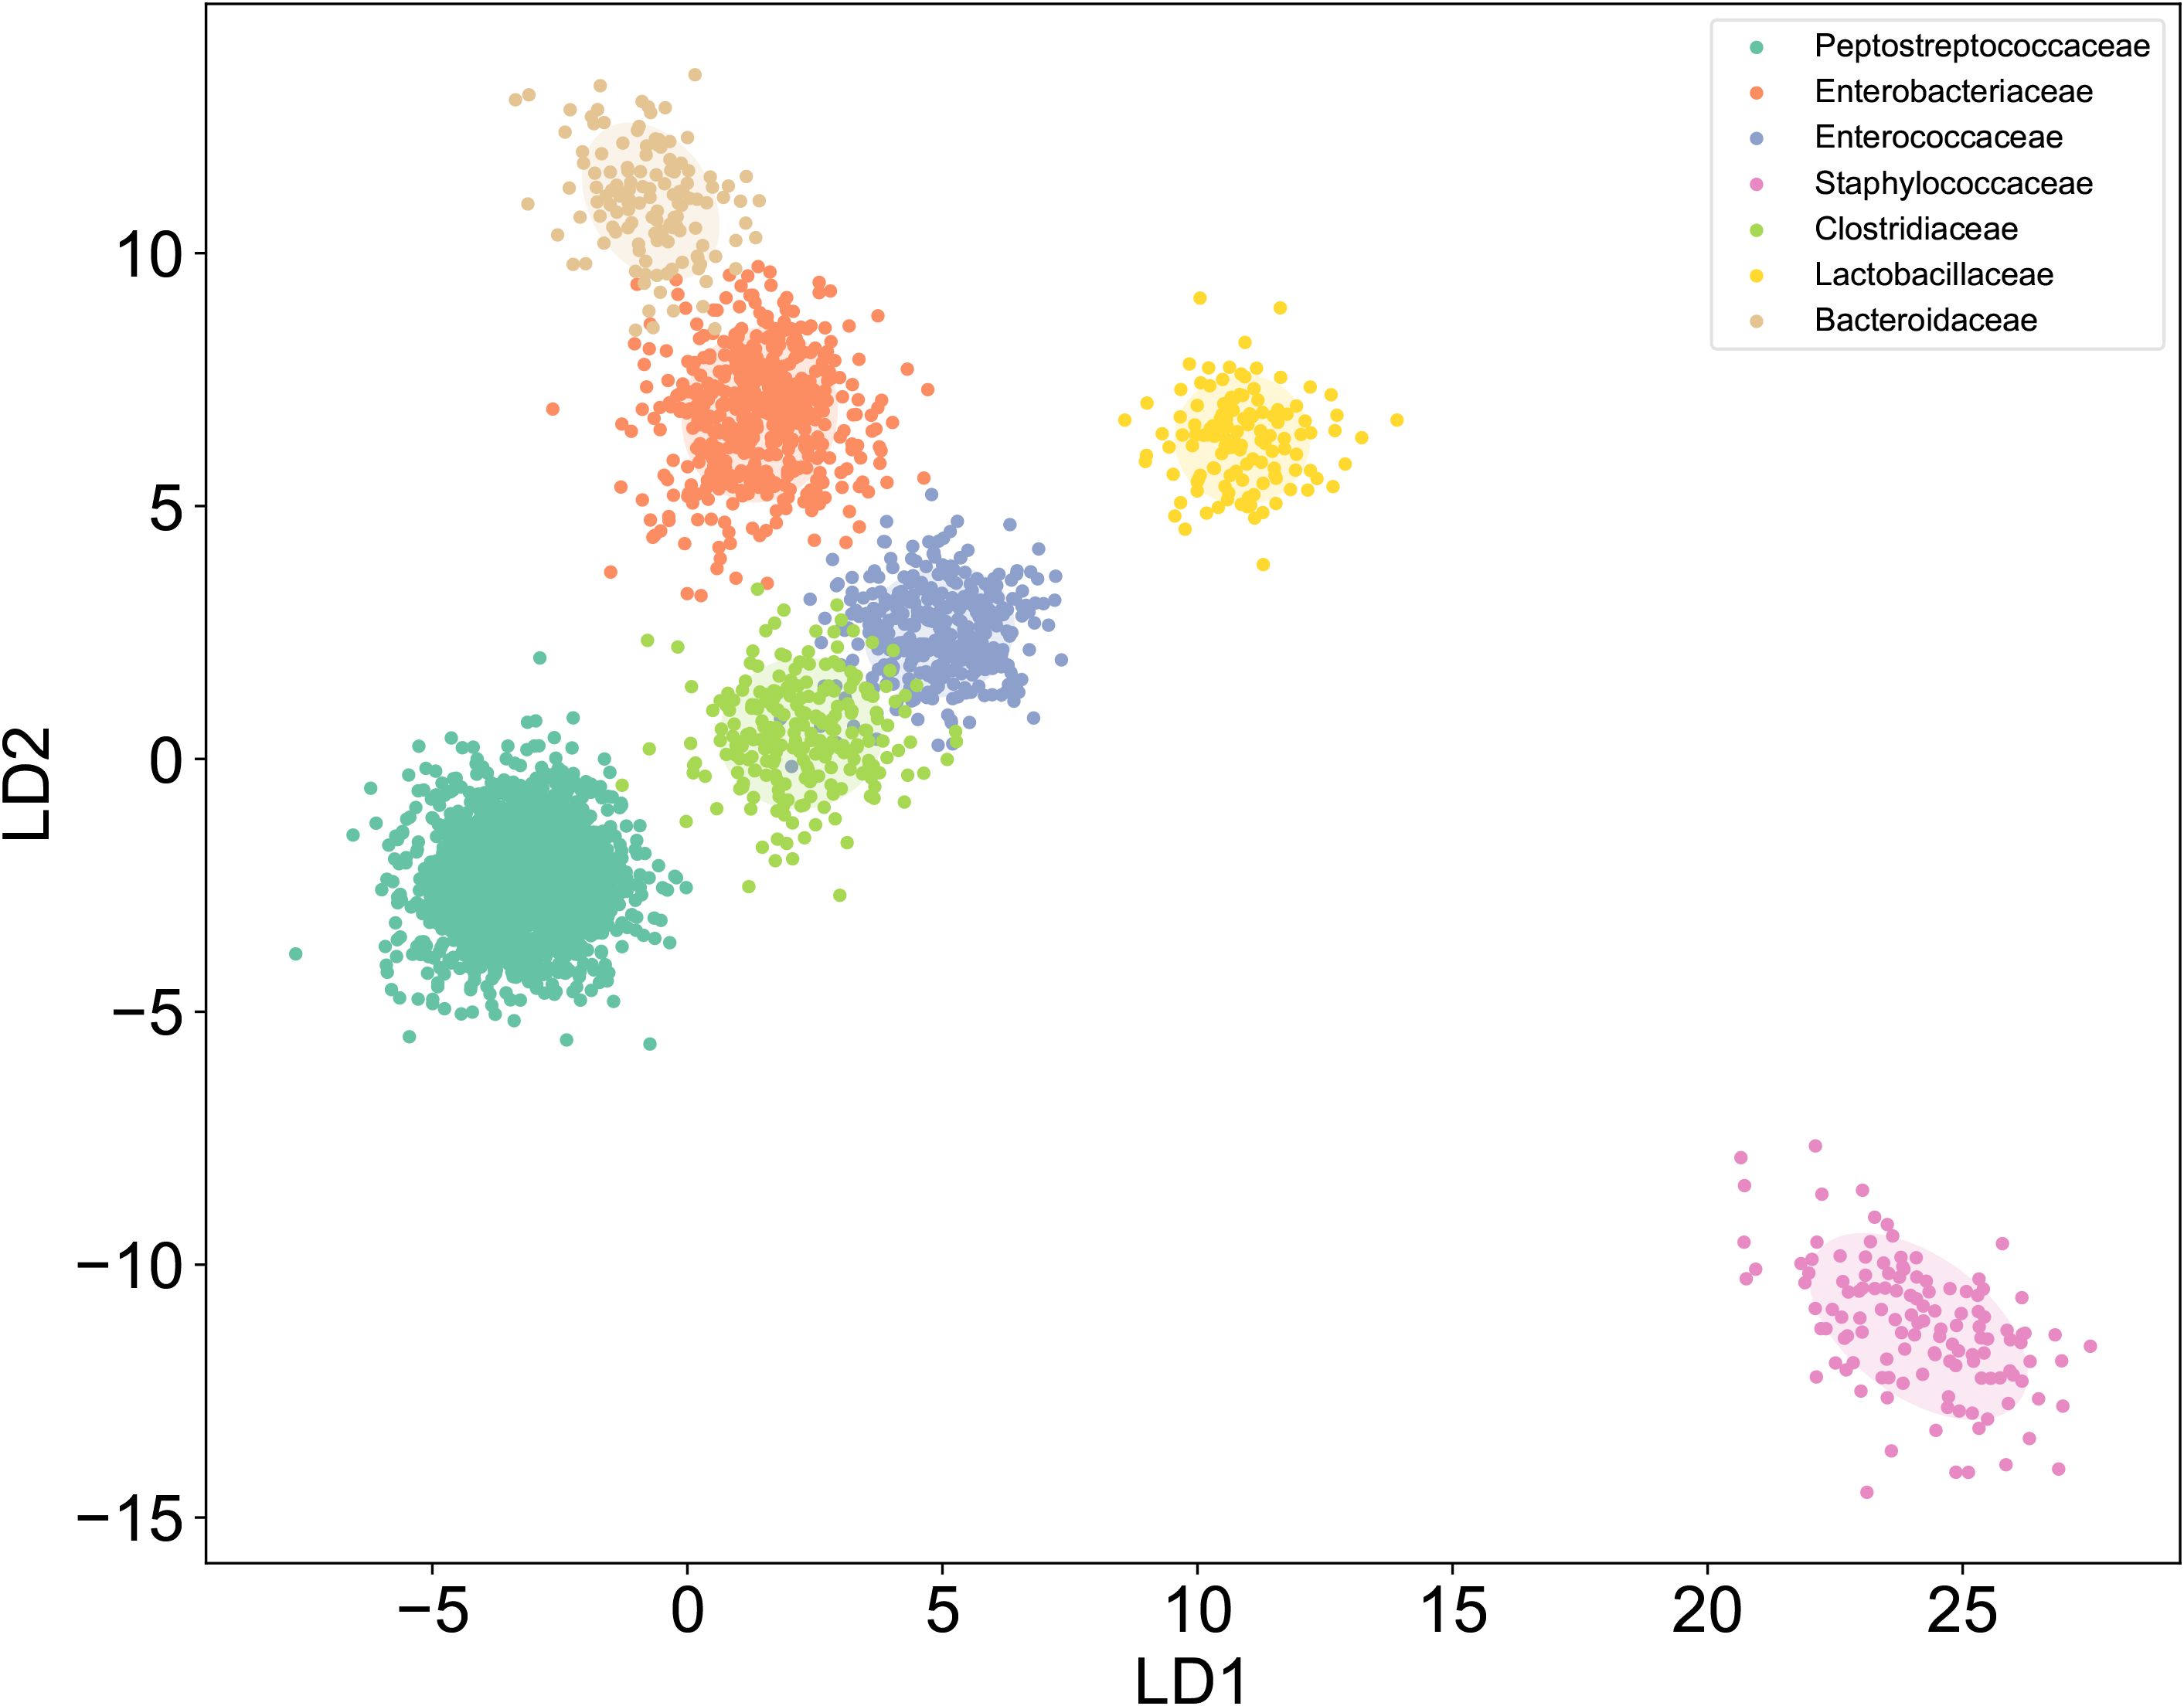
Figure 4. LDA of Raman dataset. Raman spectroscopy coupled with LDA dimensionality reduction showed distinguishable clustering patterns for seven bacterial families: Enterobacteriaceae, Enterococcaceae, Staphylococcaceae, Lactobacillaceae, Bacteroidaceae, Clostridiaceae, and Peptostreptococcaceae..
To evaluate the performance of a database identification model constructed based on a single-cell Raman mapping library of pure strains in identifying C. difficile strains, we tested it with 10 clinical isolates, including 5 C. difficile strains (each derived from a different patient) and 5 other intestinal strains. Additionally, we compared 10 different data analysis methods, all of which demonstrated high accuracy, sensitivity, and specificity (see Table 2; Figure 5A). This indicates that a database developed from purified strains can be effectively applied to the identification of clinical isolates samples, reliably distinguishing clinically prevalent C. difficile strains from other similar strains.
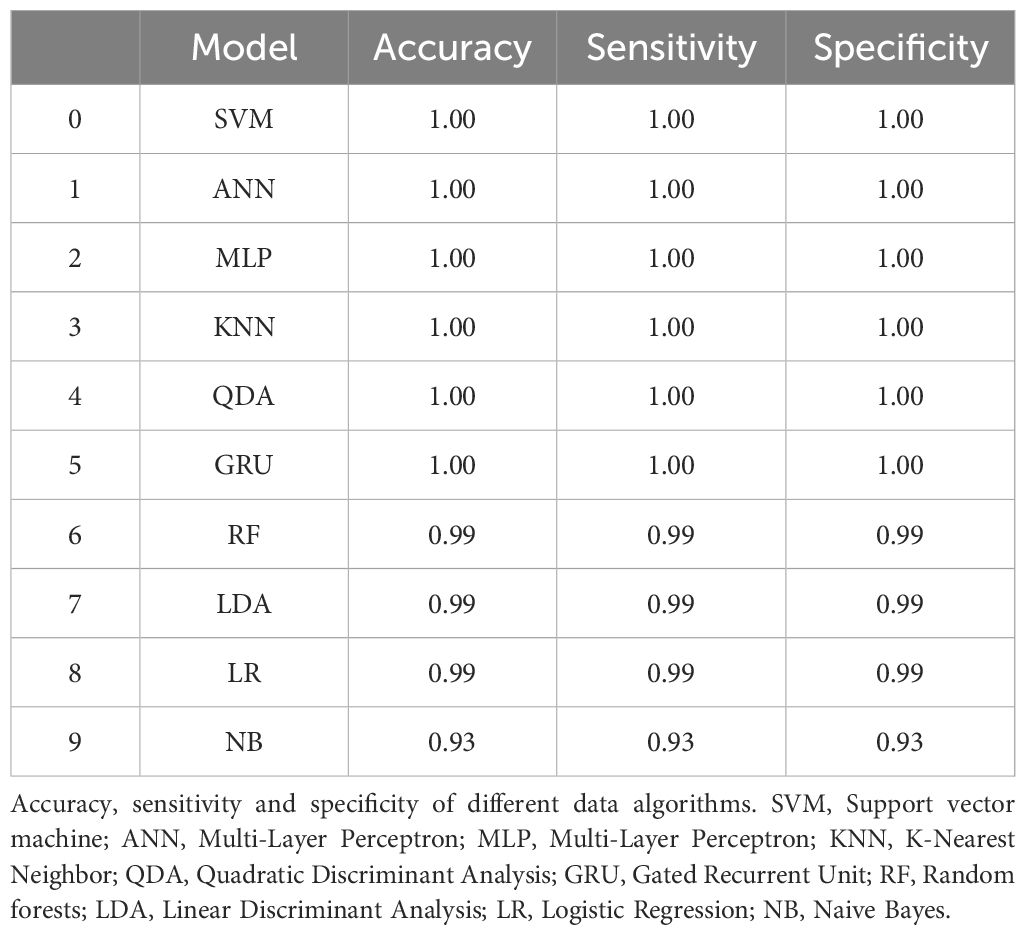
Table 2. Comparative evaluation of accuracy, sensitivity, and specificity across computational algorithms for discriminating clinically isolated Clostridioides difficile strains from non-C. difficile strains.
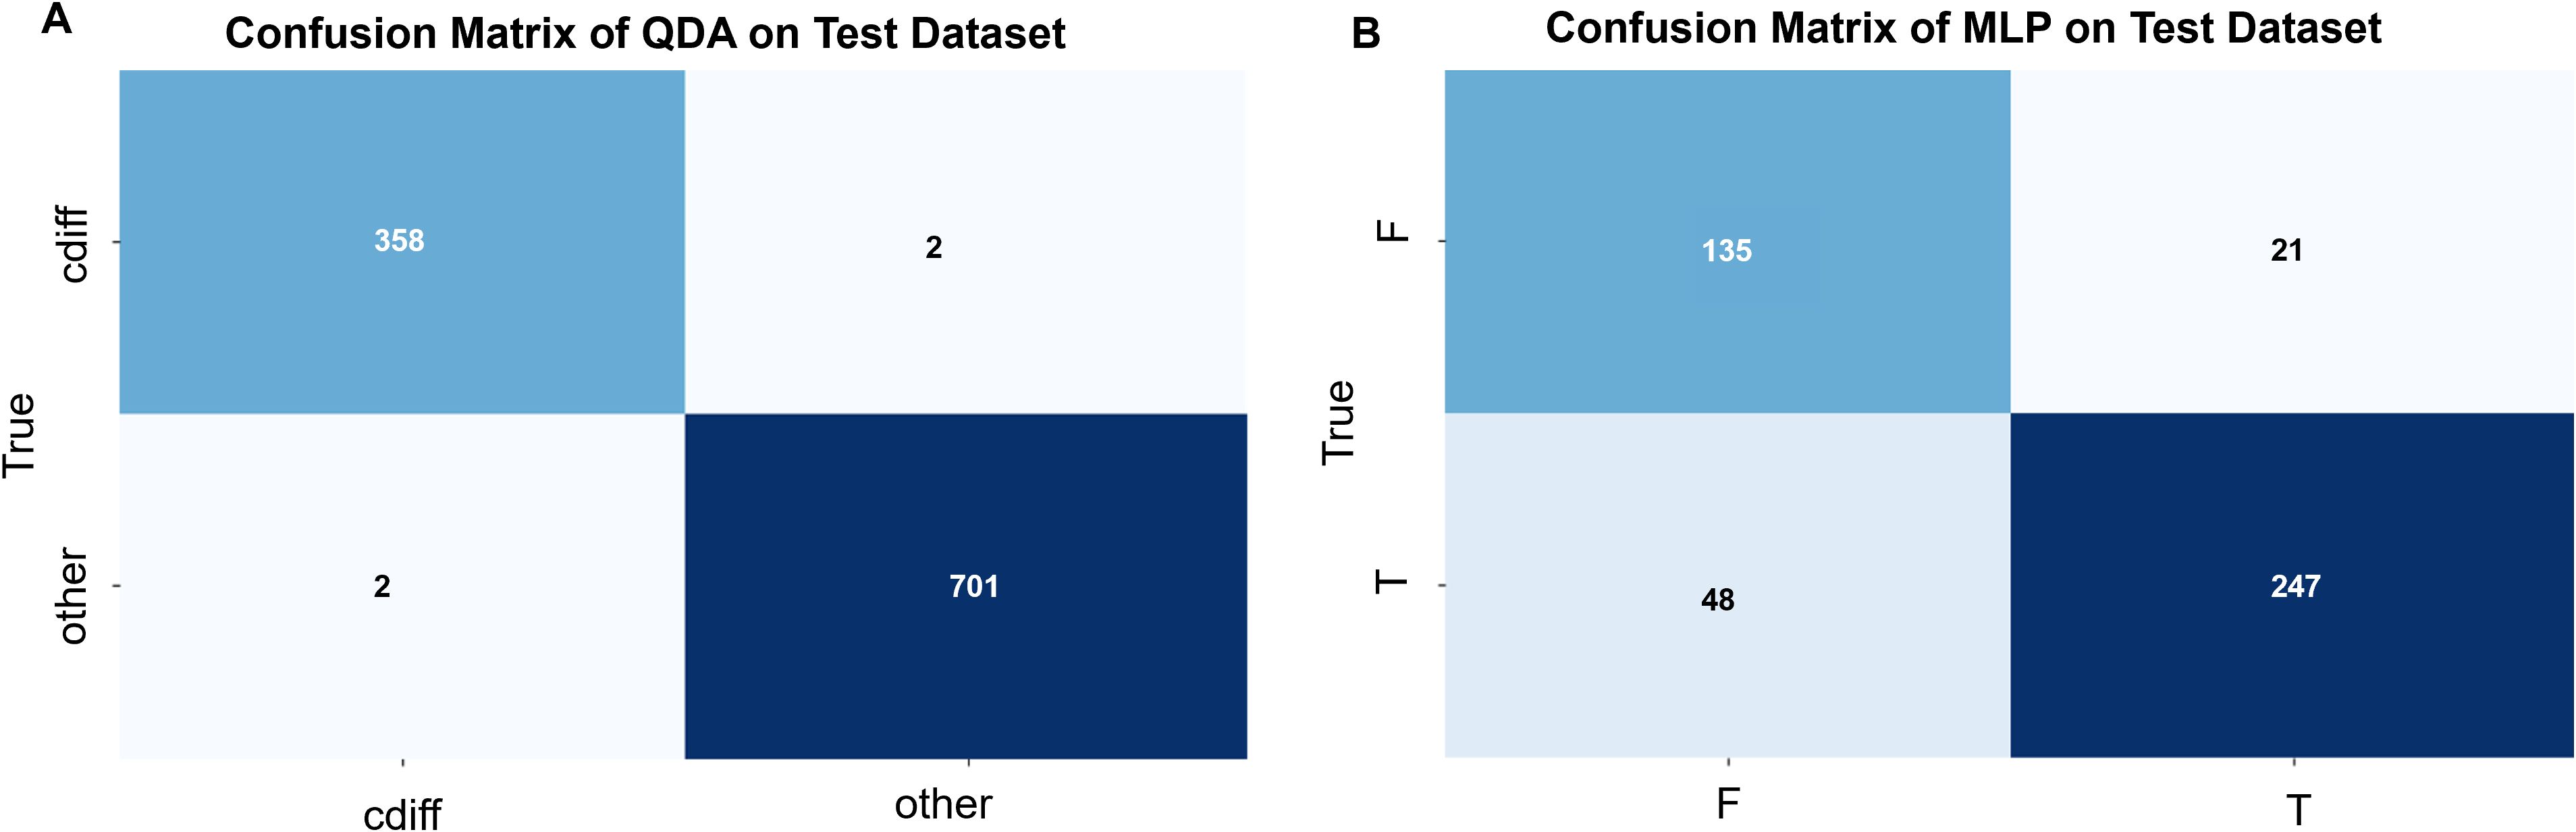
Figure 5. (A) Confusion matrix for QDA (Quadratic Discriminant Analysis) modeling (by plot): The C. difficile strain identification model was validated using 5 strains of C. difficile and 5 strains of other enteric bacteria. A total of 360 single-cell Raman spectra were obtained from the 5 C. difficile strains, of which 358 were correctly identified, while 2 spectra were misclassified as other bacteria. Similarly, 703 single-cell Raman spectra were obtained from the 5 strains of other enteric bacteria, of which 701 were correctly identified, and 2 spectra were misclassified as C. difficile. The overall prediction accuracy of the model was 0.99. (B) Confusion matrix for MLP (Multi-Layer Perceptron) modeling (by plot): The C. difficile strain identification model was validated using 1 strain each of toxin-producing and non-toxin-producing C. difficile. A total of 295 single-cell Raman spectra were obtained from the toxin-producing C. difficile, of which 247 spectra were correctly identified, while 48 spectra were misclassified as non-toxin-producing C. difficile. Similarly, 156 single-cell Raman spectra were obtained from the non-toxin-producing C. difficile, of which 135 spectra were correctly identified, while 21 spectra were misclassified as toxin-producing C. difficile. The overall prediction accuracy of the model was 0.85.
3.2 Clostridioides difficile toxin identification
Since C. difficile includes both toxin-producing and non-toxin-producing strains, and its pathogenicity is strictly dependent on the protein toxins produced by the toxin-producing strains, we aimed to develop a SCRS-based method capable of rapidly identifying toxin-producing and non-toxin-producing strains of C. difficile directly under the microscope. We first established a reference SCRS database comprising 5 toxin-producing and 5 non-toxin-producing strains of C. difficile. The average Raman spectra of these two types of C. difficile are presented in Figure 6. The figure shows that toxin-producing strains may have different peak intensities in the 500–600 cm-¹ (sulfide-related peaks), 1600–1700 cm-¹ (amide I band), and 2800–3000 cm-¹ (CH2/CH3 stretching) regions due to the active toxin synthesis pathway and the presence of toxin proteins vibration) regions with different peak intensities.
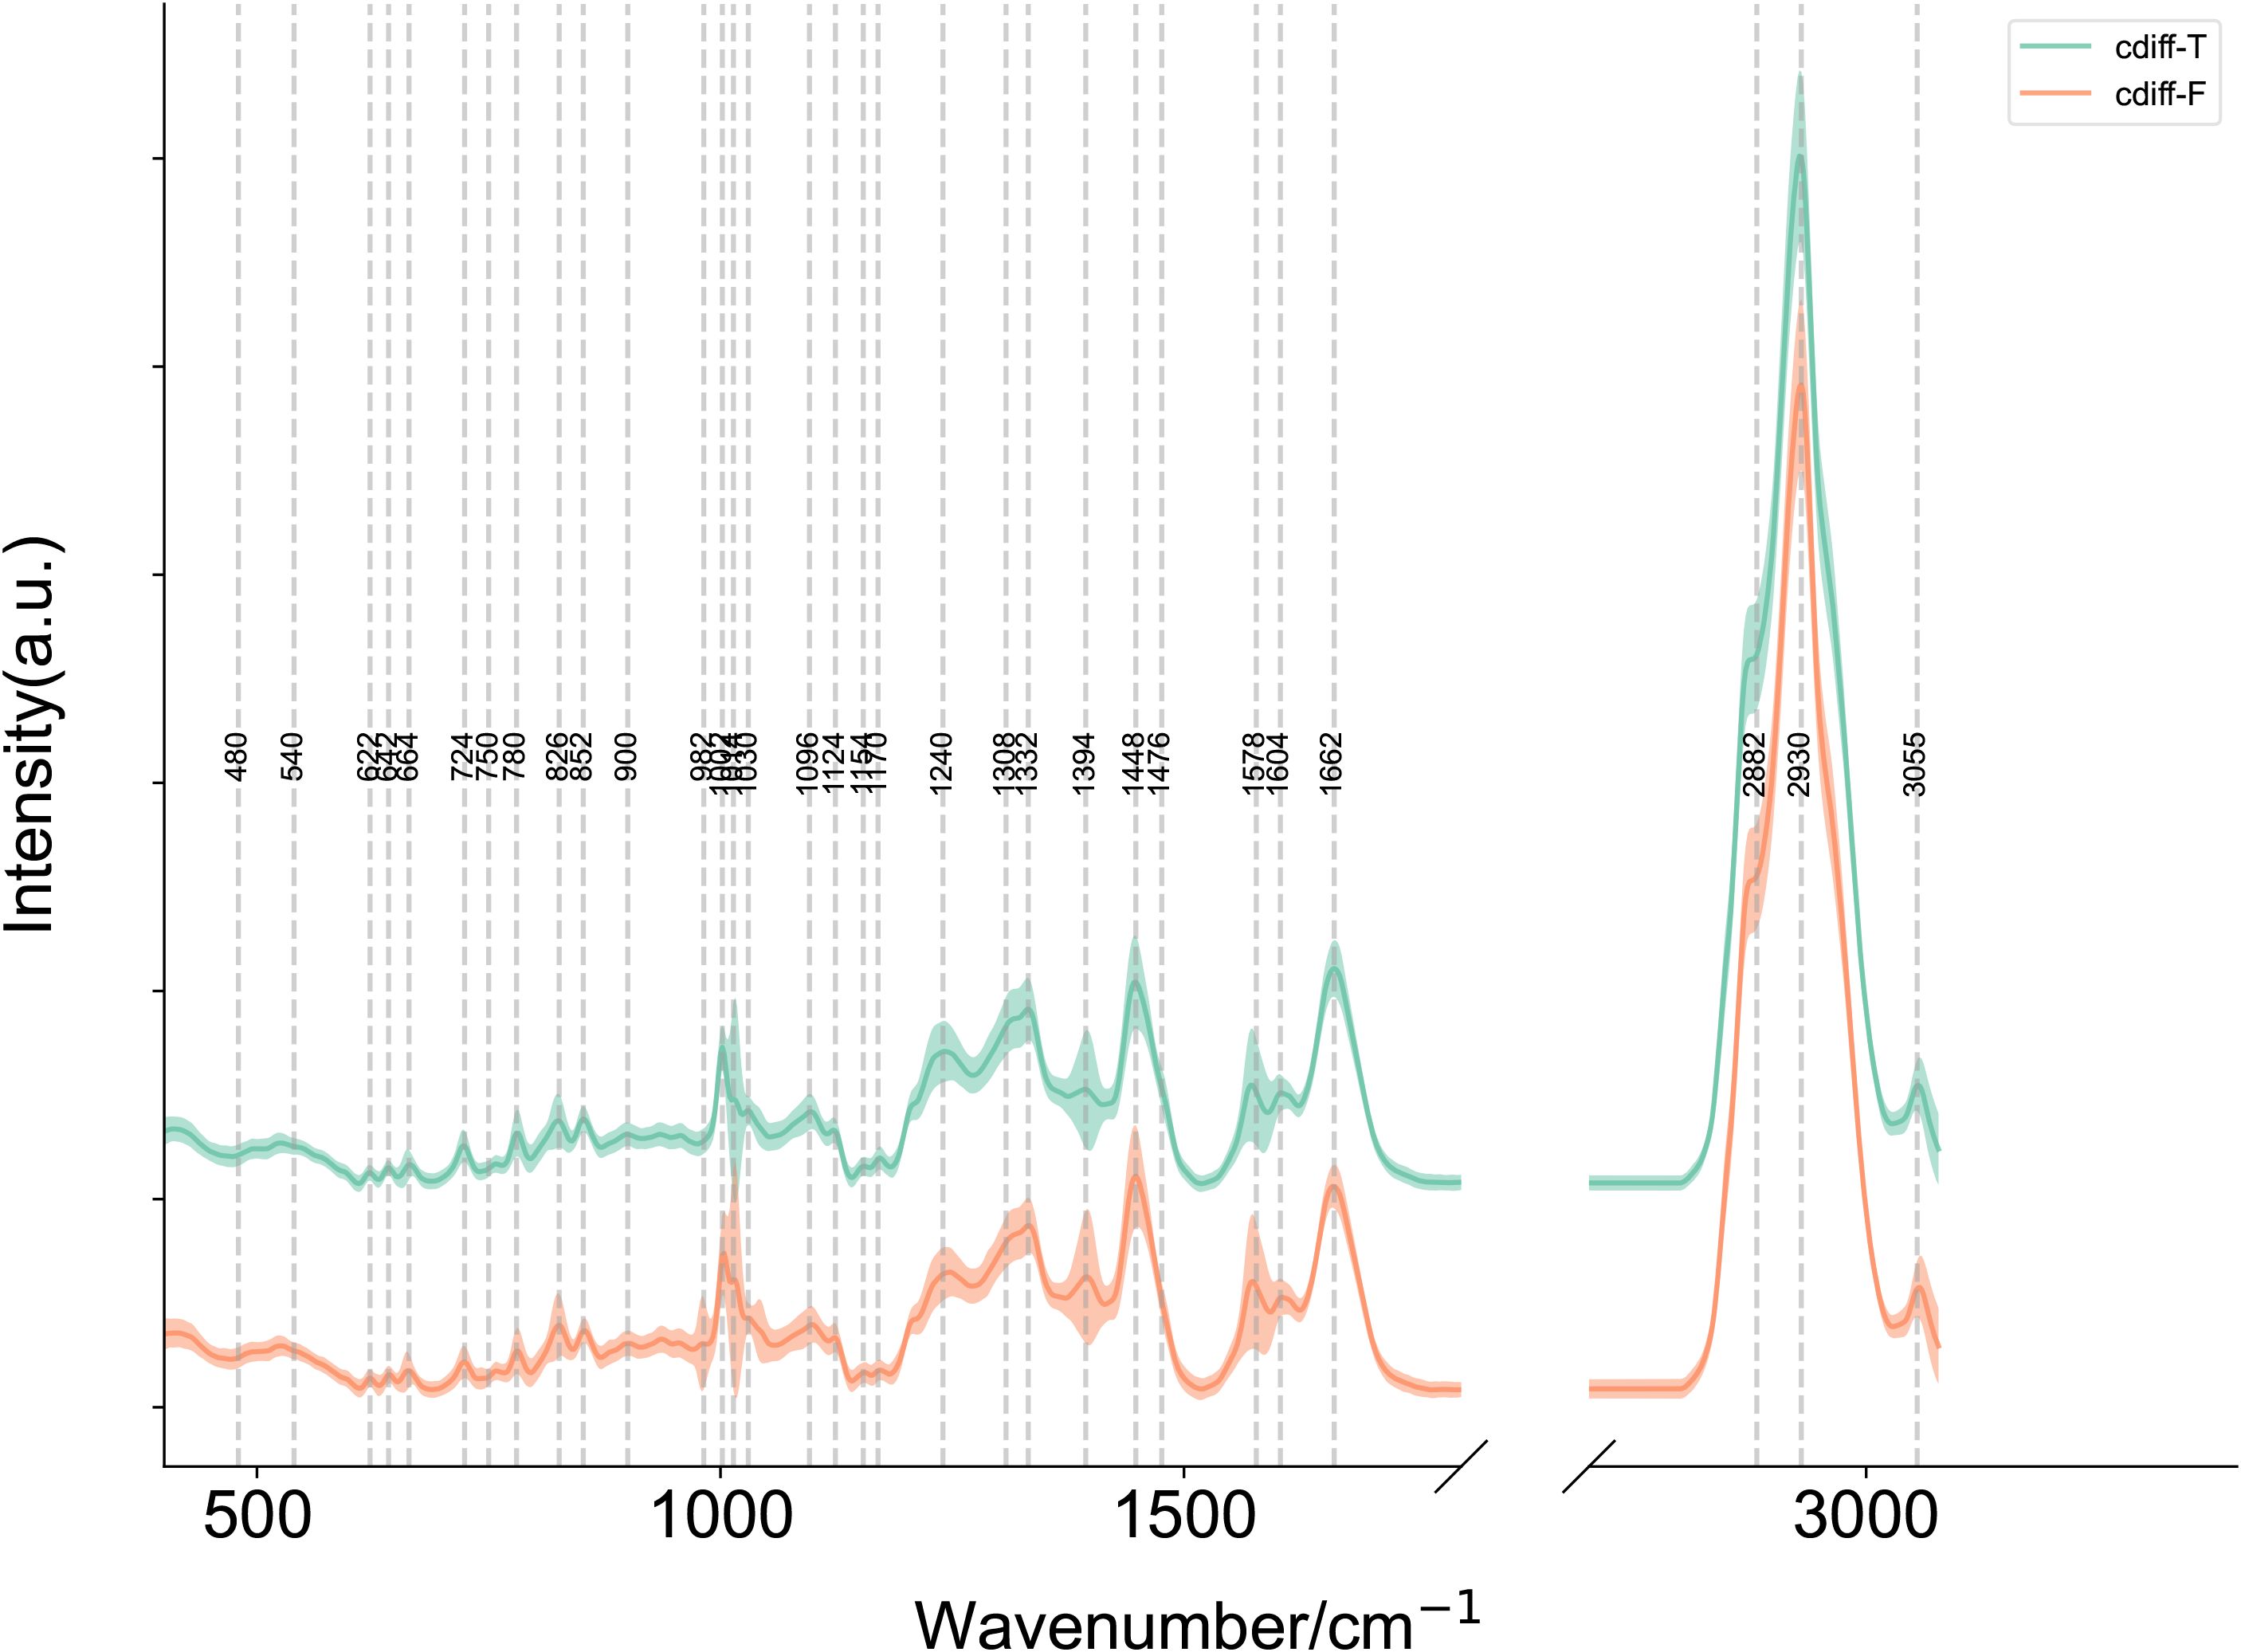
Figure 6. Mean single-cell Raman spectra of toxin-producing (n=5) and non-toxin-producing (n=5) Clostridioides difficile strains. Average Raman spectra of cdiff-F (non-toxigenic C. difficile), cdiff-T (toxigenic C. difficile). The shaded area around each spectrum indicates the standard deviation of the single-cell measurements. (Note: The silent region of Raman spectra (1800–2800 cm-1) was omitted from display.).
To evaluate the capability of the SCRS technique in distinguishing between toxin-producing and non-toxin-producing strains of C. difficile, we tested 2 clinical isolates of C. difficile from different patients, one of which was a toxin-producing strain and the other a non-toxin-producing strain. We compared 9 different data analysis methods, and the results indicated that the Multilayer Perceptron (MLP) exhibited higher specificity and sensitivity compared to the other methods, achieving an identification accuracy of 85% (see Figure 5B; Table 3).
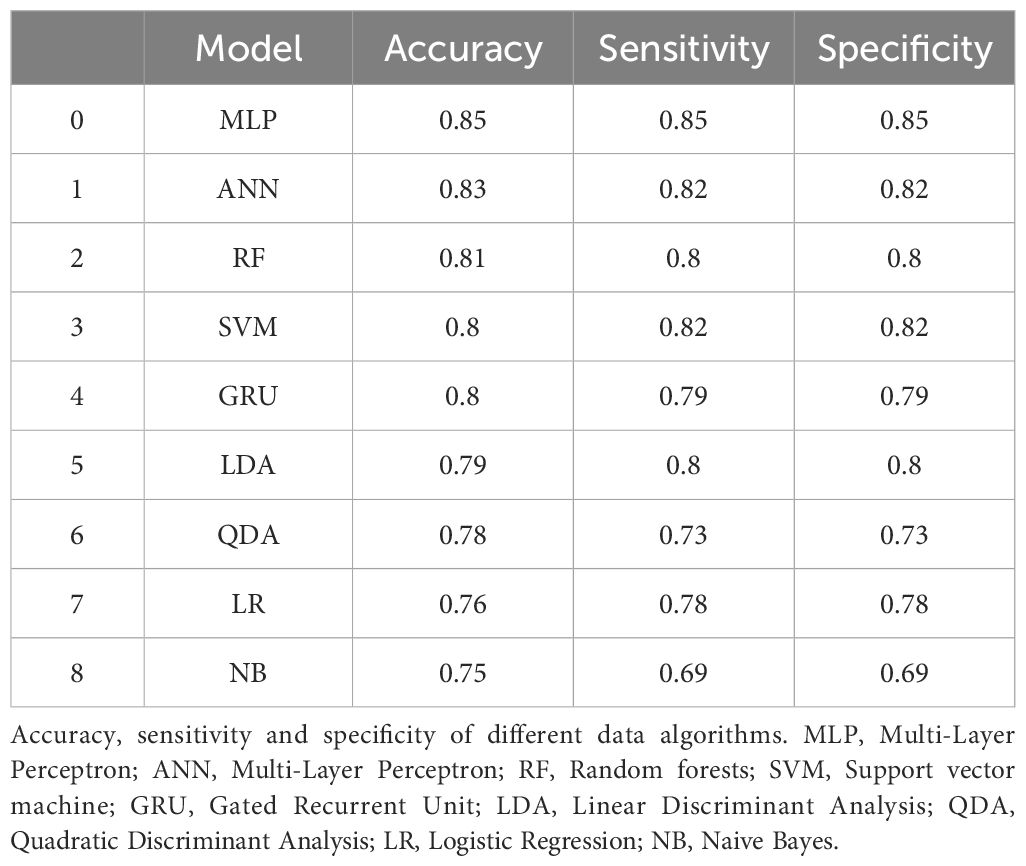
Table 3. Comparative assessment of accuracy, sensitivity, and specificity across computational algorithms for distinguishing toxin-producing from non-toxin-producing Clostridioides difficile strains.
3.3 In situ identification of clinical stool samples
To evaluate the database model’s ability to identify C. difficile strains in raw stool samples and distinguish between toxin-producing and non-toxin-producing strains, we tested 24 raw clinical stool samples. These samples were validated by culture and PCR methods, with 13 containing C. difficile and 11 not containing C. difficile, each from a different patient. Due to the presence of numerous stool strains, some closely related to C. difficile and easily misidentified, we applied a stringent confidence threshold, requiring the model to have a probability greater than 0.99 to classify a profile as C. difficile, all intermediate probabilities were classified as other. By comparing various data analysis methods, we found that the best model was Quadratic Discriminant Analysis (QDA), which outperformed the deep learning model, with a prediction accuracy of 0.83 (see Figure 7A). There was 1 instance where C. difficile was misidentified as other, and 3 instances where other strains were misidentified as C. difficile.
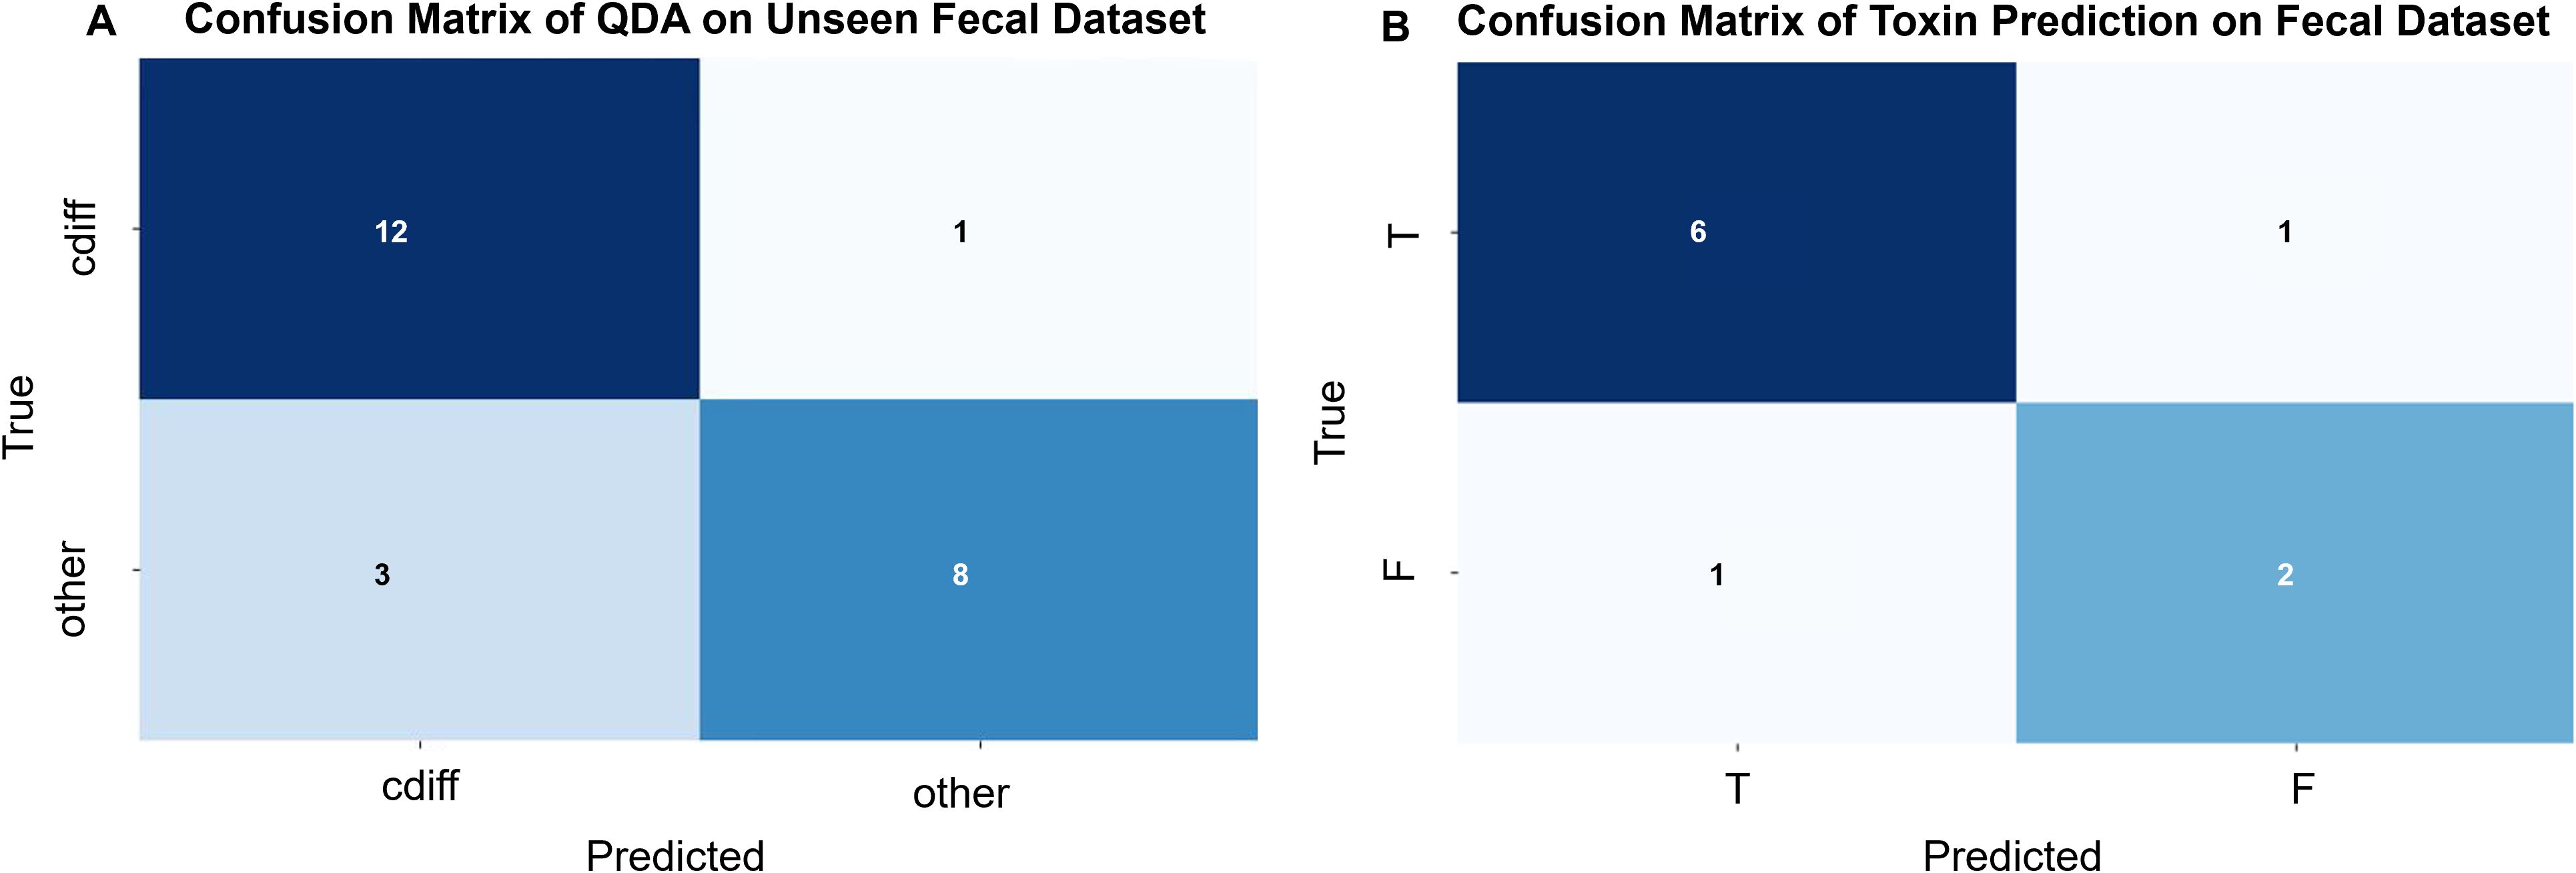
Figure 7. (A) Confusion matrix for the QDA (Quadratic Discriminant Analysis) model (by sample): Validation of the C. difficile strain identification model was performed using 24 original stool samples. Among the 13 C. difficile-positive stool samples, 12 were correctly identified, while 1 was misclassified as C. difficile-negative. Of the 11 C. difficile-negative stool samples, 8 were correctly identified, while 3 were misclassified as C. difficile-positive. The overall predictive accuracy of the model was 0.83. (B) Confusion Matrix of Toxin Prediction on Fecal Dataset (by sample):10 original fecal samples containing C. difficile were used to validate the C. difficile strain identification model. Of the 7 fecal samples containing toxin-producing C. difficile, 6 were correctly identified, while 1 was misclassified as containing non-toxin-producing C. difficile. Among the 3 fecal samples containing non-toxin-producing C. difficile, 2 were correctly identified, while 1 was misclassified as containing toxin-producing C. difficile. The overall predictive accuracy of the model was 0.80.
Among the correctly identified stool samples, C. difficile was present in 12 samples; however, 2 samples were excluded from this prediction due to a low number of validated maps. Consequently, a total of 10 stool samples were used for C. difficile toxin modeling, comprising 7 cases with toxin-producing C. difficile and 3 cases with non-toxin-producing C. difficile. The results indicated that, out of the 10 stool samples, 8 were accurately predicted and 2 were incorrectly predicted, yielding an accuracy of 80.0% (see Figure 7B).
4 Discussion
C. difficile represents a significant pathogen in nosocomial infections, with an escalating incidence of diarrhea and associated illnesses attributed to this bacterium observed globally in recent years (Carvalho et al., 2022). This rise has contributed to substantial morbidity and mortality worldwide. The pathogenesis of CDI is intrinsically linked to the secretion of proteotoxins by toxigenic strains of C. difficile (Slimings and Riley, 2014). Consequently, prompt and accurate detection of these toxigenic strains is crucial, not only for reducing the overdiagnosis of CDI but also for enhancing the accuracy of its diagnosis and the effectiveness of preventative strategies.
Current laboratory methodologies for CDI diagnosis encompass a variety of techniques, including stool C. difficile culture, cell culture cytotoxin assay, immunological toxin assays, glutamate dehydrogenase (GDH) assay, and nucleic acid amplification tests, among others. C. difficile is a strictly anaerobic bacterium that requires stringent growth conditions, specialized equipment and media, slow growth, prolonged incubation periods, and complex, cumbersome procedures, all of which contribute to its low sensitivity. The cytotoxicity test, regarded as the “gold standard” for laboratory diagnosis of CDI (Xu et al., 2019), presents challenges due to its complicated, time-consuming, and costly nature, rendering it impractical for routine use in clinical laboratories. The enzyme immunoassay (EIA) method is simple to perform, rapid, and demonstrates high specificity (>90%). However, its sensitivity is limited (ranging from 39% to 76%) and is influenced by specimen characteristics and prior empirical clinical treatments (Perelle et al., 1997; Carter et al., 2007). Additionally, it is associated with a high rate of false positives and instability of antibodies (Sakamoto et al., 2018). The GDH assay, noted for its rapidity and cost-effectiveness, also does not provide information regarding toxin production and is typically employed as an initial screening tool (Crobach et al., 2016). The polymerase chain reaction (PCR) method offers excellent specificity and high sensitivity, alongside rapid detection times. However, the complexity of its operational procedures, the need for expensive equipment, and the requirement for skilled personnel limit its application, particularly in settings with limited resources. Raman spectroscopy can provide a “chemical fingerprint” of C. difficile within 1 hour, enabling rapid identification of C. difficile for initial screening and classification. At the same time, in combination with PCR technology, the accuracy of Raman results can be verified, which is suitable for clinical diagnosis (Choi and Schlücker, 2024).
SCRS is a “total biometric fingerprinting” technique that enables rapid, non-destructive characterization and identification of individual cells without the need for additional markers. It also facilitates predictions at both the genotypic and phenotypic levels. Raman spectroscopy is non-destructive, in contrast to MALDI-TOF MS, which requires additional sample preparation steps, such as the addition of formic acid and substrates, potentially leading to alterations in analyte signal intensity (AlMasoud et al., 2021). Furthermore, MALDI-TOF MS typically relies on pure bacterial cultures grown on solid media and cannot differentiate between toxin-producing and non-toxin-producing C. difficile strains. Compared to techniques such as sequencing and molecular labeling, Raman spectroscopy can be more easily applied to the detection of new strains because it does not require the use of specifically designed labels. In addition, the single-cell nature of Raman spectroscopy enables rapid identification in the early stages of infection. Its highly automated nature simplifies the diagnostic process and interpretation of results, making it particularly suitable for use in environments with limited training resources or restricted clinical conditions.
For instance, Wang et al. employed Raman spectroscopy in conjunction with neural networks to identify archaeobacteria and utilized a convolutional neural network (CNN) for the classification of Enterobacteriaceae species, achieving an accuracy of 97.2% (Wang et al., 2020). Rebrošová et al. applied Raman spectroscopy for the swift identification of Staphylococcus species (Rebrošová et al., 2017), while Jiabao Xu and colleagues utilized the technique to identify 94 clinical isolates with a perfect accuracy rate of 100%, also providing precise diagnoses for 7 original urine samples (Carvalho et al., 2022). Furthermore, Ziyu Liu et al. utilized SCRS to classify 6 strains of respiratory pathogens, attaining accuracies ranging from 93% to 100%, and achieved more than 80% accuracy with clinical samples (Liu et al., 2023). Kloß et al. demonstrated the direct application of Raman spectroscopy for pathogen identification in ascites, where the results exhibited 97.7% and 83.6% correctness at the genus and species levels, respectively (Kloß et al., 2015). In the current study, Raman spectroscopy combined with a neural network was used to identify clinical isolates of C. difficile with 100% accuracy, and provided an 83% accuracy rate in raw stool samples, thus highlighting the significant potential of Raman spectroscopy in clinical diagnostics.
Additionally, Raman spectroscopy has been employed to characterize microbial virulence factors, including mechanisms of antimicrobial resistance. For instance, Zhou et al. utilized surface-enhanced Raman scattering (SERS) to successfully differentiate between wild-type and drug-resistant strains of Escherichia coli (Zhou et al., 2015). Jing-Wen Lyu and colleagues integrated SERS spectroscopy with a deep learning algorithm to accurately differentiate between 121 clinically isolated strains of Klebsiella pneumoniae (PRKP, CRKP, and CSKP) with varying resistance profiles (Lyu et al., 2023). Jiayue Lu et al. developed a CNN for the rapid identification of antimicrobial resistance genes (ARGs), high virulence coding factors, and resistance phenotypes in 71 strains of Klebsiella pneumoniae, using raw Raman spectral data (Lu et al., 2022). Similarly, Shu Wang et al. applied a label-free SERS method to distinguish between 60 strains of Staphylococcus aureus, including methicillin-sensitive (MSSA) and methicillin-resistant (MRSA) strains, achieving an identification accuracy of 100% (Wang et al., 2021). The findings from these studies indicate that SCRS, when coupled with deep learning algorithms, enhances the capability to distinguish between toxin-producing and non-toxin-producing strains of C. difficile, with classification accuracies of 85% in isolated samples and 80% in clinical samples. These results suggest the potential of Raman spectroscopy as a rapid detection method for identifying toxin-producing strains of C. difficile, underscoring its utility in clinical diagnostics. The results of Punjabi et al. also indicated that Raman spectroscopy facilitates rapid detection (POCT) in a simple and cost-effective manner, thereby making it a valuable tool for immediate care (Sin et al., 2014; Guo et al., 2019; Punjabi et al., 2022).
The utility of Raman spectroscopy in the identification of C. difficile and its toxins has been previously limited (Koya et al., 2018; Koya et al., 2019; Hassanain et al., 2021). However, the current study employed Raman spectroscopy for the in situ identification of C. difficile within raw stool samples and for distinguishing between toxin-producing and non-toxin-producing strains. This application provides valuable data that could inform the use of this technique in diagnosing C. difficile infections. In this investigation, the accuracy of Raman spectroscopy in identifying toxin-producing versus non-toxin-producing strains of C. difficile ranged from moderate to high. Future research will involve a larger sample size and the implementation of increasingly sophisticated methods for variable analysis to enhance the diagnostic accuracy of this approach.
Data availability statement
The raw data supporting the conclusions of this article will be made available by the authors, without undue reservation.
Author contributions
BL: Writing – original draft. FW: Methodology, Writing – review & editing. HW: Investigation, Writing – review & editing. YH: Data curation, Writing – review & editing. JH: Funding acquisition, Writing – review & editing.
Funding
The author(s) declare that financial support was received for the research and/or publication of this article. This study was funded by the “2024 Ganzhou Science and Technology Bureau Joint Program” project (GZ2024YLJ141), and the Ganzhou Municipal Directive Science and Technology Program (GZ2024ZSF126).
Conflict of interest
The authors declare that the research was conducted in the absence of any commercial or financial relationships that could be construed as a potential conflict of interest.
Generative AI statement
The author(s) declare that no Generative AI was used in the creation of this manuscript.
Publisher’s note
All claims expressed in this article are solely those of the authors and do not necessarily represent those of their affiliated organizations, or those of the publisher, the editors and the reviewers. Any product that may be evaluated in this article, or claim that may be made by its manufacturer, is not guaranteed or endorsed by the publisher.
References
AlMasoud, N., Muhamadali, H., Chisanga, M., AlRabiah, H., Lima, C. A., and Goodacre, R. (2021). Discrimination of bacteria using whole organism fingerprinting: the utility of modern physicochemical techniques for bacterial typing. Analyst 146, 770–788. doi: 10.1039/d0an01482f
Andersson, D. I. and Hughes, D. (2014). Microbiological effects of sublethal levels of antibiotics. Nat. Rev. Microbiol. 12, 465–478. doi: 10.1038/nrmicro3270
Antonelli, M., Martin-Loeches, I., Dimopoulos, G., Gasbarrini, A., and Vallecoccia, M. S. (2020). Clostridioides difficile (formerly Clostridium difficile) infection in the critically ill: an expert statement. Intens. Care Med. 46, 215–224. doi: 10.1007/s00134-019-05873-x
Carter, G. P., Lyras, D., Allen, D. L., Mackin, K. E., Howarth, P. M., O’Connor, J. R., et al. (2007). Binary toxin production in Clostridium difficile is regulated by CdtR, a LytTR family response regulator. J. Bacteriol. 189, 7290–7301. doi: 10.1128/JB.00731-07
Carter, G. P., Rood, J. I., and Lyras, D. (2012). The role of toxin A and toxin B in the virulence of Clostridium difficile. Trends Microbiol. 20, 21–29. doi: 10.1016/j.tim.2011.11.003
Carvalho, G. M., Ramos, C. P., Lobato, F. C. F., Guedes, R. M. C., Giaretta, P. R., and Silva, R. O. S. (2022). Laboratory diagnosis of Clostridioides (Clostridium) difficile infection in domestic animals: A short review. Anaerobe 75, 102574. doi: 10.1016/j.anaerobe.2022.102574
Choi, N. and Schlücker, S. (2024). Convergence of surface-enhanced raman scattering with molecular diagnostics: A perspective on future directions. ACS Nano. 18, 5998–6007. doi: 10.1021/acsnano.3c11370
Crobach, M. J. T., Burnham, C. A., and Carroll, K. C. (2016). Diagnosis of Clostridium difficile infection: an ongoing conundrum for clinicians and for clinical laboratories. Clin. Microbiol. Rev. 29, 529–544. doi: 10.1128/CMR.00016-13
Flemming, H. C. and Wingender, J. (2010). The biofilm matrix. Nat. Rev. Microbiol. 8, 623–633. doi: 10.1038/nrmicro2415
Gelder, J. D., Gussem, K. D., Vandenabeele, P., and Moens, L. (2007). Reference database of Raman spectra of biological molecules. J. Raman Spectrosc. 38, 1133–1147. doi: 10.1002/jrs.1734
Geric, B., Rupnik, M., Gerding, D. N., Grabnar, M., and Johnson, S. (2004). Distribution of Clostridium difficile variant toxinotypes and strains with binary toxin genes among clinical isolates in an American hospital. J. Med. Microbiol. 53, 887–894. doi: 10.1099/jmm.0.45610-0
Greenhill, C. (2010). Clostridium difficile: the importance of toxin A is re-established in Clostridium difficile infection. Nat. Rev. Gastroenterol. Hepatol. 7, 654. doi: 10.1038/nrgastro.2010.178
Guo, J., Zhong, Z., Li, Y., Liu, Y., Wang, R., and Ju, H. (2019). Three-in-one” SERS adhesive tape for rapid sampling, release, and detection of wound infectious pathogens. ACS Appl. Mater Interf. 11, 36399–36408. doi: 10.1021/acsami.9b12823
Hassanain, W. A., Spoors, J., Johnson, C. L., Faulds, K., Keegan, N., and Graham, D. (2021). Rapid ultra-sensitive diagnosis of clostridium difficile infection using a SERS-based lateral flow assay. Analyst 146, 4495–4505. doi: 10.1039/d1an00726b
Ho, C.-S., Jean, N., Hogan, C. A., Blackmon, L., Jeffrey, S. S., Holodniy, M., et al. (2019). Rapid identification of pathogenic bacteria using Raman spectroscopy and deep learning. Nat. Commun. 10, 1–8. doi: 10.1038/s41467-019-12898-9
Huang, W. E., Griffiths, R. I., Thompson, I. P., Bailey, M. J., and Whiteley, A. S. (2004). Raman microscopic analysis of single microbial cells. Anal. Chem. 76, 4452–4458. doi: 10.1021/ac049753k
Huang, W. E., Li, M., Jarvis, R. M., Goodacre, R., and Banwart, S. A. (2010). Shining light on the microbial world the application of Raman microspectroscopy. Adv. Appl. Microbiol. 70, 153–186. doi: 10.1016/S0065-2164(10)70005-8
Huang, W. E., Ward, A. D., and Whiteley, A. S. (2009). Raman tweezers sorting of single microbial cells. Environ. Microbiol. Rep. 1, 44–49. doi: 10.1111/j.1758-2229.2008.00002.x
Kanno, N., Kato, S., Ohkuma, M., Matsui, M., Iwasaki, W., and Shigeto, S. (2021). Machine learning-assisted single-cell Raman fingerprinting for in situ and nondestructive classification of prokaryotes. iScience 24, 102975. doi: 10.1016/j.isci.2021.102975
Kirchhoff, J., Glaser, U., Bohnert, J. A., Pletz, M. W., Popp, J., and Neugebauer, U. (2018). Simple Ciprofloxacin Resistance Test and Determination of Minimal Inhibitory Concentration within 2 h Using Raman Spectroscopy. Anal. Chem. 90, 1811–1818. doi: 10.1021/acs.analchem.7b03800
Kloß, S., Rösch, P., Pfister, W., Kiehntopf, M., and Popp, J. (2015). Toward culture-free Raman spectroscopic identification of pathogens in ascitic fluid. Anal. Chem. 87, 937–943. doi: 10.1021/ac503373r
Knight, D. R., Elliott, B., Chang, B. J., Perkins, T. T., and Riley, T. V. (2015). Diversity and evolution in the genome of clostridium difficile. Clin. Microbiol. Rev. 28, 721–741. doi: 10.1128/CMR.00127-14
Koya, S. K., Brusatori, M., Martin, J. V., Yurgelevic, S., Huang, C., Liberati, D. M., et al. (2018). Rapid detection of clostridium difficile toxins in serum by raman spectroscopy. J. Surg. Res. 232, 195–201. doi: 10.1016/j.jss.2018.06.031
Koya, S. K., Yurgelevic, S., Brusatori, M., Huang, C., Diebel, L. N., and Auner, G. W. (2019). Rapid detection of clostridium difficile toxins in stool by raman spectroscopy. J. Surg. Res. 244, 111–116. doi: 10.1016/j.jss.2019.06.039
Li, M., Xu, J., Romero-Gonzalez, M., Banwart, S. A., and Huang, W. E. (2012). Single cell Raman spectroscopy for cell sorting and imaging. Curr. Opin. Biotechnol. 23, 56–63. doi: 10.1016/j.copbio.2011.11.019
Liu, Z., Xue, Y., Yang, C., Li, B., and Zhang, Y. (2023). Rapid identification and drug resistance screening of respiratory pathogens based on single-cell Raman spectroscopy. Front. Microbiol. 14. doi: 10.3389/fmicb.2023.1065173
Lu, J., Chen, J., Liu, C., Zeng, Y., Sun, Q., Li, J., et al. (2022). Identification of antibiotic resistance and virulence-encoding factors in Klebsiella pneumoniae by Raman spectroscopy and deep learning. Microbial. Biotechnol. 15 (4), 1270–1280. doi: 10.1111/1751-7915.13960
Lyu, J. W., Zhang, X. D., Tang, J. W., Zhao, Y. H., Liu, S. L., Zhao, Y., et al. (2023). Rapid Prediction of Multidrug-Resistant Klebsiella pneumoniae through Deep Learning Analysis of SERS Spectra. Microbiol. Spectr. 11, e0412622. doi: 10.1128/spectrum.04126-22
Mosier-Boss, P. A. (2017). Review of SERS substrates for chemical sensing. Nanomater. (Basel). 7, 142. doi: 10.3390/nano7060142
Perelle, S., Gibert, M., Bourlioux, P., Corthier, G., and Popoff, M. R. (1997). Production of a complete binary toxin (actin-specific ADP-ribosyltransferase) by Clostridium difficile CD196. Infect. Immun. 65, 1402–1407. doi: 10.1128/iai.65.4.1402-1407.1997
Persson, S., Torpdahl, M., and Olsen, K. E. (2008). New multiplex PCR method for the detection of Clostridium difficile toxin A (tcdA) and toxin B (tcdB) and the binary toxin (cdtA/cdtB) genes applied to a Danish strain collection. Clin. Microbiol. Infect. 14, 1057–1064. doi: 10.1111/j.1469-0691.2008.02092.x
Planche, T. and Wilcox, M. (2011). Reference assays for Clostridium difficile infection: one or two gold standards? J. Clin. Pathol. 64, 1–5. doi: 10.1136/jcp.2010.080135
Punjabi, K., Adhikary, R. R., Patnaik, A., Bendale, P., Saxena, S., and Banerjee, R. (2022). Lectin-functionalized chitosan nanoparticle-based biosensor for point-of-care detection of bacterial infections. Bioconjug Chem. 33, 1552–1563. doi: 10.1021/acs.bioconjchem.2c00299
Raman, C. V. and Krishnan, K. S. (1928). A new type of secondary radiation. Nature 121, 501–502. doi: 10.1038/121501c0
Rebrošová, K., Šiler, M., Samek, O., Růžička, F., Bernatová, S., Holá, V., et al. (2017). Rapid identification of staphylococci by Raman spectroscopy. Sci. Rep. 7, 14846. doi: 10.1038/s41598-017-13940-w
Rupnik, M. and Janezic, S. (2016). An update on clostridium difficile toxinotyping. J. Clin. Microbiol. 54, 13–18. doi: 10.1128/JCM.02083-15
Sakamoto, S., Putalun, W., Vimolmangkang, S., Phoolcharoen, W., Shoyama, Y., Tanaka, H., et al. (2018). Enzyme-linked immunosorbent assay for the quantitative/qualitative analysis of plant secondary metabolites. J. Nat. Med. 72, 32–42. doi: 10.1007/s11418-017-1144-z
Sin, M. L., Mach, K. E., Wong, P. K., and Liao, J. C. (2014). Advances and challenges in biosensor-based diagnosis of infectious diseases. Expert Rev. Mol. Diagn. 14, 225–244. doi: 10.1586/14737159.2014.888313
Slimings, C. and Riley, T. V. (2014). Antibiotics and hospital-acquired Clostridium difficile infection: update of systematic review and meta-analysis. J. Antimicrob. Chemother. 69, 881–891. doi: 10.1093/jac/dkt477
Tao, Y., Wang, Y., Huang, S., Zhu, P., Huang, W. E., Ling, J., et al. (2017). Metabolic-activity-based assessment of antimicrobial effects by D2O-labeled single-cell raman microspectroscopy. Anal. Chem. 89, 4108–4115. doi: 10.1021/acs.analchem.6b05051
Uysal Ciloglu, F., Saridag, A. M., Kilic, I. H., Tokmakci, M., Kahraman, M., and Aydin, O. (2020). Identification of methicillin-resistant Staphylococcus aureus bacteria using surface-enhanced Raman spectroscopy and machine learning techniques. Analyst 145, 7559–7570. doi: 10.1039/d0an00476f
Wang, K., Chen, L., Ma, X., Ma, L., Chou, K. C., Cao, Y., et al. (2020). Arcobacter identification and species determination using raman spectroscopy combined with neural networks. Appl. Environ. Microbiol. 86, e00924–e00920. doi: 10.1128/AEM.00924-20
Wang, S., Dong, H., Shen, W., Yang, Y., Li, Z., Liu, Y., et al. (2021). Rapid SERS identification of methicillin-susceptible and methicillin-resistant Staphylococcus aureus via aptamer recognition and deep learning. RSC Adv. 11, 34425–34431. doi: 10.1039/d1ra05778b
Wang, Y., Xu, J., Cui, D., Kong, L., Chen, S., Xie, W., et al. (2021). Classification and identification of archaea using single-cell raman ejection and artificial intelligence: implications for investigating uncultivated microorganisms. Anal. Chem. 93, 17012–17019. doi: 10.1021/acs.analchem.1c03495
Xu, J., Luo, Y., Wang, J., Tu, W., Yi, X., Xu, X., et al. (2023). Artificial intelligence-aided rapid and accurate identification of clinical fungal infections by single-cell Raman spectroscopy. Front. Microbiol. 14. doi: 10.3389/fmicb.2023.1125676
Xu, J., Preciado-Llanes, L., Aulicino, A., Decker, C. M., Depke, M., Gesell Salazar, M., et al. (2019). Single-cell and time-resolved profiling of intracellular salmonella metabolism in primary human cells. Anal. Chem. 91, 7729–7737. doi: 10.1021/acs.analchem.9b01010
Young, V. B. and Hanna, P. C. (2014). Overlapping roles for toxins in Clostridium difficile infection. J. Infect. Dis. 209, 9–11. doi: 10.1093/infdis/jit461
Keywords: Clostridioides difficile (CD), Clostridioides difficile infection (CDI), single cell Raman spectroscopy (SCRS), Clostridioides difficile toxin, stools
Citation: Ling B, Wang F, Wu H, Huang Y and Huang J (2025) In situ identification of toxin-producing Clostridioides difficile in stool samples based on single-cell Raman spectroscopy. Front. Cell. Infect. Microbiol. 15:1556536. doi: 10.3389/fcimb.2025.1556536
Received: 24 January 2025; Accepted: 22 April 2025;
Published: 19 May 2025.
Edited by:
Fake Lu, Binghamton University, United StatesReviewed by:
Kurt Henry Piepenbrink, University of Nebraska-Lincoln, United StatesJianfeng Wang, Beijing Institute of Technology, China
Copyright © 2025 Ling, Wang, Wu, Huang and Huang. This is an open-access article distributed under the terms of the Creative Commons Attribution License (CC BY). The use, distribution or reproduction in other forums is permitted, provided the original author(s) and the copyright owner(s) are credited and that the original publication in this journal is cited, in accordance with accepted academic practice. No use, distribution or reproduction is permitted which does not comply with these terms.
*Correspondence: Junyun Huang, MTM5Nzk3MTU2NzBAMTYzLmNvbQ==; Yushan Huang, MzIxODY4MEBxcS5jb20=