 Kangkang Huang
 Yunlai Liang
 Kun Wang
 Yating Ma
 Jiahui Wu
 Huidan Luo
 Bin Yi
- 1Department of Clinical Laboratory, Xiangya Hospital, Central South University, Changsha, China
- 2National Clinical Research Center for Geriatric Disorders, Xiangya Hospital, Central South University, Changsha, China
Objectives: Renin-angiotensin-aldosterone system plays important roles in the development of diabetic nephropathy (DN), and angiotensin converting enzyme (ACE) is the key factor in the process from angiotensin I to angiotensin II, but the variation and roles of serum ACE in DN patients are still unclear.
Methods: Forty-four type 2 diabetes mellitus (T2DM) patients, 75 DN patients, and 36 age-gender-matched healthy volunteers were recruited who attended Xiangya Hospital of Central South University in this case control study. Serum ACE levels and other indexes were tested with commercial kit.
Results: ACE levels in DN were significantly higher than T2DM and controls (F = 9.66, P < 0.001). Serum ACE levels significantly correlated with UmALB (r = 0.3650, P < 0.001), BUN (r = 0.3102, P < 0.001), HbA1c (r = 0.2046, P = 0.0221), ACR (r = 0.4187, P < 0.001), ALB (r = -0.1885, P = 0.0192), and eGFR (r = -0.3955, P < 0.001), and we got an equation that Y = 2.839 + 0.648X1 + 2.001X2 + 0.003X3 - 6.637X4 +0.416X5 - 0.134X6 (Y: ACE; X1: BUN; X2: HbA1C; X3: UmALB; X4: gender; X5: ALB; X6: eGFR, R2 = 0.655). When DN patients were divided into advanced-stage and early-stage with or without DR, ACE levels would increase when early-stage DN develops into advanced-stage or companied with DR.
Conclusion: Elevated serum ACE levels may hint DN progression or retina impaired of DN patients.
Introduction
Diabetes mellitus is a kind of metabolic disease with abnormal higher blood glucose. It was estimated that 463 million people were diagnosed with DM in 2019, and this number will arise to 700 million by 2045 among aged 18–99 years (1). Long term hyperglycemia causes general vascular damage of kidneys, eyes, nerves, and heart and leads to microvascular complications (2), such as diabetic nephropathy (DN), diabetic retinopathy (DR), and diabetic peripheral neuropathy. Approximately 25–35% (3) of DM patients will develop into DN, which is one of the leading pathological causes of end-stage renal disease worldwide and is the most common cause of nephropathies requiring renal replacement therapy in many nations (4).
Except renal replacement therapy, researchers reported potential drugs such as empagliflozin (5), sirtuins 3 (SIRT3) (6), linagliptin (7), rho-associated kinase (ROCK) inhibitors (8), mineralocorticoid receptor antagonist (9), and peptide N-acetyl-seryl-aspartyl-lysyl-proline (AcSDKP) (10) could reduce the progression of DN in diabetic patients. The most common DN treatments are based on the RAAS system inactivation, precisely with the use of either the ACE inhibitors (ACEis) or angiotensin receptor blockers (ARBs) or their combination; however, ACEi could elevate AcSDKP level, whereas ARB does not (11). Physiologically, renal epithelial cells are associated tightly with their neighbors, which prevent their potential for movement and dissociation from the epithelial layer. Under the effect of high glucose concentrations, glomerular podocyte would appear the phenotypic change of epithelial-to-mesenchymal transition (EMT) and endothelial to mesenchymal transition (EndMT) (12, 13). When EMT and EndMT occurred, endothelial cells lost their typical phenotype to acquire mesenchymal features, characterized by the development of invasive and migratory abilities as well as the expression of typical mesenchymal products such as α-smooth muscle actin and type I collagen (12). The glucocorticoid receptor (GR) is a nuclear hormone receptor that is expressed ubiquitously in most cell types. A previous study has reported that loss of endothelial GR activates Wnt signaling pathway. This pathway is known to be upregulated in renal fibrosis (14). The most important inducer of kidney fibrosis is TGF-β, which could trigger EndMT by activating specific AKT and Smad signaling pathways (15). Fibroblast growth factor 1 (FGFR1) as mitogen and insulin sensitizer could suppress inflammation and renal glomerular and tubular damage through inhibiting the activation of nuclear factor κB and c-Jun N-terminal kinase signaling pathways (16). Notch signaling and Hedgehog signaling are also involved in the development of DN, Notch signaling promotes diabetic glomerulopathy (17) and tubulointerstitial fibrosis (18) and inhibits endothelial cell proliferation and migration (19), and Hedgehog signaling could reduce reactive oxygen species production through increasing superoxide dismutase and catalase production (20–22).
Several factors were proved associated with the occurrence of DN. DN is a prototype disease of the activation of renin-angiotensin-aldosterone system (RAAS) (23), including angiotensinogen, angiotensin receptor, Ang I, Ang II, ACE, and renin. Angiotensinogen is converted to Ang I by renin and Ang I transformed into Ang II through ACE. ACE gene polymorphisms have implications in the pathophysiology of diabetes developing into DN. It has been reported in several studies that D allele is a risk factor for DN and I allele is a protective factor for DN in Asian people (24, 25). Further study implicated that D/D genotype is an independent risk factor for the development of DN in Chinese population with T2DM (25, 26). In adults, plasma ACE level does not change with age, but it is affected by factors like environment or lifestyle (26, 27). Plasma ACE level in I/D and D/D genotype people was reported to be 30% and 60% higher, respectively, than that in I/I genotype people (27).
Hence, what the variation of plasma ACE level in early and advanced stage DN patients with or without DR attracts us. In this research, we elaborated that serum ACE levels elevated in DN patients compared with T2DM and healthy. In the subgroup analysis, we separated DN patients with urinary microalbumin creatinine ratio (ACR) at the cut-off of 300 mg/g to early and advanced stage; meanwhile, we consider the DN patients whether retinal damage. As for DN patients with uninjured retina, increased serum ACE levels hint that early stage developed into advanced stage, and serum ACE levels raised are also a reminder of retina impaired in early-stage DN patients. The results of our study make a point that serum elevated ACE levels are a marker for progression of DN and early-stage DN patients with impaired retina.
Materials and Methods
Participants
A total of 155 participants were recruited in this study from August 2018 to March 2020 in Xiangya Hospital of Central South University. Forty-four T2DM patients averaged 57.82 ± 9.56 years meeting the American Diabetes Association (ADA) standard in 2018 (28), including fasting blood-glucose (FPG) level of ≥126 mg/dl (7.0 mmol/L), a 2-h plasma glucose (2h-PG) level of ≥200 mg/dl (11.1 mmol/L) during OGTT, a hemoglobin A1c (HbA1c) level of ≥6.5% (48 mmol/mol), or a random plasma glucose ≥200 mg/dl (11.1 mmol/L) in a patient with classic symptoms of hyperglycemic crisis. Seventy-five patients averaged 56.60 ± 13.45 years were defined as DN on the condition of their ACR > 30 mg/g or eGFR < 60 ml•min-1•1.73 m2 (29). Patients with type 1 diabetes mellitus (T1DM) or other kidney disease (like nephropathy syndrome or nephritis), cancer, cardiovascular disease, severe lung or liver disease, or infectious disease, or treated with nephrotoxic drugs or other drugs that could influence urinary albumin excretion, or receiving medications of angiotensin receptor blocker (ARB) or angiotensin-converting enzyme inhibitor (ACEI) were excluded. Meanwhile, 36 (53.33 ± 7.14 years) age-gender-matched healthy volunteers were introduced in this study. DR diagnosis was made by an ophthalmologist through direct ophthalmoscopy with retinal vascular structural changes such as microaneurysm, intraretinal hemorrhage, vascular circuity, and vascular malformation (30). Participants in this study were given informed consent, and this study was permitted by the ethics committee of Xiangya Hospital of Central South University (No 202009119).
Samples
Venous blood was collected after a minimum of 8 h fasting diet and then centrifuged at 3600 rpm for 5 min. The isolated serum samples were frozen at -20°C until test.
Clinical and Laboratory Indexes
Clinical parameters of each participants were obtained including diagnostic message, gender, age, BMI, and laboratory indexes performed on blood samples containing ALB (albumin), TG (total triglycerides), TC (total cholesterol), HDL-C (high density lipoprotein cholesterol), LDL-C (low density lipoprotein cholesterol), TB (total bilirubin), DB (direct bilirubin), TBA (total bile acid), BUN (blood urea nitrogen), Scr (serum creatinine), UmALB (urine microalbumin), Ucr (urine creatinine), and HbA1c (glycosylated hemoglobin) measured on AU5800 automatic analyzer (Beckman Coulter, CA, USA). Serum ACE levels were tested with appropriate Commercial kit (DEROM Biomedical Engineering Co., LTD, Hunan, China). In addition, eGFR (estimated glomerular filtration rate) was computed by modified MDRD equation and ACR (urinary microalbumin creatinine ratio) was also calculated as below: eGFR [ml.min-1. (1.73m2)] = 175*[Scr (mg/dl)]-1.154* (age)-0.203, female multiple with 0.742, ACR (mg/g) = UmALB * (113.1* Ucr) -1*106.
Statistical Analysis
Statistical analyses were performed using SPSS (Version 26, SPSS Inc., Chicago, IL, USA). The normal distribution quantitative statistics were presented as mean ± SD, the differences among groups were compared with ANOVA, and SNK test was used to verify the differences between two groups. Gender as dichotomous data was coded as “male=1” and “female=0”, and the difference among groups used chi-square test. Pearson correlation coefficients were reported for correlations between ACE and other indexes. Independent variable potentially influencing plasma ACE levels was tested by multiple linear regression analysis with input α = 0.05, output α = 0.1. All the tests were two-tailed, and P < 0.05 was considered statistically significant.
Results
Patient Baseline Characteristics
Baseline characteristics of the participants in our research were summarized in Table 1. ACE levels were 19.46 ± 7.67 (μmol/L) in the control group, 18.75 ± 12.96 (μmol/L) in T2DM, and 27.12 ± 11.93 (μmol/L) in DN, respectively. As shown in Supplementary Figure S1, the ACE levels in the DN group were remarkably elevated compared to that in the control and in T2DM (P < 0.01), whereas there was no significant difference of ACE levels between the T2DM group and the control. Meanwhile, the differences of age, BMI, duration, TBA, LDL, TC, and HDL/LDL between groups were not significant. Both the levels of BUN and Scr in DN patients were significantly higher than that in the control or T2DM patients, while the concentration of ALB, eGFR, TB, and DB in DN group was distinctly declined in contrast to the control or T2DM patients. HbA1c levels in DN or T2DM group were greatly higher than that in the control group.
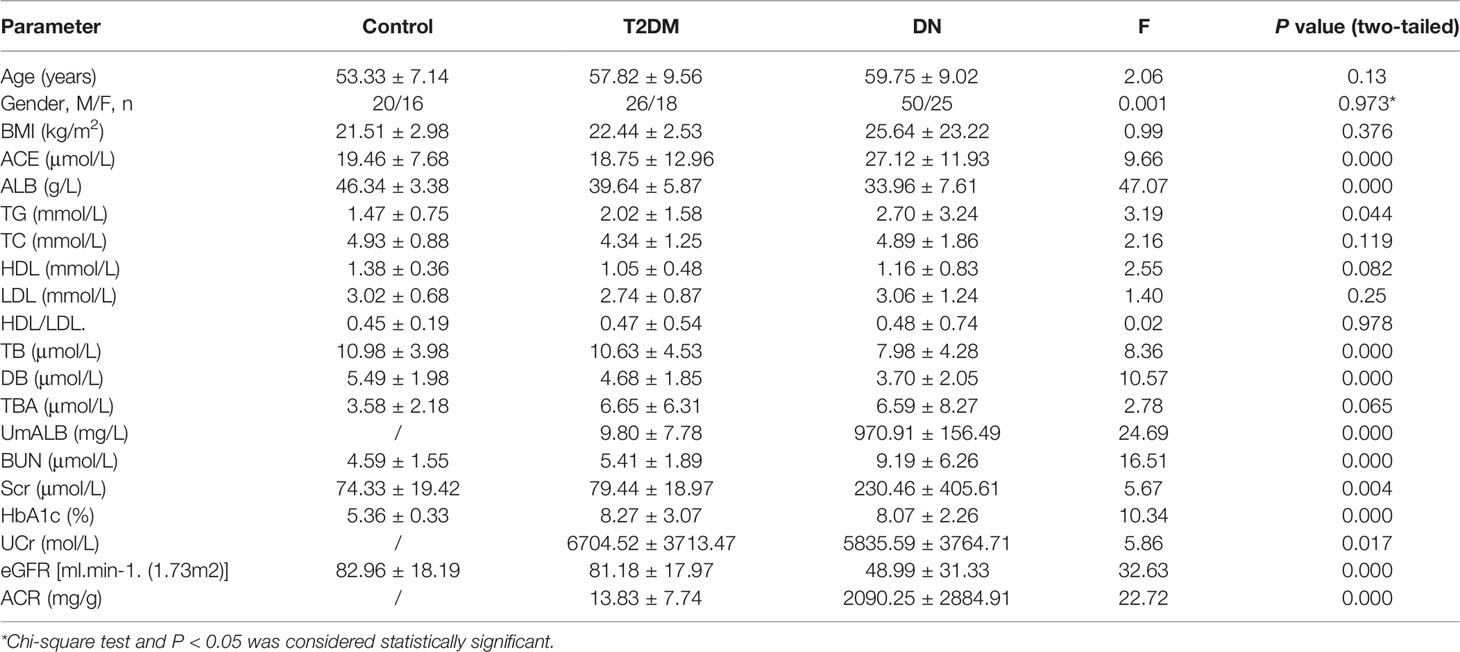
Table 1 Characteristics of the subjects included in this study (mean ± SD).
Correlations Between ACE and Other Indexes
We used scatter diagram to explore the correlations between ACE and other laboratory indexes such as ALB, UmALB, BUN, Scr, GFR, BMI, TB, DB, TBA, HbA1c, and ACR. As a result, we found that ACE level significantly correlated with UmALB (r = 0.3650, P < 0.001), BUN (r = 0.3102, P < 0.001), HbA1c (r = 0.2046, P = 0.0221), ACR (r = 0.4187, P < 0.001), ALB (r = -0.1885, P = 0.0192), and eGFR (r = -0.3955, P < 0.001) as Table 2 described. Specifically, it had closely positive correlations with UmALB (r = 0.4418, P < 0.0001), BUN (r = 0.3082, P < 0.0001), HbA1c (r = 0.2227, P = 0.0129), or ACR (r = 0.4094, P < 0.0001), and negative correlations with ALB (r = -0.1885, P = 0.0192) or eGFR (r = -0.4091, P < 0.0001) as shown in Supplementary Figure S2, but no other significant correlations were observed between ACE levels and other laboratory data.
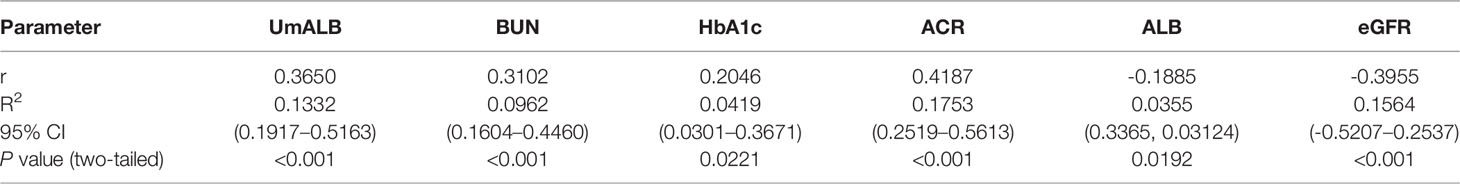
Table 2 Correlation between ACE and some indexes.
The Influence Factors of ACE
We used multiple logistic regression to investigate the influence factors of serum ACE level in serum. ACE level was defined as the dependent variable, and predictor variables include BUN, HbA1c, UmALB, gender, ALB, eGFR, BMI, input α = 0.05, and output α = 0.1. The equation was achieved as follows: Y = 2.839 + 0.648X1 + 2.001X2 + 0.003X3 - 6.637X4 + 0.416X5 - 0.134X6 (Y: ACE, X1: BUN, P = 0.093; X2: HbA1c, P = 0.000; X3: UmALB, P = 0.010; X4: gender, P = 0.006; X5: ALB, P = 0.014; X6: eGFR, P = 0.031, R2 = 0.655). The results given in Table 3 presented that these variables could influence 65.5% of the ACE levels in the serum and only 35.5% of the ACE affected by accidentia or other factors. The standardized regression coefficients of X1-X6 were 0.197, 0.387, 0.267, -0.227, 0.232, and -0.279, respectively, implicating that HbA1c could affect the ACE level most.
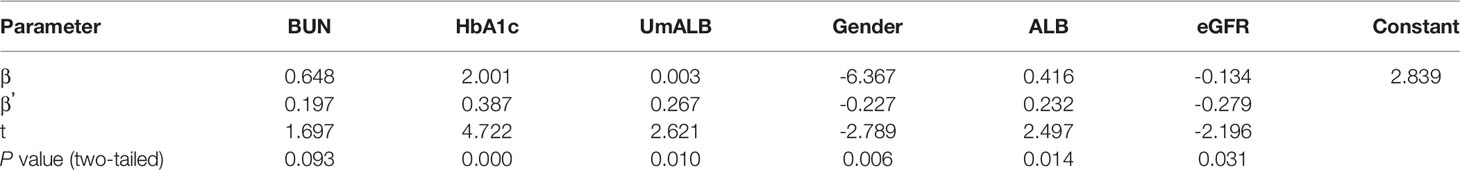
Table 3 The influence factors of ACE established by multiple logistic regression model.
ACE Level in Patients With DN and DN Combined With DR
It has been widely accepted that ACR is a frequently-used laboratory index to diagnose DN and distinguish early-stage (30 mg/g < ACR < 300mg/g) and advanced-stage (ACR > 300 mg/g) DN (31). Based on ACR levels, DN patients were divided into four subgroups of early-stage DN, early-stage DN combined with DR, advanced-stage DN, and advanced-stage DN patients DR. Key clinical and laboratory data of every subgroup were summarized in Table 4, and the ACE levels were exhibited in Figure 1. Statistical analysis proved that the ACE level in early-stage DN significantly dropped in comparison with the advanced-stage DN or early-stage DN combined with DR (P < 0.05) (Figure 1).
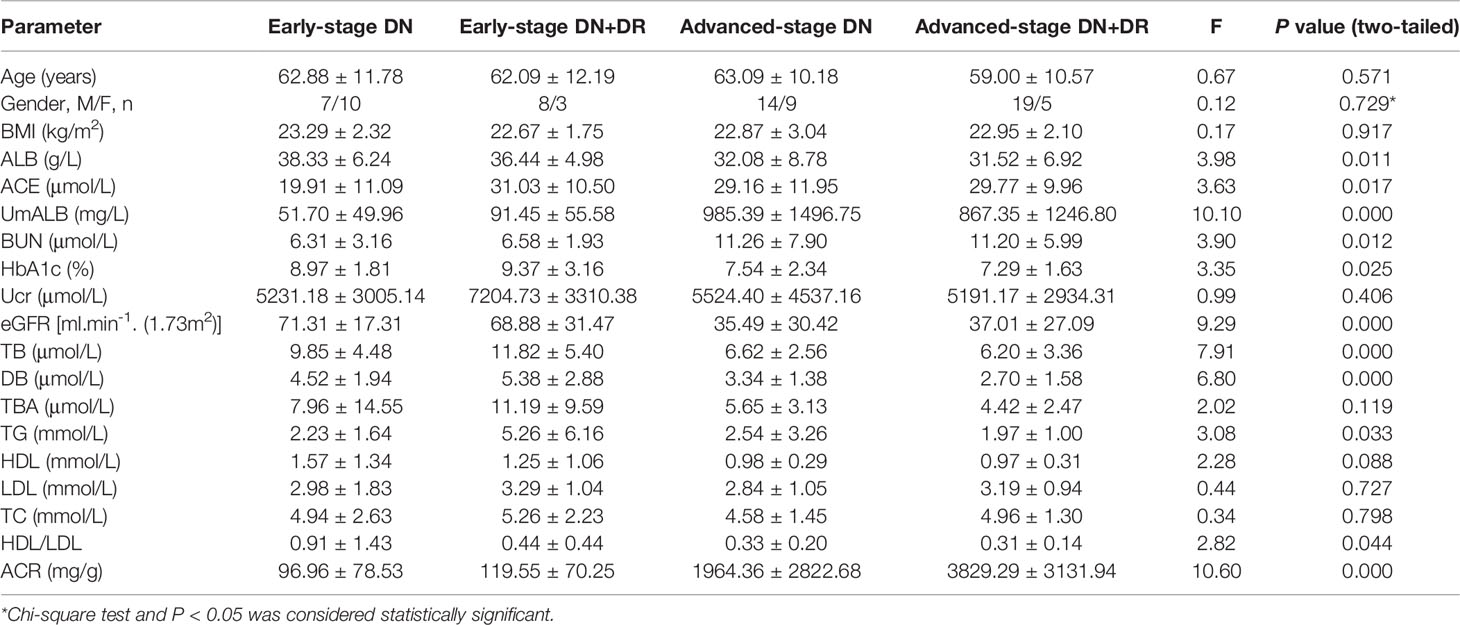
Table 4 Characteristics of different DN subgroup patients (mean ± SD).
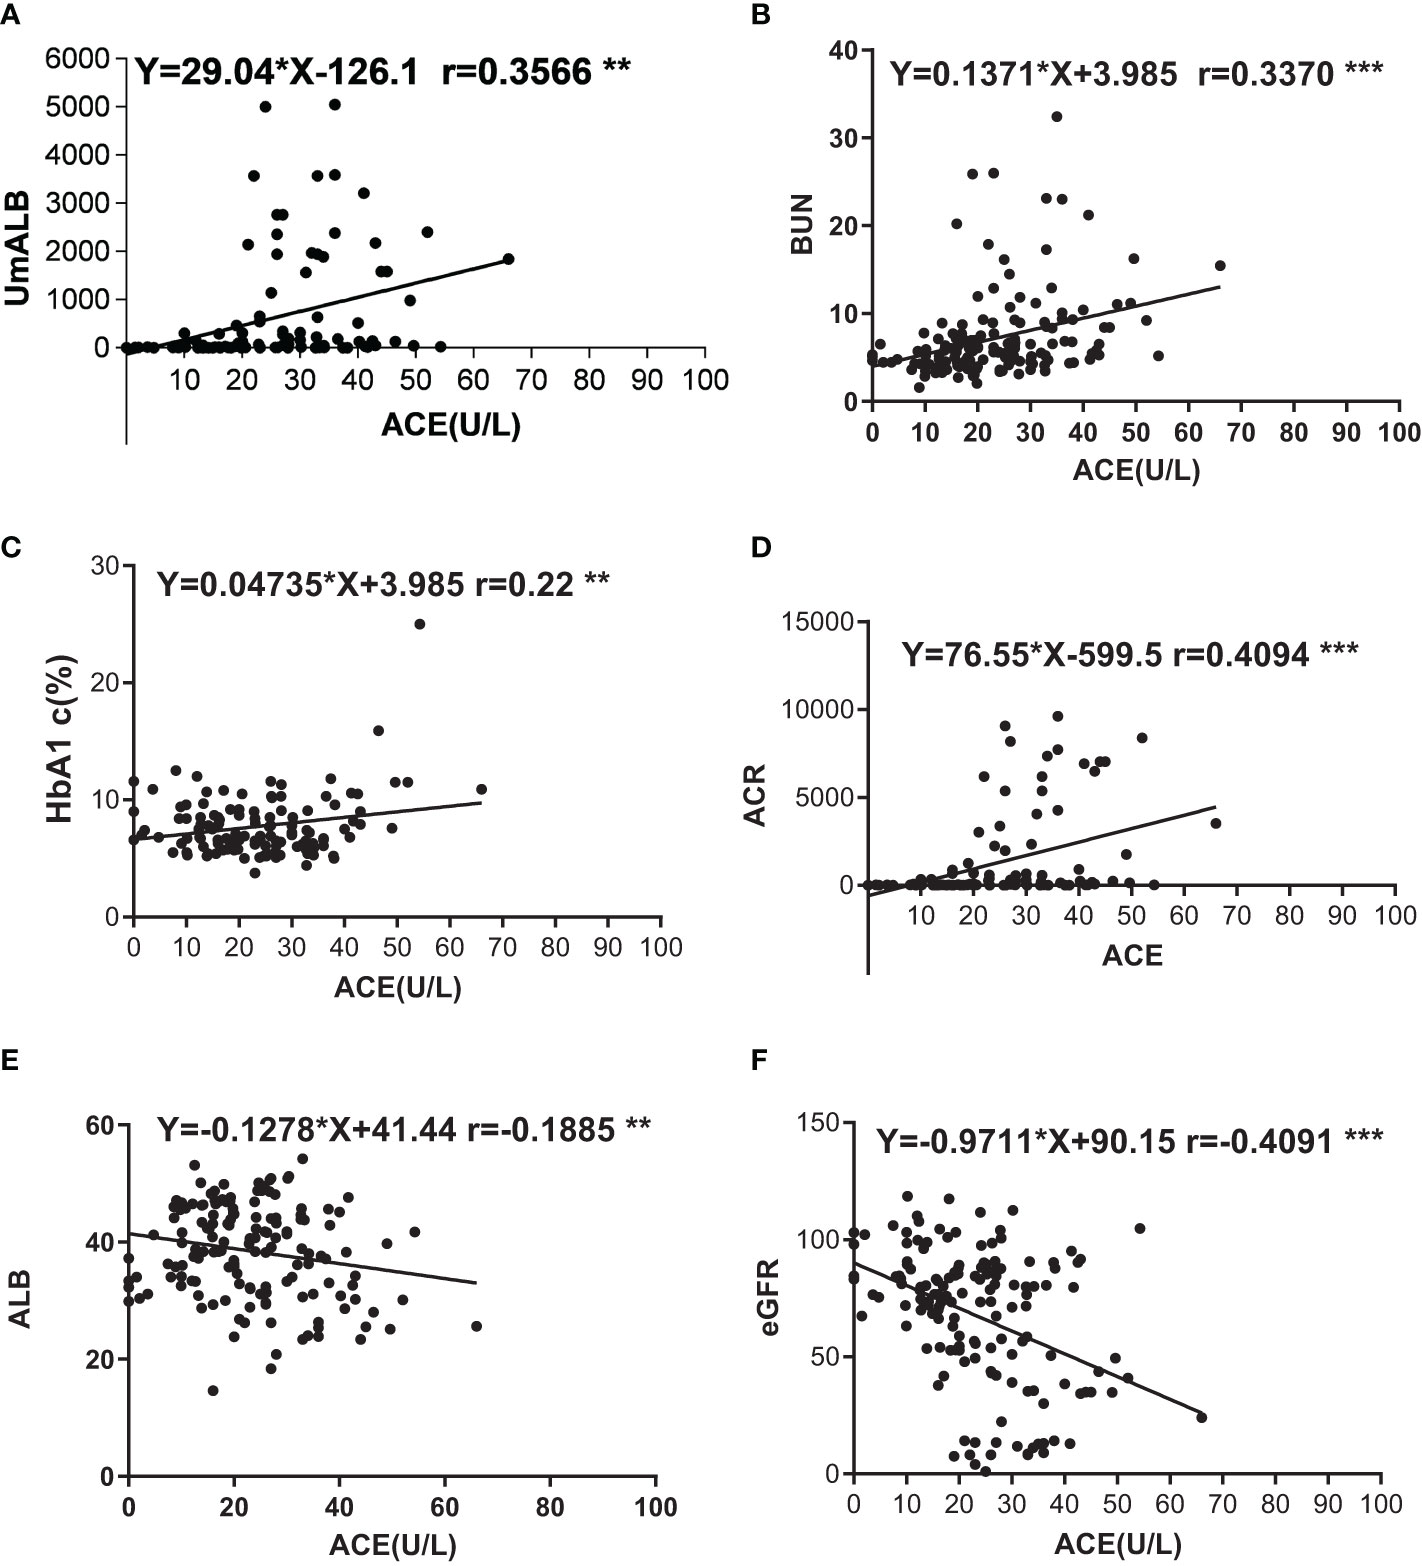
Figure 1 Correlations of ACE with other indexes. (A) Correlation between UmALB level and ACE. Y = 29.04x - 126.141.0, R2 = 0.121; (B) Correlation between BUN level and ACE. Y = 1371x + 3.985, R2 = 0.109; (C) Correlation between HbA1c level and ACE. Y = 0.04735x + 6.621, R2 = 0.050; (D) Correlation between ACR level and ACE. Y = 76.55x - 599.5, R2 = 0.164; (E) Correlation between ALB level and ACE. Y = -0.1278x + 41.44, R2 = 0.035; (F) Correlation between GFR level and ACE. Y = -9711x + 90.15, R2 = 0.160. **P < 0.01; ***P < 0.001.
Discussion
DN and DR is main microvascular complication of T2DM. DN is one of the most important causes of end-stage renal disease (ESRD), and DR would evolve into blind, at present, DN and DR rapidly increasing to be a popular disease in China (32). In clinical practice, DN is characterized with proteinuria; however, diet, sports, and other factors could affect the levels of proteinuria (33). Searching a biomarker to distinctively recognize DN to replace UmALB is helpful and valuable to diagnose DN. In our research, we aimed to assess the variation of ACE levels in DN patients compared with T2DM and healthy and the value of ACE levels to diagnose DN. Our results manifested that ACE level in the DN patients was significantly higher than that in the control or in the T2DM which may partly demonstrate that ACE levels may be a new marker to inflect DN. When we divided DN patients with ACR and considered whether DN patients companied with DR to subgroup, further subgroup analysis results showed that early-stage DN patients develop into advanced-stage or early-stage DN patients companied with DR, and serum ACE levels obviously increased. Above results of our study exhibited that elevated serum ACE levels may be a valuable biomarker to discern DN progression and early-stage DN patients with impaired retina.
Diabetic vascular complications are responsible for most of the mortality and morbidity in diabetic populations worldwide (34). The complications are divided into macrovascular and microvascular. Macrovascular complications include coronary artery disease and cerebrovascular disease, and microvascular complications cover diabetic retinopathy (DR) and DN (35). DR may have the identical pathologic change as DN; when T2DM patients have impaired retina, it is thought to be an indicator of DN (36). In T2DM patients, DR and proteinuria could be decisive for the decline of renal function (37). There is evidence that when T2DM patient was diagnosed with DR, it would be essential to assess their kidney function and DR may predict the renal outcomes of DN patients (38). In our study, DR and DN coexisted in 35 patients, where the ACE level in these patients was higher than that in another 40 DN patients without DR; in particular, when ACR was <300 mg/g, ACE level in patients with DN concomitant DR was the time is prominently higher than that in DN patients without DR. It is reasonable to predict that ACE level could elevate in T2DM patients accompanied by retinopathy. Our study revealed that ACE level in DN patients was significantly higher than that in the control or T2DM; further subgroup analysis confirmed obvious elevation of ACE level in advanced-stage DN in comparison with the early-stage DN, and when early-stage DN patients companied with DR, serum ACE levels will also increase than early-stage DN patients.
As we all know that, RAAS plays vital roles to maintain plasma sodium, arterial blood pressure, and extracellular volume homeostasis. Angiotensinogen, angiotensin I, angiotensin II, and angiotensin converting enzyme are all important composition of RAAS, and Ang I cleaved into Ang II by ACE at lung capillaries, endothelial cells, and kidney epithelial cells (39–41). A study also reported that AngIIof intra-renal was 50–100 times higher than the circulatory AngII (42). Proteinuria is a renal pathology and also the clinical characteristic of DN; however, high RAAS activity will cause or aggravate albuminuria (43). Higher level of ACE reflects vast AngII, and a mass of AngIIindicates high RAAS activity. We imagined that higher serum ACE levels in DN patients were strongly correlated with proteinuria, and we probed into the correlation between serum ACE levels and renal function indexes such as BUN, UmALB, ACR, and eGFR, as you could see in Supplementary Figure S2. Strong relevance was gotten between ACE and UmALB (r = 0.3566), BUN (r = 0.337), ACR (r = 0.4094), and eGFR (r = -0.4091). The consequences also prove the idea that ACE is a potential biomarker to diagnose DN.
The present study has potential limitations. Firstly, as it was conducted in single Chinese population, ethic group difference should be regarded when popularizing the conclusion to other ethnics. Secondly, the number of patients recruited in this study was relatively small; therefore, enlarged sample size is required for further confirmation of the results.
In summary, our results imply that elevated serum ACE levels in DN patients may be an indicator for diabetic nephropathy, and continuously increased ACE is a possible signal of diabetic nephropathy progression. Additionally, increased ACE levels may be a single of retina impaired of early-stage DN patients.
Data Availability Statement
The raw data supporting the conclusions of this article will be made available by the authors, without undue reservation.
Ethics Statement
The studies involving human participants were reviewed and approved by ethics committee of Xiangya Hospital of Central South University. The patients/participants provided their written informed consent to participate in this study.
Author Contributions
All authors participated in the design, interpretation of the studies, analysis of the data, and review of the manuscript. KH designed and analyzed the data and drafted the manuscript. YL and KW conducted the experiment. JW, HL, and YM collected the data. Bin Yi supplied critical reagents and reviewed and edited the text.
Conflict of Interest
The authors declare that the research was conducted in the absence of any commercial or financial relationships that could be construed as a potential conflict of interest.
Publisher’s Note
All claims expressed in this article are solely those of the authors and do not necessarily represent those of their affiliated organizations, or those of the publisher, the editors and the reviewers. Any product that may be evaluated in this article, or claim that may be made by its manufacturer, is not guaranteed or endorsed by the publisher.
Supplementary Material
The Supplementary Material for this article can be found online at: https://www.frontiersin.org/articles/10.3389/fcdhc.2022.831128/full#supplementary-material
References
1. Saeedi P, Petersohn I, Salpea P, Malanda B, Karuranga S, Unwin N, et al. Global and Regional Diabetes Prevalence Estimates for 2019 and Projections for 2030 and 2045: Results From the International Diabetes Federation Diabetes Atlas, 9(Th) Edition. Diabetes Res Clin Pract (2019) 157:107843. doi: 10.1016/j.diabres.2019.107843
2. WHO. Global Health Risks. Mortality and Burden of Disease Attributable to Selected Major Risks. Geneva: World Health Organization (2009).
3. Eppens MC, Craig ME, Cusumano J, Hing S, Chan AK, Howard NJ, et al. Prevalence of Diabetes Complications in Adolescents With Type 2 Compared With Type 1 Diabetes. Diabetes Care (2006) 29:1300–6. doi: 10.2337/dc05-2470
4. White SL, Chadban SJ, Jan S, Chapman JR, Cass A. How can We Achieve Global Equity in Provision of Renal Replacement Therapy? Bull World Health Organ (2008) 86:229–37. doi: 10.2471/blt.07.041715
5. Wanner C, Inzucchi SE, Lachin JM, Fitchett D, von Eynatten M, Mattheus M, et al. Empagliflozin and Progression of Kidney Disease in Type 2 Diabetes. N Engl J Med (2016) 375:323–34. doi: 10.1056/NEJMoa1515920
6. Li J, Liu H, Takagi S, Nitta K, Kitada M, Srivastava SP, et al. Renal Protective Effects of Empagliflozin via Inhibition of EMT and Aberrant Glycolysis in Proximal Tubules. JCI Insight (2020) 5(6). doi: 10.1172/jci.insight.129034
7. Awal HB, Nandula SR, Domingues CC, Dore FJ, Kundu N, Brichacek B, et al. Linagliptin, When Compared to Placebo, Improves CD34+ve Endothelial Progenitor Cells in Type 2 Diabetes Subjects With Chronic Kidney Disease Taking Metformin and/or Insulin: A Randomized Controlled Trial. Cardiovasc. Diabetol (2020) 19:72. doi: 10.1186/s12933-020-01046-z
8. Shu A, Du Q, Chen J, Gao Y, Zhu Y, Lv G, et al. Catalpol Ameliorates Endothelial Dysfunction and Inflammation in Diabetic Nephropathy via Suppression of RAGE/RhoA/ROCK Signaling Pathway. Chem Biol Interact (2021) 348:109625. doi: 10.1016/j.cbi.2021.109625
9. Bakris GL, Agarwal R, Anker SD, Pitt B, Ruilope LM, Rossing P, et al. Effect of Finerenone on Chronic Kidney Disease Outcomes in Type 2 Diabetes. N Engl J Med (2020) 383:2219–29. doi: 10.1056/NEJMoa2025845
10. Srivastava SP, Goodwin JE, Kanasaki K, Koya D. Metabolic Reprogramming by N-Acetyl-Seryl-Aspartyl-Lysyl-Proline Protects Against Diabetic Kidney Disease. Br J Pharmacol (2020) 177:3691–711. doi: 10.1111/bph.15087
11. Montinaro V, Cicardi M. ACE Inhibitor-Mediated Angioedema. Int Immunopharmacol (2020) 78:106081. doi: 10.1016/j.intimp.2019.106081
12. Giordo R, Ahmed YMA, Allam H, Abusnana S, Pappalardo L, Nasrallah GK, et al. EndMT Regulation by Small RNAs in Diabetes-Associated Fibrotic Conditions: Potential Link With Oxidative Stress. Front Cell Dev Biol (2021) 9:683594:683594. doi: 10.3389/fcell.2021.683594
13. Loeffler I, Wolf G. Epithelial-To-Mesenchymal Transition in Diabetic Nephropathy: Fact or Fiction? Cells (2015) 4:631–52. doi: 10.3390/cells4040631
14. Srivastava SP, Zhou H, Setia O, Liu B, Kanasaki K, Koya D, et al. Loss of Endothelial Glucocorticoid Receptor Accelerates Diabetic Nephropathy. Nat Commun (2021) 12:2368–8. doi: 10.1038/s41467-021-22617-y
15. Wang J, Liew OW, Richards AM, Chen YT. Overview of MicroRNAs in Cardiac Hypertrophy, Fibrosis, and Apoptosis. Int J Mol Sci (2016) 17(5). doi: 10.3390/ijms17050749
16. Liang G, Song L, Chen Z, Qian Y, Xie J, Zhao L, et al. Fibroblast Growth Factor 1 Ameliorates Diabetic Nephropathy by an Anti-Inflammatory Mechanism. Kidney Int (2018) 93:95–109. doi: 10.1016/j.kint.2017.05.013
17. Fioretto P, Caramori ML, Mauer M. The Kidney in Diabetes: Dynamic Pathways of Injury and Repair. The Camillo Golgi Lecture 2007. Diabetologia (2008) 51:1347–55. doi: 10.1007/s00125-008-1051-7
18. Bohle A, Wehrmann M, Bogenschütz O, Batz C, Müller CA, Müller GA. The Pathogenesis of Chronic Renal Failure in Diabetic Nephropathy. Investigation of 488 Cases of Diabetic Glomerulosclerosis. Pathol Res Pract (1991) 187:251–9. doi: 10.1016/s0344-0338(11)80780-6
19. Krebs LT, Xue Y, Norton CR, Shutter JR, Maguire M, Sundberg JP, et al. Notch Signaling Is Essential for Vascular Morphogenesis in Mice. Genes Dev. (2000) 14:1343–52. doi: 10.1101/gad.14.11.1343
20. Song N, Wang H, Gu T, Qi J, Yang J, Qiu Y, et al. Sonic Hedgehog-C-Jun N-Terminal Kinase-Zinc Finger Protein Gli1 Signaling Protects Against High Glucose Concentration-Induced Reactive Oxygen Species Generation in Human Fibroblasts. Exp Ther Med (2018) 15:5084–90. doi: 10.3892/etm.2018.6074
21. Al-Ayadhi LY. Relationship Between Sonic Hedgehog Protein, Brain-Derived Neurotrophic Factor and Oxidative Stress in Autism Spectrum Disorders. Neurochem Res (2012) 37:394–400. doi: 10.1007/s11064-011-0624-x
22. Zhang RY, Qiao ZY, Liu HJ, Ma JW. Sonic Hedgehog Signaling Regulates Hypoxia/Reoxygenation-Induced H9C2 Myocardial Cell Apoptosis. Exp Ther Med (2018) 16:4193–200. doi: 10.3892/etm.2018.6678
23. Price DA, Porter LE, Gordon M, Fisher ND, De'Oliveira JM, Laffel LM, et al. The Paradox of the Low-Renin State in Diabetic Nephropathy. J Am Soc Nephrol JASN (1999) 10:2382–91. doi: 10.1681/ASN.V10112382
24. Zhong W, Jiang Z, Zhou TB. RETRACTED: Association Between the ACE I/D Gene Polymorphism and T2DN Susceptibility: The Risk of T2DM Developing Into T2DN in the Asian Population. J Renin Angiotensin Aldosterone Syst (2015) 16:NP35. doi: 10.1177/1470320314566019
25. Wang F, Fang Q, Yu N, Zhao D, Zhang Y, Wang J, et al. Association Between Genetic Polymorphism of the Angiotensin-Converting Enzyme and Diabetic Nephropathy: A Meta-Analysis Comprising 26,580 Subjects. J Renin Angiotensin Aldosterone Syst (2012) 13:161–74. doi: 10.1177/1470320311417655
26. Zhou TB, Yin SS, Qin YH. Association Between Angiotensin-Converting Enzyme Insertion/Deletion Gene Polymorphism and End-Stage Renal Disease Susceptibility. J Renin Angiotensin Aldosterone Syst (2014) 15:22–31. doi: 10.1177/1470320312460898
27. Glenn KL, Du ZQ, Eisenmann JC, Rothschild MF. An Alternative Method for Genotyping of the ACE I/D Polymorphism. Mol Biol Rep (2009) 36:1305–10. doi: 10.1007/s11033-008-9313-5
28. American Diabetes A. 2. Classification and Diagnosis of Diabetes: Standards of Medical Care in Diabetes-2018. Diabetes Care (2018) 41:S13–27. doi: 10.2337/dc18-S002
29. American Diabetes, A. Microvascular Complications and Foot Care: Standards of Medical Care in Diabetes-2020. Diabetes Care (2020) 43:S135–51. doi: 10.2337/dc20-S011
30. Association, A. D. Microvascular Complications and Foot Care. Diabetes Care (2017) 40:S88–98. doi: 10.2337/dc17-S013
31. Bennett PH, Haffner S, Kasiske BL, Keane WF, Mogensen CE, Parving HH, et al. Screening and Management of Microalbuminuria in Patients With Diabetes Mellitus: Recommendations to the Scientific Advisory Board of the National Kidney Foundation From an Ad Hoc Committee of the Council on Diabetes Mellitus of the National Kidney Foundation. Am J Kidney Dis (1995) 25:107–12. doi: 10.1016/0272-6386(95)90636-3
32. Xiong Y, Zhou L. The Signaling of Cellular Senescence in Diabetic Nephropathy. Oxid Med Cell Longev (2019) 2019:7495629. doi: 10.1155/2019/7495629
33. Szabóová E, Lisovszki A, Fatľová E, Kolarčik P, Szabó P, Molnár T. Prevalence of Microalbuminuria and Its Association With Subclinical Carotid Atherosclerosis in Middle Aged, Nondiabetic, Low to Moderate Cardiovascular Risk Individuals With or Without Hypertension. Diagnostics (Basel) (2021) 11(9). doi: 10.3390/diagnostics11091716
34. Naz I, Walters E, Akbari CM, Attinger CE, Kim PJ. Noninvasive Vascular Assessment of Lower Extremity Wounds in Diabetics: Are We Able to Predict Perfusion Deficits? Surg Technol Int (2017) 31:66–74.
35. Mima A. Incretin-Based Therapy for Prevention of Diabetic Vascular Complications. J. Diabetes Res (2016) 2016:1–12. doi: 10.1155/2016/1379274
36. Wang X, Li J, Huo L, Feng Y, Ren L, Yao X, et al. Clinical Characteristics of Diabetic Nephropathy in Patients With Type 2 Diabetic Mellitus Manifesting Heavy Proteinuria: A Retrospective Analysis of 220 Cases. Diabetes Res Clin Pract. (2019) 107874. doi: 10.1016/j.diabres.2019.107874
37. Moriya T, Matsubara M, Kishihara E, Yoshida Y, Ouchi M. Type 2 Diabetic Patients With Diabetic Retinopathy and Concomitant Microalbuminuria Showed Typical Diabetic Glomerulosclerosis and Progressive Renal Dysfunction. J. Diabetes Complications (2016) 30:1111–6. doi: 10.1016/j.jdiacomp.2016.04.007
38. Zhang J, Wang Y, Li L, Zhang R, Guo R, Li H, et al. Diabetic Retinopathy may Predict the Renal Outcomes of Patients With Diabetic Nephropathy. Ren Fail (2018) 40:243–51. doi: 10.1080/0886022X.2018.1456453
39. Crisan D, Carr J. Angiotensin I-Converting Enzyme: Genotype and Disease Associations. J Mol Diagn (2000) 2:105–15. doi: 10.1016/s1525-1578(10)60624-1
40. Bernstein KE, Gonzalez-Villalobos RA, Giani JF, Shah K, Bernstein E, Janjulia T, et al. Angiotensin-Converting Enzyme Overexpression in Myelocytes Enhances the Immune Response. Biol Chem (2014) 395:1173–8. doi: 10.1515/hsz-2013-0295
41. Patel S, Rauf A, Khan H, Abu-Izneid T. Renin-Angiotensin-Aldosterone (RAAS): The Ubiquitous System for Homeostasis and Pathologies. Biomed Pharmacother (2017) 94:317–25. doi: 10.1016/j.biopha.2017.07.091
42. Kobori H, Nangaku M, Navar LG, Nishiyama A. The Intrarenal Renin-Angiotensin System: From Physiology to the Pathobiology of Hypertension and Kidney Disease. Pharmacol Rev (2007) 59:251–87. doi: 10.1124/pr.59.3.3
Keywords: type 2 diabetic mellitus, diabetic nephropathy, angiotensin converting enzyme, diabetic retinopathy, RAAS
Citation: Huang K, Liang Y, Wang K, Ma Y, Wu J, Luo H and Yi B (2022) Elevated ACE Levels Indicate Diabetic Nephropathy Progression or Companied Retina Impaired. Front. Clin. Diabetes Healthc. 3:831128. doi: 10.3389/fcdhc.2022.831128
Received: 14 December 2021; Accepted: 03 January 2022;
Published: 12 May 2022.
Edited by:
Swayam Prakash Srivastava, Yale University, United StatesReviewed by:
Bibek Poudel, University of Pennsylvania, United StatesAthanasia Papazafiropoulou, Tzaneio Hospital, Greece
Copyright © 2022 Huang, Liang, Wang, Ma, Wu, Luo and Yi. This is an open-access article distributed under the terms of the Creative Commons Attribution License (CC BY). The use, distribution or reproduction in other forums is permitted, provided the original author(s) and the copyright owner(s) are credited and that the original publication in this journal is cited, in accordance with accepted academic practice. No use, distribution or reproduction is permitted which does not comply with these terms.
*Correspondence: Bin Yi, eHl5aWJpbkAxNjMuY29t