 Ngadhnjim Sutaj1,2*
 Martin Walchshofer1
 Leonhard Schreiner1,3
 Luca Turchet2
 Harald Pretl3
 Christoph Guger1
- 1g.tec Guger Technologies OG/g.tec Medical Engineering GmbH, Schiedlberg, Austria
- 2Department of Information Engineering and Computer Science, University of Trento, Trento, Italy
- 3Institute for Integrated Circuits, Johannes Kepler University, Linz, Austria
Brain–computer interfaces (BCIs) establish communication between a human brain and a computer or external devices by translating the electroencephalography (EEG) signal into computer commands. After stimulating a sensory organ, a positive deflection of the EEG signal between 250 and 700 ms can be measured. This signal component of the event-related potential (ERP) is called “P300.” Numerous studies have provided evidence that the P300 amplitude and latency are linked to sensory perception, engagement, and cognition. Combining the advances in technology, classification methods, and signal processing, we developed a novel image ranking system called the Unicorn Blondy Check. In this study, the application was tested on 21 subjects using three different visual oddball paradigms. Two consisted of female faces and gray-scale images, while the third test paradigm consisted of familiar and unfamiliar faces. The images were displayed for a duration of 150 ms in a randomized order. The system was trained using 50 trials and tested with 30 trials. The EEG data were acquired using the Unicorn Hybrid Black eight-channel BCI system. These synchronized recordings were analyzed, and the achieved classification accuracies were calculated. The EEG signal was averaged over all participants and for every paradigm separately. Analysis of the EEG data revealed a significant shift in the P300 latency dependent on the paradigm and decreased amplitude for a lower target to non-target ratio. The image ranking application achieved a mean accuracy of 100 and 95.5% for ranking female faces above gray-scale images with ratios of 1:11 and 5:11, respectively. In the case of four familiar faces to 24 unfamiliar faces, 86.4% was reached. The obtained results illustrate this novel system’s functionality due to accuracies above chance levels for all subjects.
1 Introduction
Brain–computer interfaces (BCIs) establish communication between a human brain and a computer or external devices. The BCI translates information of electrophysiological signals measured from the scalp via electroencephalography (EEG) or directly from the cortex using electrocorticography into computer commands (Wolpaw et al., 2002). EEG-based BCIs provide an inexpensive, straightforward, and noninvasive method for studying neural activities. Therefore, they are widely used in research environments and commercial applications. Principles on which BCIs rely are motor-imagery, slow waves, steady-state visual evoked potentials (VEPs), and evoked potentials (Schomer and Silva, 2010; Nicolas-Alonso and Gomez-Gil, 2012). Pfurtscheller (2001) was one of the first to show a correlation between the EEG signal and imagining body movement called event-related synchronization and desynchronization.
In recent years, there has been growing interest in studying cognitive neuroscience with the help of EEG-based BCIs. A robust methodology to study cognitive processing is event-related potentials (ERPs) (Woodman, 2010). When exposed to specific events or stimuli, brain structures generate these ERPs. The type of evoked potential depends on the presented stimulus. Whether auditory, olfactory, or visual evoked potentials, they all result in the corresponding ERP (Sato et al., 1996). VEPs, a subcategory of ERPs, find widespread use in BCIs, where they enable information exchange without physical inputs (Nicolas-Alonso and Gomez-Gil, 2012; Zhang et al., 2012). While visual stimuli are mainly used, auditory and tactile stimuli have also been useful in BCI applications (Gao et al., 2014; Lugo et al., 2014).
Specific components within the ERP, called cognitive negative variation and P300, were first discovered by Walter et al. (1964). P300, in this context, represents the positive deflection of the ERPs amplitude about 250–700 ms after a novel stimulus compared to the previous stimuli is presented (Donchin and Smith, 1970; Rugg and Coles, 1995). Numerous studies have provided evidence that P300 is linked to sensory perception, engagement, and cognition (Woodman, 2010; Chen et al., 2020). These discoveries have made P300 an essential parameter in neuroscience. Aiming to leverage the P300 component, the standard paradigm used in P300-based BCIs is the “oddball” paradigm (Luck, 2014). The paradigm relies on the fact that an unexpected stimulus triggers a higher P300 amplitude than a reference stimulus. On the other hand, results from several studies have suggested that unexpected or rare stimuli always produce a P300 (Groppe et al., 2011), (Chen et al., 2020). Also, it has been observed that a lower probability of a target stimulus results in a higher P300 amplitude (Polich et al., 1996), (Duncan-Johnson and Donchin, 1977).
Farwell and Donchin (1988) proposed the first P300-based BCI. A six-by-six matrix composed of letters representing different commands was presented to the subjects. Then the columns and rows of the matrix were flashed rapidly in a random order, and the subjects were asked to focus on the desired letter and count the number of flashes. Only flashes of rows and columns containing the desired letter evoke P300 potentials. Commonly used in BCI research for this kind of application is the term P300-speller. Besides the row/column speller mentioned above, single-character spellers have also been investigated. The basic idea with single-character spellers is that a lower probability of the target occurring triggers a higher P300 response. However, no higher P300 amplitude or more reliable control of single-character spellers compared to spellers could be confirmed in prior studies (Guger et al., 2009).
Several feature extraction and classification procedures have been investigated to enhance the performance of P300-based BCIs (Krusienski et al., 2008). Methods such as linear discriminant analysis (Guger et al., 2009), stepwise linear discriminant analysis (Sellers and Donchin, 2006), support vector machines (Thulasidas et al., 2006), and matched filtering (Serby et al., 2005) have been utilized in P300-based BCIs. The field is maturing with the adoption of new machine learning algorithms that reduce the amount of training data required to achieve sufficient classification accuracy, such as the time-variant Linear discriminant analysis proposed by Gruenwald et al. (2019). Complementing these advances, researchers have also focused on improving P300-based BCIs’ slow communication rates (Martens et al., 2009; Takano et al., 2009; Mugler et al., 2010).
Relevant to the application of P300-based BCIs in the nonclinical area are studies that hint at the P300 latency and shape change due to the cognitive processes associated with the stimulus processing. Specifically, it is suggested that the latency is related to the time it takes the person to process the oddball stimulus and that the P300 component of the ERP might be linked to sensory perception, engagement, and cognition (McCarthy and Donchin, 1981; Magliero et al., 1984; Rugg and Coles, 1996; Comerchero and Polich, 1999; Polich, 2007). Although a large body of research exists, suggesting the P300 shape, amplitude, and latency correlate with the underlying stimuli, only a few applications have adopted this groundwork for commercial and clinical use. Mainly spelling systems such as the intendiX system (Guger et al., 2016) or the mindBEAGLE BCI for patients with disorders of consciousness (Guger et al., 2017) are currently available.
Leveraging the previously mentioned research and advances, g.tec neurotechnology GmbH has developed the Unicorn Blondy Check. This application is presented in this study and aims to advance neuromarketing and enable new VEP research findings. Based on synchronizing the EEG samples with the image presentation, the system uses the P300 response to assign a score value to the displayed images and ranks the images according to that score value.
This study aims to present and validate a working EEG-based image ranking software. For this purpose, we investigated whether features extracted from a live EEG recording can be used to select and rank images with an accuracy above chance level. Subsequently, the application can be applied as a ranking system to reduce the time for sorting/labeling/selecting numerous images and for further research on the connection between the EEG and cognition.
2 Materials and Methods
2.1 Apparatus
The EEG signal was recorded using the Unicorn Hybrid Black system (g.tec neurotechnology GmbH, 2020; Accessed: 2021-27-01). The biosignal amplifier was connected to a personal computer using the integrated Bluetooth interface. The apparatus provides a 24-Bit conversion with a sampling rate of 250 Hz. Eight channels are recorded on the following positions:
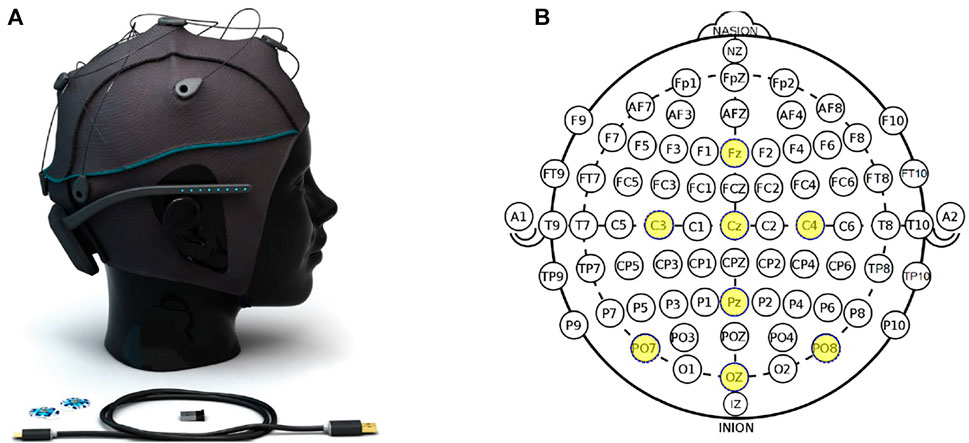
FIGURE 1. (A) Unicorn Hybrid Black system, (B) the electrode positions of the system. Ground and reference are fixed on the mastoids using disposable sticker-based surface electrodes and not visible in the graphic.
2.2 Paradigm Design
For the image ranking experiment, different random patterns of images need to be generated to train and test the image ranking system. These patterns are referred to as paradigms P1, P2, P3, and P4. They are essentially oddball paradigms. To create these paradigms, the application’s paradigm editor is used. The oddball in P1 and P2 is a colored picture of a female face compared to gray-scale images, while the oddball in P3 and P4 is a familiar face compared to unfamiliar faces. P1 has one target and 11 non-targets, P2 has four targets and 11 non-targets, P3 has four targets and 24 non-targets, and P4 has one target and 11 non-targets. The four different paradigms are summarized in Table 1, while the images used for each paradigm are depicted in Figure 2. The pictures of the familiar faces are unique for each subject. Thus they are replaced by placeholders-icons in Figures 2C,D. The ratio of 1:11 for target to non-target stimuli for the system’s calibration was chosen in accordance with P300-based speller systems (Guger et al., 2009). To test the system, paradigms with 1:11 as well as lower ratios of 4:11 and 4:24 were generated. These lower ratios were chosen to investigate if the decreases in P300-amplitude due to lower ratios as suggested by Duncan-Johnson and Donchin (1977) could lead to a decrease in Ranking performance. Regarding the choice of images, faces were chosen because recent work has shown that faces can improve P300 BCI performance (Guger et al., 2016).

TABLE 1. Composition of the four different paradigms used for the image ranking experiment.
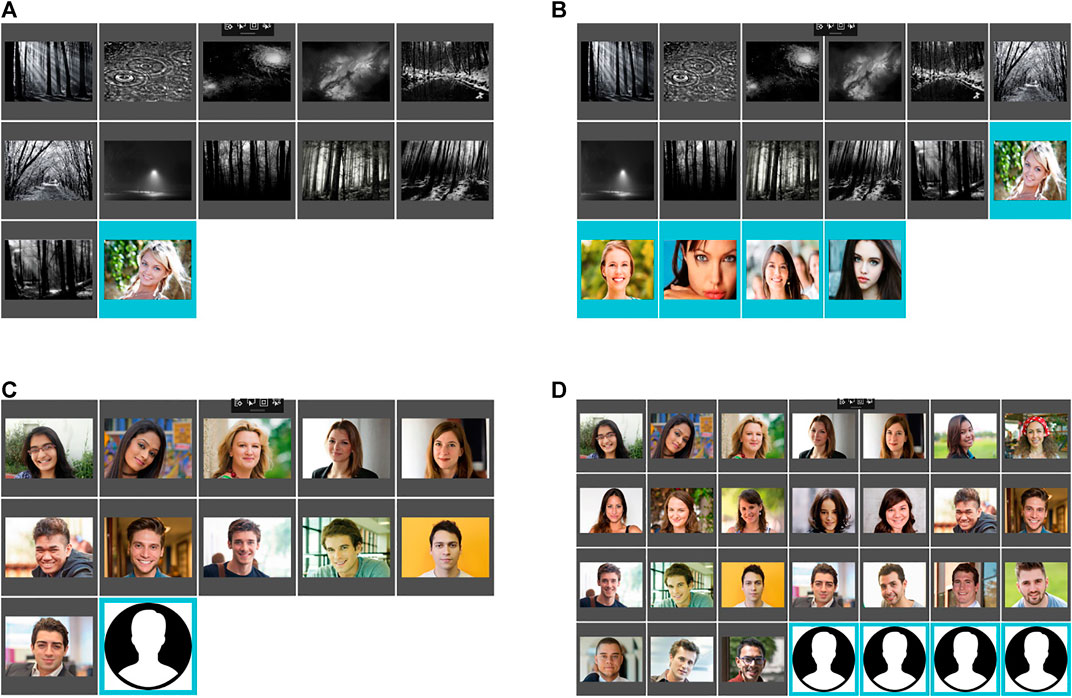
FIGURE 2. Image sets used for the oddball paradigms: (A) Paradigm 1 “P1″ containing one female face (target class) and 11 gray-scale images (non-target class), (B) Paradigm 2 “P2″ containing five female faces (target class) and 11 gray-scale images (non-target class), (C) Paradigm 4 “P4″ containing one familiar face (target class) and 11 unfamiliar faces (non-target class), (D) Paradigm 3 “P3″ containing four familiar faces (target class) and 24 unfamiliar faces (non-target class). The pictures of the familiar faces are different for each subject. Thus they are replaced by placeholders-icons in (C) and (D).
2.3 Participants and Procedure
Twenty-one subjects (9 males, 12 females), aged between 22 and 78 (mean age = 35, standard deviation = 14), took part in the study. All participants provided informed consent and were recruited through word-of-mouth. The study was approved by the responsible ethical committee (Ethikkommission des Landes Oberösterreich; Number D-35-16). The tests were conducted in multiple locations, mainly the home of the participants or g.tec company grounds. Special care was taken that the environment was as quiet as possible to keep the distraction to a minimum.
Participants were asked to sit in front of the computer screen. The system was placed on the subject’s head. Then, the EEG-cap was connected to the application via Bluetooth. The signal-quality was checked using the built-in signal quality feature. The contact impedance (electrode-scalp) was lowered by injecting electrode gel to improve the signal quality. The gel was applied to each of the eight electrodes of the EEG-cap. After this step, the signal quality evaluated by the system was within limits set by the system. The steps described above were done for every subject. Finally, the different test paradigms (Figure 2) were loaded. The EEG was recorded throughout the entire measurement. After completing the training, the test paradigms were loaded. The measurement procedure can be segmented into two parts, with each having training and a test phase, as described below.
2.3.1 Part One
During the first part of the measurement, the system was trained using P1 (one female face and 11 gray-scale images) as a training paradigm (Figure 2). The training consisted of 50 trials resulting in 50 target stimuli and 550 non-target stimuli, which amounted to a training time of 90 s. After completing the training, the system was tested using the paradigms P1, P2, and P3. Each test consisted of 10 trials and was performed three times resulting in 30 test trials for each paradigm. The measuring sequence of part one can be seen in Table 2.
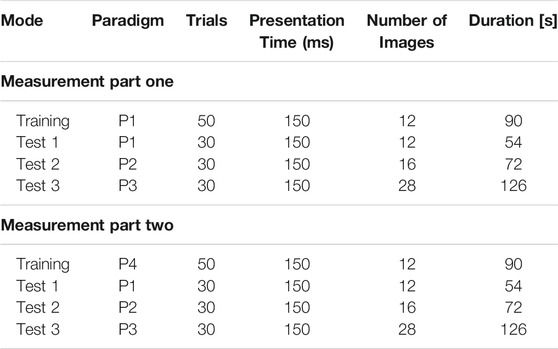
TABLE 2. Measurement structure. In part one, the application was trained on the VEP produced by a female face and gray-scale images (P1). In part two, familiar faces and unfamiliar faces (P4) were used for training. P1, P2, and P3 were used for testing. Each image was displayed 150 ms, with the next immediately following the previous. The training paradigm was presented 50 times, and each test paradigm 30 times.
2.3.2 Part Two
During the second part of the measurement, P4 (one familiar face, 11 unfamiliar faces) was loaded for the training paradigm (see Figure 2). Analogous to part one, the training consisted of 50 trials resulting in 50 target and 550 non-target stimuli, which amounted to a training time of 90 s. The trained system was tested using the paradigms P1, P2, and P3 analogously to part one. Each test consisted of 10 trials and was performed three times resulting in 30 test trials for each paradigm. The measuring sequence of part two can be seen in Table 2.
2.3.3 Stimulus Presentation Parameters
Each image was shown for a duration of 150 ms immediately followed by the next in the trial. No dark screen was displayed between the pictures, as shown in Figure 3. One trial consisted of 12 pictures for P1 and P4, 16 for P2, and 28 for P3, as summarized in Table 1. The application randomizes the order of the images during the trial. The training phase consisted of 50 and the testing phase consisted of 30 trials.
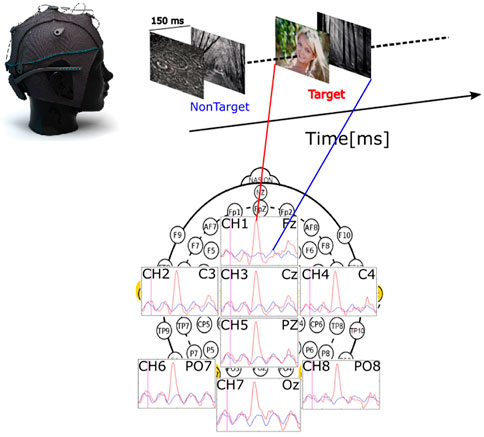
FIGURE 3. Schematic overview of the stimuli presentation with an example response averaged over the training trials of one subject with regard to electrode placement. The evoked potential is drawn in red for the target stimulus and blue for the non-target stimulus.
2.4 Data Processing and Classification
The EEG signals are acquired sample-wise from the Unicorn Hybrid Black system via the Bluetooth connection. The application then synchronizes the EEG samples with the image presentation. To reduce the mains line interference (50 Hz EU/60 Hz United States) the EEG samples are digitally filtered using a second-order 50 Hz Butterworth Notch filter followed by a second-order 60 Hz Butterworth Notch filter. Finally, a second-order Butterworth bandpass filter with a band ranging from 0.5 to 30 Hz is applied to improve the signal-to-noise ratio. After the single samples are filtered, 1,500 ms-epochs are created using 100 ms before and 1,400 ms after the stimulus onset. For feature extraction, each epoch is baseline corrected using the 100 ms before the stimulus. The epoch is downsampled by a factor of 1:12 and moving average filtered using a window size of 3. The mentioned procedure results in a feature with a length of 248 (31 samples * 8 channels). Eye blinks are not corrected/removed and there was no artifact rejection algorithm used.
2.5 Ranking
The target and non-target features recorded during the training phase are used to fit a time-variant linear discriminant analysis model. Cai et al. (2013) have already proven that a linear regression in the LDA subspace is mathematically equivalent to a low-rank linear regression. Based on this knowledge, the features generated by subsequent images during the ranking are projected into the LDA subspace and the resulting distance (score value) is used to rank the new images.
2.6 Data Evaluation
2.6.1 Electroencephalography Study
The system provides the user with the possibility of recording the stimulus synchronized EEG data during the experiment. The EEG recordings were averaged over the 30 trials and the 21 participants to visualize the recorded visual evoked potentials measured during the experiment. This averaging was done for every paradigm using the MATLAB R2020a software. Additionally, the P300 latency and amplitude were marked by means of maxima detection on the averaged waveforms for each paradigm. This results in one P300 amplitude and latency per electrode and paradigm. The amplitude and latency differences are examined for significance using a paired sample t-test.
2.6.2 Ranking Accuracy
The system produces score values for every displayed image. These values were compared to evaluate the image ranking performance. If the target class image had a higher score value than the non-target class’s images, the result was determined to be a successful ranking. The values for every image were averaged and compared again for each trial. This evaluation was done for 1 – 30 trials and further averaged over every subject (n = 21). Based on this information, a ranking accuracy could be estimated. This accuracy corresponds to the true positive rate described as the ratio between correct classifications and the total number of classifications.
3 Results
3.1 Electroencephalography Study
Figures 4, 5 depict the calculated difference between target and non-target stimuli averaged over 21 participants. Figure 4A illustrates the visual evoked potential produced by paradigm P1. Figure 4B shows the visual evoked potential produced by paradigm P2. Figure 5A corresponds to the Visual evoked potential produced by paradigm P3. Figure 5B illustrates the visual evoked potential produced by paradigm P4. The latency (
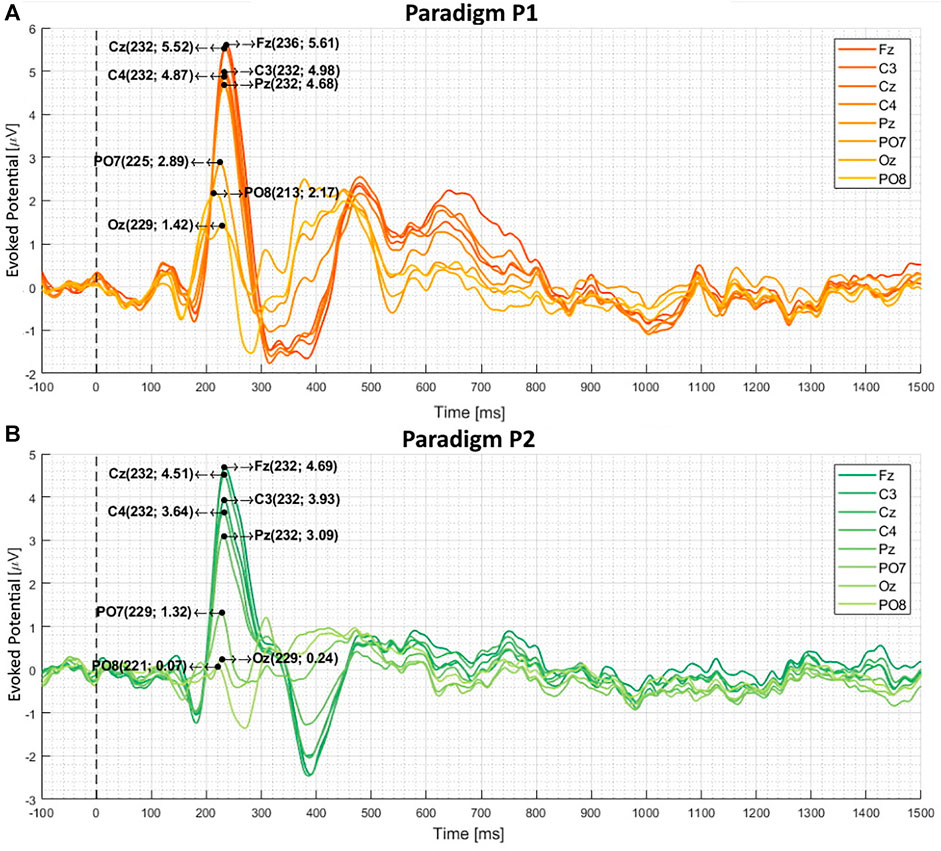
FIGURE 4. The calculated difference between target and non-target stimuli averaged over 21 subjects (A) and (B) depicts the visual evoked potential produced by paradigms P1 and P2, respectively. These two paradigms had female faces as targets and gray-scale images as non-targets. The black dotted line marks the stimulus presentation. The P300 latency and amplitude are noted in the brackets [(ms), (
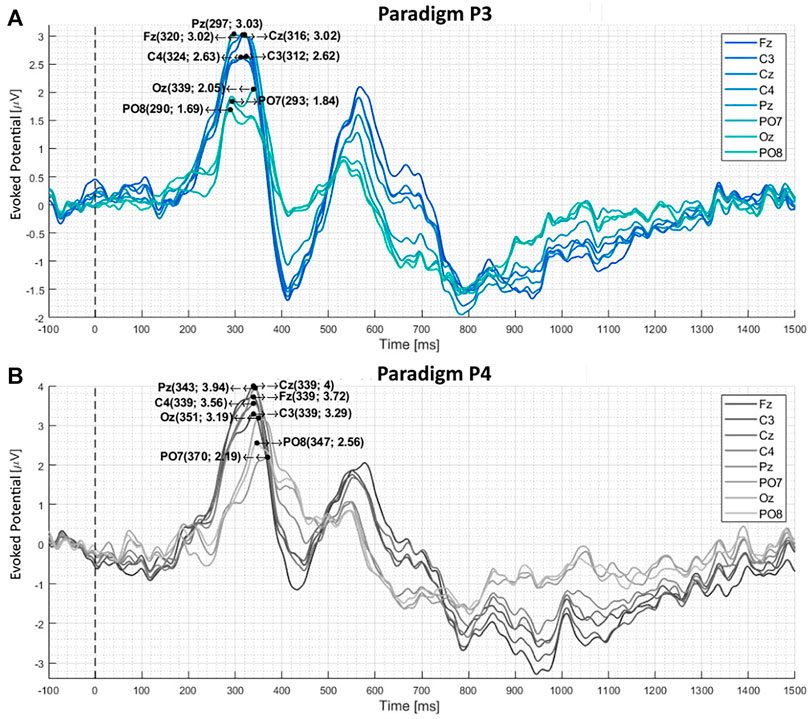
FIGURE 5. The calculated difference between target and non-target stimuli averaged over 21 subjects (A) and (B) depicts the visual evoked potential produced by paradigms P4 and P3, respectively. These two paradigms had familiar faces as targets and unfamiliar faces as non-targets. The black dotted line marks the stimulus presentation. The P300 latency and amplitude are noted in the brackets [(ms), (
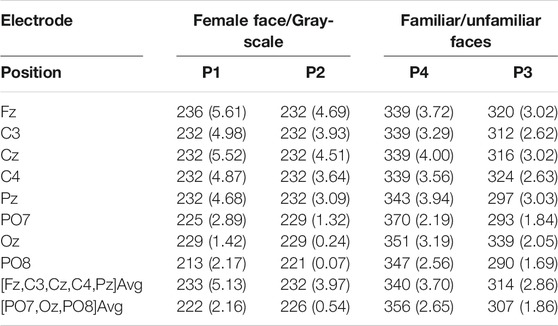
TABLE 3. P300 latency (
Paradigms with female faces and gray-scale images produce the following mean P300 latencies: For P1, the latency is 233 ms (Fz-Pz) and 222 ms (PO7-PO8). For P2, it is 232 ms (Fz-Pz) and 226 ms (PO7-PO8). Changing the paradigm to familiar and unfamiliar faces, the latency increases to 340 ms (Fz-Pz) and 356 ms (PO7-PO8) for P4 and 314 ms (Fz-Pz) and 307 ms (PO7-PO8) for P3. These values can be seen in Table 3.
The P300 amplitude evoked by paradigms with different target to non-target ratios decreases from 5.13
3.2 Image Ranking Performance
In this section, the accuracy results for the first and second parts of the experiment are presented. For part one, the application was trained on the EEG features produced by one female face (target) and 11 gray-scale images (non-targets). For part two, the system was trained on the EEG features produced by one familiar face (target) and 11 unfamiliar faces (non-targets). The training consisted of 50 trials. Paradigms P1, P2, and P3 were used for testing with 30 test trials each. Figure 6A depicts the accuracy for part one averaged over all subjects. Analogously Figure 6B shows the accuracy for part two averaged over all participants. Figures 6C,D depict the median accuracy as well as the range between the 25th and 75th percentiles (shaded area) for parts one and two respectively over all participants.
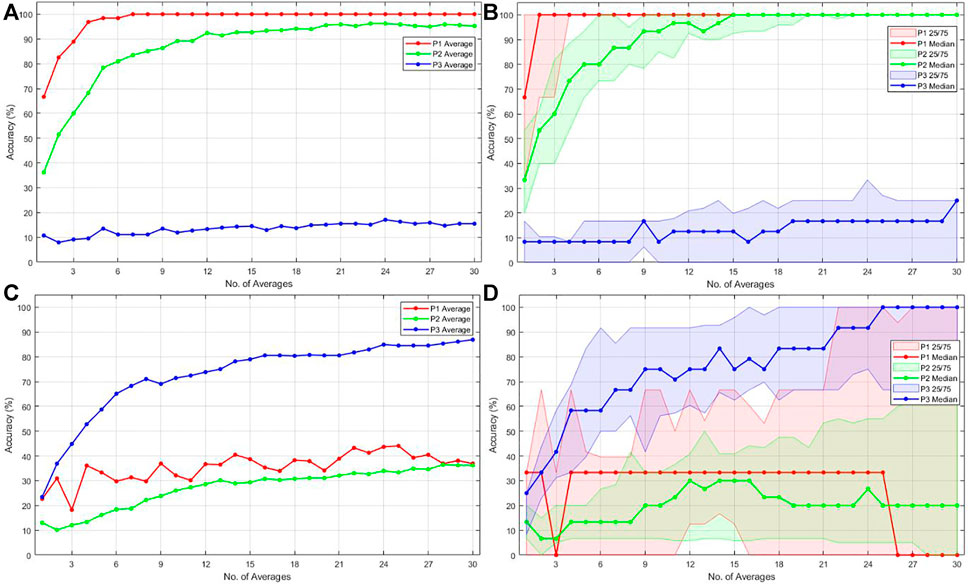
FIGURE 6. Accuracy results for 1 to 30 test trials and paradigms P1, P2, and P3 for 21 subjects. Measurement setup part one (A), (C) (Training paradigm P1) and part two (B), (D) (Training paradigm P4). On the left side (A) and (B) depict the average accuracy. On the right side (C) and (D) depict the median accuracy with the shaded area representing the 25th (Q1) and 75th (Q3) percentiles.
The results shown in Figures 6A,B are summarized in Table 4 by additional averaging over all trials. The achieved accuracy after 30 trials is listed in the column marked with “Final” and represents the ranking accuracy at 30 trials. For part one of the measurements, the application reached an online accuracy of 100, 95.5, and 14.8% for P1, P2, and P3, respectively. When switching the training paradigms the achieved accuracy changes to 38.6, 34.6, and 86.4% for P1, P2, and P3 in part two of the measurements.

TABLE 4. Ranking performance accuracy results, taken from Figure 6(A) for part one and Figure 6(B) for part two. The mean is an average of 1–30 test trials. The median is calculated of trials 1 to 30, and the final accuracy value is the achieved accuracy after 30 trials. Additionally, the accuracy difference between the two measurement parts is listed and is calculated by subtracting the respective accuracy value of part one (training with P1) from part two (training with P4).
4 Discussion
The main objective of this study was to evaluate and present a novel visual evoked potential-based image ranking BCI. In the first step, the recorded EEG signals are discussed. Second, the achieved accuracy will be addressed.
4.1 Electroencephalography Study
The P300 peak (averaged over all participants and trials) is visible in Figures 4, 5 for all paradigms (P1, P2, P3, P4) at the electrode positions
4.1.1 P300 and Task Complexity
When comparing the average target P300 response time of female/gray-scale (P1, P2) to familiar/unfamiliar faces (P3, P4) paradigms, a significant (p < 0.001) increase in the mean P300 latency can be seen at all electrode positions, visible in Figures 4, 5 and listed in Table 3. The delay could be caused by the task complexity associated with difficult stimulus discrimination, as Polich (2007) suggested. This complexity might be the case when distinguishing familiar from unfamiliar faces. In contrast, distinguishing a colored female face image from a gray-scale photo provides less of a challenge. Examining the average amplitude differences at the electrode positions Fz, C3, Cz, C4, and Pz analogously to the response times, a decrease for P4-P1 and P3-P2 is visible in Figures 4, 5. Only the comparison between P4-P1 should be considered, as both paradigms have an equal target to non-target ratios of (1:11), while P2 and P3 have a ratio of (5:11) and (4:24), respectively. This argument is based on the fact that the P300 amplitude induced by an oddball paradigm depends on the oddball stimulus’s rarity as described by (Luck, 2014), (Wolpaw, 2012), and (Duncan-Johnson and Donchin, 1977). The slightly higher amplitude of P1, compared to P4, could be caused by the stronger contrast between the target and non-target images. Consequently, the more pronounced difference could magnify the resulting P300 response, even though they have the same target to non-target ratio.
4.1.2 P300 and Target to Non-Target Ratio
As early as 1977, Duncan-Johnson and Donchin (1977) observed that the P300 amplitude correlates with the associated oddball a priori probability. Simply put, the less likely the oddball (target) stimulus is to occur, the higher the P300 amplitude. This observation is also visible in the measurement data. A significant (p < 0.001) decrease in amplitude is visible for the ratios of 1:11(P1) and 5:11 (P2) listed in Table 3. Analogously, a reduction in the P300 amplitude for 1:11(P4) and 4:24 (P3) is also visible.
To sum up section 4.1.2 and section 4.1.1, the P300 amplitude is highly dependent on the oddball frequency for any given paradigm. In contrast, the P300 latency and waveform shape are dependent on the task complexity of the specific paradigm class.
4.2 Classification Accuracy
The mean and median accuracy for the first and second parts of the measurement listed in Table 4 does not represent the achieved accuracy for 30 consecutive trials but rather the averaged accuracy for 1 to 30 trials. The achieved average accuracy for 30 trials is also listed in Table 4 in the “Final” accuracy columns. The EEG data were processed and classified online. No cross-validation was performed as the randomization constituted by cross-validation would lead to an over-optimistic accuracy estimation, as Wolpaw (2012) suggested. The combination of these two aspects led to a realistic accuracy assessment, as listed in Table 4. The final average accuracy after 30 trials combined with the mean and median can serve the purpose for a relative comparison between the test paradigms and, more importantly, between different training paradigms’ effects on the ranking performance. The average and median achieved online accuracy for a specific test trial count for all subjects is visible in Figure 6. The average rather than the median accuracy was discussed further, since the average is strongly affected by subjects where the application performed worse. Therefore, the average provides a more practical estimation.
4.3 Measurement for Part One
Figure 6A shows that an average accuracy of 100% for test paradigm P1 was reached after seven trials. Mean accuracy of 100% translates to the target images being ranked on top for all subjects after seven trials. The mean accuracy for test paradigm P2 never reached 100%. However, a satisfactory accuracy of 90% was eventually achieved at 10 test trials and increased to over 95% for 20-30 test trials. In paradigm P2, all five female face pictures must be ranked on top to be considered successful. This condition makes the estimate of accuracy even more conservative. An accuracy of 95.5% means that the application ranked all five female face pictures on top for more than 95.5% of the time for all subjects after 30 trials. The reason why even at 30 test trials, the accuracy for P2 never reached 100% could be that the training was performed on P1, and the target visual evoked potentials produced by P1 and P2 slightly differ in amplitude, as discussed in section 4.1. The visual evoked potential produced by P3 not only varies in amplitude but also significantly in latency and waveform, as discussed in section 4.1. This difference in waveform shape and amplitude could explain why the mean accuracy for test paradigm P3 never reached a good value with only 14.8% at 30 trials.
4.4 Measurement for Part Two
Using one familiar face and 11 unfamiliar faces (P4) as a training paradigm in the second part of the measurement results in an accuracy change for all test paradigms as expected when considering the EEG study results. The accuracy of test paradigms P1 and P2 decreased by 61.4 and 60.9%, respectively. The achieved accuracy at 30 test trials are depicted in Figure 6B and listed in Table 4. They are 38.6 and 34.6% for P1 and P2. The mean and median accuracy estimation for 1–30 trials from Table 4 shows a decrease by 61.4 and 62.7% for the ranking of test paradigm P1. Similarly, the mean and median accuracy estimation for test paradigm P2 decreased by 49.6 and 64.6%, respectively.
Confirming expectations that training the application on a paradigm consisting of a familiar face and unfamiliar faces, the achieved accuracy after 30 trials increases by 71.6–86.4% for paradigm P3. Similarly, the mean and median test accuracy for 1 to 30 trials for paradigm P3 increased by 59.1 and 65.2%. This is visible in Figure 6B and is listed in Table 4. To rephrase these results into a ranking performance, this means that all four familiar faces are ranked on top of the 24 unfamiliar faces by the application 86.4% of the time.
For paradigms P3 and P4, the subjects had to provide pictures of familiar faces, but these were not always of equivalent quality/brightness to the stock images. The quality variation could be why the accuracy in part two of the measurement for test paradigm P3 was not as high as the accuracy for P2 in part one. The quality of the images could be a significant factor due to the short presentation time of 150 ms.
In summary, it is plausible to state that the choice in training paradigm and the ratio of targets to non-targets for training and test paradigms are essential for the system’s performance. These choices change the resulting classification accuracy significantly. For example, training the application on P1 (female face/gray-scale) will not yield satisfactory ranking performance for test paradigm P3 (familiar/unfamiliar faces). Conversely, training the system on P4 (familiar/unfamiliar faces) will lead to a significantly better ranking performance for similar paradigms P3 (familiar/unfamiliar faces) but decrease the ranking performance for P1 and P2 (female face/gray-scale).
5 Conclusion and Future Work
This study focused on evaluating and presenting the image ranking software Unicorn Blondy Check. The software is based on the P300 component of the visually evoked potential. The evaluation was done by testing different visual paradigms and training the system to detect such differences. By studying the EEG recordings, it was possible to notice the differences in the visually evoked potential for each paradigm. These observed differences meet the expectations suggested by previous research (Donchin and Smith, 1970; McCarthy and Donchin, 1981; Magliero et al., 1984; Comerchero and Polich, 1999; Polich, 2007). Depending on the paradigm used for training, average accuracy of 100% for P1, 95.5% for P2, and 86.4% for P3 were achieved. Selecting the inappropriate training paradigm resulted in decreased ranking performance as expected from the EEG study findings.
Our results showcase the software’s image ranking capabilities. Even complex tasks such as ranking photos of familiar faces higher than unfamiliar faces yielded satisfactory results. Nevertheless, several open questions worth investigating in future research remain, which will improve the system’s performance. In future work, we plan to address the following:
• To change the stimulus presentation parameters (presentation-time, inter-stimuli-time, presentation order).
• To try different paradigms to investigate what is possible to classify (e.g., classifying affection, determining advertisements with the highest impact, or finding concealed information using paradigms containing crime-related images).
• To measure the accuracy of dry EEG acquisition.
The application areas of such a system are numerous. For researchers, this system can provide an easy-to-use tool for further investigation of the visual evoked potentials. It provides not only classification capabilities but also logs stimulus-synchronized EEG data. The build-in paradigm editor enables rapid testing. In neuromarketing, this system can supplement the existing methods for determining advertisement’s impact. With it, one can directly compare the brain’s responses to successful and unsuccessful advertising. The software can be used to check whether the image ranking presented in this study also works with paradigms that do not contain faces, for example, different shoe models and dishes or holiday destinations. However, to do this, one must construct calibration paradigms containing images of objects that the test person prefers in comparison with the others. Then sets of unknown images can be examined for preferences or lack of preferences. Researchers in the area of polygraphy and concealed information testing could also benefit from such an easy-to-use system. Finally, it can be a great hands-on learning tool for the everyday person and students interested in BCI as it is more affordable than other EEG systems on the market.
Data Availability Statement
The raw data supporting the conclusion of this article will be made available by the authors, without undue reservation.
Ethics Statement
The studies involving human participants were reviewed and approved by Ethikkommission des Landes Oberosterreich; Number D-35-16. The patients/participants provided their written informed consent to participate in this study.
Author Contributions
NS developed the methods, was involved in data acquisition, performed data processing, and prepared the manuscript. MW, LS assisted in data processing, results evaluation, and interpretation. LT, HP provided scientific input. CG founded g.tec medical engineering GmbH and supervised the project.
Funding
This work was funded by g.tec medical engineering GmbH.
Conflict of Interest
NS, MW, LS, and CG were employed by g.tec Guger Technologies OG/g.tec medical engineering GmbH.
The remaining authors declare that the research was conducted in the absence of any commercial or financial relationships that could be construed as a potential conflict of interest.
References
Cai, X., Ding, C., Nie, F., and Huang, H. (2013). “On the Equivalent of Low-Rank Linear Regressions and Linear Discriminant Analysis Based Regressions,” in Proceedings of the 19th ACM SIGKDD international conference on Knowledge discovery and data mining. Editor I. Volosyak (New York, NY; London United Kingdom: Association for Computing Machinery; Computational Intelligence and Neuroscience). doi:10.1145/2487575.2487701
Chen, Z., Jin, J., Daly, I., Zuo, C., Wang, X., and Cichocki, A. (2020). Effects of Visual Attention on Tactile P300 Bci. Comput. Intelligence Neurosci. 2020, 1–11. doi:10.1155/2020/6549189
Comerchero, M. D., and Polich, J. (1999). P3a and P3b from Typical Auditory and Visual Stimuli. Clin. Neurophysiol. 110, 24–30. doi:10.1016/s0168-5597(98)00033-1
Donchin, E., and Smith, D. B. D. (1970). The Contingent Negative Variation and the Late Positive Wave of the Average Evoked Potential. Electroencephalography Clin. Neurophysiol. 29, 201–203. doi:10.1016/0013-4694(70)90124-0
Duncan-Johnson, C. C., and Donchin, E. (1977). On Quantifying surprise: The Variation of Event-Related Potentials with Subjective Probability. Psychophysiology 14, 456–467. doi:10.1111/j.1469-8986.1977.tb01312.x
Farwell, L. A., and Donchin, E. (1988). Talking off the Top of Your Head: toward a Mental Prosthesis Utilizing Event-Related Brain Potentials. Electroencephalography Clin. Neurophysiol. 70, 510–523. doi:10.1016/0013-4694(88)90149-6
Gao, S., Wang, Y., Gao, X., and Hong, B. (2014). Visual and Auditory Brain-Computer Interfaces. IEEE Trans. Biomed. Eng. 61, 1436–1447. doi:10.1109/TBME.2014.2300164
Groppe, D. M., Urbach, T. P., and Kutas, M. (2011). Mass Univariate Analysis of Event-Related Brain Potentials/fields I: A Critical Tutorial Review. Psychophysiology 48, 1711–1725. doi:10.1111/j.1469-8986.2011.01273.x
Gruenwald, J., Znobishchev, A., Kapeller, C., Kamada, K., Scharinger, J., and Guger, C. (2019). Time-variant Linear Discriminant Analysis Improves Hand Gesture and finger Movement Decoding for Invasive Brain-Computer Interfaces. Front. Neurosci. 13, 901. doi:10.3389/fnins.2019.00901
g.tec neurotechnology GmbH (2021). Unicorn Blondy Check. Available at: https://www.unicorn-bi.com/blondy-check/(Accessed 01 27, 2021).
g.tec neurotechnology GmbH (2020). Unicorn Hybrid Black. Available at: https://www.unicorn-bi.com/brain-interface-technology/ (Accessed 01 27, 2021).
Guger, C., Daban, S., Sellers, E., Holzner, C., Krausz, G., Carabalona, R., et al. (2009). How many People Are Able to Control a P300-Based Brain–Computer Interface (Bci)? Neurosci. Lett. 462, 94–98. doi:10.1016/j.neulet.2009.06.045
Guger, C., Ortner, R., Dimov, S., and Allison, B. (2016). “A Comparison of Face Speller Approaches for P300 BCIs,” in 2016 IEEE International Conference on Systems, Man, and Cybernetics (SMC), Budapest, Hungary, 9–12 Oct 2016, (IEEE), 004809–004812.
Guger, C., Spataro, R., Allison, B. Z., Heilinger, A., Ortner, R., Cho, W., et al. (2017). Complete Locked-In and Locked-In Patients: Command Following Assessment and Communication with Vibro-Tactile P300 and Motor Imagery Brain-Computer Interface Tools. Front. Neurosci. 11, 251. doi:10.3389/fnins.2017.00251
Krusienski, D., Sellers, E., McFarland, D., Vaughan, T., and Wolpaw, J. (2008). Toward Enhanced P300 Speller Performance. J. Neurosci. Methods 167, 15–21. doi:10.1016/j.jneumeth.2007.07.017
Luck, S. J. (2014). An Introduction to the Event-Related Potential Technique. second edition. A Bradford Book. Cambridge: Mit Press. doi:10.1093/actrade/9780199672875.001.0001
Lugo, Z. R., Rodriguez, J., Lechner, A., Ortner, R., Gantner, I. S., Laureys, S., et al. (2014). A Vibrotactile P300-Based Brain–Computer Interface for Consciousness Detection and Communication. Clin. EEG Neurosci. 45, 14–21. doi:10.1177/1550059413505533
Magliero, A., Bashore, T. R., Coles, M. G., and Donchin, E. (1984). On the Dependence of P300 Latency on Stimulus Evaluation Processes. Psychophysiology 21, 171–186. doi:10.1111/j.1469-8986.1984.tb00201.x
Martens, S. M. M., Hill, N. J., Farquhar, J., and Schölkopf, B. (2009). Overlap and Refractory Effects in a Brain–Computer Interface Speller Based on the Visual P300 Event-Related Potential. J. Neural Eng. 6, 026003. doi:10.1088/1741-2560/6/2/026003
McCarthy, G., and Donchin, E. (1981). A Metric for Thought: a Comparison of P300 Latency and Reaction Time. Science 211, 77–80. doi:10.1126/science.7444452
Mugler, E. M., Ruf, C. A., Halder, S., Bensch, M., and Kubler, A. (2010). Design and Implementation of a P300-Based Brain-Computer Interface for Controlling an Internet Browser. IEEE Trans. Neural Syst. Rehabil. Eng. 18, 599–609. doi:10.1109/tnsre.2010.2068059
Nicolas-Alonso, L. F., and Gomez-Gil, J. (2012). Brain Computer Interfaces, a Review. Sensors 12, 1211–1279. doi:10.3390/s120201211
Pfurtscheller, G. (2001). Functional Brain Imaging Based on Erd/ers. Vis. Res. 41, 1257–1260. doi:10.1016/S0042-6989(00)00235-2
Polich, J., Ellerson, P. C., and Cohen, J. (1996). P300, Stimulus Intensity, Modality, and Probability. Int. J. Psychophysiology 23, 55–62. doi:10.1016/0167-8760(96)00028-1
Polich, J. (2007). Updating P300: An Integrative Theory of P3a and P3b. Clin. Neurophysiol. 118, 2128–2148. doi:10.1016/j.clinph.2007.04.019
M. D. Rugg, and M. G. H. Coles (Editors) (1995). Electrophysiology of Mind: Event-Related Brain Potentials and Cognition. Electrophysiology of Mind: Event-Related Brain Potentials and Cognition. New York, NY, USPage: Oxford University Press, xii, 220.
Rugg, M. D., and Coles, M. G. H. (1996). Electrophysiology of Mind. Oxford: Oxford University Press. doi:10.1093/acprof:oso/9780198524168.001.0001
Sato, M., Kodama, N., Sasaki, T., and Ohta, M. (1996). Olfactory Evoked Potentials: Experimental and Clinical Studies. J. Neurosurg. 85, 1122–1126. doi:10.3171/jns.1996.85.6.1122
Schomer, D. L., and Silva, F. L. D. (2010). Niedermeyer’s Electroencephalography: Basic Principles, Clinical Applications, and Related Fields. 6th revised edition edn. Philadelphia: Lippincott Williams & Wilki.
Sellers, E. W., and Donchin, E. (2006). A P300-Based Brain–Computer Interface: Initial Tests by Als Patients. Clin. Neurophysiol. 117, 538–548. doi:10.1016/j.clinph.2005.06.027
Serby, H., Yom-Tov, E., and Inbar, G. F. (2005). An Improved P300-Based Brain-Computer Interface. IEEE Trans. Neural Syst. Rehabil. Eng. 13, 89–98. doi:10.1109/TNSRE.2004.841878
Takano, K., Komatsu, T., Hata, N., Nakajima, Y., and Kansaku, K. (2009). Visual Stimuli for the P300 Brain–Computer Interface: A Comparison of white/gray and green/blue Flicker Matrices. Clin. Neurophysiol. 120, 1562–1566. doi:10.1016/j.clinph.2009.06.002
Thulasidas, M., Guan, C., and Wu, J. (2006). Robust Classification of Eeg Signal for Brain–Computer Interface. IEEE Trans. Neural Syst. Rehabil. Eng. 14, 24–29. doi:10.1109/TNSRE.2005.862695
Walter, W. G., Cooper, R., Aldridge, V. J., McCALLUM, W. C., and Winter, A. L. (1964). Contingent Negative Variation : An Electric Sign of Sensori-Motor Association and Expectancy in the Human Brain. Nature 203, 380–384. doi:10.1038/203380a0
Wolpaw, J. R., Birbaumer, N., McFarland, D. J., Pfurtscheller, G., and Vaughan, T. M. (2002). Brain–computer Interfaces for Communication and Control. Clin. Neurophysiol. 113, 767–791. doi:10.1016/S1388-2457(02)00057-3
Wolpaw, J. R. (2012). Brain-computer Interfaces: Principles and Practice. Oxford: Oxford University Press. doi:10.1093/acprof:oso/9780195388855.001.0001
Woodman, G. F. (2010). A Brief Introduction to the Use of Event-Related Potentials in Studies of Perception and Attention. Atten. Percept. Psychophys. 72, 2031–2046. doi:10.3758/BF03196680
Keywords: BCI, EEG, P300, neuromarketing, image-ranking, VEP, cognition, familiarity
Citation: Sutaj N, Walchshofer M, Schreiner L, Turchet L, Pretl H and Guger C (2021) Evaluating a Novel P300-Based Real-Time Image Ranking BCI. Front. Comput. Sci. 3:661224. doi: 10.3389/fcomp.2021.661224
Received: 30 January 2021; Accepted: 12 May 2021;
Published: 14 June 2021.
Edited by:
Anton Nijholt, University of Twente, NetherlandsReviewed by:
Tomasz Maciej Rutkowski, RIKEN Center for Advanced Intelligence Project (AIP), JapanFelix Putze, University of Bremen, Germany
Copyright © 2021 Sutaj, Walchshofer, Schreiner, Turchet, Pretl and Guger. This is an open-access article distributed under the terms of the Creative Commons Attribution License (CC BY). The use, distribution or reproduction in other forums is permitted, provided the original author(s) and the copyright owner(s) are credited and that the original publication in this journal is cited, in accordance with accepted academic practice. No use, distribution or reproduction is permitted which does not comply with these terms.
*Correspondence: Ngadhnjim Sutaj, c3V0YWpAZ3RlYy5hdA==