 Yuanyuan Chen
 Yang Liu1,2,3
 Yanling Liu
- 1Key Laboratory of Aquatic Plant and Watershed Ecology, Wuhan Botanical Garden, Chinese Academy of Sciences, Wuhan, China
- 2Hubei Key Laboratory of Wetland Evolution and Ecological Restoration, Wuhan Botanical Garden, Chinese Academy of Sciences, Wuhan, China
- 3University of Chinese Academy of Sciences, Beijing, China
Wild rice (Zizania latifolia) is an important genetic resource and it has important ecological functions in aquatic ecosystems as well. Here, we used landscape genetics to investigate how the landscape features, including rivers, mountains and habitat fragmentation, affect the genetic connectivity or create dispersal barriers for Z. latifolia. In this report, seventeen populations from the Sanjiang Plain and its surrounding areas were genotyped by ten microsatellite markers. A high genetic differentiation and genetic discontinuity were found among populations within each river investigated, suggesting that the rivers be not acting as corridors for dispersal. Meanwhile, genetic discontinuity was detected from different sides of the Lesser Khingan and its branch, the Qinghei Mountains, demonstrating that gene flow was blocked by the complex topography of mountains. The results that historical gene flow was much higher than the contemporary gene flow might infer that recent habitat fragmentation resulted in decreased gene flow. For all sampled Z. latifolia populations, the result of low level of genetic variation (na = 2.3, HE = 0.328) and high genetic divergence (FST = 0.405, Dest = 0.414 and Øpt = 0.424) was consistent with the decreased gene flow, an inbreeding system and repeated genetic bottlenecks. A conservation strategy for protecting as many populations as possible to maximize genomic representation of the species is proposed. In addition, dredging the watercourses should be carried out to improve habitat stability and to facilitate connectivity among populations.
Introduction
Dispersal is a key process to determine the fate of populations and species, and it becomes more and more important due to pressures from habitat fragmentation, land-use change and climate change (Aavik et al., 2013; Sondermann et al., 2015; Wubs et al., 2016). Likewise, species' genetic diversity can significantly contribute to their adaptability to ever-changing environments (Hughes et al., 2008). Therefore, a good understanding of gene flow patterns and genetic diversity could help effective protection of endangered species and quality management of economically or ecologically important species (Yan et al., 2016).
With the advanced molecular tools, some investigators developed a landscape genetic approach to study the effects of landscape composition, configuration and matrix quality on gene flow and spatial genetic variation (Manel et al., 2003). One of the major topics of landscape genetics is to identify potential barriers or corridors for dispersal (Guillot et al., 2005; Storfer et al., 2007). For example, rivers, which facilitate movement of individuals and genes across the landscape, are generally recognized as corridors for riparian or aquatic plants (Chen et al., 2012a,b; Yan et al., 2016). On the other hand, mountain ridges as geographical barriers may hinder gene flow and cause genetic differentiation in plants (Tsuda et al., 2010). Fragmentations in habitats may disrupt or reduce gene flow and erode the genetic variation of plants (Werth et al., 2014). In a riparian-mountain landscape, rivers or streams in mountainous areas are usually located at the bottom of valleys, and the distribution patterns of streamside or riparian plants are generally fragmented by natural (e.g., highlands) and man-made (e.g., dams and reclamation) barriers. In this situation, it is difficult to predict the genetic structure of riparian species when the competing factors (rivers, mountains and fragmentation) might work together on historical or current dispersal of seeds or vegetative propagules. The consequences of fragmentation in riparian-mountain habitats are less well understood, though previous researches are available for a few streamside tree species (Hu et al., 2010; Wei et al., 2013). In the example of the streamside tree, Euptelea pleiospermum Hook. f. et Thoms, mountain ridges were genetic barriers; whereas river valleys provided important corridors for dispersal (Wei et al., 2013). If growth and dispersal were considered, riparian or aquatic plants may be more dependent upon rivers. Based on current available data, there raise some questions: Can we make the same conclusion as for the tree species? Or is the corridor function of rivers reduced by fragmentations?
The Sanjiang Plain is the largest area of freshwater marsh in China. The alluvial plain is drained by the Heilong River and its main tributaries (the Songhua River and Wusuli River), and it is surrounded by mountains (the Wanda Mountains and Qinghei Mountains). However, the plain has suffered from intensive reclamation over the past 50 years (1954–2005) as shown by the facts that more than 75% of its wetlands have disappeared (Wang et al., 2011). The range of geographical and anthropogenic factors in the plain provided excellent opportunities to study the genetic consequences of human-induced fragmentation in riparian-mountain habitats. Identifying the genetic structure of riparian and aquatic plants across threatened aquatic systems is a pre-requisite for managing their ecosystem services (James et al., 2013).
Zizania latifolia Turcz., known as Manchurian wild rice, is a perennial, aquatic or paludal, monoecious grass that grows along the littoral of freshwater marshes and streams and it is native to East Asia (Chen S. et al., 2006). Z. latifolia is widely distributed in wetlands of the Sanjiang Plain. It is wind-pollinated to reproduce sexually by seeds or asexually by rhizomes. Z. latifolia is a pioneer weed species for dyke consolidation because of its high clonal reproduction; it also has a high nutrient uptake capacity which is used to purify wastewater. Its seeds or young shoots are popular foods or vegetables in China (Guo et al., 2007). Moreover, some eminent traits in Z. latifolia are used for rice breeding owing to its close relationship to rice (Oryza sativa L.) (Chen Y. et al., 2006). And the release of genome sequences of Z. latifolia would greatly accelerate the progress of molecular breeding related to the species (Guo et al., 2015). Therefore, wild Z. latifolia populations not only have important ecological functions in aquatic ecosystems, but also are important genetic resources. Understanding genetic diversity of the valuable species would help effectively implement conservation practices for the species and rationally utilize the genetic resources (Yan et al., 2016). Abundant genetic variations with weak population structure were previously reported using ten nuclear microsatellites markers in Z. latifolia from lakes of the Middle-lower Yangtze Plain, a potamo-lacustrine system in central China (Chen et al., 2012a). In another report, nine Z. latifolia populations from the Sanjiang Plain in northeastern China were shown a low level of genetic diversity with evident population structure based on SRAP markers (Fan et al., 2016), and the results inferred that mountains and fragmentation might contribute greatly to the genetic patterns of Z. latifolia in the Sanjiang Plain. However, the effects of rivers, mountains and fragmentation on gene flow were not cautiously verified (Fan et al., 2016).
Simple sequence repeat (SSR, or microsatellite) markers are ideal for genetic studies of population structures due to their codominance and high reproducibility. Here, we used population genetic analyses of microsatellite markers to investigate the roles of mountains, rivers and fragmentation on dispersal /population structure of Z. latifolia from the Sanjiang Plain and its surrounding area. The questions we would like to address are: (i) within one river, has the direction of water flow dominated the level of gene flow: water flow or habitat fragmentation? (ii) have the mountains blocked the gene exchange and where is the geographical location of the genetic discontinuities? (iii) has the fragmentation resulted in the decrease of gene flow, and what are the levels of historical and contemporary gene flows among populations? Additionally, high level of genetic diversity in Z. latifolia is expected in this study due to the nature of hyper-variability of the SSR markers. Our study would give more insights into the genetic structure and gene flow of the aquatic plant Z. latifolia from critically fragmented habitats, and should be beneficial for developing appropriate restoration strategies for the threatened aquatic systems.
Materials and Methods
Investigation Area and Sample Collection
The Sanjiang Plain is a river basin illuviated by the Heilong River, Songhua River and Wusuli River, and it is located in Northeast China. Seventeen Z. latifolia populations (named ZL1 to ZL17) were collected from the Sanjiang Plain and its neighboring areas (Table 1; Figure 1; Appendix 1 in Supplementary Material). Populations ZL1-4 were from the Nenjiang River basin, the largest tributary of Songhua River. Populations ZL5-9, ZL10-13, and ZL14-17 were along the Heilong River, Wusuli River and Songhua River, respectively. For each population, 20-24 individuals were sampled separately at intervals of at least 10 m to reduce the chance of collecting samples from the same clone. In populations ZL5 and ZL12, only 15 and 12 individuals were sampled because of the small population area. All in all, young leaves from 373 individuals were collected and immediately dried in silica gel.
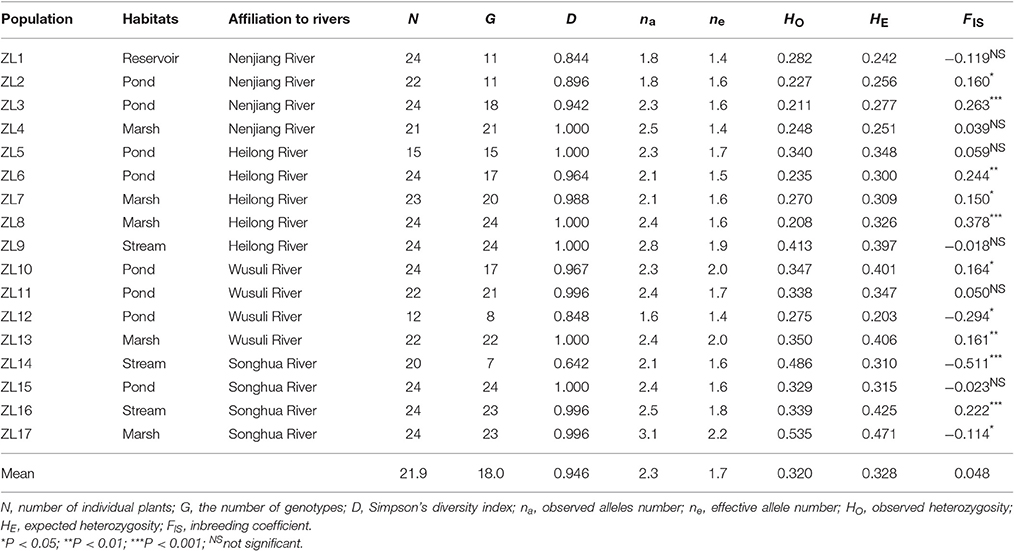
Table 1. Location, habitats and summary measures of clonal diversity and genetic variation for each population of Zizania latifolia.
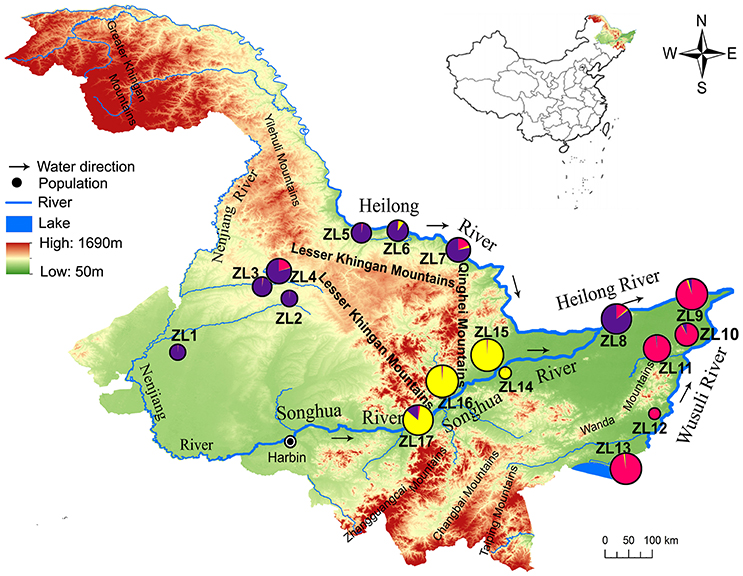
Figure 1. Location of the 17 populations of Zizania latifolia and affiliation to genetic clusters as determined by admixture analysis in STRUCTURE 2.3.4.
DNA Extraction and Genotyping Using Microsatellite Markers
Total genomic DNA was isolated from 0.3 to 0.5 g dried leaves using a modified 2% CTAB protocol (Doyle and Doyle, 1987). Twenty-two SSR markers, including 16 markers developed for Z. latifolia (Quan et al., 2009) and six for Z. texana Hitchc. (Richards et al., 2007), were screened in PCR amplification on 20 random individuals. Ten markers which produced polymorphism and clear banding patterns were selected for further analysis. Microsatellite genotyping was performed at loci ZM4, ZM5, ZM13, ZM16, ZM24, ZM25, ZM26, ZM36, ZM40, and ZM44 (Quan et al., 2009). The PCR amplifications were performed in a final volume of 10 μL containing 10 mM Tris–HCl (pH 8.4), 50 mM (NH4)2SO4, 1.5 mM MgCl2, 0.2 mM dNTPs, 0.2 μM each primer, 1 unit Taq polymerase (Fermentas, Vilnius, Lithuania), and 20 ng of genomic DNA. The amplification procedure was performed as described by Quan et al. (2009). Amplified products were separated on a 6% denatured polyacrylamide gel. A 25bp DNA ladder (Promega, Madison, WI, USA) was used to identify alleles. The fragments were visualized by silver staining. All samples were amplified twice, except those samples with different profiles which were run a third time.
Data Analysis
Clonal Diversity and Genetic Variations in Populations
We used GenoType/GenoDive (Meirmans and van Tienderen, 2004) to identify the clonal structure, and samples were assigned to the same multilocus genotypes and were considered to be clonemates if their SSR profiles were identical (threshold 0). With the software, the clonal diversity within populations was calculated, including (1) the number of genotypes G; (2) Simpson's diversity index D. Repeating genotypes within populations were excluded from all further genetic analyses.
For each population, genetic diversity was estimated across all loci using the observed number of alleles (na), effective number of alleles (ne), the expected and observed heterozygosity (HE and HO) using GenAlEx 6.2 (Peakall and Smouse, 2006). With the same software, genetic polymorphism for each microsatellite locus was assessed by calculating the total number of alleles (A, allelic diversity), HE and HO. FSTAT 2.9.3 (Goudet, 2001) was used to calculate the fixation index (FIS) and genetic differentiation among populations (FST; Weir and Cockerham, 1984). Populations with heterozygote deficiency were further analyzed with INEst 2.0 (Chybicki and Burczyk, 2009) utilizing a Bayesian approach for estimating both null alleles and inbreeding simultaneously (Campagne et al., 2012). Two parameters were used for the model comparison (n: null alleles; f: inbreeding). Three models (n, f, and nf) were run with 50,000 burn-in and 500,000 cycles for each population. The model with the lowest Deviance Information Criterion (DIC) outperforms the other model and was selected as the best fit for this population. The deviation was also tested from the Hardy-Weinberg equilibrium and linkage disequilibrium (LD) using FSTAT 2.9.3. The significant values for LD were corrected for multiple comparisons by Bonferroni correction (Rice, 1989).
The program Bottleneck 1.2.02 was used to test for deviation from mutation-drift equilibrium which is expected if populations have experienced a recent demographic decline (Cornuet and Luikart, 1996; Piry et al., 1999). This test is provided for three mutational models: the infinite alleles model (IAM); the stepwise mutation model (SMM); and a combination of those two extreme hypotheses, the two phase model (TPM). In the TPM, the proportion of IAM and SMM was set with default values (70% of the mutations were assumed to occur under IAM and 30% under SMM). For each mutational model, 5,000 replicates were performed using Wilcoxon signed-rank test.
Genetic Differentiation, Isolation by Distance and Tests for Accumulation Effect
The population genetic divergence was measured by the standard method of the estimation of FST (Weir and Cockerham, 1984). Pairwise F-statistics (Weir and Cockerham, 1984) between populations were calculated using FSTAT 2.9.3 with 1,000 permutations for their significance. Because FST is dependent upon within-population diversity, an alternative measure of genetic differentiation Dest was calculated using SMOGD (Jost, 2008; Crawford, 2010). Genetic variation within and among populations was further partitioned by analysis of molecular variance (AMOVA) using Arlequlin3.5 (Excoffier and Lischer, 2010).
The isolation by distance was tested (IBD; Wright, 1943) by plotting pairwise estimates of genetic distance ([FST/(1−FST)]; [Dest/(1−Dest)]) against the corresponding geographical distance (km) between populations. A Mantel test (Mantel, 1967) with 5,000 matrix randomizations was used to assess the significance of correlations between genetic distances and geographical distances using the software TFPGA (Miller, 1997).
In order to examine whether the water flow dominated the gene flow of populations along rivers, the accumulation of genetic diversity was tested in downstream populations. The SPSS 16.0 (SPSS, 2008) was used to calculate the associations between genetic parameter (HE) and the positions of populations along Heilong River, Songhua River and Wusuli River, respectively (expressed in kilometers from the furthest upstream population).
Population Cluster and Genetic Discontinuity among Populations
To illustrate the genetic relationships among populations, we performed principal coordinate analysis (PCoA) based on Nei's genetic distance (Nei et al., 1983) in GenAlEx 6.2. Nonhierarchical Bayesian clustering was performed to explore the genetic groups within the samples, using the program STRUCTURE 2.3.4 (Pritchard et al., 2000). The program was used with a burn-in of 100,000 replicates, followed by 500,000 replicates of the Markov chain Monte Carlo (MCMC) simulation, with the admixture model and the assumption of correlated allele frequencies among populations. Ten iterations were performed for each value of K from 1 to 19. The output was interpreted with Structure Harvester (Earl and vonHoldt, 2012) using the methods of Pritchard et al. (2000) and Evanno et al. (2005) and visualized by DISTRUCT v. 1.1 (Rosenberg, 2004). Using Arlequlin 3.5 (Excoffier and Lischer, 2010), AMOVA was conducted to calculate variation within and among clusters identified by STRUCTURE.
In order to visualize spatial patterns of population structure and to locate discontinuities among populations, we used GENELAND (Guillot et al., 2005) and BARRIER (Manni et al., 2004). GENELAND analysis was run with 10 replicates setting the number of groups K between 1 and 19. MCMC resampling was set at 100,000 repetitions, 100 thinning and 200 burn-in period. The best result was chosen based on the highest average posterior probability. The analysis was performed under uncorrelated frequency models. Monmonier's maximum difference algorithm with BARRIER 2.2 was used to determine the main genetic discontinuities among populations (Manni et al., 2004) based on the matrix of FST (Weir and Cockerham, 1984) for each of the 10 loci separately. Only barriers supported by at least half of the loci (i.e., ≥5 loci) were allowed as “consensus barriers” (Yan et al., 2016), namely main barriers.
Historical and Contemporary Gene Flows and Migration-Drift Equilibrium
The historical (Mhis) and contemporary (Mcon) gene flows were estimated using MIGRATE (Beerli, 2008) and BAYESASS (Wilson and Rannala, 2003), respectively. MIGRATE uses coalescent theory to estimate asymmetric gene flow M (m/μ) between populations over a long period of time (within the past 4Ne generations), where Ne is the effective population size, μ is the mutation rate and m is the migration rate (Beerli and Felsenstein, 2001). Here we used the Bayesian method with the Brownian motion mutation model for the microsatellite loci. The default settings of MIGRATE were used except uniform prior distributions (θ: minimum = 0, maximum = 10, delta = 1; M: minimum = 0, maximum = 400, delta = 40). Because MIGRATE needs great amount of calculation, 17 populations is beyond the computational capabilities of computers. To perform the software smoothly, the 17 populations were divided into groups based on their genetic clusters identified by STRUCTURE. BAYESASS uses assignment tests in a Bayesian framework and MCMC sampling to estimate the migration rates among populations over the last several generations (Wilson and Rannala, 2003). Each MCMC run was performed with 1 × 10⁶ iterations after a burn-in of 1 × 10⁵ and with a sampling frequency of 1,000. In order to make the accepted number of changes equal 30–40% of the total number of iterations (Rannala, 2011), the delta values were adjusted and set (−m = 0.15, −a = 0.50, −f = 0.75). Ten runs were performed with a different initial seed, and the one with the lowest deviance used for further analysis (Faubet et al., 2007).
GENECLASS2.0 (Piry et al., 2004) was used to perform the assignment test with the Bayesian method (Rannala and Mountain, 1997) and to detect the first-generation migrants among populations with the frequency-based method (Paetkau et al., 1995). The assignment test was used to assign or exclude the possible origins of individuals in reference populations, with 1,000,000 simulations and an alpha level of 0.01. The first-generation migrants among populations were conducted with Monte Carlo resampling of 1,000 individuals and a threshold of 0.01, which identified the immigrant individuals that were not born in the population.
We tested the relative likelihood of migration-drift equilibrium (gene flow vs. drift model) using the program 2MOD (Ciofi et al., 1999). A simulation with 1 × 10⁵ iterations was carried out, and the first 10% of the output was discarded to avoid bias resulting from the starting values.
Results
Defining Genotypes and Estimating Genetic Diversity
From the 373 genotyped individuals, 306 multilocus genotypes were identified, and no genotype was shared among populations. In six populations, ZL4, ZL5, ZL8, ZL9, ZL13, and ZL15, every individual was of a unique genotype. For the other populations, the Simpson's clonal diversity index (D) ranged from 0.642 (ZL14) to 0.996 (ZL11, ZL16, and ZL17) (Table 1). A total of 50 alleles were identified, ranging from 2 (ZM24) to 10 (ZM40 and ZM44), with an average of 5.0 alleles per locus (Table S1). The observed allele number within populations ranged from 1.6 (ZL12) to 3.1 (ZL17) (Table 1). The mean observed heterozygosity (HO) and expected heterozygosity (HE) per population were 0.320 and 0.328, respectively (Table 1). The smallest and the highest HE values were observed in the ZL12 and ZL17 populations, which were growing along the Wusuli River and Songhua River, respectively. The average value of the fixation index varied greatly among populations (range: −0.511 to 0.378; mean: 0.048; Table 1), suggesting that Z. latifolia had a mixed breeding systems, including both inbreeding and outbreeding.
Of 340 locus-population combinations, 41, 19, and 9 combinations (12.1, 5.6, and 2.6%) showed significant deviation from Hardy-Weinberg equilibrium at P = 0.05, 0.01, and 0.001 respectively. Although 56 of 765 locus pairs (7.3%) were significantly out of genotypic disequilibrium at the P = 0.05 level, none of the locus pairs was in significant genotypic disequilibrium after the Bonferroni-type correction, which showed that loci were physically unlinked and statistically independent. Eleven populations showed a positive fixation index, of which eight were significant. Further analysis with INEst showed that the heterozygote deficiency in the five populations (ZL2, ZL3, ZL6, ZL7, and ZL8) was caused by inbreeding, whereas the heterozygote deficiency in the three other populations (ZL10, ZL13, and ZL16) was caused by the null allele model (Table S2).
Genetic Differentiation, Isolation by Distance and Tests for Accumulation Effect
The genetic differentiation across all populations, estimated by FST and Dest, were 0.405 and 0.414, respectively (Table S1). The matrix of the pairwise population differentiation estimated by FST and Dest was shown in Table S3. All of the 136 pairwise comparisons of FST were significant (P < 0.05) for genetic differentiation between populations after correction for multiple tests. For all the values of pairwise Dest, the lower 95% confidence interval estimated by bootstrapping did not go below zero for any of pairwise statistics, indicating significant population differentiation. Levels of pairwise population differentiation were high, ranging between 0.137 and 0.626 (mean FST ± SEM: 0.418 ± 0.107). Consistent with these results, values of Jost's Dest were comparable (0.025–0.592) among all populations (mean Dest ± SEM: 0.231 ± 0.111). The AMOVA showed high overall population differentiation (Øpt = 0.424, P = 0.000). Of the total genetic variations partitioned in the 17 Z. latifolia populations, 42% were attributed to the differences among populations (df = 16, P < 0.0001), whereas 58% were attributed to the differences among individuals (df = 595, P < 0.0001) (Table 2).
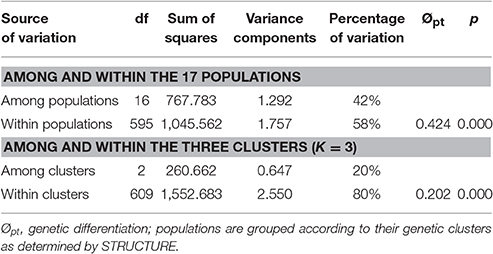
Table 2. Analysis of molecular variance (AMOVA) for 306 individuals.
Although only a small proportion of the genetic variance was explained by geography, small but significant positive correlation was detected between genetic differentiation and geographical distances among the 17 populations (Mantel test for FST: r2 = 0.038, P = 0.012; Dest: r2 = 0.022, P = 0.043) (Figure S1). No significant positive association was found between the genetic diversity indices (HE) and the distance of the downstream populations from the population furthest upstream for the three rivers (for the Heilong River, r = 0.595, P = 0.290; for the Wusuli River, r = 0.092, P = 0.908; for the Songhua River, r = −0.968, P = 0.032).
Population Cluster and Genetic Discontinuity among Populations
The Bayesian clustering implemented in STRUCTURE revealed an optimum ΔK at K = 3 (Figure 1; Figures S2A,B). The three clusters of individuals clearly separated these collecting locations into stable gene pools (Figure S2C): populations ZL1-8, ZL9-13, and ZL14-17. The proportion of membership of the pre-defined populations in each of the three clusters ranged from 0.658 to 0.986 (Table S4). The AMOVA showed that 20% of the total molecular variations were attributed to inter-cluster differentiation (Table 2). When considering genetic structure based on the PCoA performed on allelic frequencies, a similar cluster pattern was found except for populations ZL6 and ZL7 (Figure 2). PCoA explained 71.63% of the total gene variations, on the basis of the first (35.10%), the second (21.09%) and the third dimension (15.43%).
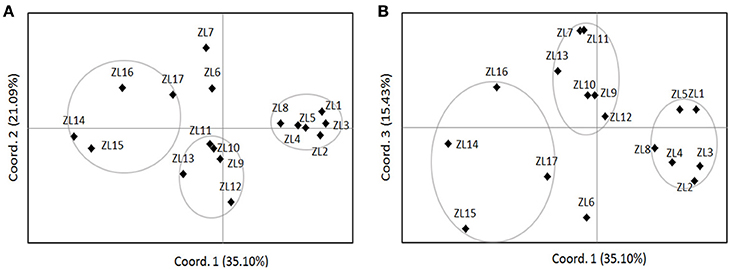
Figure 2. Nonmetric multidimensional scaling ordination based on Nei's genetic distance (Nei et al., 1983). (A) The first two principal coordinates account for 35.10 and 21.09% of the genetic variation, respectively; (B) the first and third principal coordinates account for 35.10 and 15.43% of the genetic variation, respectively. See Table 1 for explanations of population abbreviations.
GENELAND identified 13 genetic clusters (Figure S3). Each cluster corresponded to a sampling site with the exception of the three clusters (ZL1-3, ZL12-13, and ZL14-15). The results indicated that genetic discontinuities existed between any adjacent populations except for within the three clusters. The main genetic discontinuities were further identified using Barrier 2.2 based on pairwise FST values (Figure 3). Five main barriers, including barriers between ZL2 and ZL17, ZL2 and ZL16, ZL6 and ZL16, ZL7 and ZL16, and ZL7 and ZL15, integrated to form one continuous break, located in the east section of Lesser Khingan and its branch Qinghei Mountains. Additionally, three main breaks were exhibited among populations along the three rivers, i.e., between ZL6 and ZL7 along the Heilong River, between ZL15 and ZL16 along the Songhua River, and between ZL11 and ZL12 along the Wusuli River.
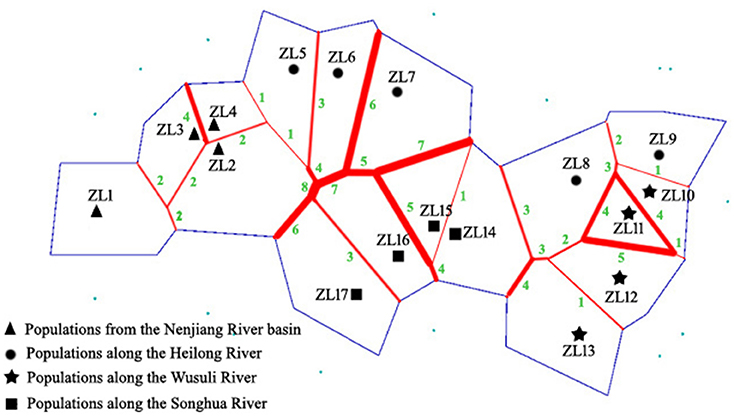
Figure 3. Discontinuities in gene flow suggested by BARRIER using consensus barriers. Barriers to gene flow are indicated by solid red lines, and the number of loci supported barriers is in green. The blue lines represent hypothetical population boundaries.
Gene Flow and Genetic Bottlenecks
MIGRATE revealed high level of historical gene flow among the Z. latifolia populations (Table 3). Mhis ranged from 2.340 to 8.443 for cluster ZL1-8, from 1.568 to 11.231 for cluster ZL9-13, and from 1.206 to 10.165 from the Songhua River, respectively. On the contrary, multiple runs of BAYESASS yielded relatively low contemporary gene flow among the populations. The values of Mcon were 1.924 from ZL3 to ZL2, 1.931 from ZL10 to ZL9 and 1.469 from ZL15 to ZL14, but the others ranged from 0.087 from ZL14 to ZL16 to 0.777 from ZL4 to ZL3, suggesting that gene flow was greatly reduced during recent habitat fragmentation. Bi-directional gene flows were found in all data sets. The Mhis is predominantly downstream along the Songhua River except the pairwise between ZL15 and ZL17.
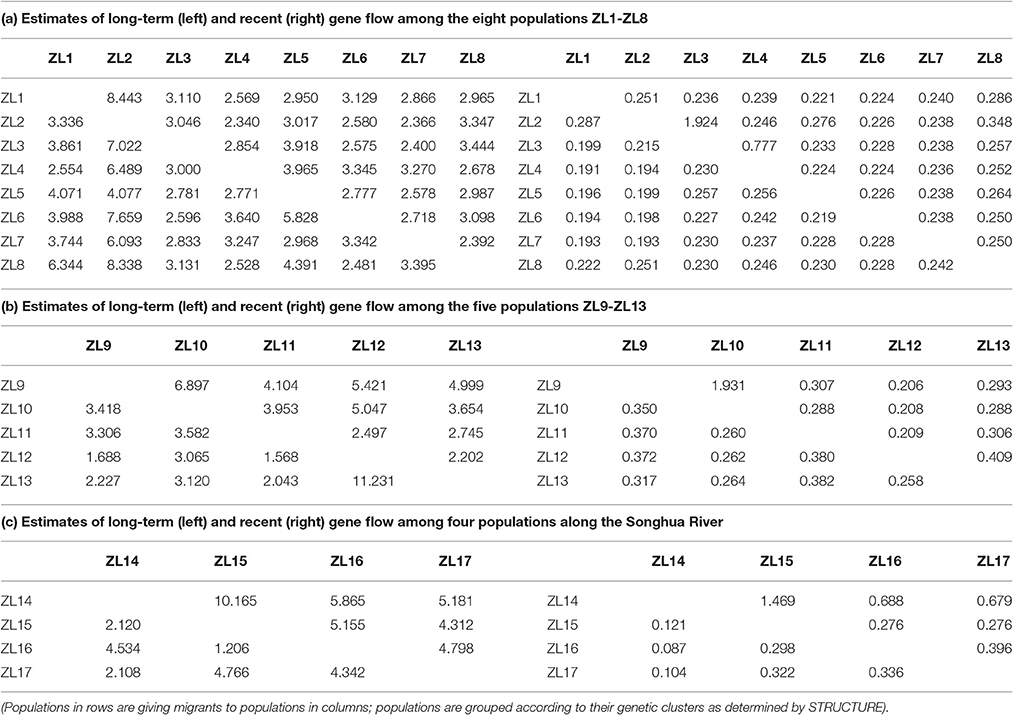
Table 3. Likelihood estimates of MIGRATE of long-term and BAYESASS of recent gene flow among 17 populations of Zizania latifolia.
An assignment test calculated by GENECLASS showed that individuals from their population of origin were 27.6% or higher in all the populations, and 18.4% or fewer of the individuals were assigned to their nearest origin population. Additionally, 1.3% or fewer of the individuals was assigned to the other populations. Some 47.7% or more of the individuals were not assigned to any of the populations sampled (Figure S4). Seven first-generation immigrants were detected, of which two had migrated up from the downstream populations and four had migrated down from upstream populations (Table S5).
Due to the low number of genotypes of some populations, tests for signatures of recent bottlenecks were only conducted on 15 of the 17 populations. Nine populations deviated significantly from mutation-drift equilibrium under the infinite allele model, and five populations displayed significant deviation under the two phase model (Table 4). The microsatellites used in Z. latifolia are either of dinucleotide perfect repeats or of imperfect repeats, both of which may tend toward the IAM (Cornuet and Luikart, 1996). So the results under IAM give more accurate estimates, suggesting most populations (nine of 15 populations) have experienced recent bottlenecks. In the 2MOD analysis, the likelihoods of the gene flow model and pure drift models were 0 and 1, respectively, i.e., none of the simulations supported the gene flow model.
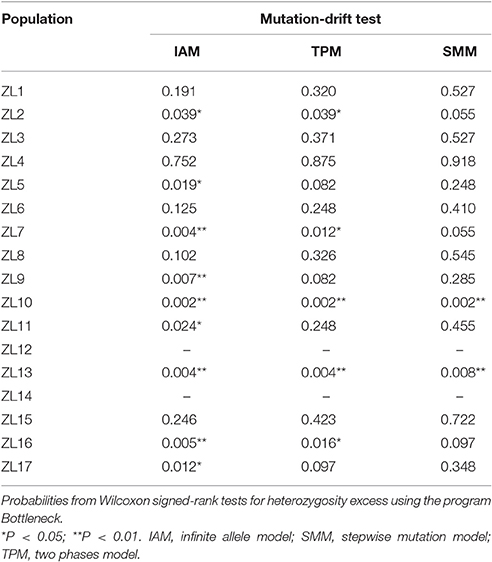
Table 4. Test for mutation-drift equilibrium in Zizania latifolia.
Discussion
Clonal Diversity and Genetic Variation
Clonal diversity for Z. latifolia was remarkably high (D = 0.946) compared with the mean values (D = 0.62) summarized by Ellstrand and Roose (1987), which may be partly attributed to the large sampling interval within populations (at least 10 m). Additionally, all populations comprised multiple genotypes, indicating that seeds or sexual reproduction largely contributed to the population construction of Z. latifolia. No multilocus genotype was shared among populations, suggesting that a clonal strategy mainly occur in the same population and clonal ramets cannot disperse among populations over the large geographic scale studied here.
In the present study, Z. latifolia from the Sanjiang Plain appeared to possess low intra-population microsatellite variation (na = 2.3, HE = 0.328) compared to Z. texana from Texas in America (na = 11.7, HE = 0.662, Richards et al., 2007; na = 4.4–6.3, HE = 0.53–0.65, Wilson et al., 2017) and Z. latifolia from the Yangtze River in central China (na = 5.0, HE = 0.610; Chen et al., 2012a). A lower level of genetic variation (HE = 0.156 based on SRAP markers) was found in nine Z. latifolia populations in the same area (Fan et al., 2016). The present low genetic variation may result from the genetic bottlenecks experienced by the populations. The test for mutation-drift equilibrium under IAM suggested that most Z. latifolia populations (nine of 15 populations) have experienced recent bottlenecks. Z. latifolia is shallow-rooted and has recalcitrant seeds (Berjak and Pammenter, 2008), and these specific traits may make the species poor at handling drought. Therefore, the ephemeral habitats combined with drastic anthropogenic activities can easily cause genetic bottlenecks in Z. latifolia populations.
Furthermore, inbreeding systems partly explain the low genetic variation in some populations. The Bayesian analysis of INEST suggested that inbreeding, rather than null alleles, resulted in heterozygote deficiency in five populations (ZL2, ZL3, ZL6, ZL7, and ZL8). We inferred that the fragmented habitats increased the biparental inbreeding behavior (mating among relatives) within Z. latifolia populations. Contrastingly, a high degree of inbreeding in the reproductive system (FIS = 0.793) was reported in the Z. latifolia populations from the Sanjiang Plain based on SRAP markers (Fan et al., 2016). Given that the two marker systems (SSRs and SRAPs) produce different genetic profiles, the results from the two markers may not be strictly comparable. But this study and Fan et al. (2016) both showed that Z. latifolia in the plain has exhibited inbreeding. On the contrary, Z. latifolia populations from the Yangtze River showed predominant outcrossing reproductive system (FIS = −0.200–0.019; Chen et al., 2012a). The different results could be ascribed to the habitat types: most Z. latifolia populations in the Sanjiang Plain occur in the sides of ponds and streams, which easily lead to mating events among close relatives or intra-clones; while Z. latifolia from the Yangtze River grows along the littorals of lakes and forms large populations (Chen et al., 2012a), and this makes the populations stand a good chance to receive more migrant pollen and act as outcrossing.
Roles of Rivers, Mountains and Fragmentation
Both aquatic and riparian plant communities are strongly influenced by water-mediated dispersal (Merritt et al., 2010; Nilsson et al., 2010; Fraaije et al., 2015), and river habitats are long-recognized corridors for riparian or aquatic plants (Tero et al., 2003; Fér and Hroudova, 2008; Wei et al., 2013). However, this was not the case in the present study. A high genetic differentiation was observed among populations within each river. The GENELAND analysis detected that genetic discontinuities existed between most adjacent populations. The barrier analysis further confirmed the main genetic break within each river, i.e., ZL6 vs. ZL7, ZL11 vs. ZL12, and ZL15 vs. ZL16 along the Heilong River, Wusuli River and Songhua River, respectively. The scenarios suggested that there was little exchange among the corresponding populations, which showed that the rivers were not acting as corridors. Additionally, the downstream accumulation of genetic diversity caused by water-mediated dispersal was not found along the three rivers, which might be explained by a number of factors. Firstly, upstream dispersal of seeds and plant fragments: both historical and contemporary gene flow for Z. latifolia were bi-directional within in the three rivers detected by MIGRATE and BAYESASS. Secondly, various degrees genetic bottlenecks experienced by populations within rivers: the genetic bottlenecks in most Z. latifolia populations would eliminate the accumulation trends in downstream when downstream populations suffered more severe bottlenecks than those of upstream populations. Thirdly, the influence of unsampled populations: the assignment test using GENECLASS showed that about 50% of the individuals were not assigned to any of the populations sampled. So the influence of unsampled (or disappeared) populations needs to be considered. In order to detect dispersal events among populations efficiently, more populations along rivers should be sampled, as suggested by Wubs et al. (2016).
A mountain ridge is the predominant factor causing genetic barrier for mountain plants (Tsuda et al., 2010; Wei et al., 2013). In the present study, the main genetic breaks detected by BARRIER 2.2 were distributed in the places where the east section of Lesser Khingan and its branch Qinghei Mountains are located, suggesting that the mountains greatly hinder the gene exchange among populations on both sides of the mountains. It is interesting to note that no main genetic discontinuity was found between the populations distributed in the north (ZL2 and ZL4) and south (ZL5 and ZL6) sides of the west section of the Lesser Khingan. This suggested that, compared with the east section of the mountains, the west section was of relatively weak blocking effects on gene flow. This difference might be related to the topography and terrain in the different section of the mountains. The east section of Lesser Khingan and its branch Qinghei Mountains are made up of rugged ridges, deep valleys and covered by dense forests, which would efficiently block the gene exchange on different sides of the mountains. On the other hand, the west section of the Lesser Khingan has lower slopes, and some places have been reclaimed into farmlands, including dry lands and paddy fields. The irrigation ditches and extant ponds embedded in the farmlands would provide a “transition” for dispersal.
Fragmentation decreases habitat size and increases isolation between habitats and populations. These physical changes are generally expected to reduce gene flow and increase inter-population genetic divergence of plant populations (Young et al., 1996). However, some species can adapt to habitat destruction, such as tropical tree Swietenia humilis Zuccarini. which increases pollen flow to counteract fragmentation (White et al., 2002). The wetlands in the Sanjiang Plain and its surrounding areas have suffered from over reclamation for decades and have been separated into small wetland mosaic sandwiched between farmlands (Wang et al., 2011). Our results suggest that the recent habitat fragmentation in the plain is accompanied with a greatly decreased gene flow among Z. latifolia populations. Two results lead to the conclusion: firstly, a much higher historical gene flow was detected compared with contemporary gene flow; secondly, only seven first-generation immigrants were detected among populations. Although the wind-pollinated distance for Z. latifolia is unavailable, it has been reported to be limited to 6–9 km for the wild rice O. rufipogon Griff. (Gao, 2004). The pollen-mediated dispersal for Z. latifolia seems to be effective only at local scale with the smallest distance of 26 km among populations (between ZL3 and ZL4). Therefore, the magnitude of genetic differentiation among Z. latifolia populations is almost solely determined by the ability to disperse seeds or propagules. However, the fragmented nature of wetlands in this area has resulted in the hydrological disconnectivity between ponds or marshes and the arteries of rivers, which could have hindered the dispersal via seeds or propagules of the plant. Although episodic floods can result in temporary hydrological connectivity and facilitate the gene exchange, as suggested in O. rufipogon populations (Wang et al., 2008), high values of FST and Dest among pairs of populations along the same river indicate that episodic floods were not an effective path of dispersal for Z. latifolia.
Genetic Structure
There was a high level of inter-population differentiation in Z. latifolia populations (FST = 0.405, Dest = 0.414, Øpt = 0.424). This is comparable to the genetic differentiation that was recently reported for nine populations of Z. latifolia (FST = 0.299 based on 344 SRAP markers) and eight populations of Nymphaea tetragona Georgi (FST = 0.371 based on 289 ISSR markers) in the same habitat and area (Fan et al., 2016; Chen et al., in press). The high genetic divergence of Z. latifolia may be explained by decreased gene flow, the inbreeding systems in some populations and repeated genetic bottlenecks in the critically fragmented habitats. Furthermore, when gene flow rate is greatly limited, population genetic differentiation will increase due to genetic drift (Slatkin, 1977; Hutchison and Templeton, 1999). In the present study, the 2MOD analysis suggested that genetic drift may have an important impact on the present genetic patterns. Additionally, the evident population differentiation may be associated with different environmental adaptations of the populations (Hufford and Mazer, 2003; Iacolina et al., 2016), and common-garden experiments should be carried out to test this assumption.
Interestingly, although the high genetic differentiation and genetic breaks among populations within each river allowed us to reject the corridor function of rivers, the Bayesian clustering using STRUCTURE revealed that most populations along the three rivers clustered together according to their river system origins, which was supported by the results of PCoA.
The AMOVA further showed that 20% of the total molecular variation was attributed to the differences among the three genetic clusters identified by STRUCTURE. At the same time, the significant positive correlation between genetic and geographic distances was detected in Z. latifolia, indicating that the IBD pattern influenced population differentiation. Given the populations from the same river are located close to each other, the clustering results of STRUCTURE and PCoA were mainly explained by the effects of IBD instead of hydraulic dispersal.
Implications for Management
Genetic variation is important for a species to maintain its evolutionary potential to cope with ever-changing environments. The genetic information obtained in this study can be used to propose appropriate management strategies for the Z. latifolia wild populations in the critically fragmented flood plain, the Sanjiang Plain.
Currently, low genetic variation and reduced gene flow are found in the Z. latifolia populations from the Sanjiang Plain and its surrounding areas, indicating that the habitat fragmentation has already negatively impacted the genetic diversity of the plant. Genetic diversity needs many generations (at least 10, but often >100 generations) of fragmentation to be severely affected (Mona et al., 2014). Consequently, the adverse impact of fragmentation on genetic diversity will probably become more evident in the future given the long-lived life history of Z. latifolia, which highlights the need for conservation efforts of the species. The result that more than 40% of microsatellite variation is partitioned among Z. latifolia populations is instructive for adopting a plan to protect as many populations as possible. The populations with a high level of genetic diversity, such as ZL9, ZL14, and ZL17, should be given the top priority for both in situ and ex situ conservation. In this study, genetic discontinuities were found among most populations, even populations from the same river, suggesting that the rivers be not acting as corridors for dispersal. Therefore, dredging the watercourses between the isolated habitats and the arteries of the rivers should be carried out, which will improve the stability of wetlands habitats and facilitate connectivity among populations.
Author Contributions
YC collected the samples, designed the experiments, and wrote the manuscript; Yang Liu performed the SSR experiments and checked English grammar; XF performed the experiments and conducted data analysis; WL collected the samples; Yanling Liu contributed to the supervision of the work and wrote the manuscript. All authors read and approved the final version of manuscript. The authors declare no conflict of interest.
Conflict of Interest Statement
The authors declare that the research was conducted in the absence of any commercial or financial relationships that could be construed as a potential conflict of interest.
Acknowledgments
This research was supported by the National Key Research and Development Program of China (2016YFA0601000), the National Scientific Foundation of China (31100247) and the Knowledge Innovation Project of Chinese Academy of Sciences (KSCX2-EW-J-20). We thank Dr. Cao Yu for his help with software. We thank Prof. Stephen C. Maberly for his valuable comments on the manuscript.
Supplementary Material
The Supplementary Material for this article can be found online at: http://journal.frontiersin.org/article/10.3389/fevo.2017.00017/full#supplementary-material
References
Aavik, T., Holderegger, R., Edwards, P. J., and Billeter, R. (2013). Patterns of contemporary gene flow suggest low functional connectivity of grasslands in a fragmented agricultural landscape. J. Appl. Ecol. 50, 395–403. doi: 10.1111/1365-2664.12053
Beerli, P. (2008). Migrate Version 3.0: A Maximum likelihood and Bayesian Estimator of Gene Flow using the Coalescent. Availabel online at: http://popgen.scs.edu/migrate.html
Beerli, P., and Felsenstein, J. (2001). Maximum likelihood estimation of a migration matrix and effective population sizes in n subpopulations by using a coalescent approach. Proc. Natl. Acad. Sci. U.S.A. 98, 4563–4568. doi: 10.1073/pnas.081068098
Berjak, P., and Pammenter, N. (2008). From Avicennia to Zizania: seed recalcitrance in perspective. Ann. Bot. 101, 213–228. doi: 10.1093/aob/mcm168
Campagne, P., Smouse, P. E., Varouchas, G., Silvain, J. F., and Leru, B. (2012). Comparing the van Oosterhout and Chybicki-Burczyk methods of estimating null allele frequencies for inbred populations. Mol. Ecol. Resour. 12, 975–982. doi: 10.1111/1755-0998.12015
Chen, S., Li, D., Zhu, G., Wu, Z., Lu, S., Liu, L., et al. (2006). “Zizania.” in Flora of China, Vol. 22, eds Z. Y. Wu, P. H. Raven (Beijing; St. Louis, MO: Science Press, Missouri Botanical Garden Press), 186–187.
Chen, Y., Long, L., Lin, X., Guo, W., and Liu, B. (2006). Isolation and characterization of a set of disease resistance-gene analogs (RGAs) from wild rice, Zizania latifolia Griseb. I. Introgression, copy number lability, sequence change, and DNA methylation alteration in several rice-Zizania introgression lines. Genome 49, 150–158. doi: 10.1139/g05-097
Chen, Y. Y., Chu, H. J., Liu, H., and Liu, Y. L. (2012a). Abundant genetic diversity of the wild rice Zizania latifolia in central China revealed by microsatellites. Ann. Appl. Biol. 161, 192–201. doi: 10.1111/j.1744-7348.2012.00564.x
Chen, Y. Y., Fan, X. R., Li, Z., Li, W., and Huang, W. M. (in press). Low level of genetic variation restricted gene flow in water lily Nymphaea tetragona populations from the Amur River. Aquat. Bot. doi: 10.1016/j.aquabot.2016.10.003
Chen, Y. Y., Kong, D. R., Huang, C. H., Xu, Y. X., and Li, Z. Z. (2012b). Microsatellite analysis reveals the genetic structure and gene flow of the aquatic quillwort Isoetes sinensis, a critically endangered species in China. Aquat. Bot. 96, 52–57. doi: 10.1016/j.aquabot.2011.09.001
Chybicki, I. J., and Burczyk, J. (2009). Simultaneous estimation of null alleles and inbreeding coefficients. J. Hered. 100, 106–113. doi: 10.1093/jhered/esn088
Ciofi, C., Beaumontf, M. A., Swingland, I. R., and Bruford, M. W. (1999). Genetic divergence and units for conservation in the Komodo dragon Varanus komodoensis. Proc. Biol. Sci. 266, 2269–2274. doi: 10.1098/rspb.1999.0918
Cornuet, J. M., and Luikart, G. (1996). Description and power analysis of two tests for detecting recent population bottlenecks from allele frequency data. Genetics 144, 2001–2014.
Crawford, N. G. (2010). SMOGD: software for the measurement of genetic diversity. Mol. Ecol. Resour. 10, 556–557. doi: 10.1111/j.1755-0998.2009.02801.x
Doyle, J. J., and Doyle, J. L. (1987). A rapid DNA isolation procedure for small quantities of fresh leaf tissue. Phytochem. Bull. 19, 11–15.
Earl, D., and vonHoldt, B. (2012). STRUCTURE HARVESTER: a website and program for visualizing STRUCTURE output and implementing the Evanno method. Conserv. Genet. Resour. 4, 359–361. doi: 10.1007/s12686-011-9548-7
Ellstrand, N., and Roose, M. (1987). Patterns of genotypic diversity in clonal plant species. Am. J. Bot. 74, 123–131. doi: 10.2307/2444338
Evanno, G., Regnaut, S., and Goudet, J. (2005). Detecting the number of clusters of individuals using the software STRUCTURE: a simulation study. Mol. Ecol. 14, 2611–2620. doi: 10.1111/j.1365-294X.2005.02553.x
Excoffier, L., and Lischer, H. E. L. (2010). Arlequin suite ver 3.5: a new series of programs to performpopulation genetics analyses under Linux and Windows. Mol. Ecol. Resour. 10, 564–567. doi: 10.1111/j.1755-0998.2010.02847.x
Fan, X. R., Ren, X. R., Liu, Y. L., and Chen, Y. Y. (2016). Genetic structure of wild rice Zizania latifolia and the implications for its management in the Sanjiang Plain, Northeast China. Biochem. Syst. Ecol. 64, 81–88. doi: 10.1016/j.bse.2015.11.017
Faubet, P., Waples, R. S., and Gaggiotti, O. E. (2007). Evaluating the performance of a multilocus Bayesian method for the estimation of migration rates. Mol. Ecol. 16, 1149–1166. doi: 10.1111/j.1365-294X.2007.03218.x
Fér, T., and Hroudova, Z. (2008). Detecting dispersal of Nuphar luteain river corridors using microsatellite markers. Freshwater Biol. 53, 1409–1422. doi: 10.1111/j.1365-2427.2008.01973.x
Fraaije, R. G., Braak, C. J., Verduyn, B., Verhoeven, J. T., and Soons, M. B. (2015). Dispersal versus environmental filtering in a dynamic system: drivers of vegetation patterns and diversity along stream riparian gradients. J. Ecol. 103, 1634–1646. doi: 10.1111/1365-2745.12460
Gao, L. (2004). Population structure and conservation genetics of wild rice Oryza rufipogon (Poaceae): a region-wide perspective from microsatellite variation. Mol. Ecol. 13, 1009–1024. doi: 10.1111/j.1365-294X.2004.02108.x
Goudet, J. (2001). FSTAT ver 2.9.3, A program to Estimate and Test Gene Diversities and Fixation Indices. Available online at: https://www2.unil.ch/popgen/softwares/fstat.htm
Guillot, G., Mortier, F., and Estoup, A. (2005). GENELAND: a computer package for landscape genetics. Mol. Ecol. Notes 5, 712–715. doi: 10.1111/j.1471-8286.2005.01031.x
Guo, H. B., Li, S. M., Peng, J., and Ke, W. D. (2007). Zizania latifolia Turcz. cultivated in China. Genet. Resour. Crop Evol. 54, 1211–1217. doi: 10.1007/s10722-006-9102-8
Guo, L., Qiu, J., Han, Z., Ye, Z., Chen, C., Liu, C., et al. (2015). A host plant genome (Zizania latifolia) after a century-long endophyte infection. Plant J. 83, 600–609. doi: 10.1111/tpj.12912
Hu, L. J., Uchiyama, K., Shen, H. L., and Ide, Y. (2010). Multiple-scaled spatial genetic structures of Fraxinus mandshurica over a riparian–mountain landscape in Northeast China. Conserv. Genet. 11, 77–87. doi: 10.1007/s10592-009-0004-0
Hufford, K. M., and Mazer, S. J. (2003). Plant ecotypes: genetic differentiation in the age of ecological restoration. Trends Ecol. Evol. 18, 147–155. doi: 10.1016/S0169-5347(03)00002-8
Hughes, A. R., Inouye, B. D., Johnson, M. T., Underwood, N., and Vellend, M. (2008). Ecological consequences of genetic diversity. Ecol. Lett. 11, 609–623. doi: 10.1111/j.1461-0248.2008.01179.x
Hutchison, D. W., and Templeton, A. R. (1999). Correlation of pairwise genetic and geographic distance measures: inferring the relative influences of gene flow and drift on the distribution of genetic variability. Evolution 53, 1898–1914. doi: 10.2307/2640449
Iacolina, L., Scandura, M., Goedbloed, D. J., Alexandri, P., Crooijmans, R. P. M. A., Larson, G., et al. (2016). Genomic diversity and differentiation of a managed island wild boar population. Heredity 116, 60–67. doi: 10.1038/hdy.2015.70
James, E. A., Jordan, R., and Griffin, P. C. (2013). Spatial genetic analysis of two polyploid macrophytes reveals high connectivity in a modified wetland. Freshwater. Biol. 58, 2102–2113. doi: 10.1111/fwb.12194
Jost, L. (2008). GST and its relatives do not measure differentiation. Mol. Ecol. 17, 4015–4026. doi: 10.1111/j.1365-294X.2008.03887.x
Manel, S., Schwartz, M. K., Luikart, G., and Taberlet, P. (2003). Landscape genetics: combining landscape ecology and population genetics. Trends Ecol. Evol. 18, 189–197. doi: 10.1016/S0169-5347(03)00008-9
Manni, F., Guérard, E., and Heyer, E. (2004). Geographic patterns of (genetic, morphologic, linguistic) variation: how barriers can be detected by using Monmonier's algorithm. Hum. Biol. 76, 173–190. doi: 10.1353/hub.2004.0034
Mantel, N. (1967). The detection of disease clustering and a generalized regression approach. Cancer Res. 27, 209–220.
Meirmans, P. G., and van Tienderen, P. H. (2004). Genotype and Genodive: two programs for the analysis of genetic diversity of asexual organisms. Mol. Ecol. Notes 4, 792–794. doi: 10.1111/j.1471-8286.2004.00770.x
Merritt, D. M., Nilsson, C., and Jansson, R. (2010). Consequences of propagule dispersal and river fragmentation for riparian plant community diversity and turnover. Ecol. Monogr. 80, 609–626. doi: 10.1890/09-1533.1
Miller, M. P. (1997). Tools for Population Genetics Analysis (TFPGA). Version 1.3. A Windows Program for the Analysis of Allozyme and Molecular Population Genetic Data. Computer Software Distributed by Author.
Mona, S., Ray, N., Arenas, M., and Excoffier, L. (2014). Genetic consequences of habitat fragmentation during a range expansion. Heredity 112, 291–299. doi: 10.1038/hdy.2013.105
Nei, M., Tajima, F., and Tateno, Y. (1983). Accuracy of estimated phylogenetic trees from molecular-data. II. Gene-frequency data. J. Mol. Evol. 19, 153–170. doi: 10.1007/BF02300753
Nilsson, C., Brown, R. L., Jansson, R., and Merritt, D. M. (2010). The role of hydrochory in structuring riparian and wetland vegetation. Biol. Rev. 85, 837–858. doi: 10.1111/j.1469-185x.2010.00129.x
Paetkau, D., Calvert, W., Stirling, I., and Strobeck, C. (1995). Microsatellite analysis of population structure in Canadian polar bears. Mol. Ecol. 4, 347–354. doi: 10.1111/j.1365-294X.1995.tb00227.x
Peakall, R. O. D., and Smouse, P. E. (2006). GENALEX 6: genetic analysis in Excel. Population genetic software for teaching and research. Mol. Ecol. Notes 6, 288–295. doi: 10.1111/j.1471-8286.2005.01155.x
Piry, S., Alapetite, A., Cornuet, J. M., Paetkau, D., Baudouin, L., and Estoup, A. (2004). GENECLASS2: a software for genetic assignment and first-generation migrant detec-tion. J. Hered. 95, 536–539. doi: 10.1093/jhered/esh074
Piry, S., Luikart, G., and Cornuet, J. M. (1999). BOTTLENECK: a program for detecting recent effective population size reductions from allele data frequencies. J. Hered. 90, 502–503. doi: 10.1093/jhered/90.4.502
Pritchard, J. K., Stephens, M., and Donnelly, P. (2000). Inference of population structure using multilocus genotype data. Genetics 155, 945–959.
Quan, Z., Pan, L., Ke, W., Liu, Y., and Ding, Y. (2009). Sixteen polymorphic microsatellite markers from Zizania latifolia Turcz.(Poaceae). Mol. Ecol. Resour. 9, 887–889. doi: 10.1111/j.1755-0998.2008.02357.x
Rannala, B. (2011). BayesAss Edition 3.0 User's Mannual. Availabel online at: http://www.rannala.org/?page_id=245
Rannala, B., and Mountain, J. L. (1997). Detecting immigration by using multilocus genotypes. Proc. Natl. Acad. Sci. U.S.A. 94, 9197–9201. doi: 10.1073/pnas.94.17.9197
Rice, W. R. (1989). Analyzing tables of statistical tests. Evolution 43, 223–225. doi: 10.2307/2409177
Richards, C. M., Antolin, M. F., Reilley, A., Poole, J., and Walters, C. (2007). Capturing genetic diversity of wild populations for ex situ conservation: Texas wild rice (Zizania texana) as a model. Genet. Resour. Crop Evol. 54, 837–848. doi: 10.1007/s10722-006-9167-4
Rosenberg, N. A. (2004). DISTRUCT: a program for the graphical display of population structure. Mol. Ecol. Notes 4, 137–138. doi: 10.1046/j.1471-8286.2003.00566.x
Slatkin, M. (1977). Gene flow and genetic drift in a species subject to frequent local extinctions. Theor. Popul. Biol. 12, 253–262. doi: 10.1016/0040-5809(77)90045-4
Sondermann, M., Gies, M., Hering, D., Schröder, M., and Feld, C. K. (2015). Modelling the effect of in-stream and terrestrial barriers on the dispersal of aquatic insect species: a case study from a Central European mountain catchment. Fund. Appl. Limnol. 186, 99–115. doi: 10.1127/fal/2015/0597
Storfer, A., Murphy, M. A., Evans, J. S., Goldberg, C. S., Robinson, S., Spear, S. F., et al. (2007). Putting the “landscape” in landscape genetics. Heredity 98, 128–142. doi: 10.1038/sj.hdy.6800917
Tero, N., Aspi, J., Siikamäki, P., Jäkäläniemi, A., and Tuomi, J. (2003). Genetic structure and gene flow in a metapopulation of an endangered plant species, Silene tatarica. Mol. Ecol. 12, 2073–2085. doi: 10.1046/j.1365-294X.2003.01898.x
Tsuda, Y., Sawada, H., Ohsawa, T., Nakao, K., Nishikawa, H., and Ide, Y. (2010). Landscape genetic structure of Betula maximowicziana in the Chichibu mountain range, central Japan. Tree Genet. Genomes 6, 377–387. doi: 10.1007/s11295-009-0256-3
Wang, M. X., Zhang, H. L., Zhang, D. L., Qi, Y. W., Fan, Z. L., Li, D. Y., et al. (2008). Genetic structure of Oryza rufipogon Griff. in China. Heredity 101, 527–535. doi: 10.1038/hdy.2008.61
Wang, Z., Song, K., Ma, W., Ren, C., Zhang, B., Liu, D., et al. (2011). Loss and fragmentation of marshes in the Sanjiang Plain, Northeast China, 1954–2005. Wetlands 31, 945–954. doi: 10.1007/s13157-011-0209-0
Wei, X. Z., Meng, H. J., and Jiang, M. X. (2013). Landscape genetic structure of a streamside tree species Euptelea pleiospermum (Eupteleaceae): contrasting roles of river valley and mountain ridge. PLoS ONE 8:e66928. doi: 10.1371/journal.pone.0066928
Weir, B. S., and Cockerham, C. C. (1984). Estimating F-statistics for the analysis of population structure. Evolution 38, 1358–1370. doi: 10.2307/2408641
Werth, S., Schodl, M., and Scheidegger, C. (2014). Dams and canyons disrupt gene flow among populations of a threatened riparian plant. Freshwater Biol. 59, 2502–2515. doi: 10.1111/fwb.12449
White, G. M., Boshier, D. H., and Powell, W. (2002). Increased pollen flow counteracts fragmentation in a tropical dry forest: an example from Swietenia humilis Zuccarini. Proc. Natl. Acad. Sci. U.S.A. 99, 2038–2042. doi: 10.1073/pnas.042649999
Wilson, G. A., and Rannala, B. (2003). Bayesian inference of recent migration rates using multilocus genotypes. Genetics 163, 1177–1191.
Wilson, W. D., Hutchinson, J. T., and Ostrand, K. G. (2017). Genetic diversity assessment of in situ and ex situ Texas wild rice (Zizania texana) populations, an endangered plant. Aquat. Bot. 136, 212–219. doi: 10.1016/j.aquabot.2015.12.005
Wubs, E. R. J., Fraaije, R. G. A., de Groot, G. A., Erkens, R. H. J., Garssen, A. G., Kleyheeg, E., et al. (2016). Going against the flow: a case for upstream dispersal and detection of uncommon dispersal events. Freshwater Biol. 61, 580–595. doi: 10.1111/fwb.12736
Yan, J., Zhu, M., Liu, W., Xu, Q., Zhu, C., Li, J., et al. (2016). Genetic variation and bidirectional gene flow in the riparian plant Miscanthus lutarioriparius, across its endemic range: implications for adaptive potential. GCB Bioenergy 8, 764–776. doi: 10.1111/gcbb.12278
Keywords: landscape genetic structure, habitat fragmentation, genetic barriers, gene flow, corridor function, Zizania latifolia
Citation: Chen Y, Liu Y, Fan X, Li W and Liu Y (2017) Landscape-Scale Genetic Structure of Wild Rice Zizania latifolia: The Roles of Rivers, Mountains and Fragmentation. Front. Ecol. Evol. 5:17. doi: 10.3389/fevo.2017.00017
Received: 17 November 2016; Accepted: 08 March 2017;
Published: 28 March 2017.
Edited by:
Miguel Arenas, Institute of Molecular Pathology and Immunology of the University of Porto, PortugalReviewed by:
Yessica Rico, Instituto de Ecología, MexicoRupesh Kailasrao Deshmukh, Laval University, Canada
Longjiang Fan, Zhejiang University, China
Copyright © 2017 Chen, Liu, Fan, Li and Liu. This is an open-access article distributed under the terms of the Creative Commons Attribution License (CC BY). The use, distribution or reproduction in other forums is permitted, provided the original author(s) or licensor are credited and that the original publication in this journal is cited, in accordance with accepted academic practice. No use, distribution or reproduction is permitted which does not comply with these terms.
*Correspondence: Wei Li, bGl3ZWlAd2JnY2FzLmNu
Yanling Liu, bGl1eWFubGluZ0B3YmdjYXMuY24=