 Marcos Fernández-Martínez
 Michał Bogdziewicz
 Josep M. Espelta
 Josep Peñuelas
- 1Department of Biology, Centre of Excellence Plant and Vegetation Ecology (PLECO), University of Antwerp, Wilrijk, Belgium
- 2CSIC, Global Ecology Unit, CREAF-CSIC-UAB, Bellaterra, Spain
- 3CREAF, Cerdanyola del Vallès, Catalonia, Spain
- 4Department of Systematic Zoology, Faculty of Biology, Adam Mickiewicz University, Poznan, Poland
Mast seeding, the extremely variable and synchronized production of fruits, is a common reproductive behavior in plants. Weather is centrally involved in driving masting. Yet, it is often claimed that it cannot be the sole proximate cause of masting because weather is less variable than fruit production and because the shape of their distributions differ. We used computer simulations to demonstrate that the assumption that weather cannot be the main driver of masting was only valid for linear relationships between weather and fruit production. Non-linear relationships between interannual variability in weather and crop size, however, can account for the differences in their variability and the shape of their distributions because of Jensen's inequality. Exponential relationships with weather can increase the variability of fruit production, and sigmoidal relationships can produce bimodal distributions. These results challenge the idea that meteorological variability cannot be the main proximate driver of mast seeding, returning meteorological variability to the forefront of masting research.
Introduction
Mast seeding, or masting, is a reproductive behavior characterized by an extremely irregular and synchronized production of fruit taking place at the population, community, or ecosystem level (Kelly and Sork, 2002). Such an irregular pattern of producing seeds has strong consequences in ecosystems, leading to cascading effects throughout the food web (Ostfeld and Keesing, 2000; Bogdziewicz et al., 2016). The mechanisms behind this intriguing behavior have puzzled ecologists for decades (Norton and Kelly, 1988; Sork et al., 1993; Espelta et al., 2008; Fernández-Martínez et al., 2012, 2017; Crone and Rapp, 2014; Pearse et al., 2016), leading to the formulation of several hypotheses about ultimate and proximate causes of this bizarre reproductive behavior.
Hypotheses accounting for ultimate causes (i.e., masting would be a selective trait that increases fitness) are based on the benefits of economies of scale, i.e., massive but random reproductive events would be more beneficial than producing regular crops of similar but smaller size (e.g., the predator-satiation hypothesis, see Curran and Webb, 2000; Espelta et al., 2008, 2017). Hypotheses accounting for proximate causes, though, are focussed on the mechanisms by which plants produce fruits (Norton and Kelly, 1988; Kelly and Sork, 2002). These hypotheses are being intensely debated, and many studies have investigated the potential causes of the high interannual variability of fruit production: stored carbohydrates (Hoch et al., 2013; Ichie et al., 2013), reproductive costs (Sala et al., 2012), availability of nutrients (Crone et al., 2009; Fernández-Martínez et al., 2016), pollination efficiency (Koenig et al., 2015; Bogdziewicz et al., 2017a,b), or weather, either as a cue prompting reproduction (Kelly et al., 2013; Pearse et al., 2014; Bogdziewicz et al., 2017b) or by its effect on plant productivity either by enhancing photosynthesis (Fernández-Martínez et al., 2015, 2017) or by its interaction with nutrient availability (Smaill et al., 2011). Amongst proximate causes, meteorological variability may be an inseparable component of variable seed production (Pearse et al., 2016), because weather is the most evident source of interannual variability that can affect plant productivity. However, it has often been claimed that factors other than weather have to be involved in driving mast seeding behavior (Koenig and Knops, 2000; Kelly and Sork, 2002; Crone and Rapp, 2014; Pearse et al., 2016).
Two main arguments have been used to claim that weather cannot be the sole proximate cause of masting. First, fruit production is much more interannually variable (i.e., CV = SD · mean−1, at the population level, the standard way to characterize masting behavior; Herrera et al., 1998) than meteorological variables such as rainfall or temperature (Koenig and Knops, 2000, 2005; Kelly and Sork, 2002), two of the most commonly used meteorological variables for predicting crop size. Second, meteorological variables are rarely bimodally distributed, but fruit production sometimes is (Norton and Kelly, 1988; Herrera et al., 1998). These arguments, though, are only correct when linear relationships between seed production and weather are assumed, even though a large number of masting studies have relied on logarithmic transformations for seed production to normalize model residuals (Sork et al., 1993; Koenig et al., 1994; Kelly et al., 2013; Pearse et al., 2014). This transformation linearises the relationship between crop size and weather, but the true relationship remains unequivocally non-linear and is thus within the domain of Jensen's inequality.
Jensen's inequality (Jensen, 1905; Ruel and Ayres, 1999; Denny, 2017) is a mathematical property that applies to non-linear functions. Understanding this property is useful in order to better predict and understand the consequences of predictor variability on the response variables for functions of different shapes. Briefly, Jensen's inequality implies that the variance of a predictor variable will increase the variance of the response variable in accelerating functions (i.e., convex functions where the slope increases; the 2nd derivative is positive, as in exponential-growth functions). Conversely, the variance of a predictor variable will decrease the variance of the response variable in decelerating functions [i.e., the slope decreases in concave down functions; the 2nd derivative is negative, as in logarithmic functions, see Denny (2017) for a detailed explanation].
Many of the published relationships between fruit production and weather are subject to Jensen's inequality because fruit production is usually log-transformed to fit the models, implying that meteorological variability can increase or decrease the variability of fruit production depending on the shape of the function. Jensen's inequality also means that response and predictor variables will likely be distributed differently in non-linear relationships (Ruel and Ayres, 1999). A Gaussian distribution for a predictor can easily lead to an exponentially distributed response variable (e.g., gamma distribution) in accelerating functions. Similarly, other types of non-linear relationships, such as sigmoidal functions, can produce a bimodal response variable, another property sometimes found in fruit-production data (Herrera et al., 1998).
The aim of this study was thus to demonstrate, using computer simulations, that common and even expected non-linear relationships between weather and fruit production could lead to the differences in distribution and temporal variability observed in the time series of weather and fruit production. Positive results would return meteorological variability to the focus of masting research.
Methods
We performed five simulations in which fruit production (response variable) followed a linear, exponential, logarithmic, sigmoidal, and Gaussian relationship with a meteorological variable to demonstrate that the extreme variability in fruit production data can be explained by a normally distributed, less variable predictor (e.g., weather). We simulated 48 meteorological time series of 100 years following a normal distribution with a mean of 600 (e.g., proximate annual rainfall in Barcelona) and an SD ranging from 10 to 200. Hence, the simulated interannual variability (CV) ranged from 0.017 to 0.33, which are plausible ranges of interannual meteorological variability of annual temperature (~5%) and highly variable annual rainfall in the Mediterranean regions (~30%). However, the discussion of our results apply to any meteorological variable (relative humidity, wind speed, rainy days) that could affect the biology of a given species that produces fruits (Crone and Rapp, 2014). For each simulated meteorological time series, we then simulated fruit production using linear, exponential, logarithmic, sigmoid, and Gaussian functions with a normally distributed error for different slopes of the functions (or width for Gaussian). The SD of the predicted values was 10% of the average of the predicted values for all simulations (ensuring a statistically significant relationship between the dependent and the predictor variables for most of the slopes). We simulated 100 years of fruit production 1,000 times and calculated the average proportional variability (PV) for each slope and meteorological time series. PV is calculated as: where is each of the pairwise comparisons of all the z of values of the variable and C is the number of all possible pairwise combinations within the set of values (see Heath, 2006 for further calculation details). The PV index is a robust measure of variability that overcomes some of the mathematical problems that the CV presents, especially when assessing variability in non-normally distributed data (Heath, 2006; Fernández-Martínez et al., 2016). However, because the CV index is still widely used in ecology, we also calculated it in our simulations and presented the results in Supplementary Material (Figure S1). All analyses were performed using R (R Core Team, 2015); the full code used to extract the results is available in Supplementary Material, section 1.
We also searched the literature for exemplar masting studies that provided relationships between fruit production and weather to summarize information about fruit production and interannual meteorological variability (CV and PV) and the shape (linear or non-linear) of their relationship. The results of these analyses should help other authors interpret their results when using non-linear relationships in their studies.
Results and Discussion
Our simulations indicated that the variability (PV) of the response variable, in a linear relationship between two variables (i.e., f(fruit production) ≈ β weather + ε, where β represents the slope of rainfall and ε is the error term), increased slightly for a very low slope coefficient (β) at any variability of the predictor variable (weather) but quickly reached an asymptote at very similar values of the predictor (Figure 1A). The normal distribution of the independent variable in this case was also translated into the response variable, without being affected by the slope of the relationship (Figures 2A,B). This simulation, however, produced fruit-production data very different from those reported in masting studies (Kelly, 1994; Herrera et al., 1998; Fernández-Martínez et al., 2016). Additionally, linear relationships, as in this first scenario, have rarely been reported in masting studies (Table 1), because fruit production is usually log-transformed before fitting the models to normalize the residuals. The variability in the meteorological variables in these cases is always similar in magnitude to the variability of fruit production, as our simulation also suggested (Table 1). Our second simulation used log-transformed data for fruit production (exponential function), the most common analysis performed in masting studies (e.g., Sork et al., 1993; Koenig et al., 1994; Kelly et al., 2013; Pearse et al., 2014), in which Jensen's inequality already plays a role.
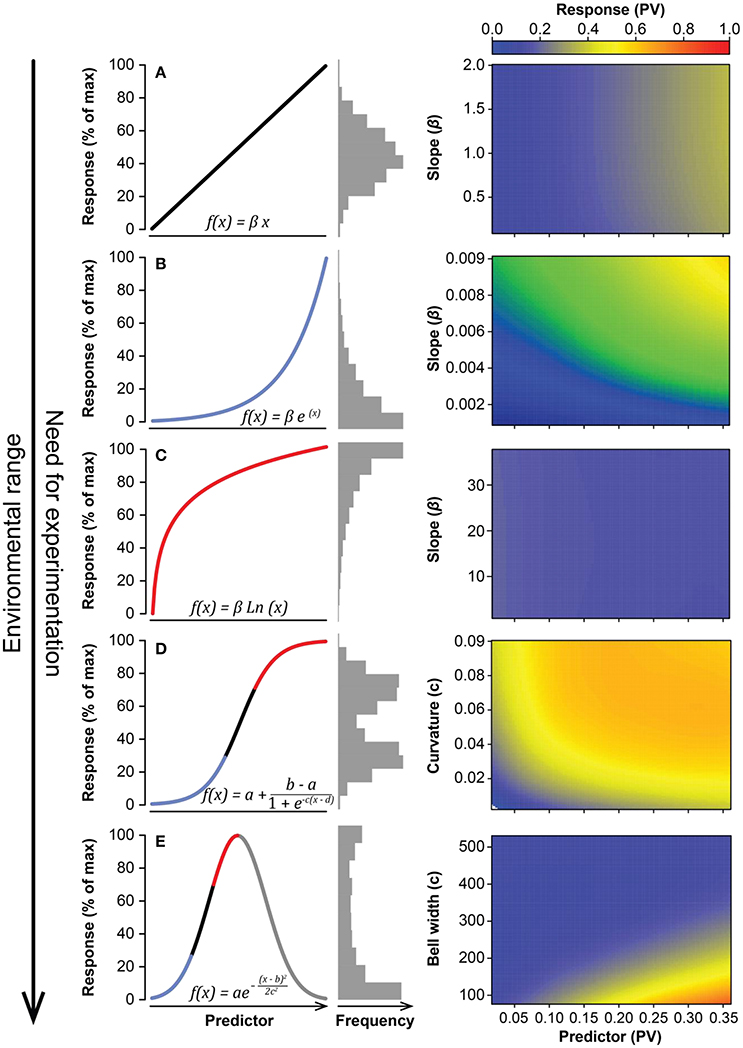
Figure 1. Summary of theoretical responses of an ecosystem, or organism, variable as a function of an environmental predictor. Shown responses are, from narrow to wide environmental range of the environmental predictor, lineal (A), exponential (B), logarithmic (C), sigmoidal (D), and Gaussian (E). Coloured lines represent the different types of responses within functions (blue, exponential growth; black, linear; red, logarithmic). Gray horizontal bars show the distribution of the response variable for each case. Boxes on the right side show the variation of the response variable (e.g., fruit production, color gradient) as a function of the variability of the predictor (e.g., weather) and the strength of the relationship between both variables for each of the theoretical responses. The variability of the response variable was estimated using the proportional variability index (PV, see Heath, 2006). Simulations performed with the coefficient of variation are shown in Figure S1. Blue colors indicate low values of variability (i.e., PV) and red colors indicate high values.
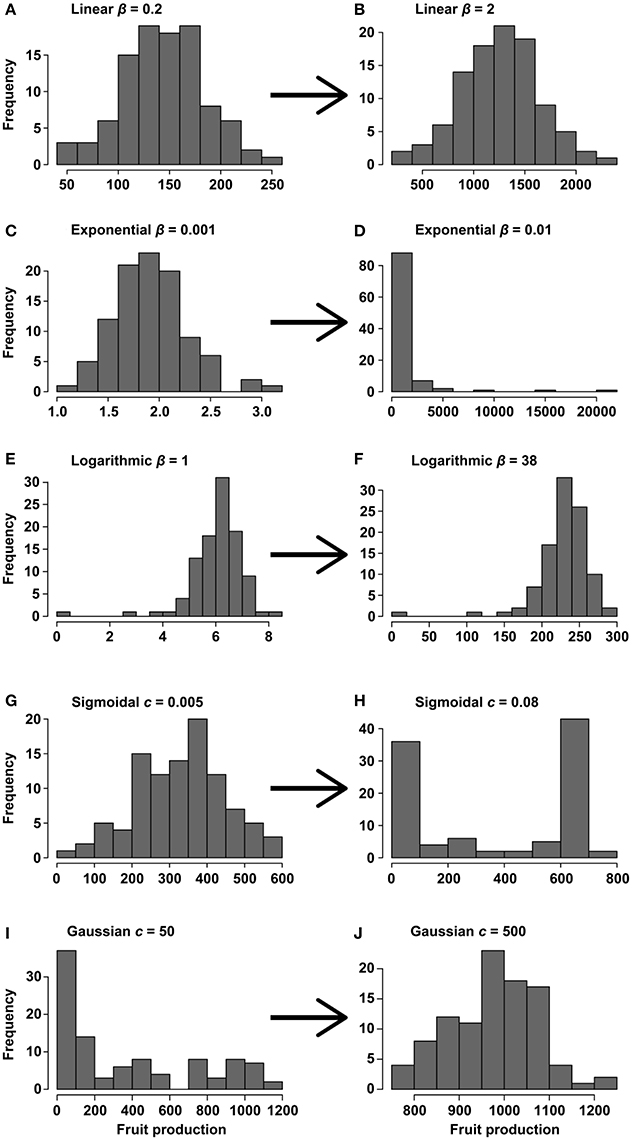
Figure 2. Histograms of the change in the distribution of fruit production for different slopes and functions [linear (A,B), exponential (C,D), logarithmic (E,F), sigmoidal (G,H), and Gaussian (I,J)] assuming that fruit production depends on a Gaussian meteorological variable with a mean of 600 and an SD of 150 (CV = 0.25). Distributions for low slopes—or c parameters for sigmoidal and Gaussian functions—(A,C,E,G,I) and distributions for high slopes (B,D,F,H,J). The code for this simulation is provided in Supplementary Material, section 1.
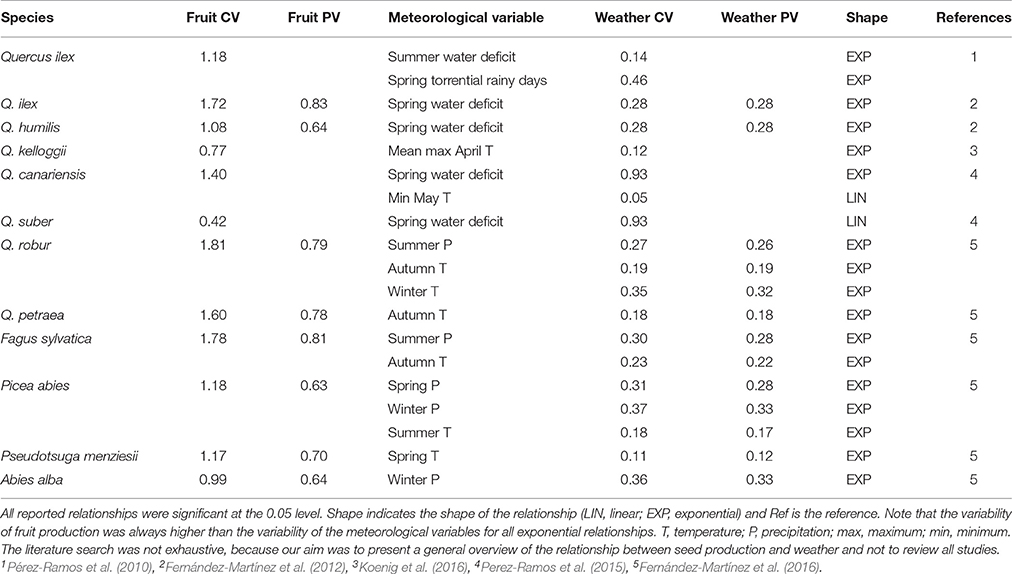
Table 1. Examples extracted from the literature showing the differences in the CVs and PVs of weather and fruit production for linear and exponential relationships.
The variability of fruit production increased steeply with β in an exponential function of the type f(fruit production) ≈ e(β weather)+ ε, especially at high predictor variability (Figure 1B). When this kind of relationship between response and predictor was assumed, the variability of the response variable rapidly increased above the variability of the predictor, using both PV and the CV indices (Figure S1). The shape of the distribution of the response variable varied with β, from a normal distribution similar to that of the meteorological predictor at β = 0.001, to a highly left-skewed distribution at β = 0.01 (Figures 2C,D) similar to those reported for fruit production in masting studies. Our bibliographical search clearly supported these results. Fruit production was always more variable than the predictor meteorological variable in relationships in which fruit production was log-transformed (Table 1). The change from constant to highly variable fruit production along with the magnitude of the slope of the relationship implied that masting behavior may be a consequence of the hypersensitivity of plants to meteorological variability [e.g., high exponential slopes (β)], providing the first mathematical support for previous hypotheses (Kelly, 1994; Kelly and Sork, 2002). This hypersensitivity to weather cues could be explained by synergistic effects boosting fruit production because of favorable weather for photosynthesis and nutrient availability. For instance, acorn production in Mediterranean oaks has been reported to be positively associated to spring rainfall which, a part from drought, ameliorates nutrient limitation by enhancing nitrogen mineralization (Smaill et al., 2011; Fernández-Martínez et al., 2015; Bogdziewicz et al., 2017a). Overall, this phenomenon reflects the high costs of reproduction of some species (Sala et al., 2012).
The third simulation, using the logarithmic function f(fruit production) ≈ β Ln (weather) + ε, draws the typical shape of a function describing a process of diminishing returns, in which the response variable increases steeply at low values of the predictor but saturates at high values (Figure 1C). In this case, the behavior of the variability is completely opposite to the behavior reported in the two previous simulations. Because of the concave-down shape of the function, variability of the response was rather insensitive to variability in the predictor. For high values of variability of the predictor, the logarithmic function even shrinks variability of the response. Like in linear functions, the slope of the relationship did not affect variability of the response. Consequently, the shape of the distribution of the response variable barely varied β, presenting right-skewed Gaussian-like distributions for low and high slopes (Figures 2E,F).
Our fourth simulation used a sigmoidal function of the type , where a and b are the minimum and maximum values in the function, respectively, d is the value of the predictor variable at the inflection point, and c is the degree of curvature of the function, which is linear at low values of c and predicts only a + ε and b + ε values for high values of c. The variability of fruit production rapidly increased with c until it approached an asymptote near PV = 0.7 (Figure 1D) or CV = 1 (Figure S1). The increase, though, was even steeper for highly variable weather. This simulation further indicated that phenomena produced by sigmoidal relationships could potentially increase the variability of response variables much more than that of the predictors. Sigmoidal relationships between weather and fruit production produced a distribution of fruit production similar to a Gaussian distribution at low values of c, but the distribution became bimodal at high values of c (Figures 2G,H). This kind of relationship could account for cases like the one reported for Chionochloa sp. in which flowering only occurred when average temperature for January and February was >10°C (McKone et al., 1998; Rees et al., 2002). However, we could not find any sigmoidal relationships in masting studies (Table 1).
Our last simulation used a Gaussian function of the type , where a is maximum y value of the function, b is the value of the predictor variable at the center of the bell, and c is the standard deviation (or width) of the bell, determining the curvature of the function, which defines a flat function at high values of c and a narrow bell at low values. The variability of the response variable increased with the variability of the predictor but decreased with increasing c (Figure 1E), being even lower than that of the predictor for high values of c. Simulated distributions were Gaussian-like for high values of c but almost uniform for narrow (low c) Gaussian relationships, except for a high frequency of low values (Figures 2I,J).
Overall, our results point out that the claim that weather cannot be the main proximate driver of fruit production in mast-seeding species was based on the erroneous assumption that the relationship between weather and fruit production must be linear. Most relationships in nature, though, are theoretically non-linear (Denny, 2017). Operative values for environmental gradients for life on Earth are optimal, so most of the relationships between organisms and the environment should be Gaussian-like or similar (Figure 1E), increasing from low values of the independent variable until they reach the optimal value at which the response peaks. The relationship then becomes negative at high values of the independent variable. Linear and exponential relationships, such as those usually reported in masting studies (Table 1), should appear within the mid-low or the mid-high range of the independent variable in which the response occurs (Figure 1). To the best of our knowledge, however, second-order polynomial or Gaussian-like relationships between any environmental variable and fruit production have not yet been reported, indicating that studies with larger ranges of environmental variability are required to better understand the link between weather and fruit production. Second-order polynomial or Gaussian-like relationships are very common in other fields of ecology (e.g., species distributions) but are very rare in many others such as masting.
Observational and experimental studies in ecology are still very limited in space and time, so determining the complete range of responses for a dependent variable remains difficult (see Figure 1). The biosphere has evolved to operate nearest to its optimal values, which may be another reason for the lack of more Gaussian-like relationships. In other words, we may not be able to find Gaussian-like relationships between, for example, precipitation and fruit production in a focal population, because when the given species is pushed far away from its optimum (e.g., by climate), it will be replaced by a different one that will operate better (or will be more competitive). This hypothesis could easily be tested experimentally, but we predict that observational studies will provide little evidence.
Masting studies should reconsider the role of meteorological variability as the most likely predictor of ecosystemic functioning, because weather is the main source of interannual variability to which plants are subjected. Comprehending the role of weather as a proximate cause for masting is especially important after the recent discoveries that resources invested in reproduction are acquired only during the several months prior to fruit maturation (Hoch et al., 2013; Ichie et al., 2013; Fernández-Martínez et al., 2015; Allen et al., 2017). Additionally, multiple meteorological variables can linearly or non-linearly interact to force trees to produce or not produce seeds in a given year, because weather affects both the acquisition of resources by plants, by conditioning their photosynthetic rates, and pollination efficiency (Fernández-Martínez et al., 2012; Koenig et al., 2015; Pesendorfer et al., 2016; Bogdziewicz et al., 2017a,b). We propose that rejecting weather as the most parsimonious driver of high interannual variability of seed production in masting plants was premature and should be revised. We hypothesize that more knowledge could be gained from studying plant reproduction if we combined observational studies with experiments that modify the amount of interannual meteorological variability to which plants are subjected, amongst other factors (e.g., pollen dispersal). These kinds of experiments may more easily identify non-linear relationships and would certainly provide new insights into the response of the reproductive behavior of plants to meteorological variability (Figure 1).
Author Contributions
MF, MB, JE, and JP conceived the paper. MF performed the statistical analyses and MB provided data. All authors contributed substantially to the writing of the paper.
Conflict of Interest Statement
The authors declare that the research was conducted in the absence of any commercial or financial relationships that could be construed as a potential conflict of interest.
Acknowledgments
This research was supported by the European Research Council Synergy grant ERC-2013-726 SyG-610028 IMBALANCE-P, the Spanish Government project CGL2016-79835-P (FERTWARM), the Catalan Government project SGR 2014-274, NOVFORESTS (CGL2012-33398), FORASSEMBLY (CGL2015-70558-P) of the Spanish Ministry of Economy, and the project BEEMED (SGR913) of the Catalan Government. MF is funded by a post-doc subsidy of the University of Antwerp. MB was supported by the (Polish) National Science Foundation grants no. Preludium 2015/17/N/NZ8/01565 and by the Foundation for Polish Science Scholarship “Start.”
Supplementary Material
The Supplementary Material for this article can be found online at: https://www.frontiersin.org/articles/10.3389/fevo.2017.00134/full#supplementary-material
References
Allen, R. B., Millard, P., and Richardson, S. J. (2017). “A resource centric view of climate and mast seeding in trees,” in Progress in Botany (Berlin; Heidelberg: Springer), 1–36. Available online at: https://link.springer.com/chapter/10.1007%2F124_2017_8#citeasm
Bogdziewicz, M., Fernández-Martínez, M., Bonal, R., Belmonte, J., and Maria Espelta, J. (2017a). The Moran effect and environmental vetoes: phenology synchrony and drought drive seed production in a Mediterranean oak. Proc. R. Soc. B. doi: 10.1098/rspb.2017.1784
Bogdziewicz, M., Szymkowiak, J., Kasprzyk, I., Grewling, Ł., Borowski, Z., Borycka, K., et al. (2017b). Masting in wind-pollinated trees: system-specific roles of weather and pollination dynamics in driving seed production. Ecology 98, 2615–2625. doi: 10.1002/ecy.1951
Bogdziewicz, M., Zwolak, R., and Crone, E. E. (2016). How do vertebrates respond to mast seeding? Oikos 125, 300–307. doi: 10.1111/oik.03012
Crone, E. E., Miller, E., and Sala, A. (2009). How do plants know when other plants are flowering? resource depletion, pollen limitation and mast-seeding in a perennial wildflower. Ecol. Lett. 12, 1119–1126. doi: 10.1111/j.1461-0248.2009.01365.x
Crone, E. E., and Rapp, J. M. (2014). Resource depletion, pollen coupling, and the ecology of mast seeding. Ann. N. Y. Acad. Sci. 1322, 21–34. doi: 10.1111/nyas.12465
Curran, L. M., and Webb, C. O. (2000). Experimental tests of the spatiotemporal scale of seed predation in mast-fruiting dipterocarpaceae. Ecol. Monogr. 70, 129–148. doi: 10.1890/0012-9615(2000)070[0129:ETOTSS]2.0.CO;2
Denny, M. (2017). The fallacy of the average: on the ubiquity, utility and continuing novelty of Jensen's inequality. J. Exp. Biol. 220, 139–146. doi: 10.1242/jeb.140368
Espelta, J. M., Arias-LeClaire, H., Fernández-Martínez, M., Doblas-Miranda, E., Muñoz, A., and Bonal, R. (2017). Beyond predator satiation: masting but also the effects of rainfall stochasticity on weevils drive acorn predation. Ecosphere 8:e01836. doi: 10.1002/ecs2.1836
Espelta, J. M., Cortés, P., Molowny-horas, R., Sánchez-humanes, B., and Retana, J. (2008). Masting mediated by summer drought reduces acorn predation in Mediterranean oak forests. Ecology 89, 805–817. doi: 10.1890/07-0217.1
Fernández-Martínez, M., Belmonte, J., Maria Espelta, J., and Espelta, J. M. (2012). Masting in oaks: disentangling the effect of flowering phenology, airborne pollen load and drought. Acta Oecol. 43, 51–59. doi: 10.1016/j.actao.2012.05.006
Fernández-Martínez, M., Garbulsky, M., Peñuelas, J., Peguero, G., and Espelta, J. M. (2015). Temporal trends in the enhanced vegetation index and spring weather predict seed production in Mediterranean oaks. Plant Ecol. 216, 1061–1072. doi: 10.1007/s11258-015-0489-1
Fernández-Martínez, M., Vicca, S., Janssens, I. A., Espelta, J. M., and Peñuelas, J. (2016). The role of nutrients, productivity and climate in determining tree fruit production in European forests. New Phytol. 213, 669–679. doi: 10.1111/nph.14193
Fernández-Martínez, M., Vicca, S., Janssens, I. A., Espelta, J. M., and Peñuelas, J. (2017). The north atlantic oscillation synchronises fruit production in western European forests. Ecography 40, 864–874. doi: 10.1111/ecog.02296
Heath, J. P. (2006). Quantifying temporal variability in population abundances. Oikos 115, 573–581. doi: 10.1111/j.2006.0030-1299.15067.x
Herrera, C., Jordano, P., Guitián, J., and Traveset, A. (1998). Annual variability in seed production by woody plants and the masting concept: reassessment of principles and relationship to pollination and seed dispersal. Am. Nat. 152, 576–594. doi: 10.1086/286191
Hoch, G., Siegwolf, R. T. W., Keel, S. G., Körner, C., and Han, Q. (2013). Fruit production in three masting tree species does not rely on stored carbon reserves. Oecologia 171, 653–662. doi: 10.1007/s00442-012-2579-2
Ichie, T., Igarashi, S., and Yoshida, S. (2013). Are stored carbohydrates necessary for seed production in temperate deciduous trees? J. Ecol. 101, 525–531. doi: 10.1111/1365-2745.12038
Jensen, J. L. W. (1905). Sur les fonctions convexes et les inégalités entre les valeurs moyennes. Acta Math. 30, 175–193. doi: 10.1007/BF02418571
Kelly, D. (1994). The evolutionary ecology of mast seeding. Trends Ecol. Evol. 9, 465–470. doi: 10.1016/0169-5347(94)90310-7
Kelly, D., Geldenhuis, A., James, A., Penelope Holland, E., Plank, M. J., Brockie, R. E., et al. (2013). Of mast and mean: differential-temperature cue makes mast seeding insensitive to climate change. Ecol. Lett. 16, 90–98. doi: 10.1111/ele.12020
Kelly, D., and Sork, V. L. (2002). Mast seeding in perennial plants: why, how, where? Annu. Rev. Ecol. Syst. 33, 427–447. doi: 10.1146/annurev.ecolsys.33.020602.095433
Koenig, W. D., Alejano, R., Carbonero, M. D., Fernandez-Rebollo, P., Knops, J., Maranon, T., et al. (2016). Is the relationship between mast-seeding and weather in oaks related to their life—history or phylogeny? Ecology 97, 2603–2615. doi: 10.1002/ecy.1490
Koenig, W. D., Knops, J. M. H., Carmen, W. J., and Pearse, I. S. (2015). What drives masting? the phenological synchrony hypothesis. Ecology 96, 184–192. doi: 10.1890/14-0819.1
Koenig, W., and Knops, J. (2000). Patterns of annual seed production by northern hemisphere trees: a global perspective. Am. Nat. 155, 59–69. doi: 10.1086/303302
Koenig, W., and Knops, J. (2005). The mystery of masting in trees. Am. Sci. 93, 340–347. doi: 10.1511/2005.4.340
Koenig, W., Mumme, R., Carmen, W., and Stanback, M. (1994). Acorn production by oaks in central coastal California: variation within and among years. Ecology 75, 99–109. doi: 10.2307/1939386
McKone, M. J., Kelly, D., and Lee, W. G. (1998). Effect of climate change on mast-seeding species: frequency of mass flowering and escape from specialist insect seed predators. Glob. Chang. Biol. 4, 591–596. doi: 10.1046/j.1365-2486.1998.00172.x
Norton, D. A., and Kelly, D. (1988). Mast seeding over 33 years by Dacrydium cupressinum Lamb. (rimu) (Podocarpaceae) in New Zealand: the importance of economies of scale. Funct. Ecol. 2, 399–408. doi: 10.2307/2389413
Ostfeld, R., and Keesing, F. (2000). Pulsed resources and community dynamics of consumers in terrestrial ecosystems. Trends Ecol. Evol. 15, 232–237. doi: 10.1016/S0169-5347(00)01862-0
Pearse, I. S., Koenig, W. D., and Kelly, D. (2016). Mechanisms of mast seeding: resources, weather, cues, and selection. New Phytol. 212, 546–562. doi: 10.1111/nph.14114
Pearse, I. S., Koenig, W. D., and Knops, J. M. H. (2014). Cues versus proximate drivers: testing the mechanism behind masting behavior. Oikos 123, 179–184. doi: 10.1111/j.1600-0706.2013.00608.x
Pérez-Ramos, I. M., Ourcival, J. M., Limousin, J. M., and Rambal, S. (2010). Mast seeding under increasing drought: results from a long-term data set and from a rainfall exclusion experiment. Ecology 91, 3057–3068. doi: 10.1890/09-2313.1
Perez-Ramos, I. M., Padilla-Díaz, C. M., Koenig, W. D., and Mara-ón, T. (2015). Environmental drivers of mast-seeding in Mediterranean oak species: does leaf habit matter? J. Ecol. 103, 691–700. doi: 10.1111/1365-2745.12400
Pesendorfer, M. B., Koenig, W. D., Pearse, I. S., Knops, J. M. H., and Funk, K. A. (2016). Individual resource limitation combined with population-wide pollen availability drives masting in the valley oak (Quercus lobata). J. Ecol. 104, 637–645. doi: 10.1111/1365-2745.12554
R Core Team (2015). R: A Language and Environment for Statistical Computing, version 3.2.3. Available online at: http://www.r-project.org/
Rees, M., Kelly, D., and Bjørnstad, O. N. (2002). Snow tussocks, chaos, and the evolution of mast seeding. Am. Nat. 160, 44–59. doi: 10.1086/340603
Ruel, J. J., and Ayres, M. P. (1999). Jensen's inequality predicts effects of environmental variation. Trends Ecol. Evol. 14, 361–366. doi: 10.1016/S0169-5347(99)01664-X
Sala, A., Hopping, K., McIntire, E. J. B., Delzon, S., and Crone, E. E. (2012). Masting in whitebark pine (Pinus albicaulis) depletes stored nutrients. New Phytol. 196, 189–199. doi: 10.1111/j.1469-8137.2012.04257.x
Smaill, S. J., Clinton, P. W., Allen, R. B., and Davis, M. R. (2011). Climate cues and resources interact to determine seed production by a masting species. J. Ecol. 99, 870–877. doi: 10.1111/j.1365-2745.2011.01803.x
Keywords: masting, plants, reproduction, seed production, weather, variability, linearity
Citation: Fernández-Martínez M, Bogdziewicz M, Espelta JM and Peñuelas J (2017) Nature beyond Linearity: Meteorological Variability and Jensen's Inequality Can Explain Mast Seeding Behavior. Front. Ecol. Evol. 5:134. doi: 10.3389/fevo.2017.00134
Received: 14 August 2017; Accepted: 18 October 2017;
Published: 01 November 2017.
Edited by:
Yuhua Duan, National Energy Technology Laboratory (DOE), United StatesReviewed by:
Yi Zheng, Centers for Disease Control and Prevention (CDC), United StatesJose Climent, Instituto Nacional de Investigación y Tecnología Agraria y Alimentaria (INIA), Spain
Copyright © 2017 Fernández-Martínez, Bogdziewicz, Espelta and Peñuelas. This is an open-access article distributed under the terms of the Creative Commons Attribution License (CC BY). The use, distribution or reproduction in other forums is permitted, provided the original author(s) or licensor are credited and that the original publication in this journal is cited, in accordance with accepted academic practice. No use, distribution or reproduction is permitted which does not comply with these terms.
*Correspondence: Marcos Fernández-Martínez, bS5idXJyaWFjaEBnbWFpbC5jb20=