 Nathalie Butt1,2*
 Hanna Rosner-Katz3
 Allison D. Binley4Sierra Davis4Jade Pon4Taylor Radu4Joseph Bennett3,4
- 1School of Biological Sciences, The University of Queensland, St. Lucia, QLD, Australia
- 2Centre for Biodiversity and Conservation Science, The University of Queensland, St. Lucia, QLD, Australia
- 3Department of Biology, Carleton University, Ottawa, ON, Canada
- 4Institute of Environmental and Interdisciplinary Sciences, Carleton University, Ottawa, ON, Canada
Threat classifications allow conservationists to categorize threatening processes faced by species of conservation concern, but lack of information on threat severity hampers efforts to establish the cost-effectiveness of conservation management actions. Actions and funds are often prioritized according to the prevalence of a threat; however, probability of success of threat management is little considered. Using data from three countries, New Zealand (NZ), Australia, and the United States, we identified which threats are more prevalent, more expensive to manage, and more likely to be successfully managed. In two of the countries, NZ and Australia, invasive species is the most prevalent, and costly threat, and actions to address it have the lowest probability of success. Thus, prioritizing actions based on prevalence rather than severity of threat may reduce efficiency. These findings provide general guidelines to agencies attempting to carry out cost-effective conservation of threatened species with limited resources.
Introduction
Conservation and natural resource managers face an ongoing dilemma in relation to effective resource allocation: some actions may be more costly and have lower probability of success than others, and thus undertaking them may be an inefficient use of limited resources. One method for prioritizing recovery actions is to identify the threats with greatest frequency or prevalence and address those preferentially (e.g., Allek et al., 2018). The threat categorization used in the IUCN RedList (website) (Salafsky et al., 2008) allocates threats to one of 11 classes covering human-driven (direct and indirect) and natural threats, and as the authors state, provides a “standard lexicon” for identification and assessment of threats everywhere (Salafsky et al., 2008). Although it would be useful to have some kind of hierarchical threat framework, and in some places or systems there have been relative assessments of threat magnitude (Smith et al., 2015), information on threat severity is lacking (Lawler et al., 2002), and generally threat prevalence is used as a proxy for severity, or impact of a threat. Although this provides a convenient method for prioritizing actions, using prevalence as the sole determinant of threat level may not lead to the most effective management; additional information may be needed.
Conservation resources are limited and funds are generally insufficient for protecting threatened species (Joseph et al., 2009; McCarthy et al., 2012), and are not allocated evenly between species groups (Robson Gordon et al., 2020). Triage (Bottrill et al., 2008), and project prioritization protocols (PPPs) (Joseph et al., 2009), have been developed to maximize the effectiveness of species-based conservation actions given their financial constraints, and in general there has been increasing consideration of costs in conservation planning. However, reporting of costs is not common, systematic, or comprehensive (Cook et al., 2017). Prioritization approaches are often either species-based, where species-specific actions are undertaken, or threat-based, where the threat is mitigated (McDonald et al., 2015). Until recently, threat-based management was rarely informed by cost-effectiveness based on the expected biodiversity benefits (Wilson et al., 2007; Carwardine et al., 2012; McDonald et al., 2015). Tools such as Priority Threat Management (PTM) aim to assess the cost-effectiveness of management actions as part of the planning process, and PTM can guide conservation strategies that deliver biodiversity benefits to groups of species at a regional scale (Carwardine et al., 2018).
Species’ responses to threats, and the management actions intended to address them, are determined by their sensitivity and adaptive capacity, and knowledge of this can inform effective, and cost-efficient, species-specific conservation action, or indeed whether or not it is worthwhile investing in a particular action (Cattarino et al., 2016; Butt and Gallagher, 2018). Although species-based prioritization was an important step toward accounting for the cost of conservation actions and their probability of success, there has been thus far no detailed analysis of the relationship between costs of mitigation actions and the threatening processes themselves. To our knowledge, the relative costs and risks of failure for management actions addressing major threats have not previously been summarized.
There has also been a general lack of focus on the probability of success (tractability) of threat management (although see Carwardine et al., 2018). We therefore sought to establish (1) whether certain threats are more expensive to mitigate and (2) which threats are associated with a lower tractability, in order to provide general guidance to agencies. We also combined cost and probability of success to derive a metric of overall risk. Risk associated with cost refers to not just the direct financial loss of a failed action, but the loss of funds that could have been better spent, and therefore reflects the lost potential to undertake other conservation actions that could have resulted in better conservation outcomes.
Methods
Data
We used data from threatened species conservation programs from New Zealand (NZ), the state of New South Wales (NSW) in Australia, and the United States. The NZ and NSW data were collected to support conservation prioritization programs, and include detailed management prescriptions for 700 and 400 species, respectively, including estimated costs and probabilities of success derived from expert elicitation. The USA dataset was compiled by examining threatened species recovery plans from the US Fish and Wildlife Service (USFWS) for which cost estimates for actions were available. We examined 144 USFWS species recovery plans from 2001 to 2016. Example data for individual species are provided in the Supplementary Material. Data for NZ and NSW are available via Bennett et al. (2014, 2017), and full data for the USWS are available via www.fws.gov/endangered/species/recovery-plans.html.
Threats
We used a modified version of the IUCN threat classification (Salafsky et al., 2008), and allocated the threats listed in the NZ and NSW databases to our classification system (Supplementary Table S1). We explicitly included threats related to land management (degradation, habitat fragmentation, and land clearing) in category 7.3 “other ecosystem modifications,” and created a new category, 12: “Other threats” to which we allocated threats relating to tenure issues (practices not supporting conservation, and land use change) (Table 1). The USA system is based on “threat categories,” A-E (Supplementary Table S2), that encompass a similar range of factors as the IUCN classification, but are organized differently, such that it was not possible to allocate the USA recovery plans to the same system as the NZ and NSW plans.
Management Actions
Management actions for the NZ and NSW datasets were derived using information from >100 and ∼250 threatened species experts, respectively, and include time-, threat-, and location-specific actions deemed necessary to ensure that if all prescribed actions are undertaken, there will be an estimated ∼95% probability that a given species will survive over the next 50 years for NZ and 100 years for NSW (Joseph et al., 2009; Bennett et al., 2014; Brazill-Boast et al., 2018). Probability of success was estimated, by the same experts, as the probability that the project could be successful if implemented (see Joseph et al., 2009 for details): for our analysis, we assumed that actions would be implemented. To derive a metric of risk, we combined cost and probability of success as follows: overall risk metric = (100 - percent probability of success) × cost. Management actions for the US dataset were derived from data for 144 species. Probability of success was not provided in these plans; however, recovery priority numbers (RPNs) integrate an estimate of recovery potential (“high,” “low”) at a species level (US Fish and Wildlife Service [USFWS], 2012), and we used this as a proxy for success of the related action(s). We used this binary classification as a coarse indicator of probability of success of actions. Given this coarseness in estimated recovery potential, we did not attempt to derive a metric of overall risk for USA data.
Analysis
Using the management actions listed in the datasets outlined above, we tested for (1) differences in cost of management actions among threat categories and (2) differences in probability of success among threat categories. We did so using permutation-based ANOVA, followed by post hoc pairwise permutation tests, with P-values adjusted using the method of Benjamini and Yekutieli (2001). All analyses were conducted using R v. 3.5.3 (R Core Team, 2018).
Results
Threats
Overall, vulnerable species in NSW are threatened by a wider range of threats than those in NZ (11 and nine threat categories, respectively). Species on the NZ list are not listed as being threatened by Transportation and service corridors, or Climate change and severe weather; there were no species in either dataset threatened by Geological events. The numbers of species’ management actions in each threat category are also more evenly spread across threat classes for the NSW species (Supplementary Figure S1). In NZ, the number of species’ management actions in the Invasive and other problematic species and genes category is an order of magnitude higher than that of the next most frequent threat category (Natural system modifications; Table 1 and Supplementary Figure S1a). For NSW, the most prominent threat categories were Invasive and other problematic species and genes and Natural system modifications (Supplementary Figure S1b). The least frequent threat classes for NZ were Residential and commercial development and Pollution; for NSW, they were Energy production and mining and Climate change and severe weather (Table 1A). For the United States, the most prevalent limiting factors with an associated cost were A, The present or threatened destruction, modification, or curtailment of its habitat or range, and E, Other natural or man-made factors affecting its continued existence (Table 1B and Supplementary Figure S1c), while B, Overutilization for commercial, recreational, scientific, or educational purposes, was the least prevalent limiting factor.
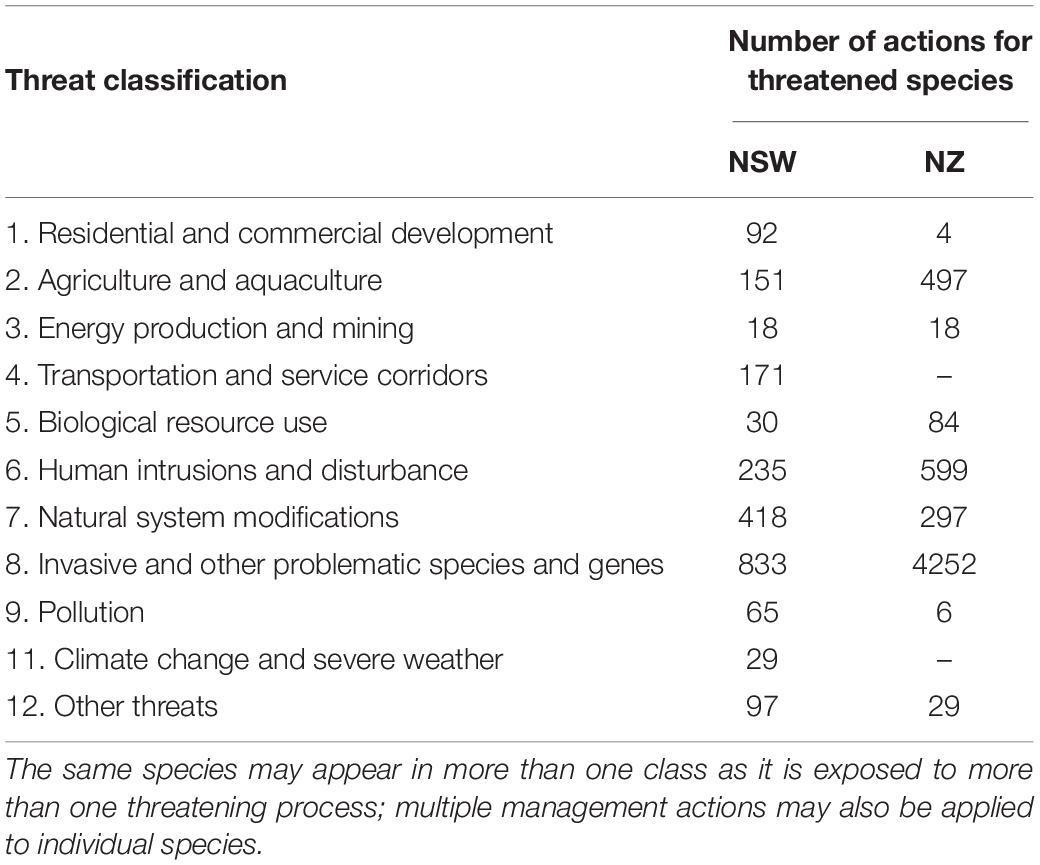
Table 1A. Number of threatened species in each broad IUCN threat class for NSW and NZ.
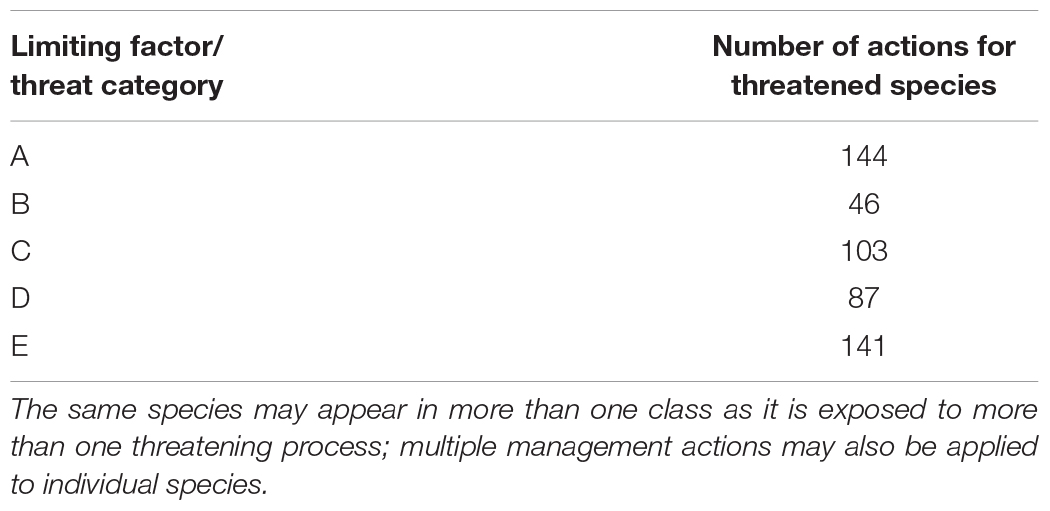
Table 1B. Number of threatened species, with associated cost reported, by limiting factor for the United States.
Cost
For all three jurisdictions, costs of management actions differed significantly between threat categories (P > 0.0001; Figure 1 and Supplementary Tables S6–S8). On average, the most expensive actions in both NSW and NZ were those managing for Invasive and other problematic species and genes (Figures 1A,B). For NZ, the second most expensive threat category was Other, in relation to land use change issues. Agriculture and Aquaculture and Biological Resource Use were also key costs for NZ, while for NSW, Human intrusions and disturbance and Agriculture and Aquaculture were the greatest costs after Invasive and other problematic species and genes. The lowest costs were for actions addressing Pollution in NZ and Energy production and mining in NSW. For the US recovery plans, based on total cost per species, limiting factor A, The present or threatened destruction, modification, or curtailment of its habitat or range, was the most expensive (Figure 1C). The lowest total cost per species was for actions addressing limiting factor B, Overutilization for commercial, recreational, scientific, or educational purposes.
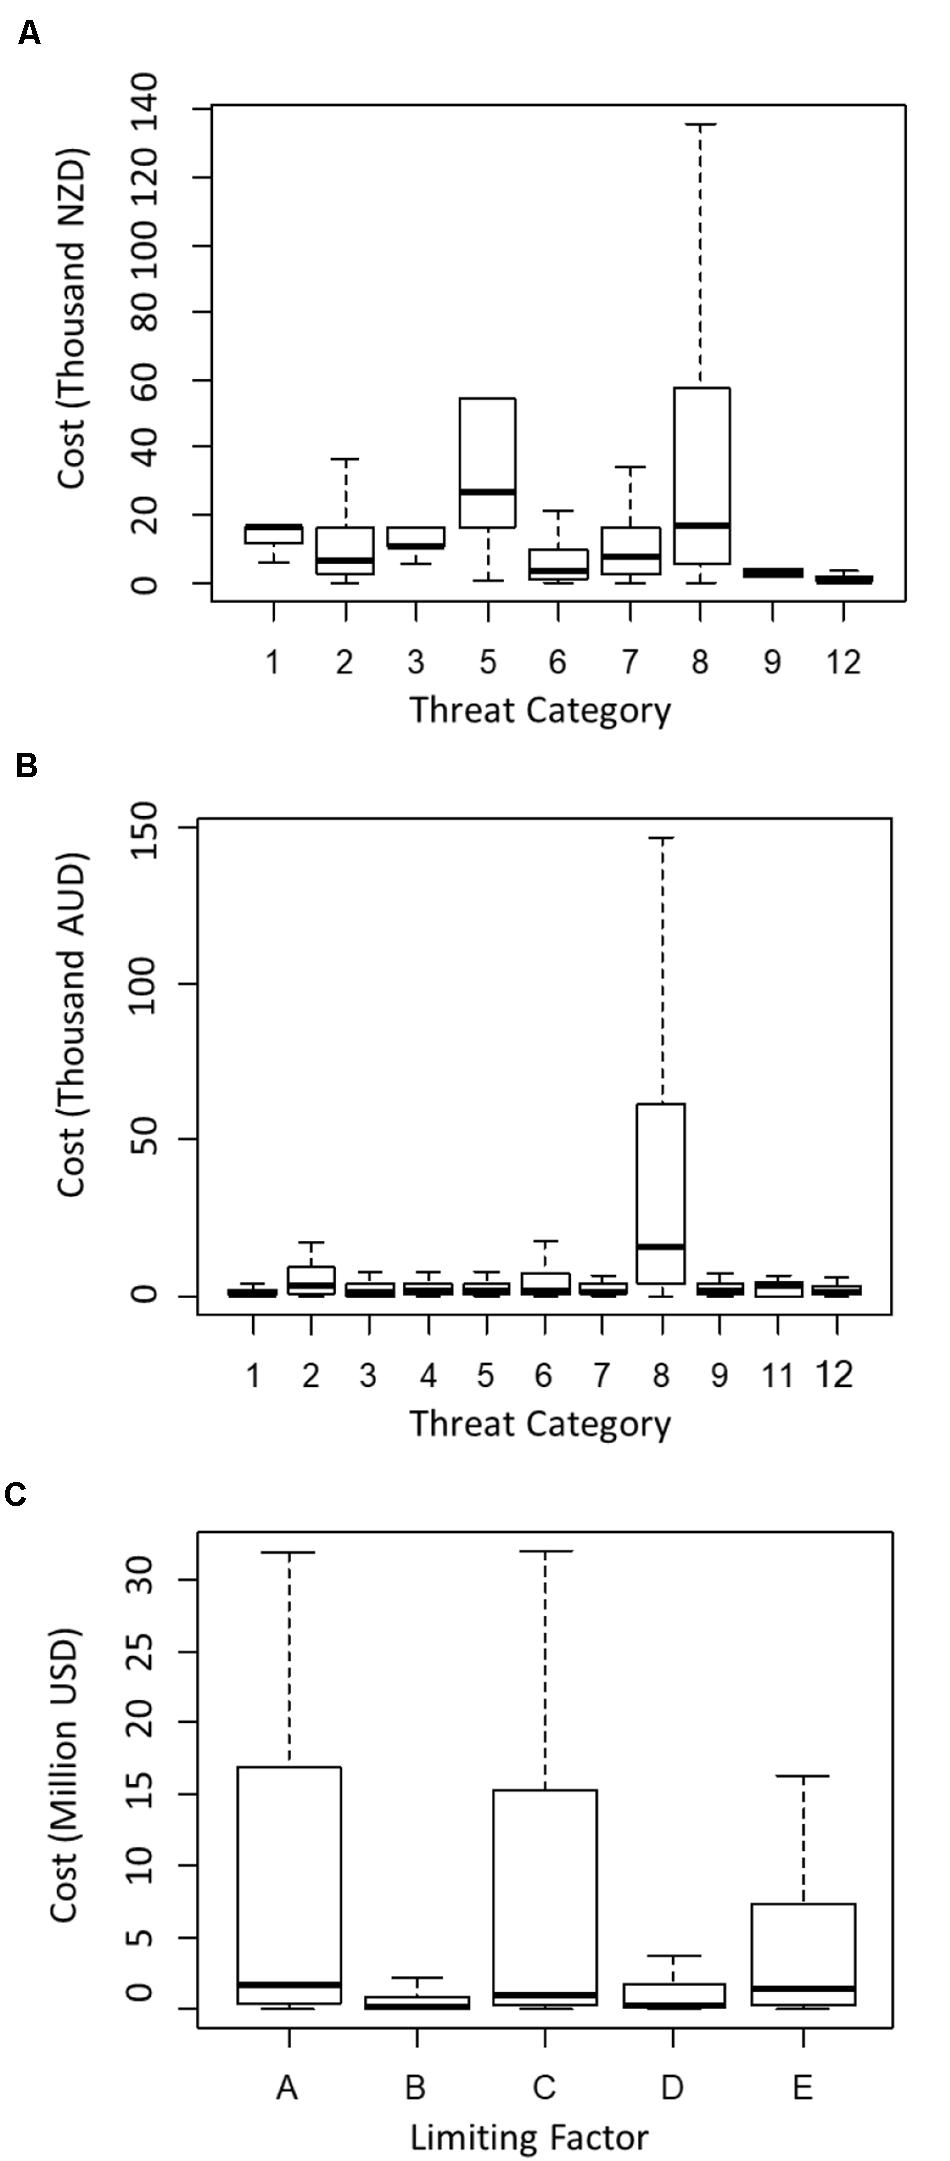
Figure 1. Costs of conservation actions addressing each threat category, for (A) New Zealand; (B) New South Wales; and (C) United States. Threat categories (“Limiting Factors”) for United States. Threat Categories for New Zealand and New South Wales are as follows: 1 = development, 2 = agriculture, 3 = energy, 4 = transport, 5 = resource use, 6 = disturbance, 7 = modification, 8 = invasive species, 9 = pollution, 10 = geological, 11 = climate change, 12 = other (see Table 1A and Supplementary Table S1 for details). Limiting Factors for United States are as follows: A = habitat destruction or modification, B = overexploitation, C = disease or predation, D = inadequacy of regulations, E = other natural or anthropogenic factors (see Supplementary Table S2 and US Fish and Wildlife Service [USFWS], 2012 for details).
Tractability
Probabilities of success for actions to address various threat categories were significantly different among threat categories in NZ (P < 0.0001). Overall, the probabilities of success, or tractability, for management actions were lowest for actions addressing biological resource use and unknown threats (Figure 2 and Supplementary Table S9). Probability of success was not significantly different among threat categories for NSW (P = 0.88); and recovery potential was not significantly different among threat categories for the United States (P = 0.68).
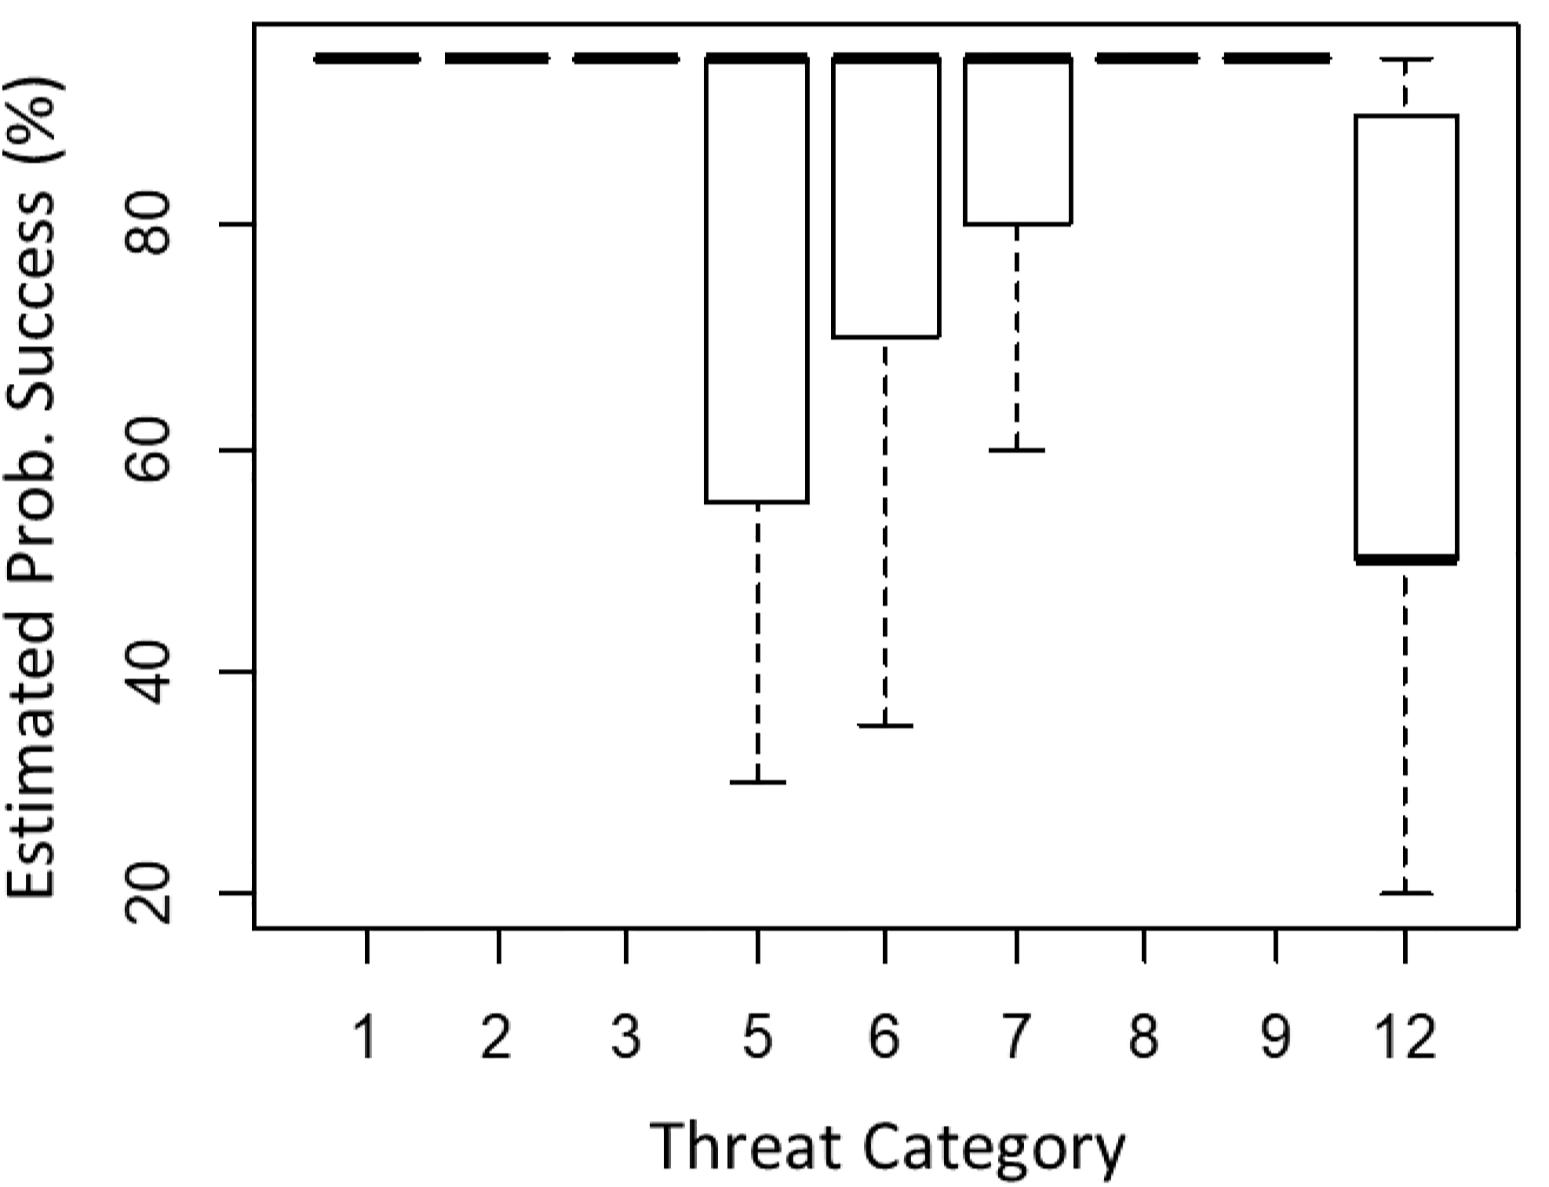
Figure 2. Estimated probabilities of success addressing each threat category for New Zealand. Results for New South Wales and United States were non-significant (Supplementary Tables S3, S4). Threat categories are as for Figure 1 (see Table 1A and Supplementary Table S1 for details).
Overall Risk
Overall risk metrics of actions to address various threat categories were significantly different (P < 0.0001), for both NZ and NSW. For NZ, actions to address invasive species and biological resource use had the highest risk metrics, driven by cost and probability of success, respectively, compared to other threat categories (Figure 3A and Supplementary Table S10). For NSW, actions to address invasive species had the highest overall risk metrics (Figure 3B and Supplementary Table S11).
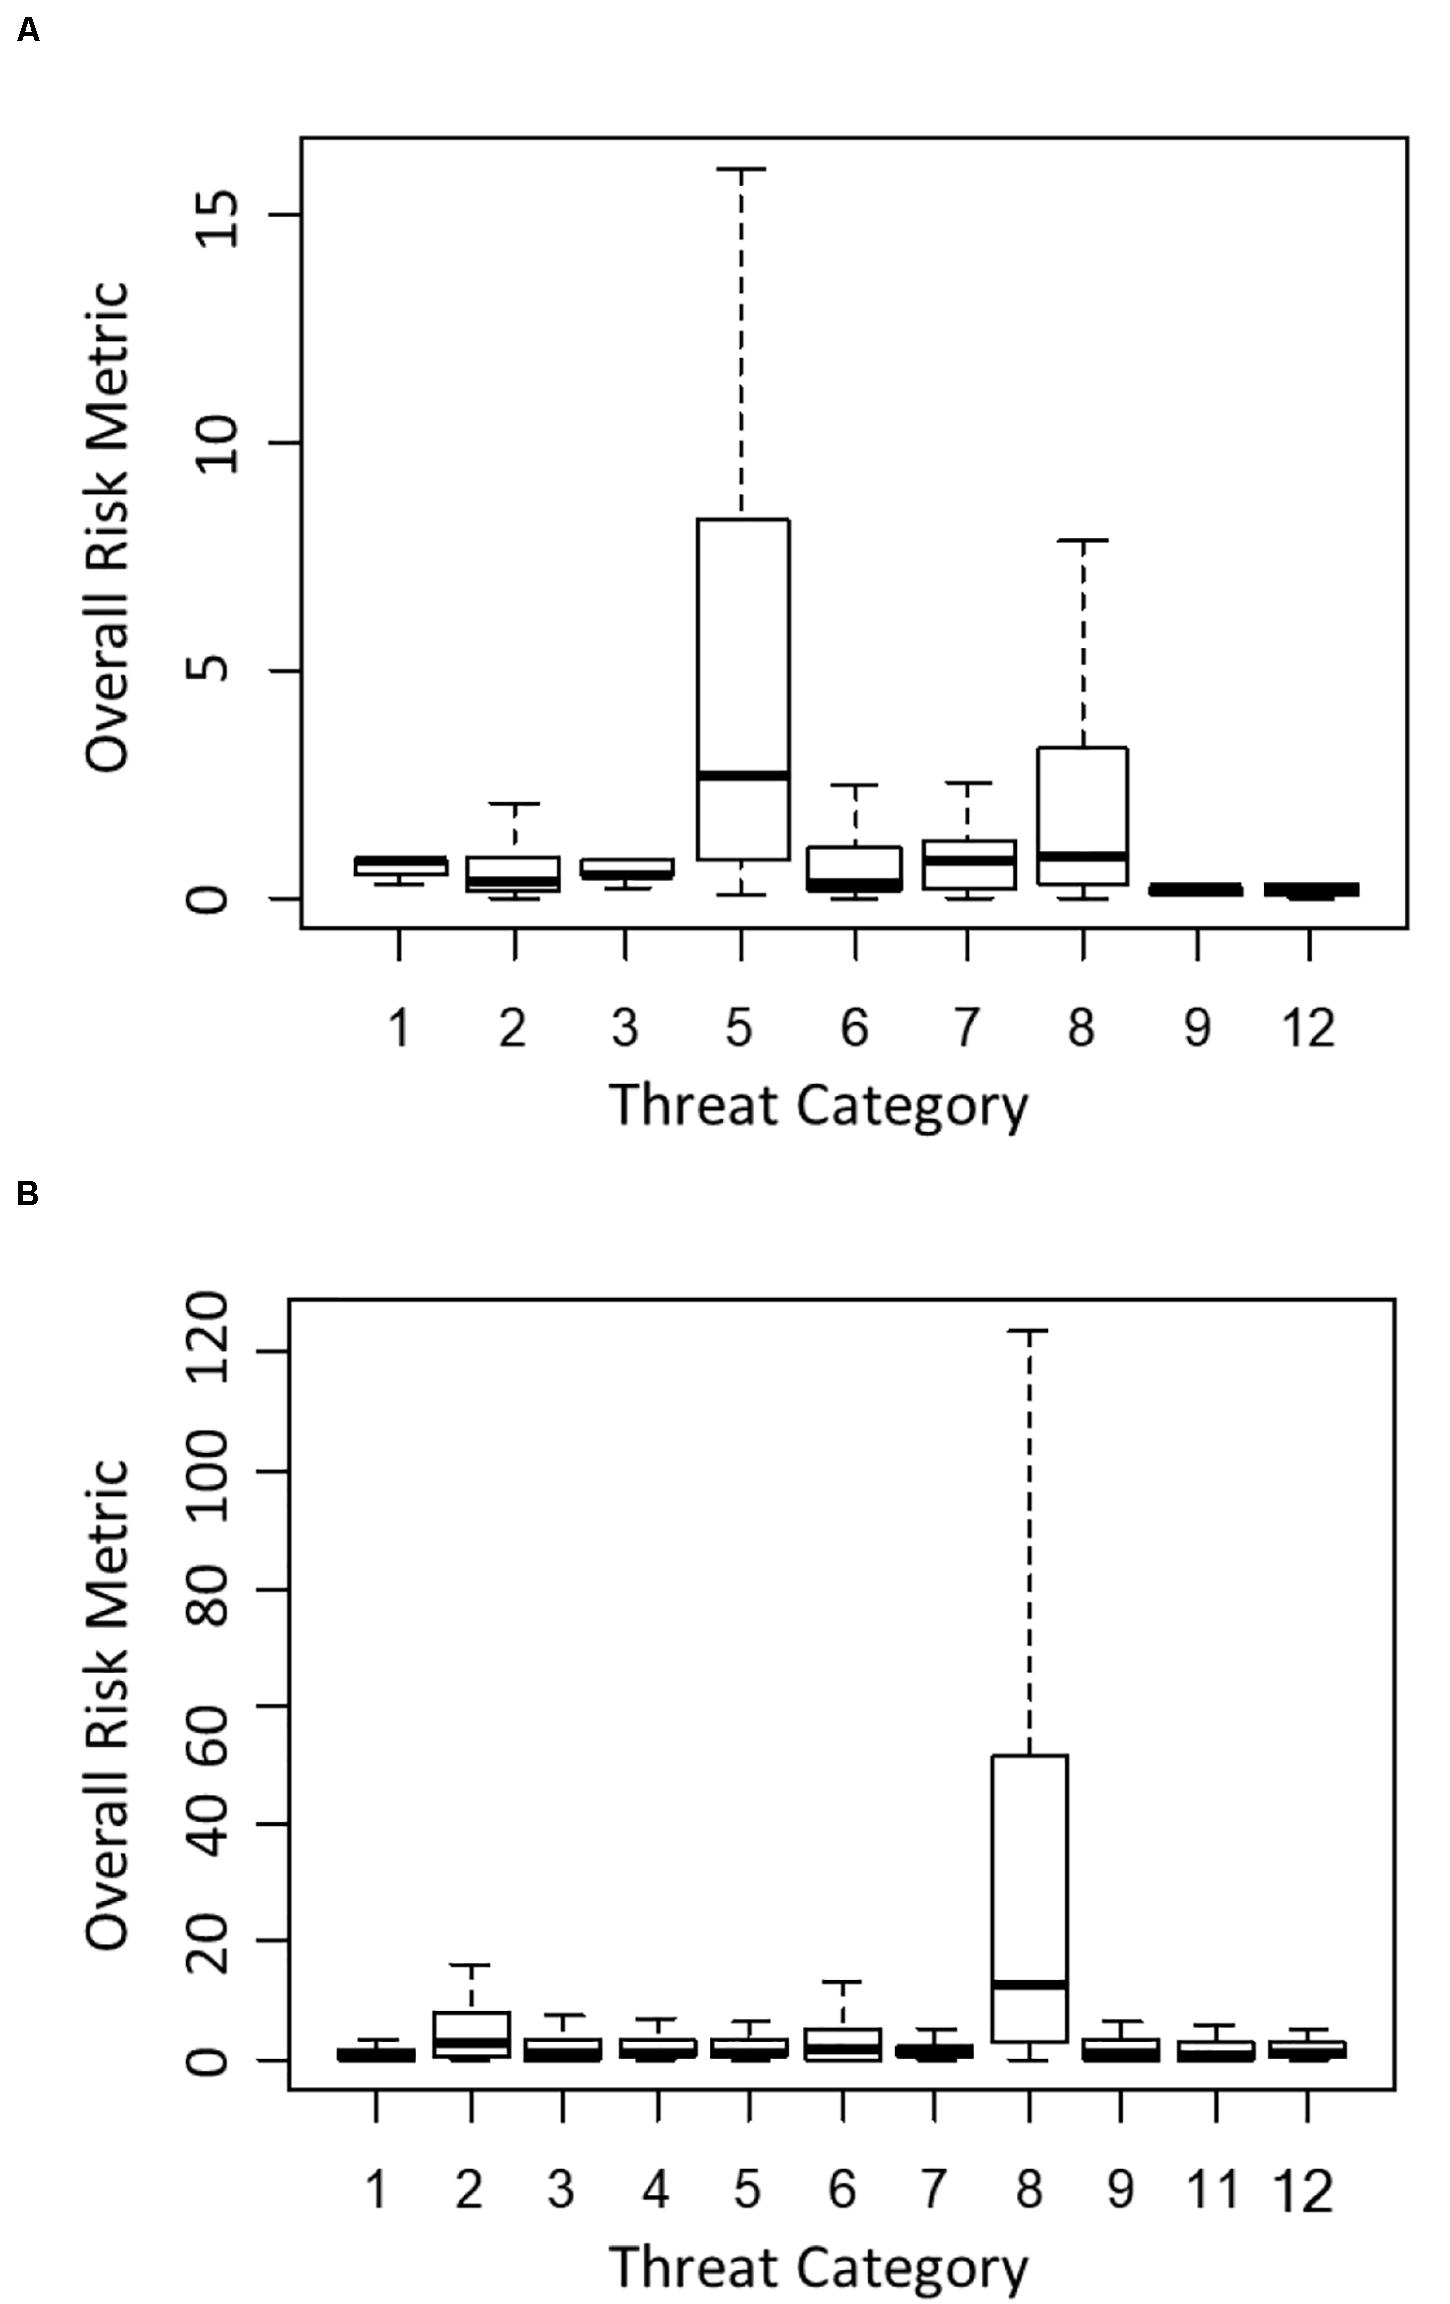
Figure 3. Overall risk metrics [i.e., (100 - % probability of success × cost)] of conservation actions addressing each threat category, for (A) New Zealand and (B) New South Wales. Metrics are presented in units of 1 million, but are not directly comparable between New Zealand and New South Wales, due to currency differences. Threat categories are as for Figure 1 (see Table 1A and Supplementary Table S1 for details).
Discussion
As prevalence of threatening process varies between threats, locations, and systems, it can be a sensible way of measuring threat level, and is often used as a proxy for severity (Allek et al., 2018). However, although a threat may be widespread and affect many species, such as natural system or habitat modification in NSW and the United States, effectively addressing this may be difficult due to cost or low probability of success, while addressing other threats may be easier. In a situation where managers must prioritize limited resources, it may sometimes be a false economy, in terms of species persistence, to focus on the most prevalent threat at the expense of less frequent ones.
While for NZ and NSW invasive species was both the most prevalent and most costly threat, frequency of management is likely to be a factor in driving the high cost: invasive species often need to be managed regularly and repeatedly. For example, in NZ, many invasive species can be managed to low levels with high probability of success in a given management area, but cannot be practically eradicated, and thus the NZ database contains management for these species at regular, often annual intervals (data in Bennett et al., 2014). The invasive species category includes a range of impacts, such as weed establishment, livestock grazing, browsing by introduced feral grazing species, and predation by introduced feral carnivores, and practitioners would therefore need to consider management at finer scales than the broader “invasive species.” In the United States, category A, The present or threatened destruction, modification, or curtailment of its habitat or range, was the most prevalent threat: one previous study showed that 92% of threatened vertebrate species in the United States were affected by destruction of habitat (Yiming and Wilcove, 2005). This is also the case for North America in general, with 84% of endangered species in Canada being threatened by habitat loss (Venter et al., 2006). This category of threat was also the most costly to manage in the United States. The most prevalent threats were also the most costly in all three jurisdictions, underlining the need for more conservation funding.
Biological resource use/overutilization is expensive to address in NZ, but low cost in the United States, while probability of success for NZ is low (making it a high risk threat to address). Interestingly, this apparent discrepancy is not straightforward to parse, and it is unclear whether it may be a function of costs being underestimated in the United States, or overestimated in NZ. In terms of broad probability of success of conservation actions in the United States, high RPNs (a function of high threat level and high recovery potential) were represented fairly evenly across the five threat categories, although there was some indication that overutilization (Factor B), had a lower success rate than habitat or range changes (A), and other factors (E). This may also support the suggestion that costs of mitigating this particular threat are underestimated in the United States.
Although individual actions for certain threats such as invasive species may be expensive, one way of improving the cost-effectiveness of addressing them is through actions that focus on recovery of multiple species (Auerbach et al., 2015). The NZ and NSW datasets were designed for prioritization programs that explicitly incorporate the cost and benefits of such shared actions (Joseph et al., 2009), and several of the US recovery plans include multiple species in the same habitat or region (US Fish and Wildlife Service [USFW], 2016 data). For other jurisdictions, decision-support tools, such as the “Cost-Effective Resource Allocator” (Di Fonzo et al., 2017) are intended to guide natural resource managers and policy makers through decisions over which actions to implement and when, and are helpful in terms of considering multiple species, threats, and actions. Actions that have a high probability of success may not always be prioritized if the cumulative benefit, across a suite of species or ecosystems, is low. Conversely, actions with relatively high cost or low benefit may be implemented, if they provide shared benefit among many species. While our derived metric does not explicitly incorporate shared benefits or costs, these are important components of any management prioritization (cf. Carwardine et al., 2018).
Our study underlines the need for clarity of assessment and understanding of the impact of threats. In the United States, lack of standard methods for classification of extinction risks for species add to the confusion around how best to manage species for conservation. For example, there are differences between state- and federal-level listing criteria for species, meaning that a species’ risk (of extinction), and therefore the best course of mitigation action, is unclear (Mothes et al., 2019). Further, the breadth of the US threat categories means that they can encompass a broad range of threatening processes. For example, category E, Other natural or human-made factors affecting its continued existence includes threats as disparate as small population size and road development. Clearly these two factors would require completely different management actions. In addition, probability of success should be considered in relation to action, as well as in relation to species in order to improve action prioritization. The lack of specificity in the broad US categories makes the results of our analysis difficult to interpret in relation to the NZ and NSW data. Many countries lack even estimates of cost for their recovery plans, which further complicates comparisons of tractability of management actions.
Conclusion
Threats to species vary in prevalence, cost of management actions to address them, and probability of success. Some threats are riskier to address, and thus cost and tractability should be accounted for. The prevalence of a threat should not necessarily determine its management priority: highly prevalent threats should not automatically be those addressed first, unless synergies can be found across species and threats, such that combined actions lead to lower costs or higher probabilities of success, or both.
Although our results are preliminary, and constrained by data and protocol limitations noted above, our analysis strongly indicates that harmonizing definitions across jurisdictions should be an important step to allow for more accurate comparisons and sharing of useful information in relation to management effectiveness. In addition, more research is needed regarding the threats included in the different categorization schemes: “Other” accounted for around only 0.5% of actions across NZ species, and management costs were NZ$538,000, with a generally low probability of success (65%). Such high levels of uncertainty make it difficult for managers to assess the effectiveness of actions. Considering risk as a function of both tractability of the action and its cost is critical for conservation decision-making around action prioritization.
Data Availability Statement
The raw data used in the analyses of this article are available from: (US) www.fws.gov/endangered/species/recovery-plans.html, (NZ) http://dx.doi.org/10.5061/dryad.3qn55, and (NSW) http://dx.doi.org/10.5061/dryad.p86t5.
Author Contributions
All authors contributed to the article and approved the submitted version. NB and JB conceived the study and the design, and contributed to data analysis, interpretation, and manuscript drafting. HR-K, AB, SD, JP, and TR contributed to data acquisition. HR-K and AB contributed to data analysis and revision of the drafted manuscript.
Funding
NB was supported by ARC grant DE150101552. JB was supported by the Natural Sciences and Engineering Research Council of Canada (NSERC).
Conflict of Interest
The authors declare that the research was conducted in the absence of any commercial or financial relationships that could be construed as a potential conflict of interest.
Acknowledgments
We thank R. Maloney and J. Brazill-Boast for providing data.
Supplementary Material
The Supplementary Material for this article can be found online at: https://www.frontiersin.org/articles/10.3389/fevo.2020.00223/full#supplementary-material
References
Allek, A., Assis, A. S., Eiras, N., Amaral, T. P., Williams, B., Butt, N., et al. (2018). The threats endangering Australia’s at-risk fauna. Biol. Conserv. 222, 172–179. doi: 10.1016/j.biocon.2018.03.029
Auerbach, N. A., Wilson, K. A., Tulloch, A. I., Rhodes, J. R., Hanson, J. O., and Possingham, H. P. (2015). Effects of threat management interactions on conservation priorities. Conserv. Biol. 29, 1626–1635. doi: 10.1111/cobi.12551
Benjamini, Y., and Yekutieli, D. (2001). The control of the false discovery rate in multiple testing under dependency. Ann. Stat. 29, 1165–1188.
Bennett, J. R., Elliott, G., Mellish, B., Joseph, L. N., Tulloch, A. I., Probert, W. J., et al. (2014). Balancing phylogenetic diversity and species numbers in conservation prioritization, using a case study of threatened species in New Zealand. Biol. Conserv. 174, 47–54. doi: 10.1016/j.biocon.2014.03.013
Bennett, J. R., Maloney, R. F., Steeves, T. E., Brazill-Boast, J., Possingham, H. P., and Seddon, P. J. (2017). Spending limited resources on de-extinction could lead to net biodiversity loss. Nat. Ecol. Evol. 1:53.
Bottrill, M. C., Carwardine, J., Bode, M., Cook, C., Game, E. T., Grantham, H., et al. (2008). Is conservation triage just smart decision making? TREE 12, 649–654. doi: 10.1016/j.tree.2008.07.007
Brazill-Boast, J., Williams, M., Rickwood, B., Partridge, T., Bywater, G., Cumbo, B., et al. (2018). A large-scale application of project prioritization to threatened species investment by a government agency. PLoS One 13:e0201413. doi: 10.1371/journal.pone.0201413
Butt, N., and Gallagher, R. V. (2018). Using species traits to guide conservation actions under climate change. Clim. Change 151, 317–332. doi: 10.1007/s10584-018-2294-z
Carwardine, J., Martin, T. G., Firn, J., Ponce Reyes, R., Nicol, S., Reeson, A., et al. (2018). Priority threat management for biodiversity conservation: a handbook. J. Appl. Ecol. 56, 481–490. doi: 10.1111/1365-2664.13268
Carwardine, J., O’Connor, T., Legge, S., Mackey, B., Possingham, H. P., and Martin, T. G. (2012). Prioritizing threat management for biodiversity conservation. Conserv. Lett. 5, 196–204. doi: 10.1111/j.1755-263x.2012.00228.x
Cattarino, L., Hermoso, V., Bradfor, L. W., Carwardine, J., Wilson, K. A., Kennard, M. J., et al. (2016). Accounting for continuous species’ responses to management effort enhances cost-effectiveness of conservation decisions. Biol. Conserv. 197, 116–123. doi: 10.1016/j.biocon.2016.02.030
Cook, C. N., Pullin, A. S., Sutherland, W. J., Stewart, G. B., and Carrasco, L. R. (2017). Considering cost alongside the effectiveness of management in evidence-based conservation: a systematic reporting protocol. Biol. Conserv. 209, 508–516. doi: 10.1016/j.biocon.2017.03.022
Di Fonzo, M. M., Nicol, S., Possingham, H. P., Flakus, S., West, J. G., Failing, L., et al. (2017). Cost-effective resource allocator: a decision support tool for threatened species management. Parks 23, 101–113. doi: 10.2305/IUCN.CH.2017.PARKS-23-1MMIDF.en
Joseph, L. N., Maloney, R. F., and Possingham, H. P. (2009). Optimal allocation of resources among threatened species: a project prioritization protocol. Conserv. Biol. 23, 328–338. doi: 10.1111/j.1523-1739.2008.01124.x
Lawler, J. L., Campbell, S. P., Guerry, A. D., Kolozsvary, M. B., O’Connor, R. J., and Seward, L. C. N. (2002). The scope and treatment of threats in endangered species recovery plans. Ecol. Appl. 12, 663–667. doi: 10.1890/1051-0761(2002)012[0663:tsatot]2.0.co;2
McCarthy, D. P., Donald, P. F., Scharlemann, J. P., Buchanan, G. M., Balmford, A., Green, J. M., et al. (2012). Financial costs of meeting global biodiversity conservation targets: current spending and unmet needs. Science 338, 946–949. doi: 10.1126/science.1229803
McDonald, J. A., Carwardine, J., Joseph, L. N., Klein, C. J., Rout, T. M., Watson, J. E. M., et al. (2015). Improving policy efficiency and effectiveness to save more species: a case study of the megadiverse country Australia. Biol. Conserv. 182, 102–108. doi: 10.1016/j.biocon.2014.11.030
Mothes, C., Clements, S. L., Hewavithana, D. K., Howell, H. J., David, A. S., Leventhal, N. D., et al. (2019). Use of standardized methods to improve extinction-risk classification. Conserv. Biol. 34, 754–761. doi: 10.1111/cobi.13421
R Core Team (2018). R: A Language and Environment for Statistical Computing. Vienna: R Foundation for Statistical Computing.
Robson Gordon, E., Butt, N., Rosner-Katz, H., Binley, A. D., and Bennett, J. R. (2020). Relative costs of conserving threatened species across taxonomic groups. Conserv. Biol. 34, 276–281. doi: 10.1111/cobi.13382
Salafsky, N., Salzer, D., Stattersfield, A. J., Hilton-Taylor, C., Neugarten, R., Butchart, S. H. M., et al. (2008). A standard lexicon for biodiversity conservation: unified classifications of threats and actions. Conserv. Biol. 22, 897–911. doi: 10.1111/j.1523-1739.2008.00937.x
Smith, S. D. P., McIntyre, P. B., Halpern, B. S., Cooke, R. M., Marino, A. L., Boyer, G. L., et al. (2015). Rating impacts in a multi-stressor world: a quantitative assessment of 50 stressors affecting the Great Lakes. Ecol. Appl. 23, 717–728. doi: 10.1890/14-0366.1
US Fish and Wildlife Service [USFWS] (2012). Report to Congress on the Recovery of Threatened and Endangered Species. Avaliable at: www.fws.gov/endangered/esa-library/pdf/Recovery_Report_FY2011-2012.pdf (accessed 2017).
US Fish and Wildlife Service [USFW] (2016). Available online at: https://www.fisheries.noaa.gov/national/endangered-species-conservation/critical-habitat
Venter, O., Brodeur, N. N., Nemiroof, L., Belland, B., Dolinsek, I. J., and Grant, J. W. A. (2006). Threats to endangered species in Canada. BioScience 56, 903–910.
Wilson, K. A., Underwood, E. C., Morrison, S. A., Klausmeyer, K. R., Murdoch, W. W., Reyers, B., et al. (2007). Conserving biodiversity efficiently: what to do, where, when. PLoS Biol. 5:e223. doi: 10.1371/journal.pbio.0050223
Keywords: action prioritization, threats, conservation planning, conservation management, costs
Citation: Butt N, Rosner-Katz H, Binley AD, Davis S, Pon J, Radu T and Bennett J (2020) Threats, Costs, and Probability of Success: Informing Conservation Choices. Front. Ecol. Evol. 8:223. doi: 10.3389/fevo.2020.00223
Received: 12 March 2020; Accepted: 16 June 2020;
Published: 03 July 2020.
Edited by:
J. Guy Castley, Griffith University, AustraliaReviewed by:
Virgilio Hermoso, Centre Tecnològic Forestal de Catalunya (CTFC), SpainJessica Walsh, Monash University, Australia
Copyright © 2020 Butt, Rosner-Katz, Binley, Davis, Pon, Radu and Bennett. This is an open-access article distributed under the terms of the Creative Commons Attribution License (CC BY). The use, distribution or reproduction in other forums is permitted, provided the original author(s) and the copyright owner(s) are credited and that the original publication in this journal is cited, in accordance with accepted academic practice. No use, distribution or reproduction is permitted which does not comply with these terms.
*Correspondence: Nathalie Butt, bi5idXR0QHVxLmVkdS5hdQ==