 Sadhvi Selvaraj
 Bradley S. Case
 W. Lindsey White
- School of Science, Faculty of Health and Environmental Sciences, Auckland University of Technology, Auckland, New Zealand
Remote sensing is an effective tool for applications such as discriminating plant species, detecting plant diseases or drought, and mapping aquatic vegetation such as seagrasses and seaweeds. Each plant species has a unique spectral reflectance which can be used with remote sensing to map them. However, variations in season, illumination, phenological stages, turbidity or location may affect the spectral reflectance. The aim of this study is to understand the spatial and seasonal effect on two commonly found New Zealand native seaweed species, Ecklonia radiata (C. Agardh) J. Agardh. and Carpophyllum maschalocarpum (Turner) Grev. We collected hyperspectral data (using ASD Handheld2 Field spectrometer with wavelength range 325–1,075 nm) of the seaweed species from four locations across four seasons and used mixed effects modelling to determine the model that best described the spectral data of each seaweed species. The results showed some seasonal pattern across the four locations. In general, summer has an effect on both the species in all four locations; likely due to the higher rates of photosynthesis. However, location did not effect the spectral signature of either species in winter. This study shows the potential for analysis of other micro-and macro-environment factors of different species and provides an understanding of the degree of natural spectral variation in seaweeds enabling further assessment of the impact of anthropogenic activities and changing environment on their spectral characteristics and health. It also identifies a general trend for best season to collect data for better classification accuracy across larger areas.
Introduction
Remote sensing surveys use multispectral and hyperspectral sensors to map vegetation based on the unique spectral signature of the individual plant species. Typically for healthy plants, there is low spectral reflectance in the visible region and high reflectance in near infrared region of the spectrum attributed to its biochemical and biophysical properties (Clark et al., 2005). Effects of physiological stress due to disease, insects or drought change the plant’s spectral signature and such characteristic spectral features can be exploited (using remote sensing) to address mass scale outbreaks by early detection (Kanemasu, 1974; Silva et al., 2008; Abdullah et al., 2018). However, in the terrestrial environment, there is also spectral variability within single healthy plant due to natural variations such as season, substrate features, illumination or phenological stages (Silva et al., 2008; Bue et al., 2015) which if accounted for, can improve mapping accuracy (Somers and Asner, 2014).
Anthropogenic activities such as urbanisation, deforestation and farming directly impacts the coastal environment globally (Seers and Shears, 2015), especially benthic seaweed communities (Benedetti-Cecchi et al., 2001), by reducing the amount of light that these communities receive for photosynthesis. These effects are of growing concern to fast urbanising New Zealand, particularly in the Hauraki Gulf located on the northeast of North Island (Blain and Shears, 2019). The Hauraki Gulf is home to riverine estuaries, sheltered harbours, coastal beaches and open-coast shores with recreational, cultural and economic importance (Seers and Shears, 2015) and high impacts of sedimentation on coastal environment makes it essential to monitor the health of its benthic habitats (Kelly et al., 2014). In addition, seaweeds are affected by other natural factors such as season, varying growth cycle in different seasons, nutrient flow or environment conditions (Fung et al., 2013; Kotta et al., 2014). While spectral variability due to natural variations are being explored in terrestrial environment and seaweeds are being mapped using satellite/aerial data around the world (Uhrin and Townsend, 2016), very little research has investigated the variability of spectral characteristics of seaweeds.
Reflectance properties of a species of marine vegetation can vary spatially and seasonally (Fyfe, 2003). There is little information on reflectance properties of a single marine vegetation species at different seasons (Casal et al., 2013). Researchers who have undertaken studies on eelgrass mapping in shallow waters in Canada (O’Neill et al., 2011), discrimination of invasive seaweed Caulerpa species in the Mediterranean (Kišević et al., 2011) and seaweeds in Baltic Sea (Kotta et al., 2014) have all recommended more research on reflectance properties of individual species across different seasons and locations for wide scale mapping applicability, accurate characterising of the discriminating spectral features of the species in question or true representation of training dataset for spectral library classification approach.
Spectral signatures from hyperspectral data enable us to identify the subtle differences in plant species better than multispectral datasets despite the common chemical composition within species (Cochrane, 2000; George et al., 2014). Therefore, in this study, using hyperspectral data, we analyse the effects of location and season on spectral characteristics of two commonly found, dominant, habitat forming seaweed species, Ecklonia radiata (C. Agardh) J. Agardh. and Carpophyllum maschalocarpum (Turner) Grev. in the Hauraki Gulf.
Materials and Methods
Seaweed Collection and Spectral Measurements
Seven individuals of each species, Ecklonia radiata and C. maschalocarpum, from each of four locations located approximately 10 km apart from Te Haruhi Bay (174°49′2′′E and 36°37′5′′S) north to Motuora Island (174°47′36.59′′E and 36°30′30.31′′S), Kawau Island (174°52′33.02′′E and 36°27′3.93′′S), and Takatu Point (174°51′59.89′′E and 36°22′12.18′′S) (Supplementary Figure 1) in Spring (6th October 2017), Autumn (6th April 2018), Winter (23rd June 2018) and Summer (11th December 2018) were collected. Seasons were chosen as December to February (summer), March to May (autumn), June to August (winter), September to November (spring). Spectral readings of seaweed individuals, taken out of water and placed on a black mat, were measured using ASD Handheld-2 field spectrometer with wavelength range of 325–1075 and 1 nm sampling interval. The spectrometer was held at 10 cm above the individuals looking at nadir and ten readings of each seaweed individual over blade and stipe were recorded. A number of calibration readings were taken depending on the cloud conditions using Spectralon® panel. Readings in each location were recorded within an hour of taking the samples out of water. Every effort was taken to collect the readings within 2 h of solar noon but some were collected beyond the range and the location description was recorded (Supplementary Table 1).
Data Analysis
Data Pre-processing
The spectral data set from seven individuals of each seaweed species from four seasons and four locations comprised: 1,120 readings for C. maschalocarpum, 1,119 readings for E. radiata, 350 numeric wavelengths of the reflectance values between 400 and 750 nm and the categorical variables “seaweed species”, “season” and “location”. There is a missing data point for E. radiata due to an erroneous reading. The wavelengths included those that lie within the water transmission window (450–550 nm; Kieleck et al., 2001) as well as the NIR region that show the greatest discrimination between species (Fyfe, 2003). The data was standardised using Standard Normal Variate (SNV) technique. SNV scaling was performed on the data across the columns for each row to remove multiplicative noise from each spectrum (Wehrens, 2011). It was performed by subtracting the mean of values at all wavelengths, for each spectral signature, from the reflectance values at each wavelength and dividing the difference by standard deviation of the spectrum (Kotta et al., 2014).
Qualitative Separation of Seaweed Species
Principal component analysis (PCA) was performed to qualitatively assess the separation between E. radiata and C. maschalocarpum. In case of good separation of the two species, the seaweeds were assessed for spatial and seasonal effect, separately. R statistical software package was used for the analysis (R Core Team, 2019).
Spatial and Seasonal Variability in Spectral Reflectance
Due to high dimensionality of the data, it was decomposed to few principal components (PCs) that encompassed the variation from influential wavelengths. This was implemented using PCA on the standardised data for the two seaweed species, separately. Principal component (PC) with most variance was chosen and the wavelengths that influenced this PC were selected based on the loading values using “factoextra” package in R software (Kassambara and Mundt, 2017). For each seaweed species, to identify significant difference in spectral reflectance across various locations and seasons, a linear mixed effect model was built with each contributing PC as response variable, location and season as fixed effects, and seaweed individuals as the random effect. The difference between the individuals due to any in-plant variation in each location and season was modelled by the random effect. Linear mixed model separates the variance due to random sampling from fixed effect (Zuur et al., 2009). The explanatory variables location, season and seaweed individuals were factor variables with four, four and seven levels, respectively. Full model was built including both location, season and the interaction between the two using maximum likelihood (ML) method which was compared against a model with a term dropped (Table 1). The best model was selected using Akaike Information Criterion (AIC) and rerun using the method Restricted Maximum Likelihood. “nlme” package in R was used for this analysis (Pinheiro et al., 2018). The final model prediction plot with +/−2 Standard deviations at 95% confidence interval was plotted using “AICcmodavg” package in R software (Mazerolle, 2019). The goodness-of-fit of the model was assessed using marginal and conditional R2 value suited for mixed model (Nakagawa et al., 2013) and implemented using “MuMIn” package in R software (Barton, 2018). Marginal R2 value explains the variance due to fixed effects, conditional R2 value explains the total variance due to fixed and random effects.
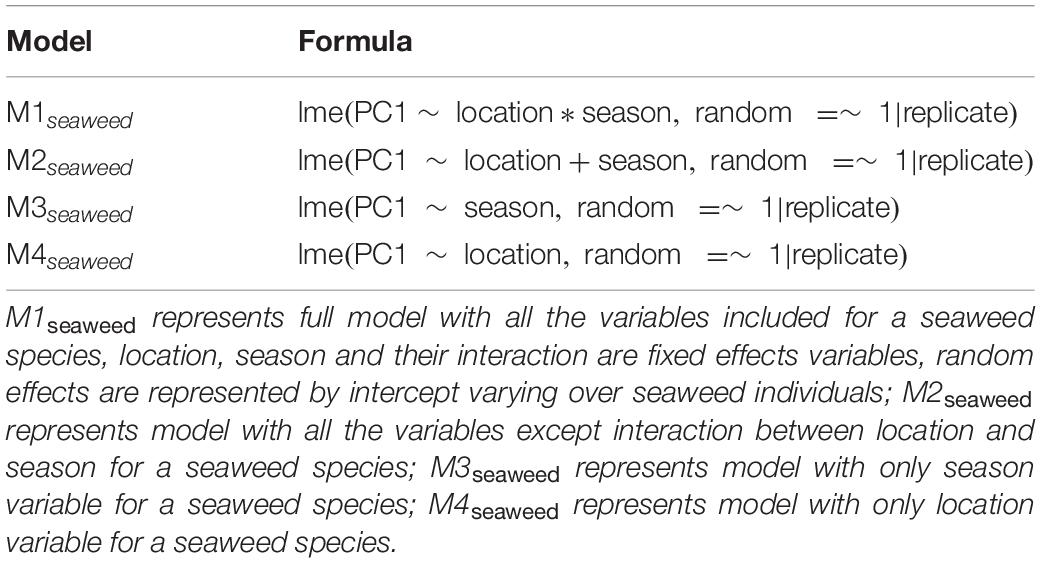
Table 1. Equations for the linear mixed effects model in R using nlme package used in this study.
Results
Data Pre-processing and PCA
Principal component analysis (PCA) on SNV data of the two seaweed species combined showed clear grouping of E. radiata and C. maschalocarpum with the maximum variance of 86.5% on first PC. The two seaweed species were separated (Figure 1) for further analysis of effect of location and season on spectral reflectance using linear mixed effects model.
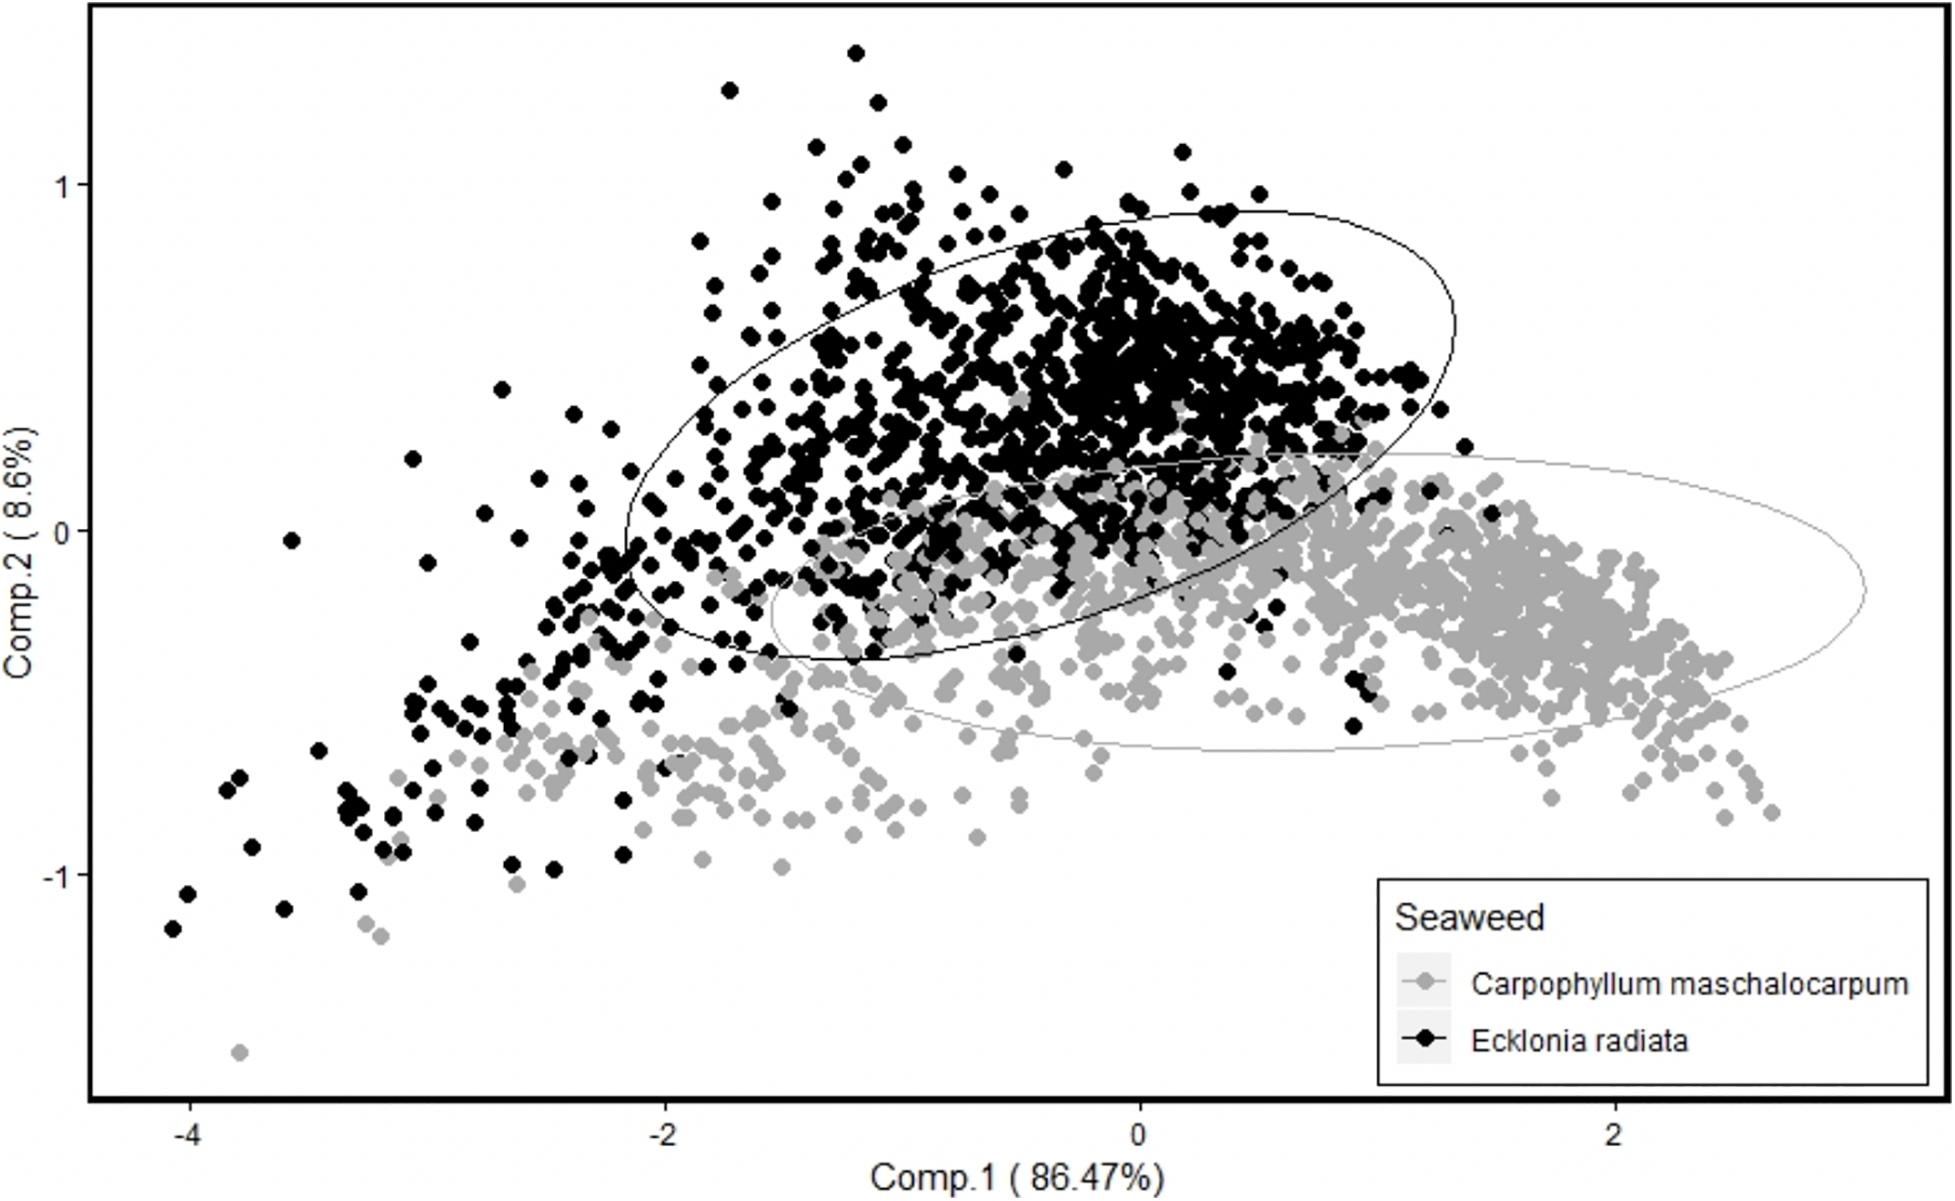
Figure 1. Principal component analysis of Ecklonia radiata and Carpophyllum maschalocarpum showing separation of the two seaweed species.
Spatial and Seasonal Variation on Spectral Reflectance of C. maschalocarpum Using Linear Mixed Modelling
Principal component analysis on standardised spectral data of C. maschalocarpum resulted in the maximum variance in first PC (93.4%).
Variables Contributing to PC1
Based on loading values, wavelengths that contributed to the variation in PC1 were 597–608, 693–718 and 733–750 nm. The spectral reflectance values of influential wavelengths between 733 and 750 nm were positively correlated to PC1 scores while that between 597–608 and 693–718 nm are negatively correlated and the latter has a higher magnitude.
Effect of Season and Location on PC1
The results of mixed effects modelling on PC1, using likelihood ratio test, showed that location, season and the interaction between them had significant effect on standardised spectral reflectance of C. maschalocarpum. Data is more likely under model M1C. maschalocarpum than it is under model M2C. maschalocarpum [L = 197.02 (df = 9, p < 0.001)] or model M3C. maschalocarpum [L = 1433.19 (df = 12, p < 0.001)] or model M4C. maschalocarpum [L = 423.77 (df = 12, p < 0.001)]. Model M1C. maschalocarpum performed well with lowest AIC and marginal and conditional R2 of 0.735 and 0.741, respectively (Table 2).

Table 2. Linear mixed model result.
Winter and spring affect spectral reflectance at wavelengths between 733 and750 nm but there was no significant difference between the two seasons at each location (Figure 2). However, in summer, spectral reflectance between 693 and 718 nm described C. maschalocarpum in Motuora Island and was significantly different compared to rest of the locations. The spectral reflectance between 597 and 608 nm described the seaweed in Autumn across all locations.
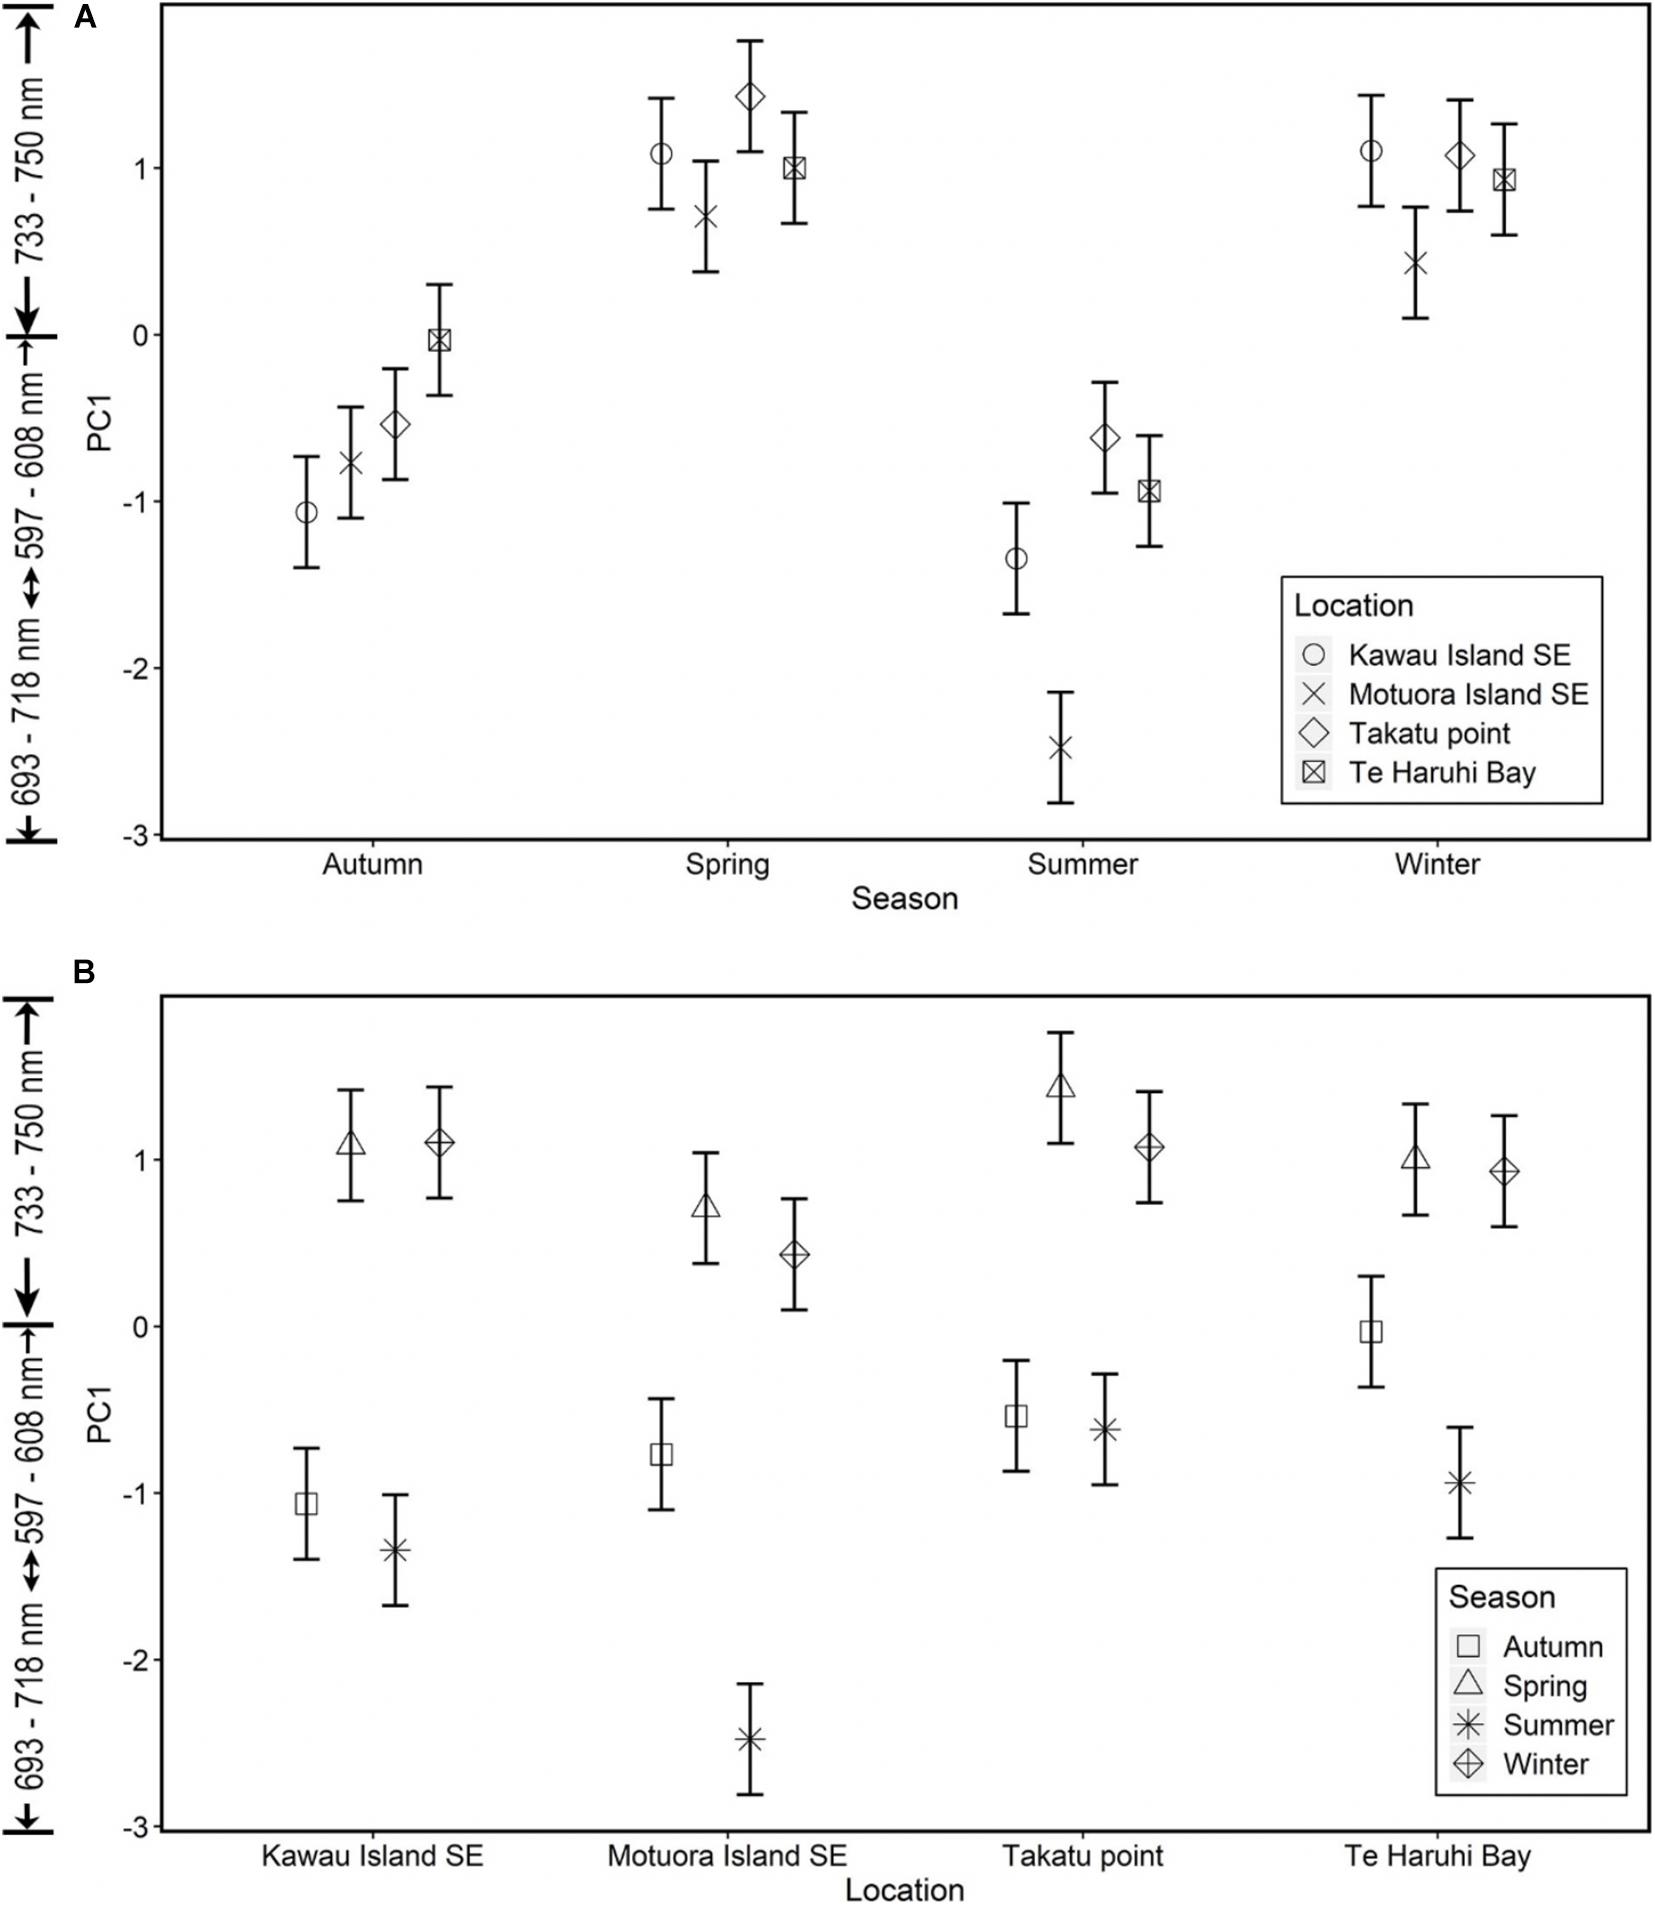
Figure 2. (A) Model predictions plot with two standard deviation (and 95% confidence interval) of PC1 for C. maschalocarpum in different locations within each season, X-axis represents seasons and Y-axis represents PC1 scores and the interpretation of wavelengths contributing to PC1 axis (B) Model predictions plot with two standard deviation (and 95% confidence interval) of PC1 for C. maschalocarpum in different seasons within each location, X-axis represents locations and Y-axis represents PC1 scores and the interpretation of wavelengths contributing to PC1 axis.
Spatial and Seasonal Variation on Spectral Reflectance of E. radiata Using Linear Mixed Modelling
Principal component analysis on standardised spectral data of E. radiata resulted in the maximum variance of 83.4% in first PC and variance of 9.3% in second PC.
Important Variables Contributing to Components PC1 and PC2
Based on loading values, wavelengths that contributed to the variation in PC1 were 572–613, 693–715 and 730–750 nm. The spectral reflectance values in wavelengths between 730 and 750 nm are positively correlated to PC1 scores while that between 572–613 and 693–715 nm are negatively correlated and the latter has a higher magnitude.
Effect of Season and Location on PC1
The results of mixed effects modelling on PC1, using likelihood ratio test, showed that location, season and the interaction between them had a significant effect on wavelengths that contributed to PC1. The test revealed that data is more likely under model M1E. radiata than it is under model M2E. radiata [L = 479.82 (df = 9, p < 0.001)] or model M3E. radiata [L = 616.35 (df = 12, p < 0.001)] or model M4E. radiata [L = 570.21 (df = 12, p < 0.001)]. Model M1E. radiata performed well with marginal and conditional R2 of 0.457 and 0.465, respectively (Table 2).
Autumn and spring had a similar effect pattern on the spectral reflectance values in wavelengths 572–613 nm in all locations (Supplementary Figure 4A). There was no seasonal effect on spectral reflectance values in wavelengths 730–750 nm that described the E. radiata in Kawau Island (Supplementary Figure 4B).
In summer, the wavelengths that described E. radiata in Motuora Island and Te Haruhi Bay were 693–715 nm and, in Kawau Island and Takatu point were 730–750 nm (Supplementary Figure 4A). Location does not have a significant effect on spectral reflectance of E. radiata in winter and the seaweed was described by wavelengths between 730 and 750 nm.
Discussion
This study provides the first detailed investigation into the influence of season and location on the spectral signatures of E. radiata and C. maschalocarpum and addresses the shortcomings of similar past research that did not account for natural variations (Kišević et al., 2011; Kotta et al., 2014). Season and location were expected to affect the spectral reflectance of the two commonly found New Zealand native seaweed species. This study has found that wavelength regions describing E. radiata and C. maschalocarpum varies with season within each location which is indicated by significant location and season interaction in the mixed effects modelling. The result of this study is consistent with other studies that account for temporal and spatial variation in terrestrial (Somers and Asner, 2014) and marine environments (Fyfe, 2003).
Season plays a larger role in influencing spectral reflectance of E. radiata compared to location. The wavelengths that describe E. radiata varies in summer but remains the same in winter (730–750 nm) across all locations (Supplementary Figure 5A). This indicates that lowest irradiance level is in winter and the subsequent increase in Chlorophyll-a pigment (Blain and Shears, 2019) levels remain the same across all locations. Photosynthetic pigments such as Chlorophyll-a and accessory pigments such as Chlorophyll-c and Fucoxanthin present in brown seaweeds such as E. radiata and C. maschalocarpum are responsible for the unique spectral signatures depending on the pigment concentration levels (Casal et al., 2012). Although it is reported that the wavelengths correlated to Chlorophyll-a are in green (550–560 nm) and red edge (680–750 nm) region, it is difficult to quantify the concentration levels of individual pigments remotely (Huang et al., 2015). In summer, the wavelengths that describe E. radiata in Motuora Island and Te Haruhi Bay is different to that in Takatu point and Kawau Island. This is likely due to the high irradiance levels in summer (Blain and Shears, 2019) and varying wave exposure levels in different locations, for example, sites in Te Haruhi Bay and Motuora Island are sheltered while that in Kawau Island and Takatu point are very exposed. Variations in the degree of water movement around plants among other factors influence photosynthesis (Hillman et al., 1989) and in turn affects the spectral response of seaweed.
There is a very different seasonal pattern exhibited in spectral data of C. maschalocarpum across all locations compared to E. radiata despite both species being collected from the same locations. C. maschalocarpum individuals were spectrally similar across all locations in winter and spring and was described by wavelengths 733–750 nm (Supplementary Figure 5B). This is likely due to the lower irradiance levels during those seasons and no chlorophyll production. However, in summer, the wavelengths (597–608 and 693–718 nm) that described C. maschalocarpum varied significantly from those in spring and winter (Supplementary Figure 6B). It is likely that expectedly high photosynthetic activity in summer may cause some variation in wavelengths describing C. maschalocarpum in different locations (Figure 2A). The spectral reflectance values of both seaweed species in summer are significantly different in Motuora Island compared to other locations (Figure 2B and Supplementary Figure 4B). In Motuora Island, spectral signatures of both seaweed species are represented by wavelengths 692–715 nm in summer. For E. radiata, the spectral signatures are not significantly different in all other season. Whereas, for C. maschalocarpum, spectral reflectances are not significantly different in spring and winter while that in autumn is significantly different from summer, spring and winter. This could be due to the nature of the site (Supplementary Table 1) enabling higher photosynthetic activity.
Multispectral and hyperspectral sensors have the capability of capturing high resolution (spatially and spectrally) data that could resolve individual seaweeds. Due to the nature of the water current and movement of seaweed underwater, it is important to understand the within plant spectral variation across various parts of the seaweed individual such as blade and stipe. This study accounts for that variation and has found very low spectral variation within each sample indicated by the minimal difference between marginal and conditional R2 values of mixed modelling for both species.
Detecting within species spectral variation due to factors such as season and location using remote sensing imaging sensors could be difficult. When combined with other factors such as water column properties, depth and turbidity, detecting these inherent within species differences could prove more difficult. Modelled spectral signatures have been used for distinguishing three seaweeds belonging to each broad taxon at different turbidity levels and depths (Vahtmäe et al., 2006), classifying seaweeds at a broad taxa level from hyperspectral images (Casal et al., 2013). However, spectral signatures from this study could be modelled for various water column properties using radiative transfer models or approached empirically for further research.
Data Availability Statement
The raw data supporting the conclusions of this article will be made available by the authors, without undue reservation.
Author Contributions
All authors listed have made a substantial, direct and intellectual contribution to the work, and approved it for publication.
Conflict of Interest
The authors declare that the research was conducted in the absence of any commercial or financial relationships that could be construed as a potential conflict of interest.
Supplementary Material
The Supplementary Material for this article can be found online at: https://www.frontiersin.org/articles/10.3389/fevo.2021.581852/full#supplementary-material
References
Abdullah, H., Skidmore, A. K., Darvishzadeh, R., Heurich, M., Pettorelli, N., and Disney, M. (2018). Sentinel-2 accurately maps green-attack stage of European spruce bark beetle (Ips typographus, L.) compared with Landsat-8. Remote Sens. Ecol. Conserv. 5, 87–106. doi: 10.1002/rse2.93
Benedetti-Cecchi, L., Pannacciulli, F., Bulleri, F., Moschella, P. S., Airoldi, L., Relini, G., et al. (2001). Predicting the consequences of anthropogenic disturbance: large-scale effects of loss of canopy algae on rocky shores. Mar. Ecol. Progress Ser. 214, 137–150. doi: 10.3354/meps214137
Blain, C. O., and Shears, N. T. (2019). Seasonal and spatial variation in photosynthetic response of the kelp Ecklonia radiata across a turbidity gradient. Photosynth. Res. 140, 21–38. doi: 10.1007/s11120-019-00636-7
Bue, B. D., Thompson, D. R., Sellar, R. G., Podest, E. V., Eastwood, M. L., Helmlinger, M. C., et al. (2015). Leveraging in-scene spectra for vegetation species discrimination with MESMA-MDA. ISPRS J. Photogramm. Remote Sens. 108, 33–48. doi: 10.1016/j.isprsjprs.2015.06.001
Casal, G., Domínguez-Gómez, J. A., Kutser, T., Freire, J., and Sánchez-Carnero, N. (2012). Assessment of AHS (airborne hyperspectral scanner) sensor to map macroalgal communities on the Ría de vigo and Ría de Aldán coast (NW Spain). Mar. Biol. 159, 1997–2013. doi: 10.1007/s00227-012-1987-5
Casal, G., Kutser, T., Domínguez-Gómez, J. A., Sánchez-Carnero, N., and Freire, J. (2013). Assessment of the hyperspectral sensor CASI-2 for macroalgal discrimination on the Ría de Vigo coast (NW Spain) using field spectroscopy and modelled spectral libraries. Cont. Shelf Res. 55, 129–140. doi: 10.1016/j.csr.2013.01.010
Clark, M. L., Roberts, D. A., and Clark, D. B. (2005). Hyperspectral discrimination of tropical rain forest tree species at leaf to crown scales. Remote Sens. Environ. 96, 375–398. doi: 10.1016/j.rse.2005.03.009
Cochrane, M. A. (2000). Using vegetation reflectance variability for species level classification of hyperspectral data. Int. J. Remote Sens. 21, 2075–2087. doi: 10.1080/01431160050021303
Fung, A., Hamid, N., and Lu, J. (2013). Fucoxanthin content and antioxidant properties of Undaria pinnatifida. Food Chem. 136, 1055–1062. doi: 10.1016/j.foodchem.2012.09.024
Fyfe, S. K. (2003). Spatial and temporal variation in spectral reflectance: are seagrass species spectrally distinct? Limnol. Oceanogr. 48, 464–479. doi: 10.4319/lo.2003.48.1_part_2.0464
George, R., Padalia, H., and Kushwaha, S. P. S. (2014). Forest tree species discrimination in western Himalaya using EO-1 Hyperion. Int. J. Appl. Earth Obs. Geoinf. 28, 140–149. doi: 10.1016/j.jag.2013.11.011
Hillman, K., Walker, D. I., Larkum, A. W. D., and McComb, A. J. (1989). “Productivity and nutrient limitation,” in Biology of Seagrasses : a Treatise on the Biology of Seagrasses with Special Reference to the Australian Region, eds A. W. D. Larkum, A. J. McComb, and S. A. Shephard (Amsterdam: Elsevier Science), 635–685.
Huang, J., Wei, C., Zhang, Y., Blackburn, G. A., Wang, X., Wei, C., et al. (2015). Meta-analysis of the detection of plant pigment concentrations using hyperspectral remotely sensed data. PLoS One 10:e0137029. doi: 10.1371/journal.pone.0137029
Kanemasu, E. T. (1974). Seasonal canopy reflectance patterns of wheat, sorghum, and soybean. Remote Sens. Environ. 3, 43–47. doi: 10.1016/0034-4257(74)90037-6
Kassambara, A., and Mundt, F. (2017). Factoextra: Extract and Visualize the Results of Multivariate Data Analyses.
Kelly, S., Sim-Smith, C., Faire, S., Pierre, J., and Hikuroa, D. (2014). State of our Gulf 2014 Hauraki Gulf - Tikapa Moana/Te Moananui a Toi State of the Environment Report 2014. Available online at: http://hdl.handle.net/2292/25449 (accessed 2018).
Kieleck, C., Lotrian, J., Bousquet, B., Le Brun, G., and Cariou, J. (2001). Laser induced fluorescence imaging: application to groups of macroalgae identification. J. Phys. D Appl. Phys. 34, 2561–2561. doi: 10.1088/0022-3727/34/16/324
Kišević, M., Smailbegović, A., Gray, K. T., Andričević, R., Craft, J. D., Petrov, V., et al. (2011). Spectral Reflectance Profile of Caulerpa Racemosa var. Cylindracea and Caulerpa Taxifolia in the Adriatic Sea. Available online at: http://www.scopus.com/inward/record.url?eid=2-s2.0-84255166982&partnerID=40&md5=ca21a813b84810c06bc48c86dbc6a294 (accessed 2017).
Kotta, J., Remm, K., Vahtmäe, E., Kutser, T., and Orav-Kotta, H. (2014). In-air spectral signatures of the Baltic Sea macrophytes and their statistical separability. J. Appl. Remote Sens. 8:083634. doi: 10.1117/1.jrs.8.083634
Nakagawa, S., Schielzeth, H., and O’Hara, R. B. (2013). A general and simple method for obtainingR2from generalized linear mixed-effects models. Methods Ecol. Evol. 4, 133–142. doi: 10.1111/j.2041-210x.2012.00261.x
O’Neill, J. D., Costa, M., and Sharma, T. (2011). Remote sensing of shallow coastal benthic substrates: in situ spectra and mapping of eelgrass (Zostera marina) in the gulf islands national park reserve of Canada. Remote Sens. 3, 975–1005. doi: 10.3390/rs3050975
Pinheiro, J., Bates, D., DebRoy, S., Sarkar, D., and Team, R. C. (2018). Nlme: Linear and Nonlinear Mixed Effects Models.
R Core Team (2019). R: A Language and Environment for Statistical Computing. Vienna: R Foundation for Statistical Computing.
Seers, B. M., and Shears, N. T. (2015). Spatio-temporal patterns in coastal turbidity – Long-term trends and drivers of variation across an estuarine-open coast gradient. Estuar. Coast. Shelf Sci. 154, 137–151. doi: 10.1016/j.ecss.2014.12.018
Silva, T. S. F., Melack, J. M., Novo, E. M. L. M., and Costa, M. P. F. (2008). Remote sensing of aquatic vegetation: theory and applications. Environ. Monit. Assess. 140, 131–145. doi: 10.1007/s10661-007-9855-3
Somers, B., and Asner, G. P. (2014). Tree species mapping in tropical forests using multi-temporal imaging spectroscopy: wavelength adaptive spectral mixture analysis. Int. J. Appl. Earth Obs. Geoinf. 31, 57–66. doi: 10.1016/j.jag.2014.02.006
Uhrin, A. V., and Townsend, P. A. (2016). Improved seagrass mapping using linear spectral unmixing of aerial photographs. Estuar. Coast. Shelf Sci. 171, 11–22. doi: 10.1016/j.ecss.2016.01.021
Vahtmäe, E., Kutser, T., Martin, G., and Kotta, J. (2006). Feasibility of hyperspectral remote sensing for mapping benthic macroalgal cover in turbid coastal waters—a Baltic Sea case study. Remote Sens. Environ. 101, 342–351. doi: 10.1016/j.rse.2006.01.009
Keywords: seaweed, spectral signature, season, location, Ecklonia, Carpophyllum
Citation: Selvaraj S, Case BS and White WL (2021) Effects of Location and Season on Seaweed Spectral Signatures. Front. Ecol. Evol. 9:581852. doi: 10.3389/fevo.2021.581852
Received: 10 July 2020; Accepted: 08 March 2021;
Published: 31 March 2021.
Edited by:
Qihao Weng, Indiana State University, United StatesReviewed by:
Eriita Jones, University of South Australia, AustraliaYanbo Huang, United States Department of Agriculture (USDA), United States
Manoj Gajanan Kulkarni, University of KwaZulu-Natal, South Africa
Copyright © 2021 Selvaraj, Case and White. This is an open-access article distributed under the terms of the Creative Commons Attribution License (CC BY). The use, distribution or reproduction in other forums is permitted, provided the original author(s) and the copyright owner(s) are credited and that the original publication in this journal is cited, in accordance with accepted academic practice. No use, distribution or reproduction is permitted which does not comply with these terms.
*Correspondence: W. Lindsey White, bGluZHNleS53aGl0ZUBhdXQuYWMubno=