 Francisco Garcia Bulle Bueno1*
 Bernardo Garcia Bulle Bueno2
 Gabriele Buchmann1Tim Heard1
 Tanya Latty3
 Benjamin P. Oldroyd1Anette E. Hosoi2
 Rosalyn Gloag1
- 1Behaviour, Ecology and Evolution Laboratory, School of Life and Environmental Sciences, University of Sydney, Sydney, NSW, Australia
- 2Institute of Data Systems and Society, Massachusetts Institute of Technology, Cambridge, MA, United States
- 3Insect Behaviour and Ecology Laboratory, School of Life and Environmental Sciences, University of Sydney, Sydney, NSW, Australia
Pollinator conservation is aided by knowledge of dispersal behavior, which shapes gene flow and population structure. In many bees, dispersal is thought to be male-biased, and males’ movements may be critical to maintaining gene flow in disturbed and fragmented habitats. Yet male bee movements are challenging to track directly and male dispersal ability remains poorly understood in most species. Here, we combine field manipulations and models to assess male dispersal ability in a stingless bee (Tetragonula carbonaria). We placed colonies with virgin queens at varying distances apart (1–48 km), genotyped the males that gathered at mating aggregations outside each colony, and used pairwise sibship assignment to determine the distribution of likely brothers across aggregations. We then compared simulations of male dispersal to our observed distributions and found best-fit models when males dispersed an average of 2–3 km (>2-fold female flight ranges), and maximum of 20 km (30-fold female flight ranges). Our data supports the view that male bee dispersal can facilitate gene flow over long-distances, and thus play a key role in bee populations’ resilience to habitat loss and fragmentation. In addition, we show that the number of families contributing to male aggregations can be used to estimate local stingless bee colony densities, allowing population monitoring of these important tropical pollinators.
Introduction
In many animals, offspring actively disperse away from their place of birth. Such dispersal allows an individual to access new resources, reduces competition for mates, and minimizes the risk of breeding with near relatives (Chaine and Clobert, 2012). How regularly and how far individuals disperse from natal sites also impacts a range of ecological and evolutionary processes at the population level. For example, local persistence, colonization ability, gene flow, and local adaptation are all shaped by the extent and direction of dispersal (Chaine and Clobert, 2012). These processes in turn are critical for predicting a species’ vulnerability to environmental change.
Bees (Anthophila) provide an essential service in natural and agricultural ecosystems by pollinating plants (Klein et al., 2006). Increasing threats to wild bee populations from habitat loss, degradation, and climate change have highlighted the need to better understand the factors that affect their population genetic structure, including dispersal (López-Uribe et al., 2019; Kelemen and Rehan, 2021). Natal dispersal in bees is thought to be commonly male-biased (Paxton, 2005). This bias has been inferred in a range of both solitary and social species on the basis of greater population structure in mitochondrial haplotypes (maternally inherited) than nuclear loci (López-Uribe et al., 2014; Francisco et al., 2017; Chapman et al., 2018; Santos et al., 2020), or greater coancestry of females than males sampled in the same locale (Ulrich et al., 2009; López-Uribe et al., 2015). Also, nesting habits in some bees favor female philopatry, while males (which do not contribute to parental care) are freer to disperse (Paxton, 2005). Thus male bees are assumed to have a central role in facilitating gene flow at both local and regional scales, with males credited for maintaining high genetic diversity in some bee populations despite disturbed or fragmented habitat (Ulrich et al., 2009; Francisco et al., 2017; Chapman et al., 2018). Yet the movements of male bees after leaving the natal nest are extremely challenging to track directly, and the extent of males’ dispersal potential remains unclear in the majority of bee species.
In this study, we combine field manipulations, genotyping and models to investigate male dispersal ability in a stingless bee. Stingless bees (Meliponini) are highly eusocial bees that form colonies typically comprising one queen and thousands of workers. They are among the most abundant pollinators in tropical and subtropical ecosystems across the globe, where they are known to visit the flowers of over 200 plant families (Grüter, 2020; Bueno et al., 2021). They are also economically important pollinators of tropical crops, with both wild and managed colonies providing crop pollination services (Grüter, 2020). The dispersal potential of stingless bee females (queens) is highly restricted by their mode of colony fission. Workers locate a new nest cavity and provision it over months before rearing a queen to occupy it (Vollet-Neto et al., 2018). New nests (and queens) must therefore be within a few hundred meters of the parent nest, as workers travel between them many times a day during the provisioning phase. Male dispersal potential, in contrast, is poorly understood. Stingless bee males leave the natal nest at maturity and never return (Vollet-Neto et al., 2018). Researchers typically only observe them again when they congregate to mate outside colonies that contain virgin queens. In several species, males have been confirmed to travel distances at least similar to worker flight ranges, before joining mating aggregations (e.g., 100 m–2 km; Carvalho-Zilse and Kerr, 2004; dos Santos et al., 2016b). Indirect evidence, however, hints that they may be capable of dispersing much further. Male aggregations can contain dozens to hundreds of unrelated individuals (Kraus et al., 2008; dos Santos et al., 2016a), suggesting that males are drawn from a large catchment area. Furthermore, some populations of Neotropical stingless bees show low nuclear genetic differentiation across ranges of 200–500 km, consistent with significant male-mediated gene flow (Jaffé et al., 2016).
Male dispersal distances inform the conservation and management of wild stingless bee populations in at least two ways. First, their vulnerability to habitat fragmentation or degradation depends in part on their natal dispersal ability (Brosi et al., 2008). Inbreeding costs are high in hymenopteran insects, including bees, due to their genetic system of sex determination (Heimpel and de Boer, 2008). Under this system, males are haploid (develop from unfertilized eggs) and females are diploid (develop from fertilized eggs) but homozygosity at one or a few critical “sex loci” will cause diploid embryos to develop as infertile or subfertile diploid males. High levels of inbreeding and diploid male production can thus lead small populations to spiral into extinction (Zayed and Packer, 2005). Social Hymenoptera may be further vulnerable to such processes, on account of their low effective population sizes relative to non-social species (Romiguier et al., 2014). Given the restrictions on female dispersal in stingless bees, the extent to which fragmentation disrupts gene flow, and thus increases inbreeding risk, depends on the likelihood of males dispersing between fragments.
Second, male dispersal distance predicts the catchment area that is being sampled around the site of a male aggregation, and thus allows estimates of local colony density and population size (Utaipanon et al., 2019). The colonies of cavity-nesting eusocial bees are cryptic and often high in the canopy, making them extremely challenging to survey by traditional means. This problem has been overcome in the western honey bee (Apis mellifera) via a protocol that exploits male bees’ reproductive biology (Baudry et al., 1998). If the typical distance that males travel from their natal nests to an aggregation is known, then males at an aggregation can be collected, genotyped, assigned to colonies, and used to estimate the number of colonies in the catchment area. This method has been deployed effectively to monitor changes in wild honey bee populations and identify local population declines (Jaffé et al., 2010; Hinson et al., 2015). A similar approach may be viable for stingless bees provided that, for a given species, we know both the typical male dispersal distance, and how to reliably attract males to a desired sampling site.
Our investigation used the Australian stingless bee Tetragonula carbonaria. This species occurs across tropical and subtropical East-Coast Australia and can be propagated in hives (Heard, 2016). Both males and workers are 4–5 mm in length and the maximum foraging range for workers (and thus natal dispersal of queens) has been estimated at 700 m (Smith et al., 2017). To determine typical and maximum male dispersal distances, we positioned colonies at target sites, manipulated them into attracting male aggregations, genotyped the males that arrived and identified brothers based on genotype. We then considered the distances between aggregations from which brothers were collected and simulated the dispersal distribution that was most likely to produce our observed sibship dataset. We also assessed male’s per-day flight capability via mark-and-recapture of males trapped at mating aggregations. Finally, we estimated local colony densities for select sites based on the number of colonies contributing males to an aggregation. In all, we asked three questions: (1) Do males tend to disperse further than females? (2) What is the average and maximum dispersal distance of males? (values that determine gene flow patterns and the impact of habitat fragmentation), and (3) Can male aggregations be used to provide estimates of local colony density?
Materials and Methods
Sampling and Genotyping of Males at Aggregations
We made three sets of collections of T. carbonaria males from mating aggregations: Set 1 (three sites spanning 15 km; Sunshine Coast, 26.6500°S, 153.0667°E, September 2017), Set 2 (seven sites spanning 23 km; Sydney, 33.7416°S, 151.1520°E, October–December 2017) and Set 3 (13 sites spanning 48 km, Greater Sydney, 33.7416°S, 151.1520°E, October–December 2018; Figures 1A–C; site details in Supplementary Table 1).
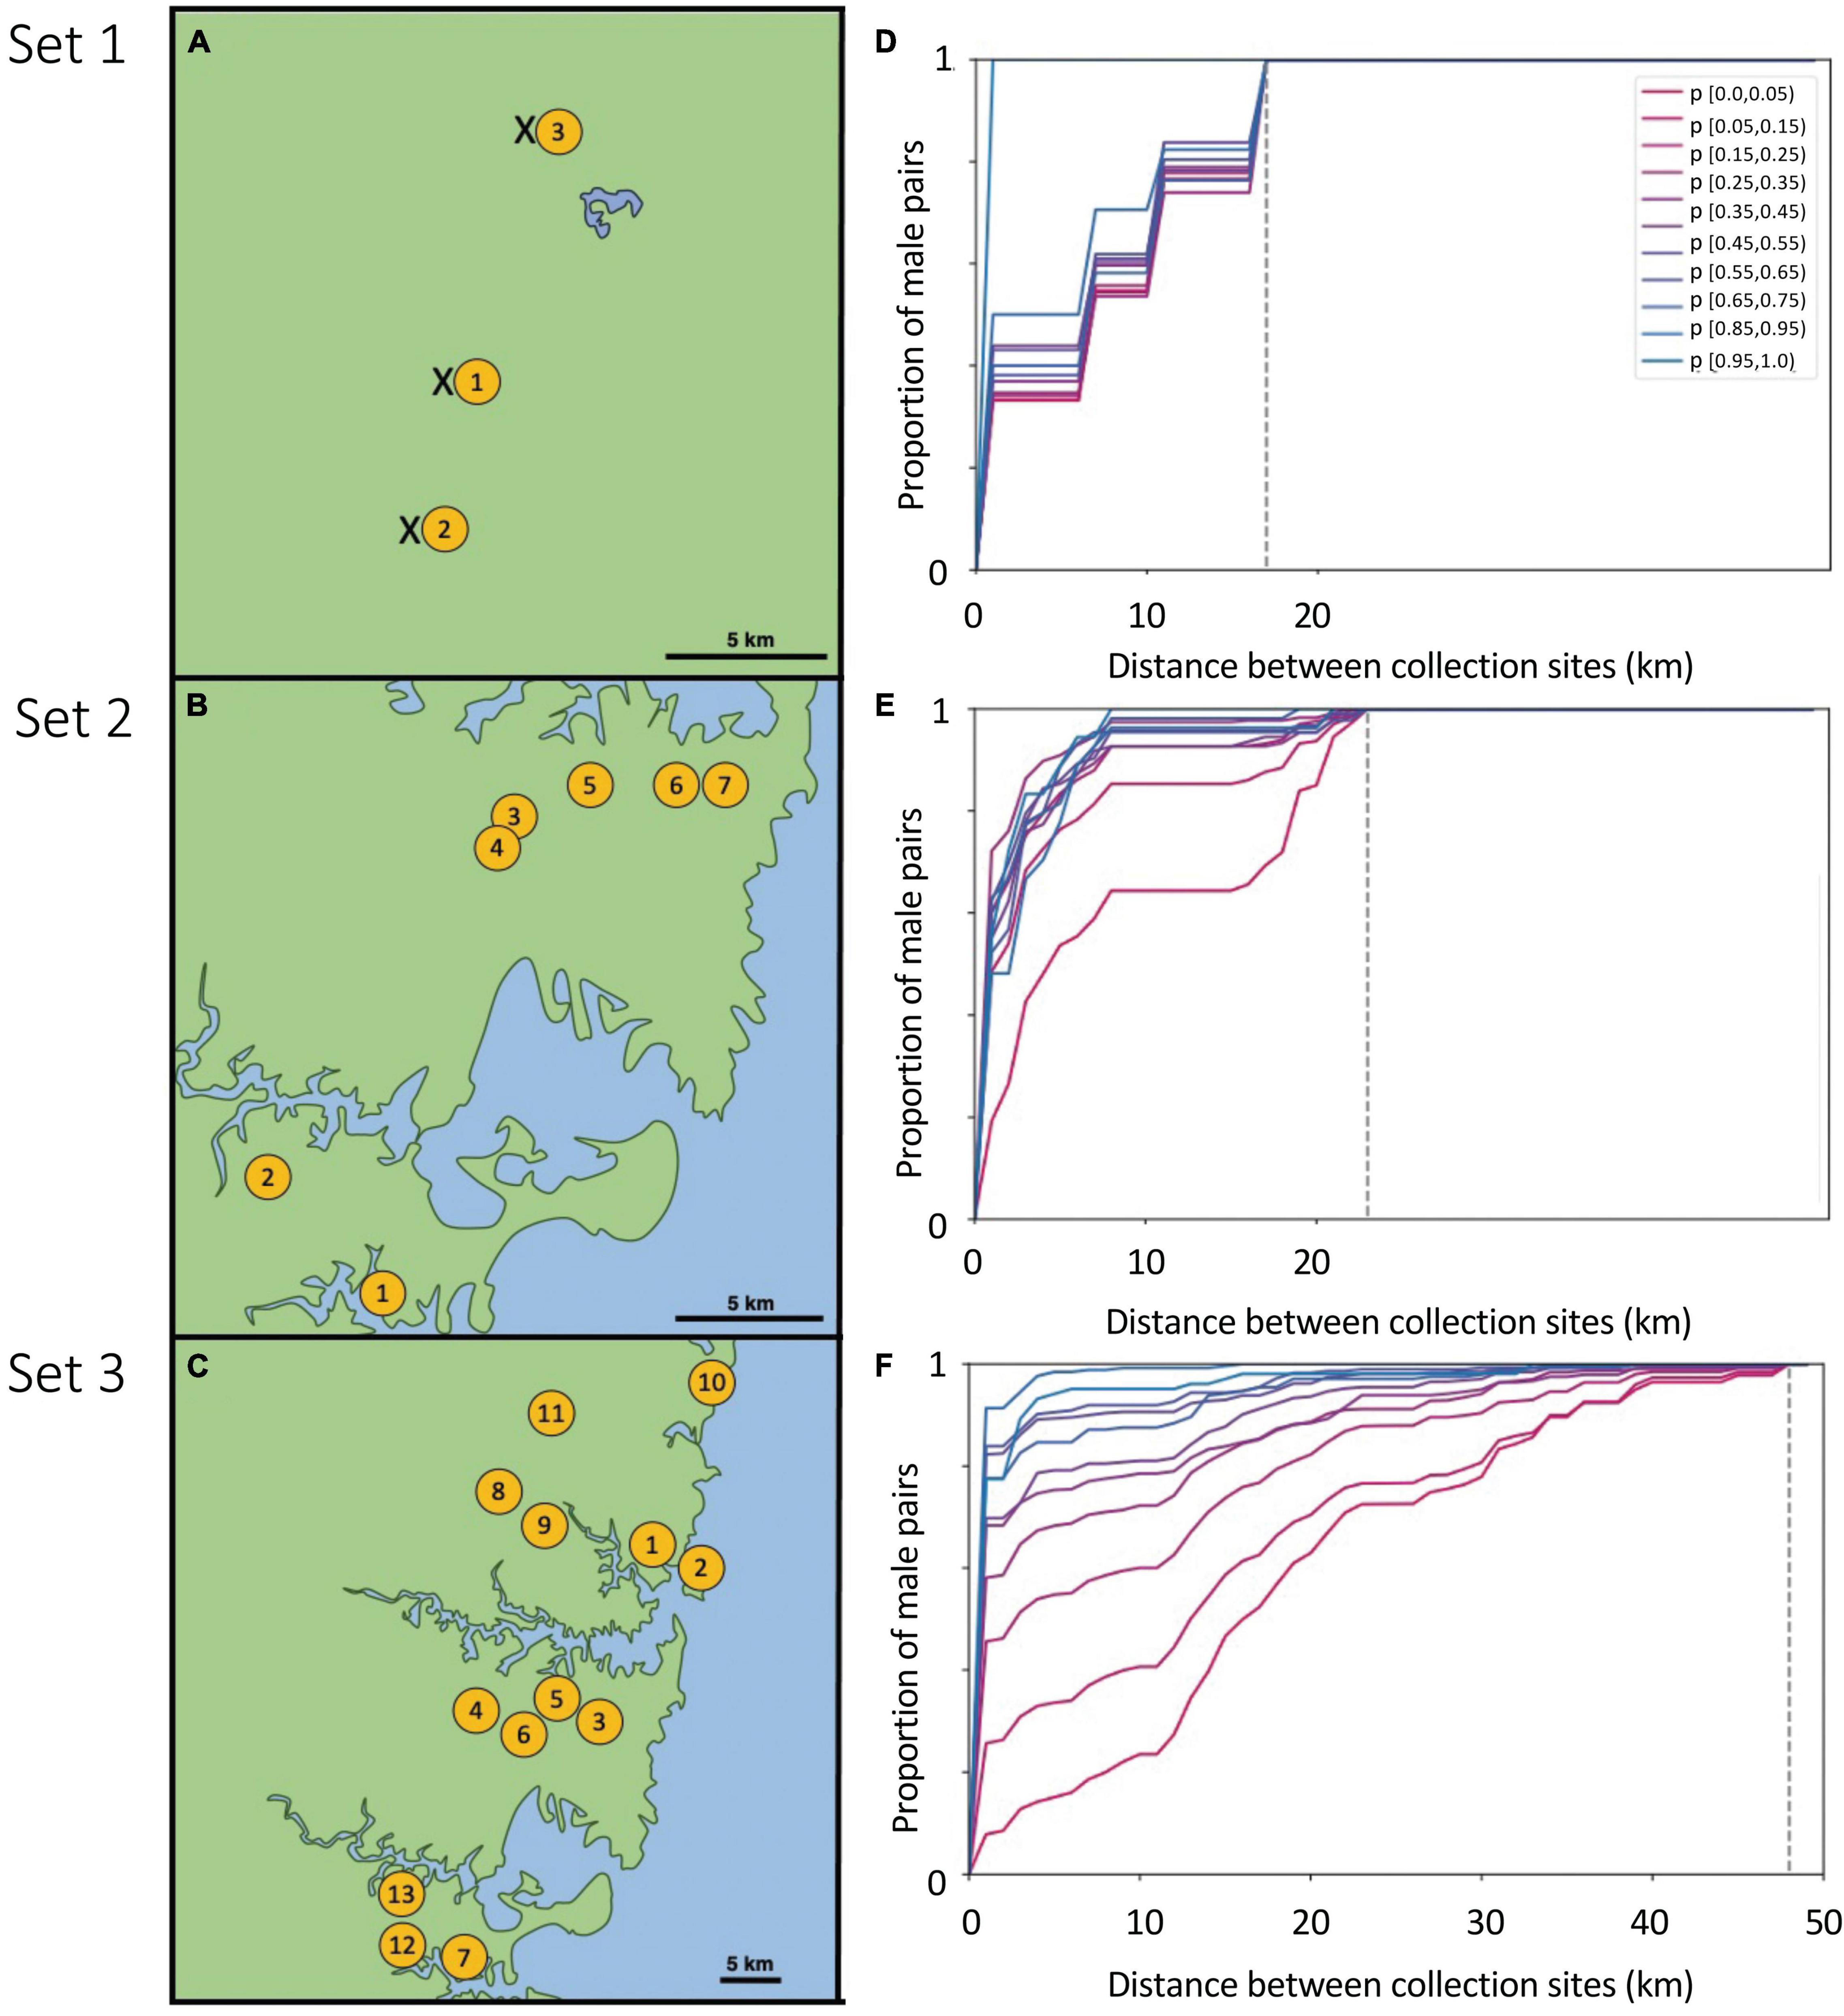
Figure 1. Left: Sites (yellow circles) at which T. carbonaria male aggregations were successfully attracted using “bait” re-queening colonies in hives for each of three sample sets: (A) Set 1 (Sunshine Coast), (B) Set 2 (Sydney), (C) Set 3 (Greater Sydney). In Set 1, we also sampled from hived colonies at each site (“x”). Right: The cumulative distribution plots of the distance between pairs of males binned by their probability of sibship (p), for males collected in each of the three Sets 1–3 (D–F). High p-values for sibship (blue) indicate pairs of males that are likely to be brothers, while low p-values (pink) indicate pairs of males that are not related. Distances of zero indicate pairs of males in the same aggregation, while distances > 0 indicate males were sampled from different aggregations at that distance (km). Dotted lines indicate the maximum possible distance separating male pairs for each Set (i.e., the distance spanning the two furthest apart aggregations sampled in that set; 15, 23, and 48 km for sets 1–3, respectively). These cumulative distribution plots served as the observed data against which our simulated sibship data was compared, to estimate best-fit male dispersal distributions.
We lured males to our collection sites using a hive propagation technique, whereby a single colony that is established inside two half-boxes is split to produce two hives, each with a new empty half-box (Heard, 2016). Following these splits, one hive retains the original queen, while the other is forced to requeen. To identify requeening hives, we placed perspex lids over newly divided colonies and observed colony activity until a virgin queen was spotted. Stingless bee colonies rear a constant supply of virgin queens which are on-hand to inherit the colony if required, and evicted or executed if not (Grüter, 2020). We kept hive entrances plugged during this period to ensure that virgin queens could not leave the hive to mate. We then positioned these “bait colonies” at our sampling sites and monitored them daily for 2 weeks.
T. carbonaria males form aerial aggregations close to requeening colonies (Heard, 2016). Workers also sometimes swarm outside colonies as part of colony defense (Gloag et al., 2008). However, we found that the sex of swarming individuals could be discriminated in the field with the naked eye by focusing on the facial characteristics of the bees, with males having larger eyes and smaller mandibles than workers (Figure 2A). We collected and genotyped at least 200 males for large aggregations, and every available male for smaller aggregations (mean: 203 ± 132 males per aggregation; Supplementary Table 1). As the reliability of attracting males to bait colonies is key to understanding their utility as a tool for inferring population density, we also assessed the effect of temperature and hive manipulation on the probability of male swarms forming (Supplementary Table 1). For all bait colonies, we collected 20 workers prior to hive-splitting, which we used to infer the colony’s maternal genotype and thus assess whether males aggregate in front of their natal nest. Additionally, for Set 1 samples only, we also sampled 10 workers per colony from 76 known managed colonies in the area, in an effort to estimate the distances travel by males from their natal nest by matching the genotypes of males collected at mating aggregations to the genotypes of known local colonies. All samples were preserved in 99% ethanol in the field and stored at −20°C until DNA extraction.
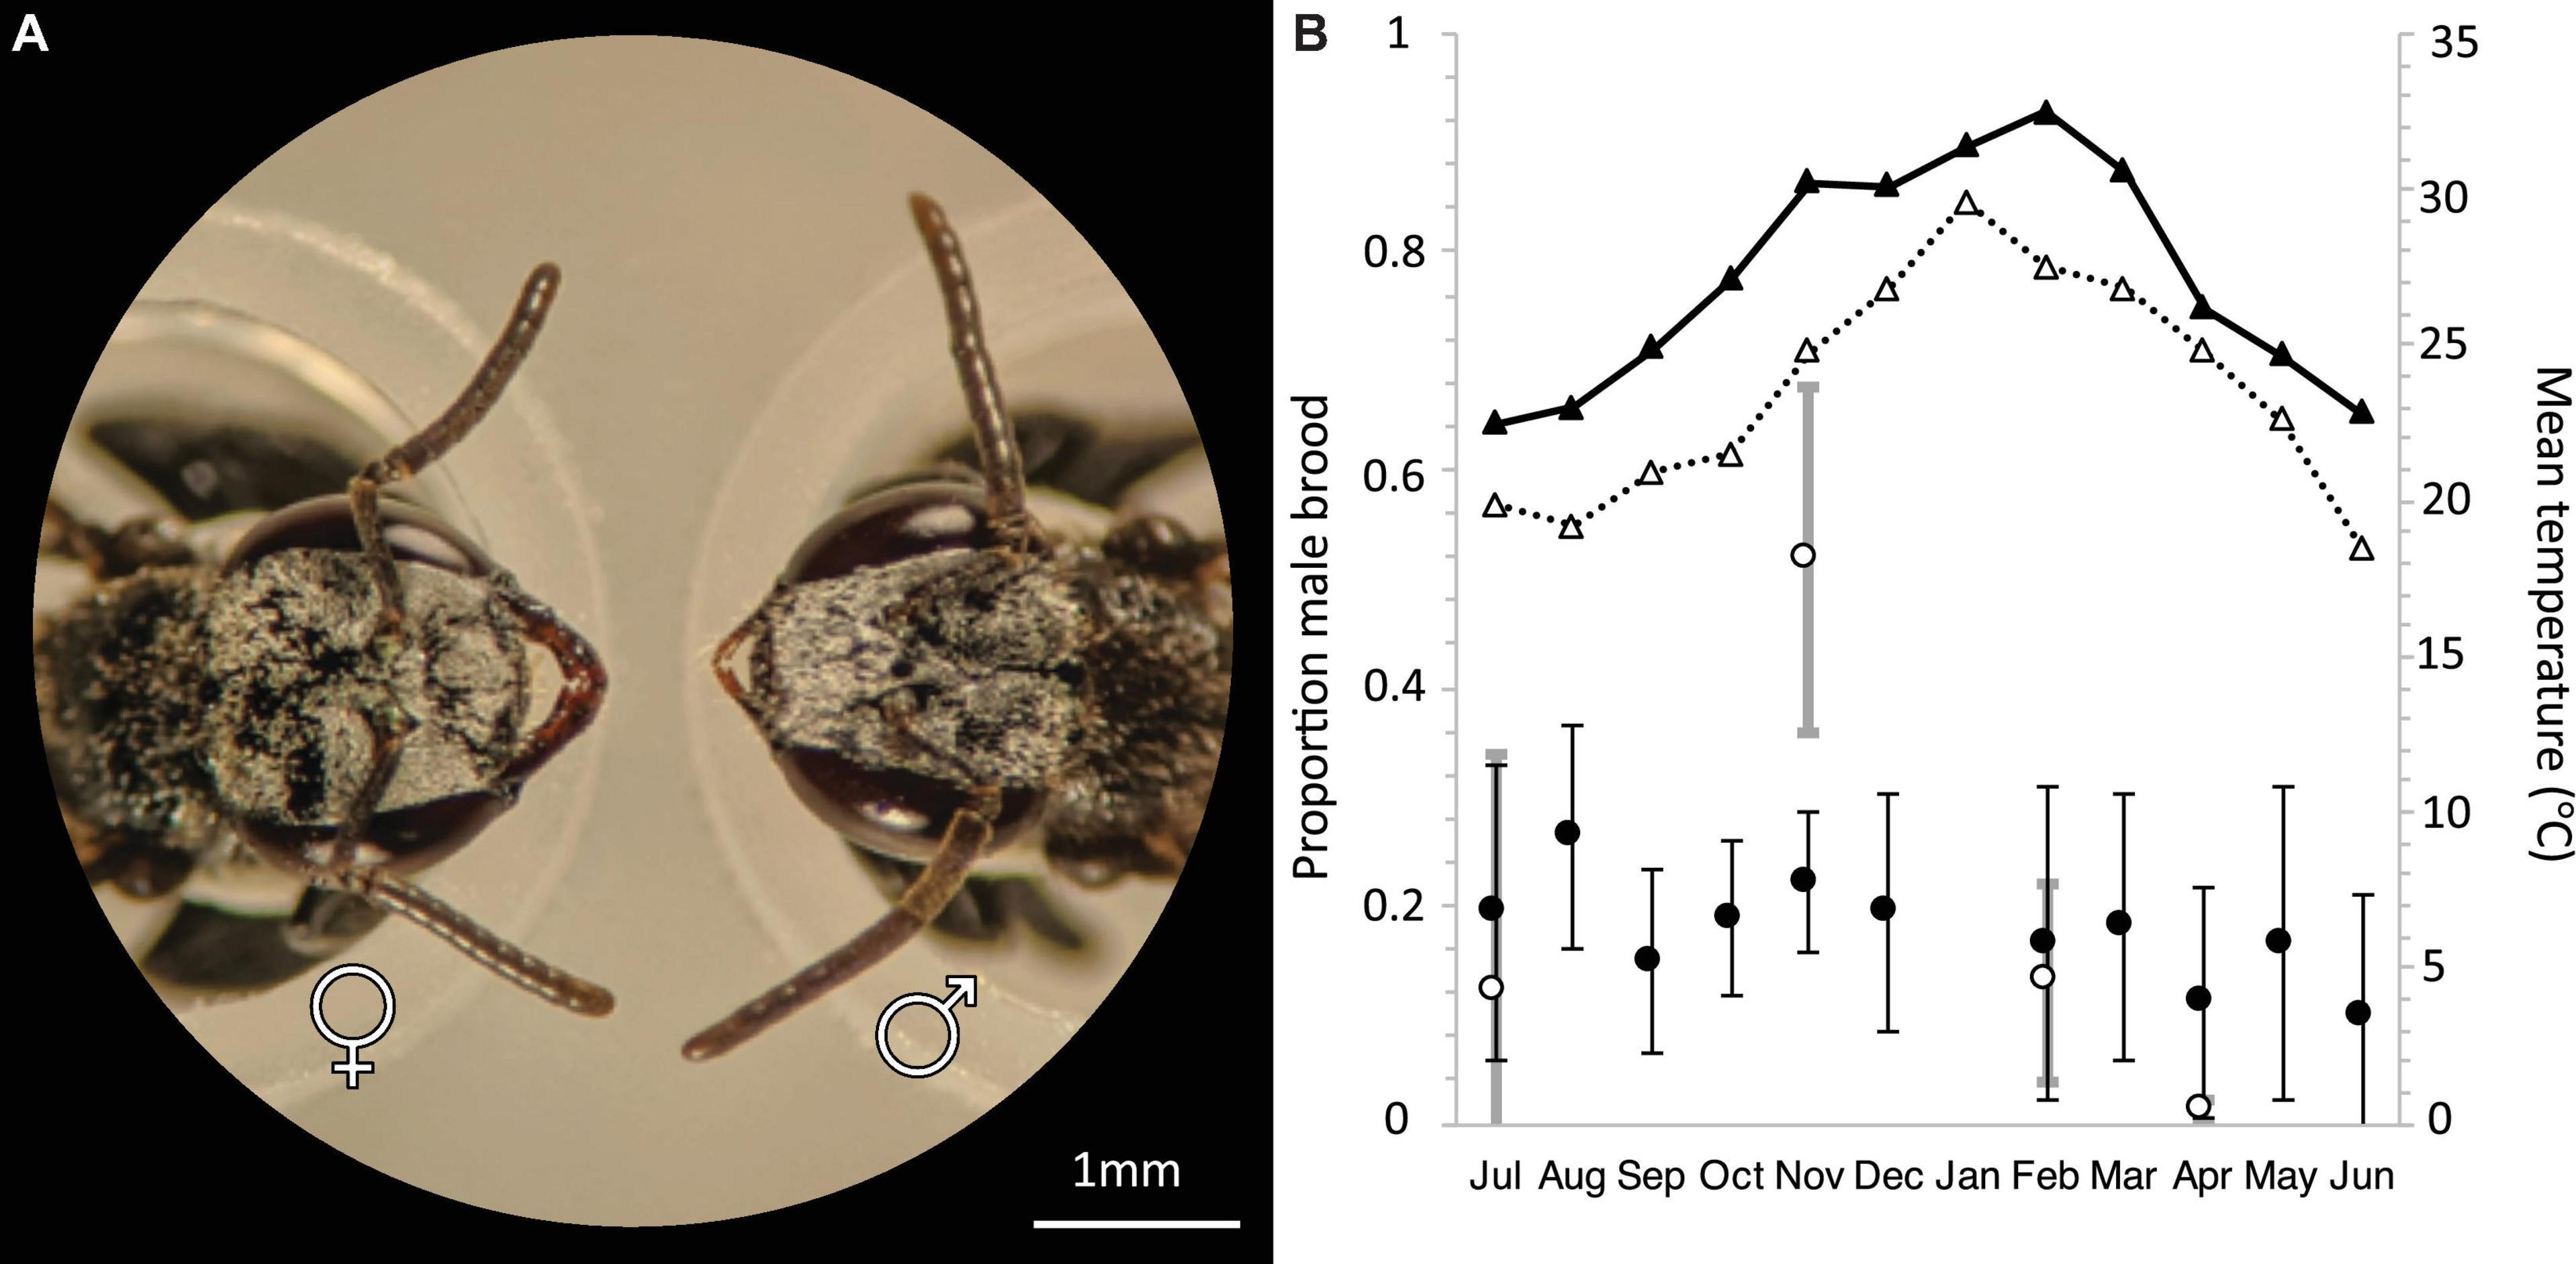
Figure 2. (A) Head morphology of female (left) and male (right) T. carbonaria. Females have 9 antennal segments and large mandibles. Males have 10 antennal segments and small mandibles (scale bar: 1 mm). (B) Annual average male brood investment per month for T. carbonaria in Southern Queensland (black circles, n = 4 colonies per month, 2016–2017) and Sydney (white circles, n = 4 colonies per month, 2018–2019). Triangles represent the Maximum Temperature Mean in Brisbane (black) and Sydney (white) based on data from the Bureau of Meteorology, Australia.
We extracted DNA by grinding whole abdomens in 5% Chelex solution (1 mM Tris HCl pH 7.6, 0.1 mM EDTA pH 8) and boiling for 15 min (Walsh et al., 1991). Supernatant containing DNA was diluted 1:1 with distilled water prior to PCR amplification. We genotyped each bee at seven microsatellite loci: Tc3. 155, Tc4. 63, Tc3. 302, Tc7. 13, and Tc4. 287 (Green et al., 2001) and Tang60 and Tang70 (Brito et al., 2009). Primers were fluorescently labeled with one of four dyes (FAM, NED, PET, VIC; Sigma-Aldrich, United States). PCR amplifications were performed according to Green et al. (2001) and the resulting products were analyzed using a 3130xl Genetic Analyzer and Genemapper V5 (Applied Biosystems, United States).
Composition of Male Aggregations
We used COLONY V2.0.6.4 (Wang, 2004) to estimate the number of colonies contributing males to each aggregation. COLONY uses population allele frequencies to estimate the likelihood of relatedness among individuals and assign them to families. T. carbonaria workers cannot lay eggs (Bueno et al., 2020), thus all males produced by a colony are the queen’s sons. We input population allele frequencies based on the full sample of males for each collection set. We then took the number of families per swarm to be the number of families COLONY output with an (inclusive) probability of more than 0.95 that all individuals were siblings. To estimate what proportion of total families were typically detected from a sample of 200 males, we genotyped additional males for three large aggregations sampled in Set 1 (507 ± 28 males). The cumulative distributions of estimated family number for these aggregations indicated that 200 males captured around 85% of the families contributing to large swarms (Supplementary Figure 3).
Estimated Mean and Maximum Male Dispersal Distances
In Set 1, we aimed to assess male flight behavior across distances of 5–15 km by matching males sampled from three aggregations to the genotypes of colonies kept at the same sites (8–56 colonies per site; Figure 1A). While this strategy confirmed that males can travel such distances, the proportion of males in aggregations that matched our “supplier” colonies was extremely low (<2%). To make better use of the data from all males sampled in an aggregation, we therefore took a different approach in Sets 2 and 3 whereby we: (i) calculated the pairwise probability that any two males sampled at mating aggregations were brothers, (ii) determined the distribution of likely brothers across all aggregations, and (iii) compared this distribution to simulated distributions under different assumptions of mean dispersal distance. A full description of this approach is in Supplementary Material, and the key aspects are given below. Model and simulations were run in Python (Sanner, 1999).
Pairwise Sibship Probability
We used a Bayesian model to estimate the probability that two males were brothers, based on their genotypes and the population allele frequencies. This approach is “family-blind,” as the probability of sibship of two males is not affected by their respective probabilities of sibship with any other male. It is therefore more suitable for estimating the pairwise sibship likelihood than COLONY’s family assignments. Under this model, for any pair of males, the rarer the shared alleles at a given locus, the higher the probability that they are brothers. We computed the pairwise sibship probabilities under scenarios in which the total number of colonies (S) contributing to our sample set ranged from low to high; that is, scenarios in which the prior probability that any given pair are siblings ranged from high to low. The selection of the range of priors was adjusted according to our sample size for each set (Set 1: S = 193, 300, 538, Set 2: S = 200, 380, 475, 570; Set 3: S = 450, 600, 750).
Distribution of Brother Pairs Across Aggregations
We next assessed the relationship between the probability of sibship of each pair of males and the physical distance (km) separating the aggregations in which they were sampled. If we found that sibship probability did not vary by distance in our sample sets, then males must disperse over distances at least as large as our sample area. In contrast, if males with high sibship probabilities were only ever sampled from the same aggregation site, then males must not disperse far from their natal nests. To visualize this relationship between sibship probability and distance, we plotted the cumulative distance flown by pairs of males, with pairs binned by their probability of sibship (Figures 1D–F). These cumulative distribution plots indicated that actual male dispersal was somewhere in-between the two extremes described above, and therefore that our scale of sampling would be informative. That is, pairs with a high probability of sibship were more likely to be collected from nearby sites than pairs with a low probability of sibship, yet sometimes likely brothers (i.e., sibship probabilities > 0.95) were found at distant aggregations. These cumulative distribution plots (one per set) served as the “observed data” against which our simulations were compared. As an additional check, we also assessed distances between males with identical genotypes (i.e., a highly conservative set of brothers), which gave similar results to our simulations (Supplementary Figure 4).
Simulated Data vs. Observed Data
Finally, we simulated the distribution of males by sibship across aggregations for different distributions of male dispersal distances, and assessed which simulations gave results most similar to our observed data. Each simulation generated male-producing colonies at random locations within a virtual catchment area matching our actual study area and sample sites (Supplementary Figure 1). Each simulated colony was randomly assigned a diploid queen genotype based on population allele frequencies (and thus haploid male genotypes for the queen’s sons). Males from each colony dispersed in uniform directions from their natal colony at distances according to:
Where x = metresflown and λ = 1/mean dispersal distance. By using an exponential distribution, we assume that the probability of a male surviving to fly an additional unit of distance is fixed, regardless of how far they have already flown.
In the simulation, any male that was within M meters of a collection site was added to that collection in the simulation (Supplementary Figure 2). This process continued until the total number of colonies contributing to the virtual sample set was equal to the number of total colonies used to calculate sibship probability (S). We ran 100 simulations for each of 30 distributions, where mean dispersal distances of the distributions varied from 100 to 5,200 m, and for each prior (S). We then assessed the fit between simulations and our observed data by comparing the average areas between the curves in the cumulative distribution plot of sibship by distance. That is, we measured the area between the curves of both distributions (simulated vs. observed), across each bin of sibship probability, and then looked for the simulation parameters that minimized the difference in these areas. A key advantage of this measure was that it utilized the empirical data from across the full range of sibship values.
Male Flight Distance Per Day
To support our estimates of male dispersal distances based on sibship probabilities, we performed four mark-recapture experiments (Sydney; April and December 2018, October and November 2019). In each case, we collected males from one or more aggregations and painted dots on their thoraxes using Posca paint pens. We kept marked males overnight in plastic containers and fed them 50% sugar solution. We then released them at 9 AM the following morning at known distances from a different target male aggregation to the one they were collected at: 1 km away (n = 5 releases), 1.5–2.5 km away (n = 3 releases), 3–4.5 km (n = 2 releases); (1,522 ± 492 males marked per release). In each release, males were color-coded into two batches, with batches released in opposite compass directions from the target aggregation. We then collected samples at the target aggregation 24, 36, and 48 h after release and counted the number of marked males we recaptured (Supplementary Table 2).
Mark-recapture experiments with small insects over large distances are challenging. In the case of stingless bees, if marked males radiate out equally in all directions from the point of release, and must travel within at least 100 m of a mating aggregation in order to detect it, then we would predict just one male per 2,500 to arrive at a target aggregation positioned 4 km from the release site (given that the circumference of a circle with radius 4 km is 25,000 km). We therefore expected to recapture only a tiny fraction of released males. Nevertheless, any successful recaptures provide an important validation for estimates based on models, by confirming that males can cover substantial distances daily.
Estimating the Density of Colonies in a Region
We used the estimates of typical male dispersal distance generated by our simulations to estimate the density of T. carbonaria colonies in the two broad regions where we sampled mating aggregations (Sunshine Coast: Set 1 and Sydney: Sets 2 and 3). We calculated colony density as:
Where Nf is the average number of families represented per aggregation, as calculated by COLONY (for all aggregations N > 180), and r is the mean dispersal distance of males. That is, aggregating males are drawn from a catchment area around the aggregation of radius r.
For one aggregation sampled in Sydney, we were able to check our estimate against a known density of managed colonies. Sydney’s Kuringai Council runs a T. carbonaria breeding program that allocates hives to residents of the area, and in 2019 maintained 700 colonies across an 86 km2 area, or 8 colonies/km2 (Kuringai Council). We validated our estimate of colony density against this known minimum density of colonies.
Colony Investment in Male Production
The use of males from mating aggregations to estimate the density of colonies in an area assumes that, at the time of sampling, most or all colonies in an area are producing males and thus have the potential to be detected in the male population. To test this assumption, we determined the variability in male production between T. carbonaria colonies throughout the year. We sampled 100 pupal brood cells per colony from four colonies per month in South-East Queensland (27.4698°S, 153.0251°E) (July 2016–June 2017, excluding January). We uncapped brood cells and sexed pupae based on facial morphology. To determine whether the higher seasonality in southern parts of their distribution affected the variability of male production, we also sampled between 4 and 6 colonies per month in winter (July 2018, n = 4), spring (November 2018, n = 6), summer (February 2019, n = 4), and autumn (April/May 2019, n = 5) from Sydney (33.7416°S, 151.1520°E). Both Sydney and South-East Queensland have humid subtropical climates, but the annual mean temperature of Sydney is lower (min 13.8- max 21.8) than South-East Queensland (min 15.9–25.5) (Australian Bureau of Meteorology).
Results
Attracting Male Aggregations Using Bait Colonies
We attracted a total of 31 male aggregations from 41 attempts with bait colonies (colonies with a virgin queen; Set 1 = 3, Set 2 = 13, and Set 3 = 15 colonies; total males sampled across all aggregations = 4,922). On average, aggregations formed 4 days after unplugging the entrance of the bait hive (range 1–11 days, SE = 3). The aggregations persisted anywhere from 2 days to more than 2 weeks, often even after the colony’s new queen became visibly physogastric and thus had already mated. The remaining 10 bait colonies failed to attract visible male aggregations within the 2-week observation period, but five were later confirmed to have nevertheless re-queened during this period. Thus, queens sometimes locate a mate despite the absence of a conspicuous male aggregation.
Composition of Male Aggregations
Male aggregations comprised males from an average of 80 colonies (COLONY family assignment, 49 ± 20 families per 100 males sampled), indicating either the catchment area for males is large (i.e., large male dispersal distances), the density of colonies in the study area is high, or both. Most male aggregations contained few or no males with genotypes matching the bait colony attracting the aggregation (4 ± 2%, n = 28), consistent with T. carbonaria males dispersing away from their natal nest even if it has a virgin queen. However, three aggregations were outliers in this respect, with 28–39% of male genotypes matching the bait colony itself; these aggregations were also small in size (N = 12, N = 124, N = 83).
Male Dispersal Distance
Brothers (defined as males with pairwise sibship probabilities > 0.95) were frequently detected in the same aggregation (n = 47 pairs), but also in different aggregations ranging from 1 to 33 km apart (n = 32 pairs, Figures 1D–F). Where brothers occurred in different aggregations, they were most commonly adjacent ones, with fewer at greater distances (<2 km apart, n = 53 brother pairs; 2–5 km, n = 20; 5–7 km, n = 2; 7–10 km, n = 1; 10–20 km, n = 2; > 20 km, n = 1). A similar trend was observed if the definition of brothers was relaxed to include all males with sibship probabilities > 0.85 (<2 km apart, n = 144 pairs; 2–5 km, n = 35 pairs; 5–7 km n = 7 pairs; 7–10 km, n = 3; 10–20 km, n = 5; > 20 km, N = 1), or if we defined brothers only as the subset of males with identical genotypes (same aggregation, n = 232; aggregations 1–7 km apart, n = 18 pairs; aggregations > 7 km apart, n = 2 pairs; Supplementary Figure 4). None of these cases of dispersed brothers could be accounted for by our own colony movements (i.e., brother pairs in different aggregations did not match the genotypes of colonies we relocated), and it is unlikely that the chance movements of pet hives by other people could produce the observed trend of steadily decreasing male sibship probability with distance. Furthermore, consistent with our observed distribution of brothers among the male aggregations of all sets, a small proportion of total males sampled at aggregations in Set 1 (1%; 22 of 1,532 males) had genotypes matching known colonies in the area, with most of these joining aggregations near to their natal colony (<500 m; n = 20) but two males having traveled 6 and 16 km, respectively, before joining an aggregation.
Simulations indicated that mean male dispersal distances between 2 and 3 km produced distributions of sibship probability that were the best fit to our observed data (Set 2: Figure 3B, Set 3: Figure 3C). This estimate of mean male dispersal was somewhat higher (5.2 km) or lower (1.3 km) if we assumed few or many total families contributed males to the set, respectively (Set 2, S = 200 or S = 900; Figure 3B). In all cases, these simulations assumed male dispersal followed an exponential distribution, with male survivorship decreasing steadily with distance from the natal nest. Given this function, a mean dispersal distance of 2.5 km corresponds to approximately 67% of a colony’s males dispersing more than 1 km, 30% more than 3 km, 13% more than 5 km and 2% more than 10 km (Figure 3A). That is, this dispersal function closely reflects the distribution of brothers we observed in aggregations, with the majority found in the same or nearby aggregations, and a minority separated by large distances.
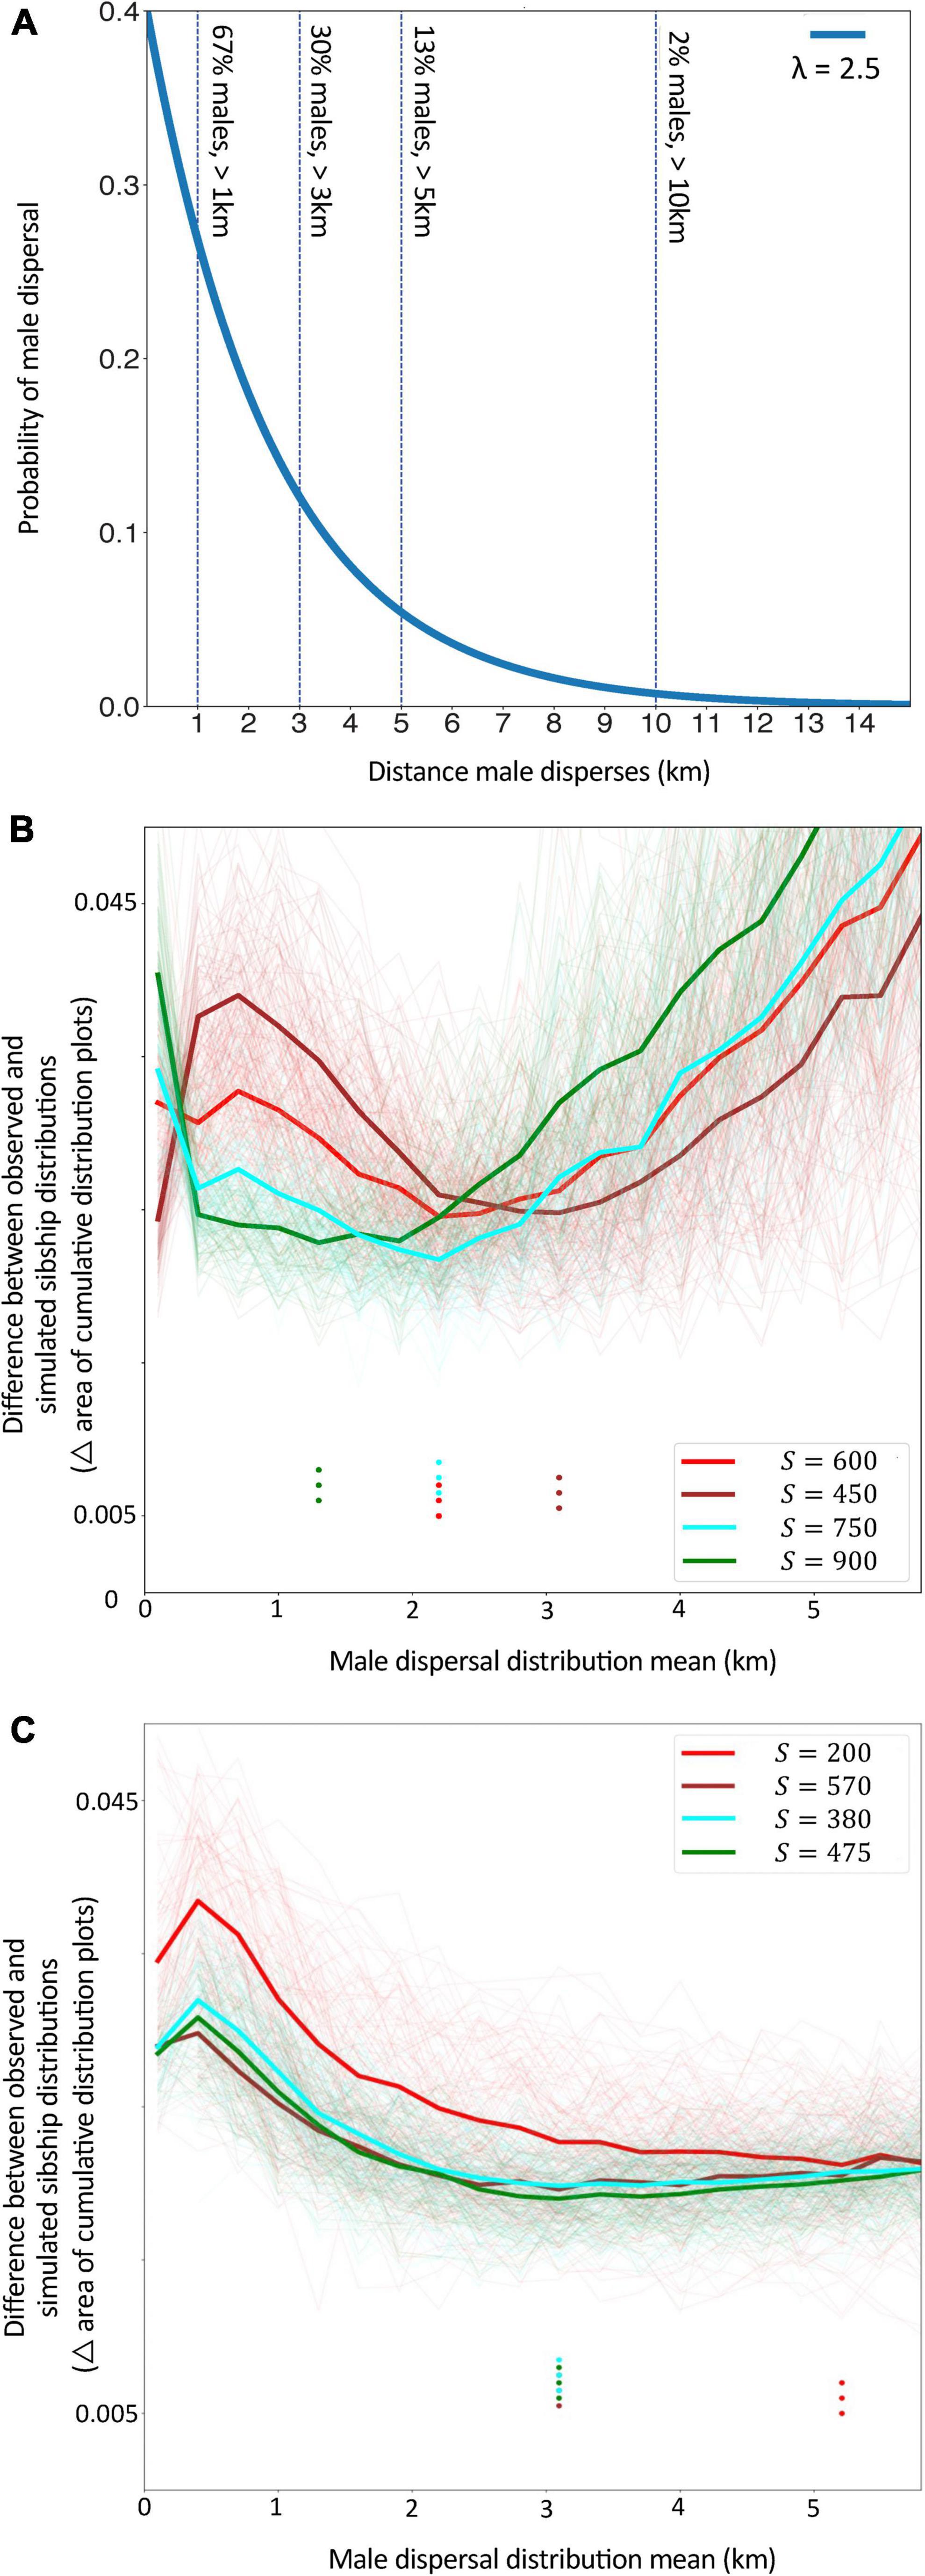
Figure 3. (A) An example of the dispersal distributions of males being modeled in simulations; in this example the distribution has a mean value (λ) of 2.5 km. As indicated by the vertical lines, for this distribution around one third of males travel at least 3 km, one sixth travel more than 5 km and a small proportion travel more than 10 km. (B,C) The difference between simulated vs. observed data for Sets 2 (B) and Set 3 (C) for different values of mean male dispersal distance. This difference was measured as the area between the curves of the pairwise sibship cumulative distribution plots of each data type per sibship probability bin. The unit in which the difference is measured (i.e., area on a plot) is important only as a means of comparing modeled and observed data, whereby lower values for this unit indicate closer matches between simulated and real data. Bold lines indicate the average difference for given values of S (the prior estimate of total number of families contributing males to our datasets). Fine lines represent each of the 100 simulations for a given set of parameters. Dots indicate the mean male dispersal distance (km) at which the difference between simulated data and observed data was the lowest, i.e., the mean male dispersal distance that produced the best-fit for our observed data. For most values of S in both Sets, this best-fit was for mean dispersal distances (λ) between 2 and 3 km.
Finally, mark-recapture studies suggested our estimates of male dispersal were realistic by confirming that males can travel several kilometers per day. Paint marked males were recaptured at target aggregations within 48 h after release at distances of 1 km (50 of 2,830 total released), 1.5–2.5 km (6 of 2,600) and 3–4.5 km (2 of 1,800); (Supplementary Table 2). The low recapture rates were consistent with expectations if males dispersed in all directions from the release site.
Estimating the Density of Colonies in a Region
Assuming mean male dispersal distances between 2 and 3 km, we estimate the density of T. carbonaria colonies in the Sunshine Coast region (a mix of natural bushland and agricultural land) to range from 11.2 to 25.4 colonies/km2 (Nf = 319; 3 aggregations), and in Greater Sydney (urban and remnant bushland) to be 2.8–6.4 colonies/km2 (Nf = 80; 10 aggregations). For one area of Sydney (Kuringai) where the density of hived T. carbonaria colonies is known to be high due to a local breeding program (8 colonies/km2), our estimate matched the known minimum colony density when average male natal dispersal was assumed to be 2 km (Nf = 100).
Colony Investment in Male Production
T. carbonaria colonies produced males throughout the year (average 20% total brood ± 0.02 S.E., n = 62), with male production relatively constant per month in the warmer climate of South East Queensland (9.7–26.3%, n = 43) and showing a springtime peak in the more seasonal climate of Sydney (1% in winter to 51.63% in spring, n = 19 colonies; Figure 2B). This equates to approximately 450 males produced per week, and up to 1,000 per week during spring for a typical colony (i.e., a colony of 8,000 workers with 300 eggs laid per day; 28).
Discussion
We find that male stingless bees are efficient dispersers, capable of dispersing long distances from their natal nests. Based on the sibship probabilities of males sampled at mating aggregations, we estimate that the average male T. carbonaria (a bee 4 mm in length) travels 2–3 km from their natal nest before joining a mating aggregation, and that some males travel up to 20 km. Mark-and-recapture supported these estimates, by revealing that T. carbonaria males can travel several kilometers per day in search of a mate. In contrast, queen dispersal in this species is constrained to worker flight ranges (∼700 m; 29) because new nests are dependent on resources carried by workers from the parent nest (Smith et al., 2017). Our data thus support the view that male dispersal ability may be key to understanding the resilience of wild bee populations to habitat fragmentation.
The capacity to disperse long-distances has been proposed to account for the low genetic differentiation observed in populations of some bees (Ulrich et al., 2009; López-Uribe et al., 2014; Jaffé et al., 2016; Luna-Lucena et al., 2017), despite them occupying disturbed habitats. This includes stingless bees, many of which appear capable of maintaining high gene flow in the face of modifications to their natural habitat. In a landscape genetic study of 17 stingless bee species in South and Central America, gene flow was found to be largely independent of landscape features such as forest fragmentation, rivers or roads (Jaffé et al., 2016).
Australia’s T. carbonaria also show low population differentiation across 900 km2 of their southern range, an area that includes natural, agricultural and urban landscapes (Chapman et al., 2018). Female-mediated gene flow might contribute to these patterns. For example, high rates of colony reproduction would facilitate gene flow, even if natural female dispersal distances are low. Also, virgin queens in some species can usurp or parasitize existing colonies (Gloag et al., 2008), which in theory might allow larger-than-usual leaps in distance between parent and daughter colonies. It seems likely, however, that the free movement of males makes the greater contribution to nuclear gene flow in stingless bee populations. Indeed, strong local signatures in mitochondrial genomes have been reported for several species, consistent with this sex-bias (Francisco et al., 2013; Rattanawannee et al., 2017). As such, gene flow driven by male dispersal is probably crucial to maintaining high genetic diversity in fragmented populations of these bees, in turn reducing inbreeding risks and safeguarding their capacity to adapt. Further work is needed to confirm whether the magnitude of male-bias in dispersal ability estimated here for T. carbonaria is typical of all meliponine bees (e.g., by applying the models developed in this study to the sampled male aggregations of other species). Actual dispersal distances will vary across the clade with variation in body size (López-Uribe et al., 2019) or other species-specific traits (Jaffé et al., 2016).
The extent to which dispersal is active rather than passive will affect how populations respond to fragmentation, because it affects the probability that individuals travel between habitat patches. At short range, stingless bee males are presumably attracted to a pheromone emitted by the virgin queen inside the nest (Vollet-Neto et al., 2018). Prior to passing near a requeening nest, however, males may be at the mercy of abiotic factors. In this sense, they are comparable to the male gametes of other organisms that are produced on mass and thrown to ocean currents or wind, such as the sperm of egg-brooding marine invertebrates, or the pollen of wind-pollinated plants. For example, the male cones of conifers, produce large quantities of pollen which are dispersed consecutively by the wind, some eventually reaching a receptive female cone. Female cones hold and retain the eggs, which are protected by the cone scales and exposed only briefly during sexual maturity to allow fertilization (Williams, 2009). In the same way, stingless bee males are produced in high numbers and set forth from a colony, each male with a low likelihood of successfully encountering a briefly available virgin queen. At large spatial and temporal scales, male-mediated gene flow in stingless bees may well be strongly influenced by landscape patterns in wind, just as occurs in wind-pollinated plants (Kling and Ackerly, 2021). While our data provides insight into male dispersal capability, further studies are needed to understand how the abiotic environments affects patterns of male bee dispersal, and thus gene flow, in different landscapes.
Male bees are also pollinators (Ogilvie and Thomson, 2015). While they visit flowers only to gain energy for themselves (Boongird and Michener, 2010), and rarely collect pollen directly, the pollen they do move may be more likely to lead to pollination than that transported by females (Tang et al., 2019), and males may fulfill specific pollination roles via sex-specific behaviors (Sapir et al., 2005). During paint-marking of T. carbonaria, we observed that males were often heavily dusted with pollen. The potential for long-distance dispersal by stingless bee males therefore raises the question of whether they regularly displace pollen grains over distances greater than their worker sisters. If so, stingless bee males may have a role in ensuring gene flow between habitat patches not only for their own species, but also the plants they feed on.
Inbreeding is particularly costly in bees and other hymenopteran insects (Heimpel and de Boer, 2008). Why then did we find that some males failed to disperse at all, instead aggregating outside their natal colonies? Such non-dispersing males were rare or absent from most mating aggregations we sampled, but three of the 31 aggregations that formed at our bait hives had a high proportion of natal males. Whether this reflects natural variance in dispersal tendency, or arose from our experimental manipulation, is unclear. One possibility though is that hive-splitting sometimes triggers a stress response by colonies that includes the ejection of males, with some ejected males (perhaps immature ones) failing to disperse. Honey bees will eject males from their nests as winter approaches and food becomes scarce (Free and Williams, 1975). Whatever the reason, the presence of natal males in some aggregations indicates that brother-sister matings are likely to occur sometimes in stingless bees, particularly if re-queening colonies fail to attract many external males.
Can Male Aggregations Be Used to Estimate Stingless Bee Colony Densities?
Conservation requires effective tools for tracking how species abundances vary in space and time. While there is widespread concern about population declines in bees and other insects, especially in the tropics (Sánchez-Bayo and Wyckhuys, 2019), it is often challenging to demonstrate population size changes. In stingless bees, if average male dispersal distances are known, males in an aggregation can be assigned by genotype to a given number of natal colonies to provide an estimate of colony density. We show that T. carbonaria meets key criteria for using this approach: hived colonies can be manipulated to attract males, and all colonies in a given season produce males and thus are represented in the adult male population.
The use of male aggregations to estimate colony densities is a technique originally developed for honey bees (Baudry et al., 1998; Jaffé et al., 2010; Hinson et al., 2015), and its use in stingless bees presents some novel challenges. There is no available synthetic queen pheromone for stingless bees, so real virgin queens must be used as lures. While we found this relatively straightforward in T. carbonaria via standard beekeeping practices, it means the technique is workable only for species that can be similarly hived and manipulated. Moreover, as stingless bee males never return to their natal nest after leaving it (unlike male honey bees), the variance in distances traveled by males from the same aggregation will be greater for stingless bees. Nevertheless, using average dispersal distances is probably sufficient to give informative estimates for stingless bee colony density in most cases. We found that when applying a colony density estimate to a sub-region of Sydney in our T. carbonaria dataset, using an average male dispersal distance (2 km) gave values that closely matched the known colony density of managed hives. Colony density estimates derived in this way from male aggregations may be particularly useful where the goal is to monitor changes in population size of the same region over time, or to make broad comparisons of colony densities in different regions or habitat types. For example, our estimates for T. carbonaria colony density on the Australian Sunshine Coast (a region of intact bushland and farmland) were around fourfold that of urban Sydney. We believe that with further development of this protocol in T. carbonaria and other stingless bees, the targeted attraction of male aggregations to hived colonies has a valuable application to population monitoring, and thus efforts to conserve these important pollinators.
Data Availability Statement
The original contributions presented in the study are included in the article/Supplementary Material, further inquiries can be directed to the corresponding author/s.
Author Contributions
FG, RG, and BO conceived the project. FG, BG, RG, AH, and TL designed the methodology. FG, TH, and GB collected and analyzed the data. BG and AH designed and implemented the model. FG and RG led the writing of the manuscript. All authors contributed to the drafts and gave final approval for publication.
Funding
Funding came from an Australia and Pacific Science Foundation 2016 research grant to RG and BO and through funding from the Australian Government, Department of Agriculture, Water and the Environment as part of its Rural R&D for Profit program.
Conflict of Interest
The authors declare that the research was conducted in the absence of any commercial or financial relationships that could be construed as a potential conflict of interest.
Publisher’s Note
All claims expressed in this article are solely those of the authors and do not necessarily represent those of their affiliated organizations, or those of the publisher, the editors and the reviewers. Any product that may be evaluated in this article, or claim that may be made by its manufacturer, is not guaranteed or endorsed by the publisher.
Acknowledgments
We thank Tobias Smith for brood collections; Kuringai Council, Liz Gibson, Peter Clarke, Lindy Williams, and Dan Smailes for access to colonies. Eliza Middleton and Riley Ferguson for their feedback on the manuscript. Julianne Lim, Michael Holmes, Guillaume Kerdoncuff, Bede Johnston, Pao, Zijia Sun, and Nick Steichmann for assistance in the lab or field.
Supplementary Material
The Supplementary Material for this article can be found online at: https://www.frontiersin.org/articles/10.3389/fevo.2022.843156/full#supplementary-material
References
Baudry, E., Solignac, M., Garnery, L., Gries, M., Cornuet, J., and Koeniger, N. (1998). Relatedness among honeybees (Apis mellifera) of a drone congregation. Proc. R. Soc. Lond. B Biol. Sci. 265, 2009–2014. doi: 10.1098/rspb.1998.0533
Boongird, S., and Michener, C. D. (2010). Pollen and propolis collecting by male stingless bees (Hymenoptera: Apidae). J. Kans. Entomol. Soc. 83, 47–50. doi: 10.2317/JKES0810.20.1
Brito, R., Francisco, F., Domingues-Yamada, A., Gonçalves, P., Pioker, F., Soares, A., et al. (2009). Characterization of microsatellite loci of Tetragonisca angustula (Hymenoptera, Apidae, Meliponini). Conserv. Genet. Resour. 1, 183–187. doi: 10.1007/s12686-009-9045-4
Brosi, B. J., Daily, G. C., Shih, T. M., Oviedo, F., and Durán, G. (2008). The effects of forest fragmentation on bee communities in tropical countryside. J. Appl. Ecol. 45, 773–783. doi: 10.1111/j.1365-2664.2007.01412.x
Bueno, F. G. B., Gloag, R., Latty, T., and Ronai, I. (2020). Irreversible sterility of workers and high-volume egg production by queens in the stingless bee Tetragonula carbonaria. J. Exp. Biol. 223:jeb230599. doi: 10.1242/jeb.230599
Bueno, F. G. B., Kendall, L., de Araujo Alves, D., Tamara, M. L., Heard, T. A., Latty, T., et al. (2021). Stingless bee floral visitation in the global tropics and subtropics. bioRxiv [Preprint] doi: 10.1101/2021.04.26.440550
Carvalho-Zilse, G. A., and Kerr, W. E. (2004). Natural substitutions of queens and flight distance of males in tiuba (Melipona compressipes fasciculata Smith, 1854) and uruçu (Melipona scutellaris Latreille, 1811) (Apidae, Meliponini). Acta Amaz. 34, 649–652. doi: 10.1590/S0044-59672004000400016
Chaine, A. S., and Clobert, J. (2012). “Dispersal,” in Behavioural Responses to a Changing World, eds U. Candolin and B. B. M. Wong (Oxford: Oxford University Press).
Chapman, N. C., Byatt, M., Cocenza, R. D. S., Nguyen, L. M., Heard, T. A., Latty, T., et al. (2018). Anthropogenic hive movements are changing the genetic structure of a stingless bee (Tetragonula carbonaria) population along the east coast of Australia. Conserv. Genet. 19, 619–627. doi: 10.1007/s10592-017-1040-9
dos Santos, C. F., Francisco, F. D. O., Imperatriz-Fonseca, V. L., and Arias, M. C. (2016a). Eusocial bee male aggregations: spatially and temporally separated but genetically homogenous. Entomol. Exp. Appl. 158, 320–326. doi: 10.1111/eea.12407
dos Santos, C. F., Imperatriz-Fonseca, V. L., and Arias, M. C. (2016b). Relatedness and dispersal distance of eusocial bee males on mating swarms. Entomol. Sci. 19, 245–254. doi: 10.1111/ens.12195
Francisco, F. D. O., Santiago, L. R., and Arias, M. C. (2013). Molecular genetic diversity in populations of the stingless bee Plebeia remota: a case study. Genet. Mol. Biol. 36, 118–123. doi: 10.1590/S1415-47572013000100017
Francisco, F. O., Santiago, L. R., Mizusawa, Y. M., Oldroyd, B. P., and Arias, M. C. (2017). Population structuring of the ubiquitous stingless bee Tetragonisca angustula in southern Brazil as revealed by microsatellite and mitochondrial markers. Insect Sci. 24, 877–890. doi: 10.1111/1744-7917.12371
Free, J. B., and Williams, I. H. (1975). Factors determining the rearing and rejection of drones by the honeybee colony. Anim. Behav. 23, 650–675.
Gloag, R., Heard, T., Beekman, M., and Oldroyd, B. (2008). Nest defence in a stingless bee: what causes fighting swarms in Trigona carbonaria (Hymenoptera, Meliponini)? Insectes Soc. 55, 387–391. doi: 10.1007/s00040-008-1018-1
Green, C. L., Franck, P., and Oldroyd, B. P. (2001). Characterization of microsatellite loci for Trigona carbonaria, a stingless bee endemic to Australia. Mol. Ecol. Resour. 1, 89–92. doi: 10.1046/j.1471-8278.2001.00041.x
Grüter, C. (ed.). (2020). “Stingless bees: an overview,” in Stingless Bees: Their Behaviour, Ecology and Evolution, (New Jersey, NJ: Springer), 1–42.
Heard, T. A. (2016). The Australian Native Bee Book: Keeping Stingless bee Hives for Pets, Pollination and Sugarbag Honey. Brisbane: Sugarbag Bees.
Heimpel, G. E., and de Boer, J. G. (2008). Sex determination in the hymenoptera. Annu. Rev. Entomol. 53, 209–230. doi: 10.1146/annurev.ento.53.103106.093441
Hinson, E. M., Duncan, M., Lim, J., Arundel, J., and Oldroyd, B. P. (2015). The density of feral honey bee (Apis mellifera) colonies in South East Australia is greater in undisturbed than in disturbed habitats. Apidologie 46, 403–413. doi: 10.1007/s13592-014-0334-x
Jaffé, R., Dietemann, V., Allsopp, M. H., Costa, C., Crewe, R. M., Dall’olio, R., et al. (2010). Estimating the density of honeybee colonies across their natural range to fill the gap in pollinator decline censuses. Conserv. Biol. 24, 583–593. doi: 10.1111/j.1523-1739.2009.01331.x
Jaffé, R., Pope, N., Acosta, A. L., Alves, D. A., Arias, M. C., De la Rúa, P., et al. (2016). Beekeeping practices and geographic distance, not land use, drive gene flow across tropical bees. Mol. Ecol. 25, 5345–5358. doi: 10.1111/mec.13852
Kelemen, E. P., and Rehan, S. M. (2021). Conservation insights from wild bee genetic studies: geographic differences, susceptibility to inbreeding, and signs of local adaptation. Evol. Appl. 14, 1485–1496. doi: 10.1111/eva.13221
Klein, A.-M., Vaissiere, B. E., Cane, J. H., Steffan-Dewenter, I., Cunningham, S. A., Kremen, C., et al. (2006). Importance of pollinators in changing landscapes for world crops. Proc. R. Soc. B Biol. Sci. 274, 303–313. doi: 10.1098/rspb.2006.3721
Kling, M. M., and Ackerly, D. D. (2021). Global wind patterns shape genetic differentiation, asymmetric gene flow, and genetic diversity in trees. Proc. Natl. Acad. Sci. U.S.A. 118:e2017317118. doi: 10.1073/pnas.2017317118
Kraus, F., Weinhold, S., and Moritz, R. (2008). Genetic structure of drone congregations of the stingless bee Scaptotrigona mexicana. Insectes Soc. 55, 22–27. doi: 10.1007/s00040-007-0966-1
López-Uribe, M. M., Morreale, S. J., Santiago, C. K., and Danforth, B. N. (2015). Nest suitability, fine-scale population structure and male-mediated dispersal of a solitary ground nesting bee in an urban landscape. PLoS One 10:e0125719. doi: 10.1371/journal.pone.0125719
López-Uribe, M. M., Jha, S., and Soro, A. (2019). A trait-based approach to predict population genetic structure in bees. Mol. Ecol. 28, 1919–1929. doi: 10.1111/mec.15028
López-Uribe, M. M., Zamudio, K. R., Cardoso, C. F., and Danforth, B. N. (2014). Climate, physiological tolerance and sex-biased dispersal shape genetic structure of Neotropical orchid bees. Mol. Ecol. 23, 1874–1890. doi: 10.1111/mec.12689
Luna-Lucena, D., Moure?Oliveira, D., Ferreira, K. M., Lucena, D. A., Garofalo, C. A., Moraes, E. M., et al. (2017). High mitochondrial DNA diversity and lack of population structure in a solitary cavity-nesting bee in an urban landscape. Biol. J. Linn. Soc. 121, 564–575. doi: 10.1093/biolinnean/blx019
Ogilvie, J. E., and Thomson, J. D. (2015). Male bumble bees are important pollinators of a late-blooming plant. Arthropod Plant Interact. 9, 205–213. doi: 10.1007/s11829-015-9368-x
Paxton, R. J. (2005). Male mating behaviour and mating systems of bees: an overview. Apidologie 36, 145–156. doi: 10.1051/apido:2005007
Rattanawannee, A., Jeratthitikul, E., Duangpakdee, O., and Oldroyd, B. P. (2017). Mitochondrial sequencing and geometric morphometrics suggest two clades in the Tetragonilla collina (Apidae: Meliponini) population of Thailand. Apidologie 48, 719–731. doi: 10.1007/s13592-017-0517-3
Romiguier, J., Lourenco, J., Gayral, P., Faivre, N., Weinert, L. A., Ravel, S., et al. (2014). Population genomics of eusocial insects: the costs of a vertebrate-like effective population size. J. Evol. Biol. 27, 593–603. doi: 10.1111/jeb.12331
Sánchez-Bayo, F., and Wyckhuys, K. A. (2019). Worldwide decline of the entomofauna: a review of its drivers. Biol. Conserv. 232, 8–27. doi: 10.1016/j.biocon.2019.01.020
Sanner, M. F. (1999). Python: a programming language for software integration and development. J. Mol. Graph. Model. 17, 57–61.
Santos, P. K., Françoso, E., Cordeiro, G. D., Alves-dos-Santos, I., and Arias, M. C. (2020). Genetic analyses reveal female philopatric behavior and nest usage by multiple females of the solitary oil-collecting bee Tetrapedia diversipes (Hymenoptera: Apidae). Apidologie 51, 815–825.
Sapir, Y., Shmida, A., and Ne’eman, G. (2005). Pollination of Oncocyclus irises (Iris: Iridaceae) by night-sheltering male bees. Plant Biol. 7, 417–424. doi: 10.1055/s-2005-837709
Smith, J. P., Heard, T. A., Beekman, M., and Gloag, R. (2017). Flight range of the Australian stingless bee Tetragonula carbonaria (Hymenoptera: Apidae). Aust. Entomol. 56, 50–53. doi: 10.1111/aen.12206
Tang, J., Quan, Q.-M., Chen, J.-Z., Wu, T., and Huang, S.-Q. (2019). Pollinator effectiveness and importance between female and male mining bee (Andrena). Biol. Lett. 15:20190479. doi: 10.1098/rsbl.2019.0479
Ulrich, Y., Perrin, N., and Chapuisat, M. (2009). Flexible social organization and high incidence of drifting in the sweat bee, Halictus scabiosae. Mol. Ecol. 18, 1791–1800. doi: 10.1111/j.1365-294X.2009.04154.x
Utaipanon, P., Schaerf, T. M., and Oldroyd, B. P. (2019). Assessing the density of honey bee colonies at ecosystem scales. Ecol. Entomol. 44, 291–304. doi: 10.1111/een.12715
Vollet-Neto, A., Koffler, S., dos Santos, C., Menezes, C., Nunes, F., Hartfelder, K., et al. (2018). Recent advances in reproductive biology of stingless bees. Insectes Soc. 65, 201–212. doi: 10.1007/s00040-018-0607-x
Walsh, P. S., Metzger, D. A., and Higuchi, R. (1991). Chelex 100 as a medium for simple extraction of DNA for PCR-based typing from forensic material. Biotechniques 10, 506–513. doi: 10.2144/000114018
Wang, J. (2004). Sibship reconstruction from genetic data with typing errors. Genetics 166, 1963–1979. doi: 10.1534/genetics.166.4.1963
Keywords: sex-biased dispersal, inbreeding avoidance, flight range, mating aggregations, conservation, stingless bee, habitat fragmentation
Citation: Garcia Bulle Bueno F, Garcia Bulle Bueno B, Buchmann G, Heard T, Latty T, Oldroyd BP, Hosoi AE and Gloag R (2022) Males Are Capable of Long-Distance Dispersal in a Social Bee. Front. Ecol. Evol. 10:843156. doi: 10.3389/fevo.2022.843156
Received: 24 December 2021; Accepted: 07 February 2022;
Published: 14 March 2022.
Edited by:
Isabel Marques, University of Lisbon, PortugalReviewed by:
Jair E. Garcia, RMIT University, AustraliaPeter Kwapong, University of Cape Coast, Ghana
Copyright © 2022 Garcia Bulle Bueno, Garcia Bulle Bueno, Buchmann, Heard, Latty, Oldroyd, Hosoi and Gloag. This is an open-access article distributed under the terms of the Creative Commons Attribution License (CC BY). The use, distribution or reproduction in other forums is permitted, provided the original author(s) and the copyright owner(s) are credited and that the original publication in this journal is cited, in accordance with accepted academic practice. No use, distribution or reproduction is permitted which does not comply with these terms.
*Correspondence: Francisco Garcia Bulle Bueno, ZmdhcmNpYWJ1bGxlQGdtYWlsLmNvbQ==