- 1Institute of Tropical Bamboo, Rattan and Flower, Sanya Research Base, International Centre for Bamboo and Rattan, Sanya, China
- 2School of Ecology and Environment, Hainan University, Haikou, China
- 3International Centre for Bamboo and Rattan, Beijing, China
- 4Agricultural Technology Extension Service Center of Sanya, Sanya, China
Introduction: The grasslands in the Nature Reserve of Ganshenling, in the south of Hainan Island, were first formed after deforestation disturbance before a natural restoration of shrubs and secondary forests. However, the stages of grassland and shrubs in some parts of Ganshenling regions could not be naturally restored to secondary forests. In addition, the forest form of the secondary forest after 40 years (40a) of succession was similar to that of the secondary forest of 60 years (60a). However, it was not known whether the microorganisms recovered to the level of the secondary forest of 60a. Arbuscular mycorrhizal fungi (AMF) are plant root symbionts that can improve the nitrogen and phosphorus absorption of plants and play a key role in secondary forest succession. An understanding of the essential role of soil AMF in secondary forest succession of tropical rainforest in Ganshenling regions is still limited.
Methods: Therefore, the soil of 0–10 cm was collected with the help of a 5-point sampling method in grassland, shrubs, and second tropical lowland rainforest of 40a and 60a. We studied community changes in AMF with the succession and explored the impacts of soil physicochemical properties on soil AMF.
Results: Our findings were as follows: (1) Different successional stages showed divergent effects on soil AMF communities. (2) After 40a recovery, the alpha-diversity indices of AMF recovered to the level of secondary forest of 60a, but the similarity of soil AMF communities only recovered to 25.3%. (3) Species richness of common species, rare species, and all the species of AMF showed a significantly positive correlation with soil nitrogen. (4) OTU10; OTU6, OTU9, and OTU141; OTU3 and OTU38; and OTU2, OTU15, OTU23, and OTU197 were significantly unique AMF for grasslands, shrubs, and secondary forests of 40a and 60a, respectively. (5) The phylogenetic tree and the heatmap of AMF showed that the OTUs in grasslands and shrubs were in contrast to the OTUs in secondary forests of 40a and 60a.
Discussion: We concluded that the succession of a secondary forest after deforestation disturbance was probably limited by its AMF community.
1. Introduction
Grasslands (G) and shrubs (S) are formed after deforestation, and are restored to the tropical rainforest by nature (Szefer et al., 2020; Liu et al., 2021). However, the G and S in the Natural Reserve of Ganshenling in the south of Hainan Island do not lead to succession for a long time. This leads to a decline in biomass and degradation in soil fertility, the reason remains unknown.
An estimated 90% of terrestrial plants are associated with mycorrhizal fungi, 80% of these being arbuscular mycorrhizal fungi (AMF), including in tropical lowland rainforests (Haug et al., 2021). AMF play critical roles in facilitating the supply of immobile nutrients (especially nitrogen and phosphorus) and water to the host plants in exchange for photosynthates (Delavaux et al., 2017; Nie et al., 2022). They are sensitive to vegetation as the nature of vegetation along the successional stages of an ecosystem can shape the associated AMF community and vice versa (Asmelash et al., 2016).
A comprehensive understanding of the physicochemical properties of the interactions of soil AMF with different vegetation types helps in understanding the stability and resilience of the tropical rainforest ecosystem. Numerous studies were conducted to investigate the effect of the composition and diversity of vegetation on soil AMF (Šmilauer et al., 2021; Zhang et al., 2021). Some previous studies showed that soil AMF significantly increased along the successional stages in a tropical rainforest ecosystem (Cowan et al., 2022). In contrast to early successional species, late-successional plant species were highly dependent on AMF (Koziol and Bever, 2015). In addition, the changes in AMF could mediate plant species turnover among successional stages (Koziol and Bever, 2016). However, other studies showed that the soil AMF had no response to the diversity and productivity of vegetation (Bauer et al., 2015). In pasture and secondary natural succession, the biomass and catabolic diversity of soil microbial communities were regulated by soil organic carbon (SOC) and soil nitrogen (SN) (Iyyemperumal et al., 2007; Zhang et al., 2022).
Recently, various studies focused on the changes in soil AMF across various successional stages in temperate and subtropical forest ecosystems. However, less information is available on tropical lowland forest ecosystems. While the importance of AMF for a tropical secondary forest successional stage is well understood (Vasconcellos et al., 2013; Reyes et al., 2019), less is known about the potential impacts of AMF on G and S. Furthermore, the possibility that a limited presence of AMF species could influence secondary forest regrowth dynamics is also less explored (Heilmann-Clausen et al., 2015).
The National Nature Reserve of Ganshenling offers a typical ecosystem that comprises G, S, and secondary forests. Its succession follows a vegetation transect sequence of G, S, the secondary forest of 40a (SF40), and the secondary forest of 60a (SF60). Our geographical study sites differ from those of most other studies on AMF communities in tropical vegetation with their coverage of G and S (Zangaro et al., 2012; Leal et al., 2013). Long-term non-succession of G and S has reduced vegetation diversity and biomass recovery (Šmilauer et al., 2020). This is representative of the future of many more recent G and S regions throughout the tropical lowland rainforests. In this study, soil AMF composition in different successional stages was investigated. We analyzed the influence of topsoil fertility (acidity and nutrient availability) on soil AMF.
The specific objectives of this study were as follows: (1) to explore the characteristics of soil AMF community along the successional stages and (2) to identify the factors that drive the changes in soil AMF community along these successional stages.
2. Materials and methods
2.1. Study area
This study was carried out at the Natural Reserve of Ganshenling (109°37'−109°41'E, 18°19'−18°24'N), which has a typical tropical lowland rainforest with a tropical marine monsoon climate. The annual average precipitation and temperature are 1,800 mm and 25.4°C, respectively. The dominant plant species in this area include Hopea reticulata, Vatica mangachapoi, Koilodepas hainanense, Rhodomyrtus tomentosa, Melastoma sanguineum, Scleria elata, and Blechnum orientale (Qi et al., 2014; Mao et al., 2021).
2.2. Sampling collection and environmental variables
Four successional stages in the Natural Reserve of Ganshenling were selected: (1) G (109°39'−109°41'E, 18°21'−18°23'N); (2) S (109°39'−109°41'E, 18°22'−18°23'N); (3) SF40 (109°39'−109°40'E, 18°21'−18°23'N); and (4) SF60 (109°39'−109°40'E, 18°22'−18°23'N).
From each successional stage, five soil samples of 0–10 cm depth were collected by following the 5-point sampling method from five plots of 900 m2 (30 m × 30 m) in August 2019 (Wang et al., 2020). These samples were divided into two groups: one was stored at −80°C until the measurement of soil AMF communities; the other group was used to measure soil physicochemical properties. These soil samples were subsequently air-dried. A 2-mm screen sieve was used to sieve air-dried soil samples for analyzing soil pH, SOC, SN, and soil phosphorus (SP). The SOC was measured with the help of the H2SO4-K2Cr2O7 oxidation method (Bisutti et al., 2004). SN was measured using the Micro-Kjeldahl method (Bremner, 1960), and the available nitrogen was estimated with the help of a micro-diffusion method (Mulvaney and Khan, 2001). SP was measured using an inductively coupled plasma atomic-emission spectrometer (Thermo Jarrell Ash Corporation, Franklin, USA) and HNO3-HClO4 soil solution (McDowell and Sharpley, 2001).
2.3. DNA extraction and amplicon sequencing
Soil DNA was extracted from 250 mg soil samples with the help of a MO-BIO PowerSoil DNA Isolation Kit (MO BIO Laboratories, Carlsbad, CA, USA). DNA was analyzed and quantified with the help of a NanoDrop ND-2000 Spectrophotometer (Thermo Fisher Scientific, Waltham, MA, USA). A standard concentration of AMF was used for PCR amplification.
For PCR amplification, AMV4.5NF (5′-AAGCTCGTAGTTGAATTTCG-3′) and AMDGR (5′-CCCAACTATCCCTATTAATCAT-3′) were used as primers. An AMF library was constructed using two-step PCR amplification. Target fragments were amplified using these primers. Then, an Illumina adapter sequence, a primer pad, and a barcode were added to both the forward and reverse target fragments. A 50-μL reaction volume was used for PCR of each sample, comprising 10 μL of 5x buffer, 1 μL of dNTP (10 m/M), 1 U of Phusion High-Fidelity DNA Polymerase (New England Biolabs, Ipswich, MA, USA), 1 μL of forward and reverse phasing primers, and 3–10 ng of target sequencing. The reaction volume was supplemented with 50 μL of RNase-free ultrapure water. An ABI9700 PCR amplifier (Applied Biosystems, Waltham, MA, USA) was used to amplify DNA. The holding temperature was set at 10°C. PCR products were run on an agarose gel and PCR products were purified from the gel with the help of an AxyPrep DNA Gel Recovery Kit (Axygen Biosciences, Corning, NY, USA) and pooled. FTC-3000TM real-time PCR instrument (Richmond Biotechnology Inc., Richmond Hill, Ontario, Canada) was used to quantify purified DNA and mixed it to an equal molar ratio to perform the second PCR amplification, for which the reaction volume changed to 40 μl: 5x buffer (8 μl), dNTP (1μL, 10 m/M), Phusion High-Fidelity DNA Polymerase (0,8 U, New England Biolabs, Ipswich, MA, USA), both forward and reverse primers (1 μl, 5 μmol/L), respectively, and DNA template (5 μl, 100 μg/ml) and RNase-free ultrapure water (5 μl).
Barcodes were used to identify sequences of different samples in a parallel sequencing test. The sequence with a complete barcode was regarded as valid and extracted to a dataset stored in the FASTQ format. Quality assurance and splicing were performed on such valid sequences and included the following steps: (1) Poorly overlapped and low-quality sequences (quality score <20 and window size <5) were removed with the help of the Trimmomatic program (Bolger et al., 2014); (2) paired reads were merged into a sequence, where the overlap of PEreads (>10 bp) was evaluated with the help of the FLASH program (Magoc and Salzberg, 2011); and (3) merged sequences were screened according to an error ratio (<0.2). Mothur V.1.39.5 was used for quality control of merged reads by removing sequences that were ambiguous, homologous, or chimeras generated during PCR amplification (Schloss et al., 2009). Further analysis of information on species and clustering of operational taxonomic units (OTUs) was based on the clean tags. OTUs were selected with the help of UPARSE with a cutoff of 97% similarity (Edgar, 2013). The dataset was screened for chimeric reads using UCHIME in a reference database mode (Edgar et al., 2011). Through USEARCH global, all sequences were compared to OTU representative sequences to obtain the OTU abundance table. The identity of OTU taxonomy was determined with BLAST (Ye et al., 2006) by comparing them to representative sequences in the MaarjAM database (Zhang et al., 2000; Opik et al., 2010). The taxonomy of an OTU was obtained for the species that had the highest similarity or identity with OTU representative sequences in the MaarjAM database. Some OTUs didnot contain any species information and were therefore marked as “Nomatch”. The library preparation and sequencing were performed by TinyGene Bio-Tech (Shanghai, China). Raw sequence data were submitted to NCBI's Sequence Read Archives (SRP399604).
2.4. Bioinformatics and environmental correlation analyses
We analyzed the overall AMF species richness and diversity (Shannon H' and Simpson indices) and equitability (Pielou J'). Following the classification proposed by Logares et al. (2014), we classified species' relative abundances within each successional stage as “dominant” (>1%), “common” (1–0.01%), and “rare” (<0.01%) (Galand et al., 2009).
OTUs that included an unknown genus and contained <5 sequences were not used for bioinformatics analysis. The species diversity was calculated in R package “vegan.” The principal coordinate analysis (PCoA) was performed using Bray–Curtis distances with 999 permutations with the help of R 4.2.2. The linear discriminant analysis effect size (LEfSe) and linear discriminant analysis (LDA) were performed with R 4.2.2 (Sirova et al., 2018; Nauta et al., 2020). The phylogenetic tree and heatmap of AMF were analyzed with the help of R 4.2.2.
3. Results
3.1. AMF community and Bray–Curtis similarity
Bray–Curtis-based PCoA showed that successional stages had different effects on AMF communities (Figure 1). The AMF communities clustered according to different successional stages, demonstrating that there were large differences between G and S, as well as between SF40 and SF60 (Figure 1).
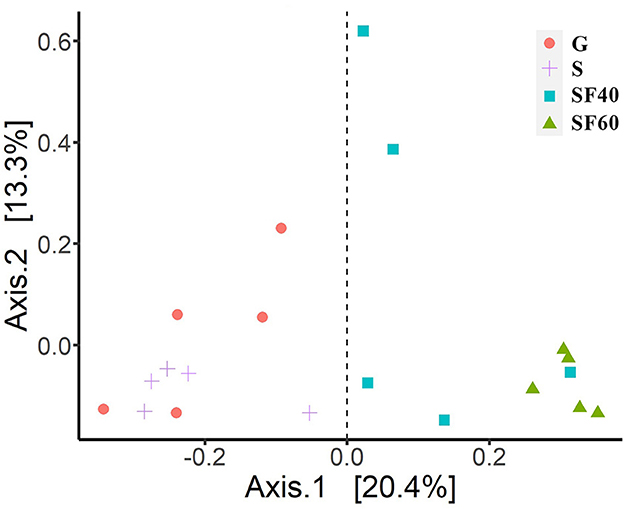
Figure 1. Principal coordinate analyses of Bray–Curtis distances of AMF. G: grasslands; S: shrubs; SF40: secondary forest of 40a; and SF60: secondary forest of 60a.
The PERMANOVAs of Bray–Curtis distances also revealed significant differences among the AMF communities at different successional stages (P = 0.001). Additionally, our beta-diversity results were not significant (P = 0.149), indicating that our groups had the same dispersions. This fact also confirmed that our PERMANOVA results were reliable. Successional stages had a significant effect on the overall AMF community, which contributed to 33.7% of the total variation (Figure 1).
To further elucidate the trend in recovery of the AMF communities during successional stages, the similarity of community composition at the OTU level between different successional stages and SF60 was calculated. There was an average Bray–Curtis similarity of 35.6% between all AMF communities and SF60. The average Bray–Curtis similarity of AMF community between the different successional stages and SF60 was 21.0% for G, 16.0% for S, and 25.3% for SF40, respectively (Figure 2). This suggested that there was a trend of increasing similarity of soil AMF communities from S and G to SF40 compared to SF60.
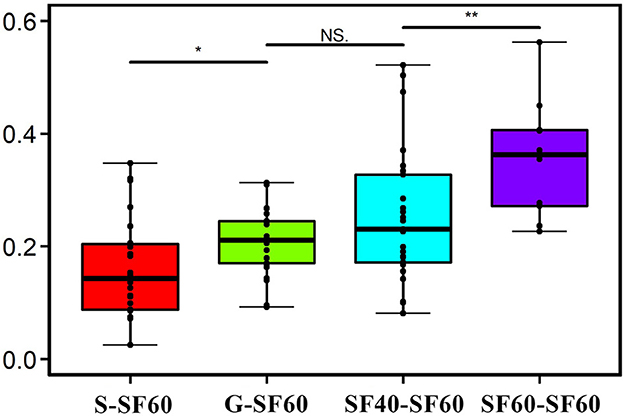
Figure 2. Bray–Curtis similarity of AMF on the basis of OTUs between other successional stages and secondary forest of 60a. G: grasslands; S: shrubs; SF40: secondary forest of 40a; and SF60: secondary forest of 60a.
3.2. Phylogenetic diversity and composition of soil AMF community
The alpha-diversity indices that were based on phylogenetic species richness and phylogenetic diversity of soil AMF communities exhibited different trends (Supplementary Figure S1). AMF phylogenetic species richness and phylogenetic diversity of G were significantly lower than those of SF60 (P < 0.01). However, these parameters showed no significant differences between SF40 and SF60 (Supplementary Figure S1).
The dominant orders of AMF communities among all samples were Glomerales (42.8 ± 3.8%; means ± SD), followed by Paraglomerales (29.1 ± 5.1%), Archaeosporales (0.8 ± 0.3%), and Diversisporales (0.8 ± 0.2%). Together, these accounted for more than 73.5% of the total AMF sequences in all the samples (Supplementary Table S1). The relative abundance of Paraglomerales was significantly increased along the successional stages (Figure 3). Interestingly, the lowest relative abundances of Glomerales and Archaeosporales were found in SF40. However, these relative abundances had no significant differences among the successional stages (Figure 3; Supplementary Table S1). These findings indicated a partial recovery of AMF communities at the order levels (Paraglomerales increasing, while Glomerales and Archaeosporales were decreasing) through the 40a recovery after deforestation disturbance.
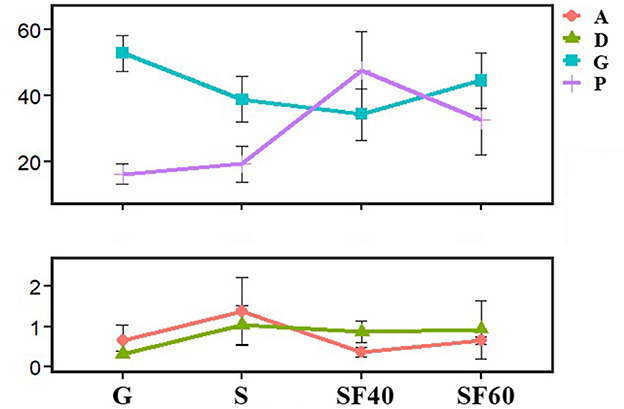
Figure 3. The relative abundance of dominant AMF orders along successional stages. Error bars denote the standard deviation. A: Archaeosporales; D: Diversisporales; G: Glomerales; P: Paraglomerales; G: grassland; S: shrubs; SF40: secondary forest of 40a; and SF60: secondary forest of 60a. Different lowercase letters represent signicant differences along successional stages. Glomerales:a,a,a,a; Paraglomerales:b,b,a,ab; Archaeosporales:a,a,a,a; and Diversisporales:a,a,a,a.
The AMF were mainly distributed in the orders Glomerales (42.8% of the total AMF reads) and Paraglomerales (29.1% of the total AMF reads). The relative abundances of Glomerales were no significant differences among the successional stages (Figure 3). In addition, no significant changes were observed at the family or lower levels, except for OTU13, OTU15, OTU23, and OTU28 (Supplementary Table S1).
3.3. Relationship between AMF community composition and soil factors
SOC, SN, carbon/nitrogen ratio (C/N), and pH had significant differences among the successional stages (Supplementary Table S2). The species richness of common species, rare species, and all species of AMF exhibited a significantly positive relationship with SN (Figure 4). However, species richness of all species of AMF, species richness, Shannon H', Simpson, and Pielou J' indices of rare species of AMF showed a significantly negative relationship with C/N (Figure 4).
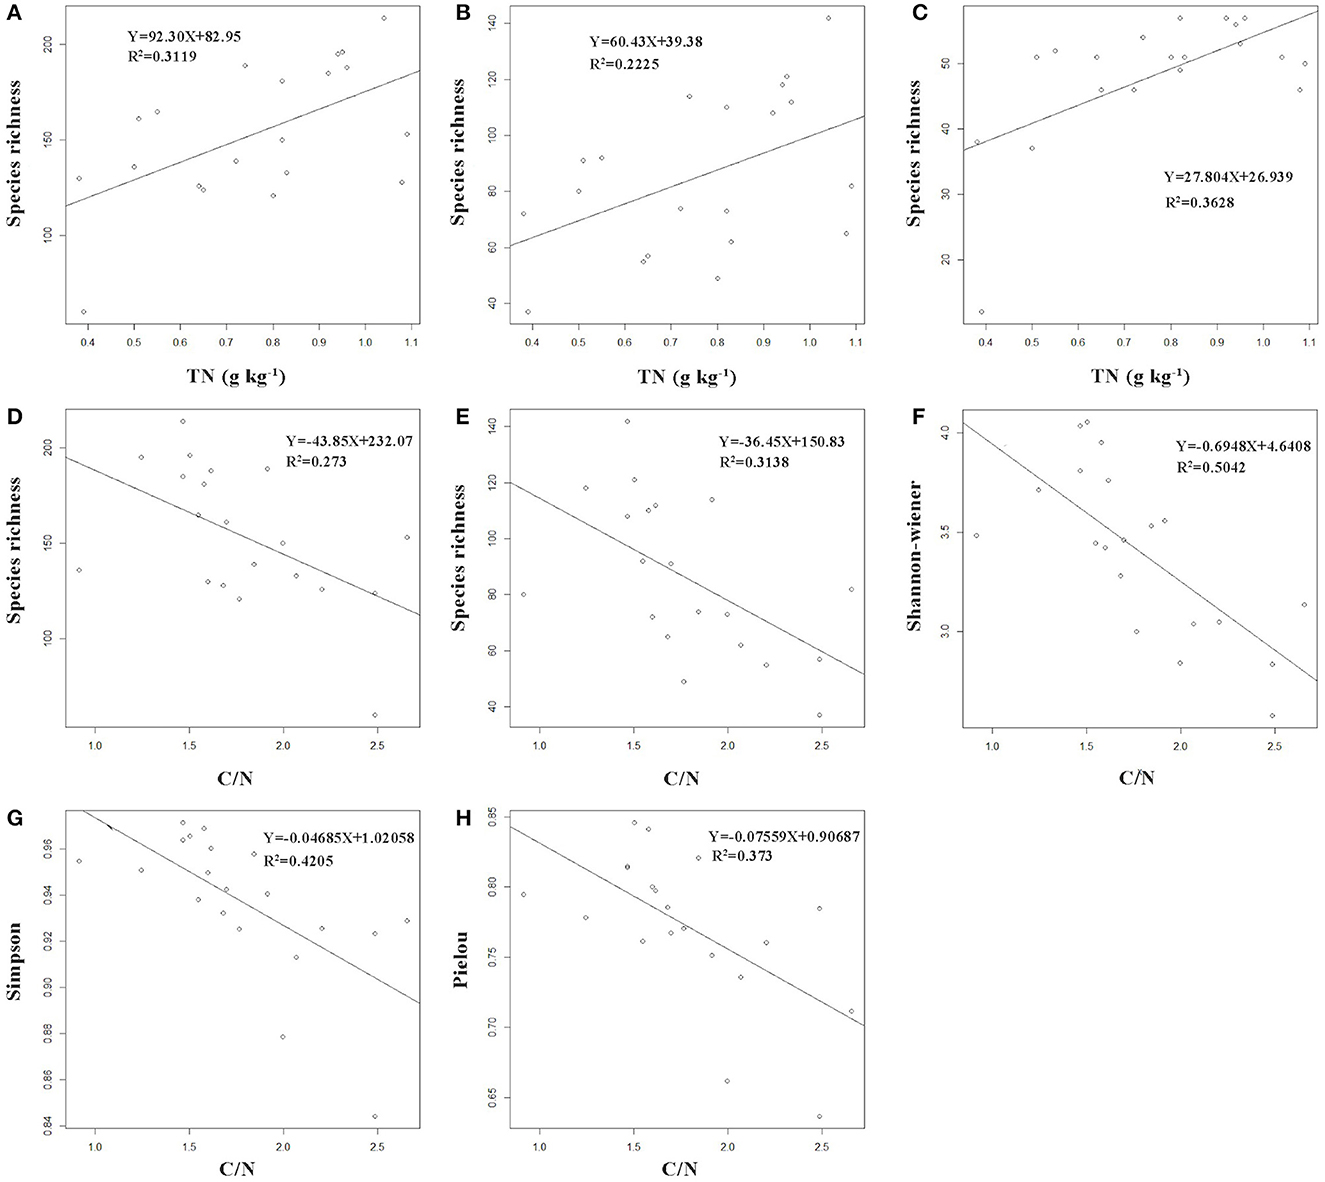
Figure 4. The relationship between diversity indices of AMF and soil physicochemical properties. Y and R2 represent the diversity indices of AMF and the coefficient of determination for this regression equation, respectively. Diagrams of all species of AMF: (A, D); Diagrams of rare species of AMF: (B, E–H); Diagrams of common species of AMF: (C); TN, soil nitrogen; C/N, carbon/nitrogen ratio.
3.4. The LEfSe of AMF
The LEfSe of AMF at successional stages were OTU10 for G; OTU6, OTU9, and OTU141 for S; OTU3 and OTU38 for SF40; and OTU2, OTU15, OTU23, and OTU197 for SF60, respectively (Figure 5).
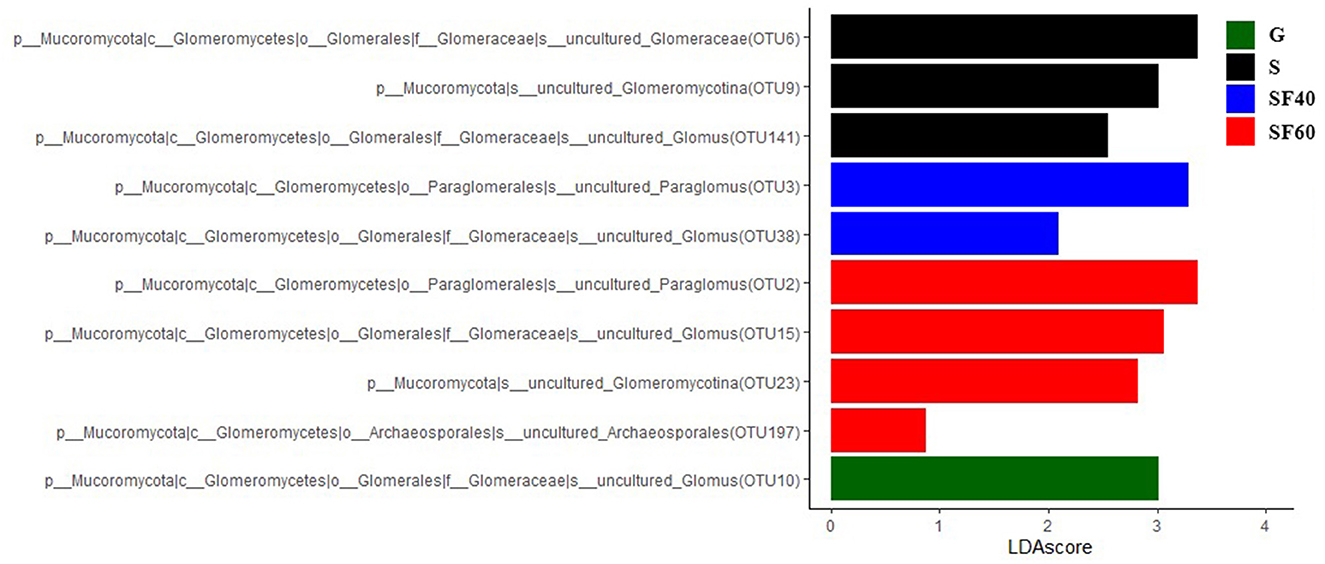
Figure 5. The LEfSe of soil AMF communities along successional stages. G: grasslands; S: shrubs; SF40: secondary forest of 40a; and SF60: secondary forest of 60a.
3.5. The phylogenetic tree and heatmap of AMF
The most dominant orders of AMF communities among successional stages were Glomerales and Paraglomerales. The distribution of OTUs of G was similar to that of S, whereas this was in contrast to those of SF40 and SF60 (Figure 6).
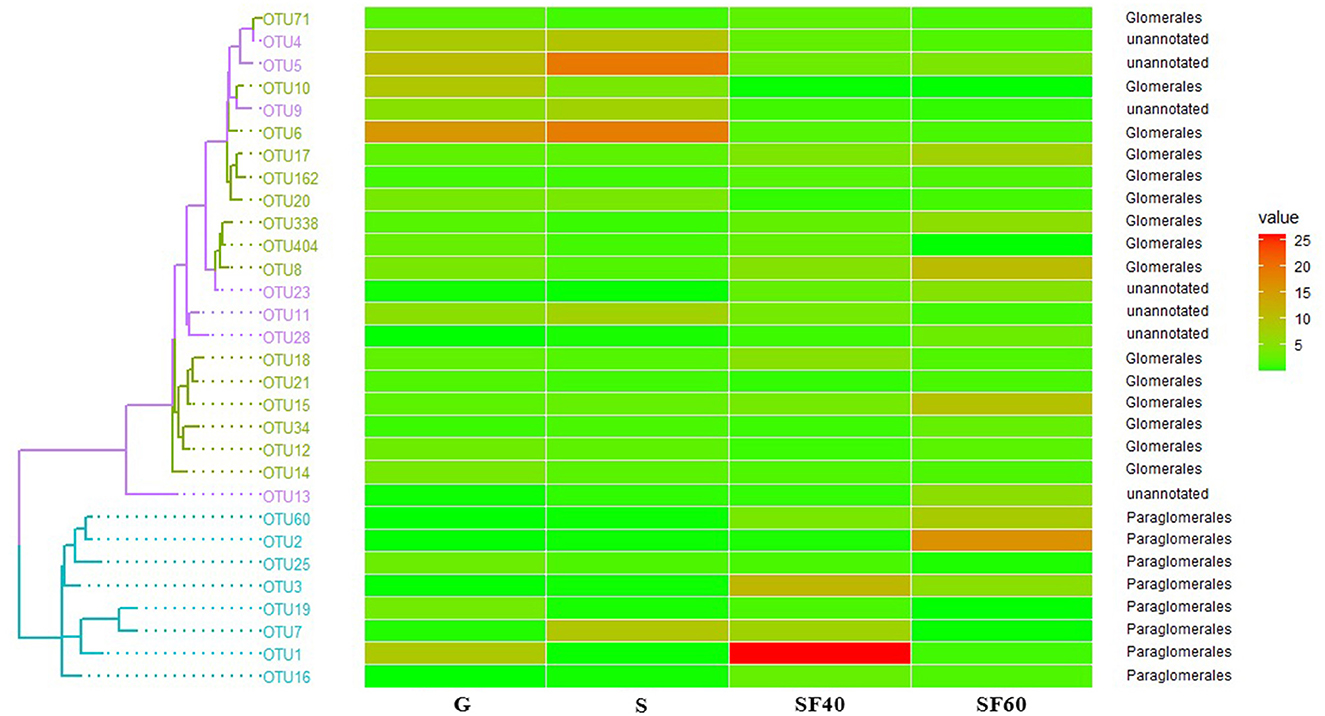
Figure 6. The phylogenetic tree and heatmap of soil AMF along successional stages, drawn on the basis of the top 30 OUTs. G: grasslands; S: shrubs; SF40: secondary forest of 40a; and SF60: secondary forest of 60a.
4. Discussion
4.1. The differences in AMF composition across successional stages
Significant differences were observed in AMF communities between G and S, as well as between SF40 and SF60. Previous studies demonstrated that changes in fungal composition occurred during field successions, where late-successional plant species were highly dependent on AMF as compared to the early-successional plant species, which were not observed in the study of Koziol and Bever (2015). As many the mid- and late-successional plant species were shown to have a high overall beneficial response to AMF, these species were also likely to be more sensitive to the presence of particular beneficial AMF in their environment (Maitra et al., 2021). The changes in AMF composition could mediate plant species turnover during successional periods, which could be particularly important for the establishment and subsequent dynamics of late-successional plants (Koziol and Bever, 2016). AMF have played an important role in secondary forest successions (Heilmann-Clausen et al., 2015). Differences in AMF species composition along the successional stages were also found in the eastern periphery of Amazonia (Reyes et al., 2019), which confirmed the results of Pereira et al. (2014) in Atlantic rainforest areas of Northeast Brazil and those of Leal et al. (2013) in western Amazonia.
4.2. The relationship between AMF and soil physicochemical properties
In this study, the SOC, SN, C/N, and pH showed significant differences with succession, and the species richness of common species, rare species, and all species of AMF indicated a significantly positive relationship with SN. Whereas, the species richness of all species of AMF showed a significantly negative relationship with C/N. Some previous studies reported that SOC and SN were increased along with proceeding successions (Allison et al., 2007; Eisenhauer et al., 2010). In addition, C/N in S was significantly lower than those of other successional stages (Xue et al., 2017). Both SOC and SN were increased along with the succession from G to other stages, which stimulated microbial metabolisms and changed bacterial and fungal community structure by increasing soil amino sugars (Shao et al., 2017). The C/N could significantly affect the structure of the soil microbial community and the nitrogen supply of plants (Waring et al., 2013).
The soil nutrient availability had been proven to be the key determinant that regulated the assembly of AMF communities (Johnson et al., 2015; Jiang et al., 2018) and vice versa (Rillig et al., 2015). The SN could directly drive the change in the AMF community in mixed roots (Shi et al., 2022). The change in SN indirectly regulated the species composition of the AMF community by driving plant species richness at both the whole-community scale and the individual plant species scale (Shi et al., 2022).
5. Conclusion
The changes in AMF along the successional stages were examined in this study. We found that successional stages had different effects on AMF communities. After 40a recovery, the alpha-diversity indices of AMF had recovered to the level of SF60, but the species of AMF had not recovered. The species richness of common species, rare species, and all species of AMF was found to be significantly positively associated with SN. The vegetation succession after deforestation was likely limited by the AMF community. Further research will need to be focused on exploring the effects of soil physicochemical properties on the AMF function diversity along the successional stages in tropical lowland rainforest ecosystems.
Data availability statement
The datasets presented in this study can be found in online repositories. The names of the repository/repositories and accession number(s) can be found below: https://www.ncbi.nlm.nih.gov/sra/PRJNA927263.
Author contributions
The study was conceived and designed by HY and SM. The lab work and the analysis were done by SM and JF. HY wrote the main text of the manuscript. Insightful discussions were contributed by WL, BH, BZ, and QY. All authors reviewed and approved the manuscript.
Funding
This study was jointly supported by the Fundamental Research Funds of ICBR (1632020022), the Fundamental Research Funds of Sanya Research Base, ICBR (1630032022006), and the China Postdoctoral Science Foundation (2018M631414; 2019T120073).
Acknowledgments
We thank all the colleagues and the staff who were involved in maintaining the field maps and collecting samples. We also greatly thank the staff of the Sanya Research Base, International Center for Bamboo and Rattan who provided help in this research work.
Conflict of interest
The authors declare that the research was conducted in the absence of any commercial or financial relationships that could be construed as a potential conflict of interest.
Publisher's note
All claims expressed in this article are solely those of the authors and do not necessarily represent those of their affiliated organizations, or those of the publisher, the editors and the reviewers. Any product that may be evaluated in this article, or claim that may be made by its manufacturer, is not guaranteed or endorsed by the publisher.
Supplementary material
The Supplementary Material for this article can be found online at: https://www.frontiersin.org/articles/10.3389/fevo.2023.1125749/full#supplementary-material
References
Allison, V. J., Condron, L. M., Peltzer, D. A., Richardson, S. J., and Turner, B. L. (2007). Changes in enzyme activities and soil microbial community composition along carbon and nutrient gradients at the Franz Josef chronosequence, New Zealand. Soil Biol. Biochem. 39, 1770–1781. doi: 10.1016/j.soilbio.2007.02.006
Asmelash, F., Bekele, T., and Birhane, E. (2016). The potential role of arbuscular mycorrhizal fungi in the restoration of degraded lands. Front. Microbiol. 7, 1095. doi: 10.3389/fmicb.2016.01095
Bauer, J. T., Mack, K. M. L., and Bever, J. D. (2015). Plant-soil feedbacks as drivers of succession: evidence from remnant and restored tallgrass prairies. Ecosphere. 6, 1–12. doi: 10.1890/ES14-00480.1
Bisutti, I., Hilke, I., and Raessler, M. (2004). Determination of total organic carbon–an overview of current methods. Trends Analyt. Chem. 23, 716–726. doi: 10.1016/j.trac.2004.09.003
Bolger, A. M., Lohse, M., and Usadel, B. (2014). Trimmomatic: a ?exible trimmer for Illumina sequence data. Bioinformatics. 30, 2114–2120. doi: 10.1093/bioinformatics/btu170
Bremner, J. M. (1960). Determination of nitrogen in soil by the Kjeldahl method. J. Agric. Sci. 55, 11–33. doi: 10.1017/S0021859600021572
Cowan, J. A., Gehring, C. A., Ilstedt, U., and Grady, K. C. (2022). Host identity and neighborhood trees affect belowground microbial communities in a tropical rainforest. Trop. Ecol. 63, 216–228. doi: 10.1007/s42965-021-00203-z
Delavaux, C. S., Smith-Ramesh, L. M., and Kuebbing, S. E. (2017). Beyond nutrients: a meta-analysis of the diverse effects of arbuscular mycorrhizal fungi on plants and soils. Ecology. 98, 2111–2119. doi: 10.1002/ecy.1892
Edgar, R. C. (2013). Uparse: Highly accurate OTU sequences from microbial amplicon reads. Nat. Methods. 10, 996–998. doi: 10.1038/nmeth.2604
Edgar, R. C., Haas, B. J., Clemente, J. C., Quince, C., and Knight, R. (2011). UCHIME improves sensitivity and speed of chimera detection. Bioinformatics. 27, 2194–2200. doi: 10.1093/bioinformatics/btr381
Eisenhauer, N., Beßler, H., Engels, C., Gleixner, G., Habekost, M., Milcu, A., et al. (2010). Plant diversity effects on soil microorganisms support the singular hypothesis. Ecology. 91, 485–496. doi: 10.1890/08-2338.1
Galand, P. E., Casamayor, E. O., Kirchman, D. L., and Lovejoy, C. (2009). Ecology of the rare microbial biosphere of the Arctic Ocean. Proc. Natl. Acad. Sci. 106, 22427–22432. doi: 10.1073/pnas.0908284106
Haug, I., Setaro, S. S., and Suárez, J. P. (2021). Global AM fungi are dominating mycorrhizal communities in a tropical premontane dry forest in Laipuna, South Ecuador. Mycol. Prog. 20, 837–845. doi: 10.1007/s11557-021-01699-4
Heilmann-Clausen, J., Barron, E. S., Boddy, L., Dahlberg, A., Griffith, G. W., Nordén, J., et al. (2015). A fungal perspective on conservation biology. Conserv. Biol. 29, 61–68. doi: 10.1111/cobi.12388
Iyyemperumal, K., Israel, D. W., and Shi, W. (2007). Soil microbial biomass, activity and potential nitrogen mineralization in a pasture: Impact of stock camping activity. Soil Biol. Biochem. 39, 149–157. doi: 10.1016/j.soilbio.2006.07.002
Jiang, S., Liu, Y., Luo, J., Qin, M., Johnson, N. C., Öpik, M., et al. (2018). Dynamics of arbuscular mycorrhizal fungal community structure and functioning along a nitrogen enrichment gradient in an alpine meadow ecosystem. New Phytol. 220, 1222–1235. doi: 10.1111/nph.15112
Johnson, N. C., Wilson, G. W. T., Wilson, J. A., Miller, R. M., and Bowker, M. A. (2015). Mycorrhizal phenotypes and the l aw of the minimum. New Phytol. 205, 1473–1484. doi: 10.1111/nph.13172
Koziol, L., and Bever, J. D. (2015). Mycorrhizal response trades off with plant growth rate and increases with plant successional status. Ecology. 96, 1768–1774. doi: 10.1890/14-2208.1
Koziol, L., and Bever, J. D. (2016). AMF, phylogeny, and succession: specificity of response to mycorrhizal fungi increases for late-successional plants. Ecosphere. 7, e01555. doi: 10.1002/ecs2.1555
Leal, P. L., Siqueira, J. O., and Stuermer, S. L. (2013). Switch of tropical Amazon forest to pasture affects taxonomic composition but not species abundance and diversity of arbuscular mycorrhizal fungal community. Appl. Soil Ecol. 71, 72–80. doi: 10.1016/j.apsoil.2013.05.010
Liu, Y., Zhang, G., Luo, X., Hou, E., Zheng, M., Zhang, L., et al. (2021). Mycorrhizal fungi and phosphatase involvement in rhizosphere phosphorus transformations improves plant nutrition during subtropical forest succession. Soil Biol. Biochem. 153, 108099. doi: 10.1016/j.soilbio.2020.108099
Logares, R., Audic, S., Bass, D., Bittner, L., Boutte, C., Christen, R., et al. (2014). Patterns of rare and abundant marine microbial eukaryotes. Curr. Biol. 24, 813–821. doi: 10.1016/j.cub.2014.02.050
Magoc, T., and Salzberg, S. L. (2011). Flash: Fast length adjustment of short reads to improve genome assemblies. Bioinformatics. 27, 2957–2963. doi: 10.1093/bioinformatics/btr507
Maitra, P., Zheng, Y., Wang, Y., Mandal, D., Lü, P., Gao, C., et al. (2021). Phosphorus fertilization rather than nitrogen fertilization, growing season and plant successional stage structures arbuscular mycorrhizal fungal community in a subtropical forest. Biol. Fertil. Soils. 57, 685–697. doi: 10.1007/s00374-021-01554-4
Mao, H., Liu, W., Yang, Q., Yao, H., Liu, G., Yang, H., et al. (2021). Characteristics of root biomass in the tropical lowland rain forest at different succession stages in ganshiling natural reserve, hainan Island. J. Trop. Biol. 12, 176–184. doi: 10.15886/j.cnki.rdswxb.2021.02.006
McDowell, R. W., and Sharpley, A. N. (2001). Soil phosphorus fractions in solution: inffuence of fertiliser and manure, ffltration and method of determination. Chemosphere. 45, 737–748. doi: 10.1016/S0045-6535(01)00117-5
Mulvaney, R. L., and Khan, S. A. (2001). Diffusion methods to determine different forms of nitrogen in soil hydrolysates. Soil Sci. Soc. Am. J. 65, 1284–1292. doi: 10.2136/sssaj2001.6541284x
Nauta, J. F., Hummel, Y. M., Tromp, J., Ouwerkerk, W., van der Meer, P., Jin, X., et al. (2020). Concentric vs. eccentric remodelling in heart failure with reduced ejection fraction:Clinical characteristics, pathophysiology and response to treatment. Eur. J. Heart Fail. 22, 1147–1155. doi: 10.1002/ejhf.1632
Nie, X., Wang, D., Chen, Y., Yang, L., and Zhou, G. (2022). Storage, distribution, and associated controlling factors of soil total phosphorus across the Northeastern Tibetan Plateau Shrublands. J. Soil Sci. Plant Nutr. 22, 2933–2942. doi: 10.1007/s42729-022-00857-1
Opik, M., Vanatoa, A., Vanatoa, E., Moora, M., Davison, J., Kalwij, J. M., et al. (2010). The online database MaarjAM reveals global and ecosystemic distribution patterns in arbuscular mycorrhizal fungi (Glomeromycota). New Phytol. 188, 223–241. doi: 10.1111/j.1469-8137.2010.03334.x
Pereira, C. M. R., da Silva, D. K. A., de Almeida Ferreira, A. C., Goto, B. T., and Maia, L. C. (2014). Diversity of arbuscular mycorrhizal fungi in Atlantic forest areas under different land uses. Agric. Ecosyst. Environ. 185, 245–252. doi: 10.1016/j.agee.2014.01.005
Qi, L., Liang, C., Mao, C., Qin, X., Fan, S., Du, W., et al. (2014). Species composition and geographic elements of the tropical lowland secondary rain forest of Ganshenling, Hainan Island, China. Chin. J. Ecol. 33, 922–929.
Reyes, H. A., Ferreira, P. F. A., Silva, L. C., Costa, M. G., Nobre, C. P., Gehring, C., et al. (2019). Arbuscular mycorrhizal fungi along secondary forest succession at the eastern periphery of Amazonia: Seasonal variability and impacts of soil fertility. Appl. Soil Ecol. 136, 1–10. doi: 10.1016/j.apsoil.2018.12.013
Rillig, M. C., Aguilar-Trigueros, C. A., Bergmann, J., Verbruggen, E., Veresoglou, S. D., Lehmann, A., et al. (2015). Plant root and mycorrhizal fungal traits for understanding soil aggregation. New Phytol. 205, 1385–1388. doi: 10.1111/nph.13045
Schloss, P. D., Westcott, S. L., Ryabin, T., Hall, J. R., Hartmann, M., Hollister, E. B., et al. (2009). Introducing mothur: Open-source, platform-independent, community-supported software for describing and comparing microbial communities. Appl. Environ. Microbiol.75, 7537–7541. doi: 10.1128/AEM.01541-09
Shao, S., Zhao, Y., Zhang, W., Hu, G., Xie, H., Yan, J., et al. (2017). Linkage of microbial residue dynamics with soil organic carbon accumulation during subtropical forest succession. Soil Biol. Biochem. 114, 114–120. doi: 10.1016/j.soilbio.2017.07.007
Shi, G., Yang, Y., Liu, Y., Uwamungu, J. Y., Liu, Y., Wang, Y., et al. (2022). Effect of Elymus nutans on the assemblage of arbuscular mycorrhizal fungal communities enhanced by soil available nitrogen in the restoration succession of revegetated grassland on the Qinghai-Tibetan Plateau. Land Degrad. Dev. 33, 931–944. doi: 10.1002/ldr.4201
Sirova, D., Barta, J., Simek, K., Posch, T., Pech, J., Stone, J., et al. (2018). Hunters or farmers? Microbiome characteristics help elucidate the diet composition in an aquatic carnivorous plant. Microbiome. 6, 225. doi: 10.1186/s40168-018-0600-7
Šmilauer, P., Košnar, J., Kotilínek, M., and Šmilauerová, M. (2020). Contrasting effects of host identity, plant community, and local species pool on the composition and colonization levels of arbuscular mycorrhizal fungal community in a temperate grassland. New Phytol. 225, 461–473. doi: 10.1111/nph.16112
Šmilauer, P., Košnar, J. K., Kotilínek, M., Pecháčková, S., and Šmilauerová, M. (2021). Host age and surrounding vegetation affect the community and colonization rates of arbuscular mycorrhizal fungi in a temperate grassland. New Phytol. 232, 290–302. doi: 10.1111/nph.17550
Szefer, P., Molem, K., Sau, A., and Novotny, V. (2020). Impact of pathogenic fungi, herbivores and predators on secondary succession of tropical rainforest vegetation. J. Ecol. 108, 1978–1988. doi: 10.1111/1365-2745.13374
Vasconcellos, R. L. F., Segat, J. C., Bonfim, J. A., Bonfim, J. A., Baretta, D., Cardoso, E. J. B. N., et al. (2013). Soil macrofauna as an indicator of soil quality in an undisturbed riparian forest and recovering sites of different ages. Eur. J. Soil. Biol. 58, 105–112. doi: 10.1016/j.ejsobi.2013.07.001
Wang, Y., Liu, K., Wu, Z., and Jiao, L. (2020). Comparison and analysis of three estimation methods for soil carbon sequestration potential in the Ebinur Lake Wetland, China. Front. Earth Sci. 14, 13–24. doi: 10.1007/s11707-019-0763-y
Waring, B. G., Averill, C., and Hawkes, C. V. (2013). Differences in fungal and bacterial physiology alter soil carbon and nitrogen cycling: insights from meta-analysis and theoretical models. Ecol. Lett. 16, 887–894. doi: 10.1111/ele.12125
Xue, L., Ren, H., Li, S., Leng, X., and Yao, X. (2017). Soil bacterial community structure and co-occurrence pattern during vegetation restoration in karst rocky desertification area. Front. Microbiol. 8, 2377. doi: 10.3389/fmicb.2017.02377
Ye, J., McGinnis, S., and Madden, T. L. (2006). BLAST: improvements for better sequence analysis. Nucleic Acids Res. 34, W6–W9. doi: 10.1093/nar/gkl164
Zangaro, W., Alves, R. A., Lescano, L. E., Ansanelo, A. P., and Nogueira, M. A. (2012). Investment in fine roots and arbuscular mycorrhizal fungi decrease during succession in three Brazilian ecosystems. Biotropica. 44, 141–150. doi: 10.1111/j.1744-7429.2011.00781.x
Zhang, J., Quan, C., Ma, L., Chu, G., Liu, Z., Tang, X., et al. (2021). Plant community and soil properties drive arbuscular mycorrhizal fungal diversity: A case study in tropical forests. Soil Ecol. Lett. 3, 52–62. doi: 10.1007/s42832-020-0049-z
Zhang, M., Shi, Z., Xu, X., Xu, X., and Wang, X. (2022). Arbuscular Mycorrhizal Fungi Associated with Roots Reveal High Diversity Levels at Different Elevations in Tropical Montane Rainforests. Diversity. 14, 587. doi: 10.3390/d14080587
Keywords: arbuscular mycorrhizal fungi, succession stages, soil physicochemical properties, tropical lowland rainforest, Nature Reserve of Ganshenling
Citation: Yang H, Mai S, Liu W, Fu J, Yang Q, Zhang B and Huang B (2023) Variations of arbuscular mycorrhizal fungi following succession stages in a tropical lowland rainforest ecosystem of South China. Front. Ecol. Evol. 11:1125749. doi: 10.3389/fevo.2023.1125749
Received: 16 December 2022; Accepted: 26 January 2023;
Published: 23 February 2023.
Edited by:
Xiang Liu, Lanzhou University, ChinaReviewed by:
Xinwei Guo, Chinese Academy of Tropical Agricultural Sciences, ChinaYi Ding, Chinese Academy of Forestry, China
Copyright © 2023 Yang, Mai, Liu, Fu, Yang, Zhang and Huang. This is an open-access article distributed under the terms of the Creative Commons Attribution License (CC BY). The use, distribution or reproduction in other forums is permitted, provided the original author(s) and the copyright owner(s) are credited and that the original publication in this journal is cited, in accordance with accepted academic practice. No use, distribution or reproduction is permitted which does not comply with these terms.
*Correspondence: Bin Zhang,  YWwzMzI1MDE1NzVAMTYzLmNvbQ==; Biao Huang,
  aHVhbmdiaWFvQGljYnIuYWMuY24=
†These authors have contributed equally to this work and share first authorship
 Huai Yang
 Siwei Mai
 Wenjie Liu
 Jialin Fu3
 Qiu Yang