- 1School of Civil Engineering, Chang’ an University, Xi’an, China
- 2Key Laboratory of Hydraulic and Waterway Engineering of the Ministry of Education, Chongqing Jiaotong University, Chongqing, China
- 3State Key Laboratory of Geomechanics and Geotechnical Engineering, Institute of Rock and Soil Mechanics, Chinese Academy of Sciences, Wuhan, China
In the construction project, rock mass is often destroyed from the joint plane, and the jointed rock mass is easy to be eroded by freeze-thaw environment. Therefore, the damage mechanical properties of filled jointed rock mass under freeze-thaw action are very important for construction disaster prevention, engineering safety evaluation and reinforcement. In order to research the effect of the freeze-thaw cycle on the mechanical deterioration properties and damage characteristics of filled jointed rocks, prefabricated filled jointed rock samples are tested with different numbers of freeze-thaw cycles under the temperature range of -20°C~20°C. Then the wave velocity test, static compression test and SHPB impact test are conducted on the rock samples after freeze-thaw. Based on the test results, the change regularity of wave velocity degradation, static compression mechanical properties and dynamic compression mechanical properties of filled jointed rocks under the effect of freeze-thaw cycles were analyzed. The results show that the wave velocity, static compressive strength and dynamic compressive strength of the filled jointed rocks all show a downtrend with the increase of the number of freeze-thaw cycles, and each parameter is positively correlated with the strength of the filling materials. Among them, the decrease in the wave velocity of the rock sample after 30 freeze-thaw cycles is greater than 30%, and the strength loss of the static peak compressive strength exceeds half of its initial strength. The static peak strain rises exponentially with the increase of the number of freeze-thaw cycles while the dynamic peak strain does not show a clear trend. The dynamic peak strain is about 1/10 to 1/5 of the static peak strain. Under the same freeze-thaw action, the lower the strength of filling material, the more serious the damage.
1 Introduction
With the development needs of human construction, more and more engineering projects need to be constructed in high-altitude and cold regions. Among them, a large number of engineering activities, such as water conservancy and hydropower engineering, nuclear power engineering, deep underground engineering, rock mass tunnel engineering, etc., will inevitably involve the rock mass affected by freezing and thawing. There are a large number of filled joints in natural rock mass. The low strength and large deformation characteristics of filling joints will change the strength of the whole rock mass and increase the instability of engineering rock mass (Singh et al., 2002). In practical engineering, the stress wave generated by dynamic loads such as blasting and earthquake will cause the normal and tangential deformation along the filled joint surface when acts on the filled jointed rock mass, resulting in obvious changes in the mechanical properties of the jointed rock mass (Li and Ma, 2009). The damage and deterioration of filled jointed rock subjected to freeze-thaw cycle for a long time will pose a great threat to the dynamic stability of rock mass engineering. Therefore, it is of great significance to study the mechanical properties of rock filled with joints under freeze-thaw cycles and the propagation law of stress waves in jointed rock mass for stability evaluation and safety protection of rock mass engineering in cold regions.
At present, freeze-thaw cycling tests mainly focus on intact and fractured rocks on their mechanical and degradation characteristics, such as the influencing factors of rock freezing-thawing damage, deterioration mode of rock damage, and microstructure of freezing-thawing rock and mechanical properties of rock. For example, in view of the huge differences in the properties of various rocks, some researchers have carried out experimental study on the effects of different rock types on freeze-thaw damage, and obtained the conclusion that the freeze-thaw durability of igneous rock, sedimentary rock and metamorphic rock is generally reduced in turn (Matsuoka, 1990; Yang et al., 2021). Besides, the freeze-thaw durability of the same rock has been confirmed to decrease with the aggravation of weathering (Deng et al., 2014a). As for the influence of freeze-thaw action on rock characteristics, the research results show that with the increase of freeze-thaw cycle times, the damage of rock will accumulate continuously, but the cumulative damage of rock with high strength is not obvious (Nicholson and Nicholson, 2000; Tan et al., 2011; Qiao et al., 2021).
A number of researches on rock freeze-thaw failure show that the damage and deterioration modes can be roughly divided into falling mode, crack mode and particle loss mode (exfoliation mode) (Xu, 2006; Tan et al., 2011; Li et al., 2017; Deng et al., 2014b). Further analysis shows that the rocks with low strength and high porosity, such as red sandstone and silty mudstone, mostly show the falling mode under the influence of freeze-thaw. Rocks with high strength and low porosity, such as shale, diabase and granite, are mainly show the crack mode. Rocks whose surface is easily softened by water, such as argillaceous siltstone and dolomitic limestone under acidic conditions, show the particle loss mode. In terms of micro view, researchers have conducted experimental exploration on the relationship between rock freezing-thawing damage and porosity by means of scanning electron microscopy, CT scanning and nuclear magnetic resonance (Li et al., 2022; Zhang et al., 2022; Liu et al., 2023; Jiang et al., 2019; Mousavi et al., 2020; Wang et al., 2020). The results show that the more freeze-thaw cycles, the greater the porosity and damage degree of rock samples.
The research on the damage mechanical properties of rock under freeze-thaw cycle is mainly based on the static mechanical tests. For example, through uniaxial or triaxial compression experiments on rock samples under freeze-thaw cycle, it has been found that the compressive strength, peak strain, elastic modulus and other mechanical parameters of rocks show an exponential function or quadratic function attenuation trend with the number of freeze-thaw cycles (Tan et al., 2011; Li et al., 2017; Deng et al., 2019; Lu et al., 2019; Fan et al., 2020; Mousavi et al., 2020). Based on these, some researchers have established a constitutive model with the number of freezing-thawing cycles and strain as control variables on the basis of damage mechanics theory (Zhang and Yang, 2010; Bayram, 2012; Huang et al., 2018; Li et al., 2021a).
In terms of dynamic mechanical properties, the dynamic test of the rock after freezing and thawing is mainly carried out by using the split Hopkinson compression bar device which is suitable for the study of dynamic mechanical properties of various brittle materials at high strain rate (Li et al., 2021b; Liu et al., 2022; Zhao et al., 2022). For example, Wang et al. (2016a) and Wang et al. (2016b) explored the dynamic characteristics of freezing-thawing red sandstone under different strain rates through SHPB test. The results show that the decrease of peak strength and dynamic elastic modulus under the impact test gradually with the increase of freeze-thaw action, while the peak strength and shear strength are positively correlated with the strain rate. In addition, the compressive strength and elastic modulus decrease more obviously under dynamic impact than under static load. For homogeneous sandstone, Zhou et al. (2015) carried out experimental study by nuclear magnetic resonance test and SHPB impact test to reveal that the higher the porosity, the more serious the dynamic strength degradation will be under freezing-thawing action, and the relationship between porosity and dynamic peak strength is polynomial. Yi et al. (2020) found that the dynamic mechanical indexes of sandstone deteriorated after freezing-thawing cycles, and the cumulative damage inside rock samples grew slowly when the number of freezing-thawing cycles is large. In addition, some scholars have observed the failure characteristics of rock samples during dynamic impact with the help of high-speed cameras. For example, Zhou et al. (2018) used high-speed cameras to study the crack propagation and failure mode of intact sandstone samples after dry-wet cycles during dynamic tensile process. Su et al. (2021) found that the final failure modes of sandstone with different dip angles were different in the dynamic compression test of filling weak through jointed sandstone by means of high-speed camera. With the increase of joint dip angle, the failure order of the sample changed from the first failure of filling weak joints in the middle to the first failure of rocks on both sides.
At present, there are many studies on the mechanical properties of intact or fractured rocks under freeze-thaw cycle, but there are few studies on the mechanical properties of jointed rocks under freeze-thaw cycle. Moreover, the influence of external factors such as freeze-thaw cycle has not been considered in the study of dynamic characteristics and wave propagation law of filled rock joints. In recent years, more and more attention has been paid to the research on dynamic characteristics of filled rock joints. The static and dynamic characteristics, stress wave propagation law, energy loss and other important characteristics of filled joints are gradually revealed by wave propagation theory, numerical simulation and rock test (Li et al., 2014; Huang et al., 2015; Liu et al., 2017; Chai et al., 2020a; Chai et al., 2020b; Jia et al., 2021). In terms of experimental research, Chai et al. (2020a) studied the mechanical properties of filled jointed rock under cumulative impact, including static and dynamic characteristics, and comprehensively considered the effects of filling materials and joint thicknesses. Based on this, the cumulative damage characteristics of filled joints under multiple impacts and the energy dissipation law under dynamic loading were studied by means of a self-made cumulative impact device (Chai et al., 2020b). However, the damage characteristics of filled jointed rock under environmental action such as freeze-thaw cycle have not been studied yet.
In view of the unclear mechanical characteristics of freeze-thaw damage of filled joints, on the basis of previous studies (Chai et al., 2020a; Chai et al., 2020b), this paper presents static and dynamic compression experimental study on prefabricated artificial jointed rock samples pretreated under different freeze-thaw cycles. The variation law of static and dynamic mechanical parameters and failure characteristics of filled jointed rock samples under the action of freeze-thaw cycle are studied and analyzed, and the propagation characteristics of stress wave in filled rock samples are further analyzed.
2 Test profile
2.1 Sample preparation
Due to the complex distribution and varying thickness of filled joint layer in natural rock mass, it is difficult to prepare the same type of rock samples in batches, which is not conducive to the single factor analysis. Therefore, in this test, the granite with good lithology and the mortar with similar properties to the joint filling layer are used to prepare the filled jointed rocks by artificial combination. As the weak layer of rock mass, the physical and mechanical properties of joint layer are generally lower than that of rock blocks on both sides. In the previous research work of our research group (Chai et al., 2020a; Chai et al., 2020b), four kinds of filling joint rock samples with different filling materials, cement mortar, lime mortar, gypsum mortar and sediment mortar, were prepared to simulate the filling joints with different characteristics in practice. In this paper, only the filling joint rock with lime mortar is selected as the object for research. In order to reflect the diversity of the filling layer, three filling mortars with different mix proportions are used in this test. The mortar proportion and the mortar strength are shown in Table 1.
The preparation method of the filled jointed rock samples remained the same as in the previous studies (Chai et al., 2020b). In the preparation process, firstly, the granite is processed into cylindrical test blocks with a diameter of 50 mm and a height of 15 mm, and one end of each test block is polished to ensure that the roughness of the end faces of each test block is the same. At the same time, six grooves are cut at equal spacing on this end to form three horizontal and three vertical grooves with a depth of 1 mm and a width of 2 mm. Then the filling mortar is prepared according to the mortar proportion in Table 1. Finally, the two test blocks are placed face-to-face with the grooves aligned with each other and filled with the filling mortar with a thickness of 5 mm. After the sample preparation, a wave velocity tester is used to screen the rock samples and eliminate those with large differences in wave velocity. In addition, in order to reduce the influence of external factors on the rock samples, parallel tests are used for each part of the process, and three samples are used as one group.
The prepared filled jointed rocks are maintained under standard curing conditions for 28 days. The cured rock samples are dried in an oven at 60°C for 12 h, and then immersed in a distillation tank for 12 h until the rock samples are naturally saturated. After that, the water-saturated rock samples are put into a rapid freeze-thaw cycle test chamber for the freeze-thaw cycle test. The freeze-thaw cycle test parameters are set as follows: -20°C freezing for 4 h, 20°C thawing for 4 h. Under this condition, 0, 1, 5, 10, 15, 20 and 30 freeze-thaw cycles are carried out in groups, as shown in Figure 1.
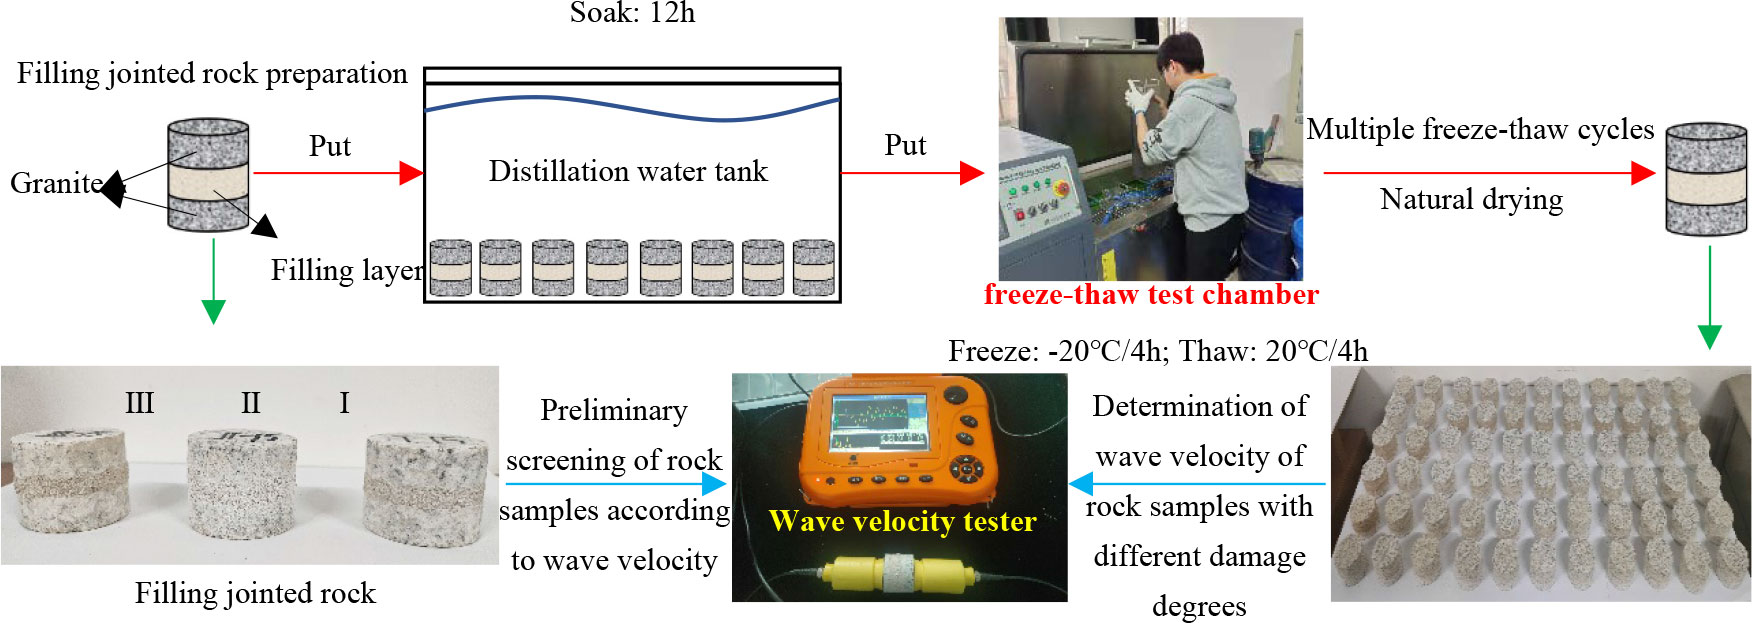
Figure 1 Fabrication and freeze-thaw cycle test process of jointed rock samples of three filling materials.
2.2 Experimental equipment
After the freeze-thaw cycles of the rock samples, the NN-4B nonmetallic ultrasonic testing analyzer is used to test the wave velocity of the filled jointed rock after different freeze-thaw cycles. The wave velocity tester is shown in Figure 1. During the measurement, Vaseline is applied to the surface of both sides of the rock sample. Multiple wave velocity tests are conducted to eliminate the results with large variance, and the average of three valid wave velocity values is taken as the effective measurement result of wave velocity.
In order to find out the change regularity of mechanical properties of rock samples after freeze-thaw cycles, the WAW31000 microcomputer-controlled electro-hydraulic servo universal testing machine and SHPB testing device are used to conduct static compression tests and dynamic impact tests on rock samples under the accumulated damage of different freeze-thaw cycles, as shown in Figure 2. The static compression test is performed by controlling the load to achieve compression damage to the rock samples at a rate of 50 N/s. The dynamic impact test is performed with a Split Hopkinson Pressure Bar (SHPB), which is mainly composed of an incident bar, a transmission bar and an absorption bar. The diameter of the bars is 50 mm, the elastic modulus is 210 GPa, Poisson ratio is 0.25, the longitudinal wave speed is 5172 m/s, and the density is 7800 kg/m3. The length of the impact bar, the incident bar and the transmission bar respectively are 0.3 m, 3.7 m and 2.5 m, respectively. In order to reduce the superposition effect of the incident and reflected waves, the strain gauges on the incident and transmission bars are pasted at 1 m and 0.5 m away from the surface of the sample, and the method of symmetrical pasting is adopted to improve the test accuracy. The dynamic impact pressure is set to 0.15 MPa, and 0.15mm thick copper sheet is used as pulse shaper. The FASTCAM Mini UX high-speed camera is used to record the damage process of the rock samples during the dynamic impact.
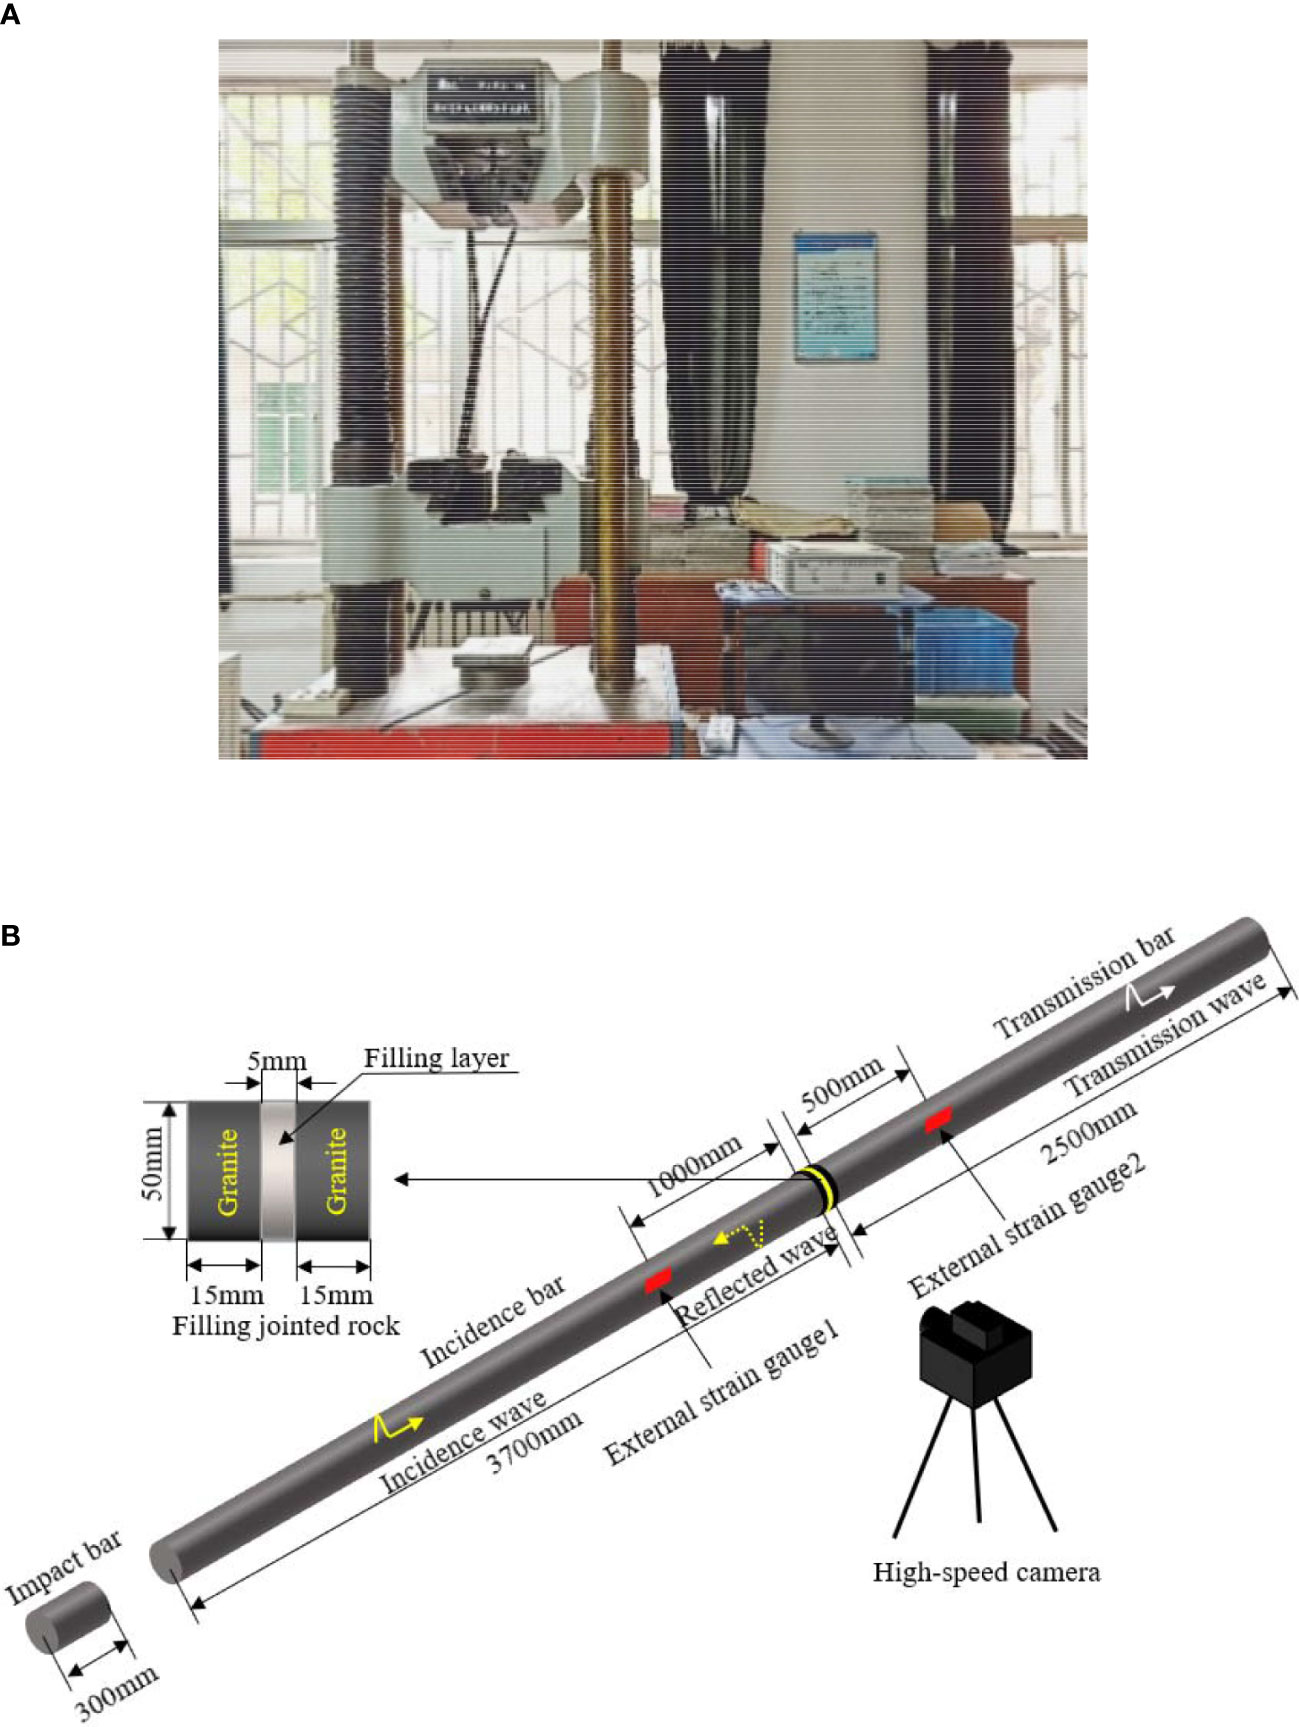
Figure 2 Static and dynamic compression mechanical characteristic test instrument: (A) WAW31000 universal testing machine; (B) diagram of SHPB test device.
3 Analysis of test results
3.1 Damage regularity of filled jointed rocks under the freeze-thaw action
Under the action of freeze-thaw cycles, the pores and fractures inside the filled jointed rocks continue to develop and expand, causing irreversible damage to the rocks. The macroscopic performance of the cumulative damage is the deterioration of wave velocity, elastic modulus, density, strain and other parameters of rock samples. In this study, the wave velocity is used as a macroscopic parameter to describe the damage and deterioration of the filled jointed rocks. The average wave velocity values are shown in Table 2.
It can be seen from Table 2 that with the increase of the number of freeze-thaw cycles, the wave velocity values of the filled jointed rocks continue to decrease. The wave velocities of the three types of filled rock samples have decreased by 34.02%, 42.03% and 30.95% respectively after 30 freeze-thaw cycles, indicating that the freeze-thaw cycles have a greater impact on the damage and deterioration of the filled jointed rocks. This is because under the freeze-thaw action, a large number of fissures and cracks are produced inside the filled jointed rocks, which leads to a more complex ultrasonic wave propagation path and reduces the wave propagation velocity.
Under the action of the same freeze-thaw cycles times, the wave velocity relationship of the three types of filled jointed rocks is vIII>vI>vII. Considering the initial strength of the filling materials, it is found that the wave velocity value of the filled jointed rocks is positively correlated with the strength of the filling materials. The main reason is that the greater the strength of the filling materials is, the better the overall stability of the rock samples, and the slower the deterioration rate of the rock samples under the action of the same freeze-thaw cycles, as well as the higher the wave velocity. To further analyze the damage and deterioration regularity of freeze-thaw cycles on the filled jointed rocks, the damage degree Dn from the reference was cited as (Chai et al., 2020b):
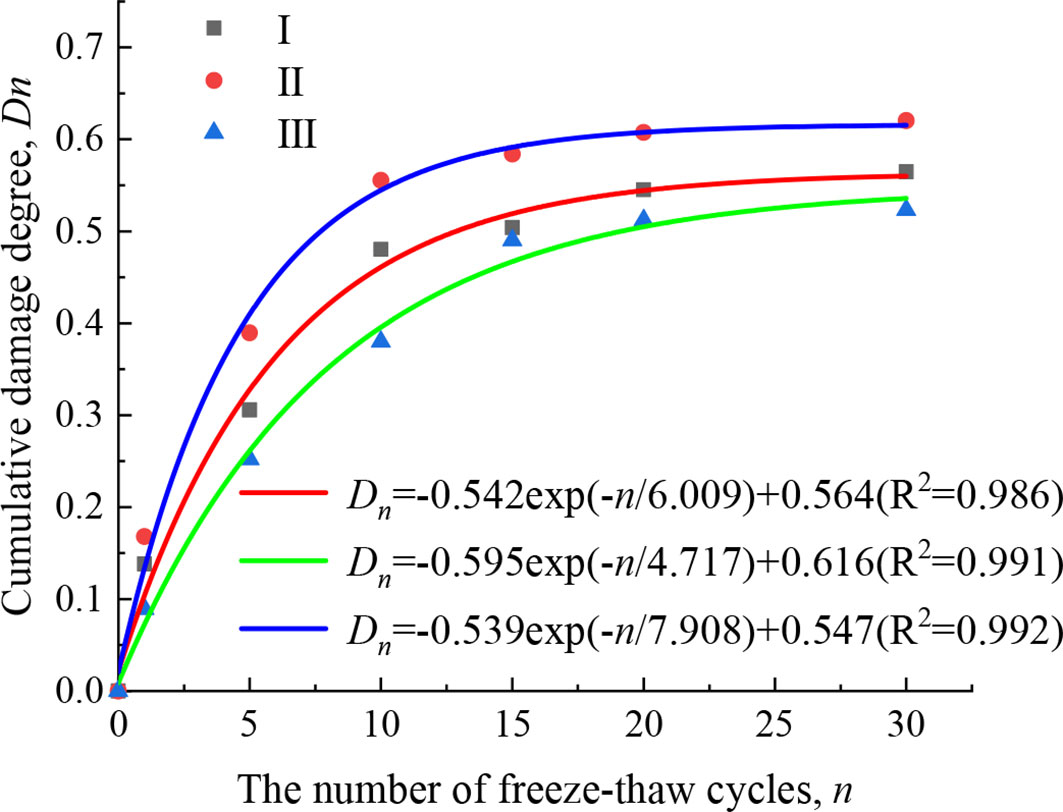
where vn is the wave velocity value of the filled jointed rock after n times freeze-thaw cycles, and v0 is the wave velocity value of the rock samples without the freeze-thaw cycles. By substituting the wave velocity values in Table 2 into Eq. (1), the accumulated damage of three types of filled jointed rocks under different freeze-thaw cycles times can be calculated, as shown in Figure 3.
As shown in Figure 3, the cumulative damage degree of the three types of filled jointed rocks increases nonlinearly with the increase of the number of freeze-thaw cycles, indicating that the damage caused by the freeze-thaw action of the jointed rock sample is a continuous cumulative process. This is mainly due to the fact that water inside the pores of water-saturated rock samples freezes into ice under low-temperature conditions, and the frost heaving force generated by the water-ice phase change react on the pores and fractures. When the frost heaving force exceeds the tensile strength of the rock matrix, it will promote the further development of pores and cracks, and the migration of free water in the new cracks during the melting process will lead to the further expansion of cracks. The jointed filling layer is formed by the weathering of rocks, and the number of internal pores and fissures is much more than that of the rocks on both sides. Hence, the water content in the filling layer in the saturated state is more than that of the rocks on both sides. During the freeze-thaw cycle, the frost heaving force generated by the water ice phase change in the filling layer is greater than that of the rocks on both sides. The frost heaving force in the filling layer partially promotes the development of cracks, and partially acts on the rocks on both sides, further leading to the reduction of the integrity of the joint layer and even damage.
In addition, the slope of the curve in the Figure 3 is greater in the early stage than in the middle and late stage, showing a gradual decreasing trend, indicating that the damage and deterioration rate of the jointed rock samples in the early stage of the freeze-thaw is greater than in the middle and late stage. It reflects the rapid development of pores and fractures in the rock samples at the early stage of the freeze-thaw, accelerating the damage and deterioration of the filling layer. However, the sensitivity of the rock samples to the damage and deterioration gradually decrease in the middle and late stage of the freeze-thaw.
By fitting the curves, it is found that the fitting function is the same as the damage function in the reference (Chai et al., 2020b), and the curve fitting degree is high, indicating that the model is applicable to the evaluation of accumulative damage of filled jointed rocks under the freeze-thaw action, expressed as:
where α, β, γ are fitting coefficients, and n is the number of freeze-thaw cycles. According to the change rule of each value of the curve, it is found that α, β and γ in the formula are related to the filling materials. More specifically, α and β are negatively correlated with the filling strength, while γ is positively correlated with the filling strength. According to this formula, the damage degree of the filled jointed rocks under the action of different number of freeze-thaw cycles can be calculated.
3.2 Analysis of the static uniaxial compressive strength deterioration
The static stress-strain curves of the rock samples can be obtained by the uniaxial compression test on the filled jointed rocks under different times of freeze-thaw cycles, as shown in Figure 4.
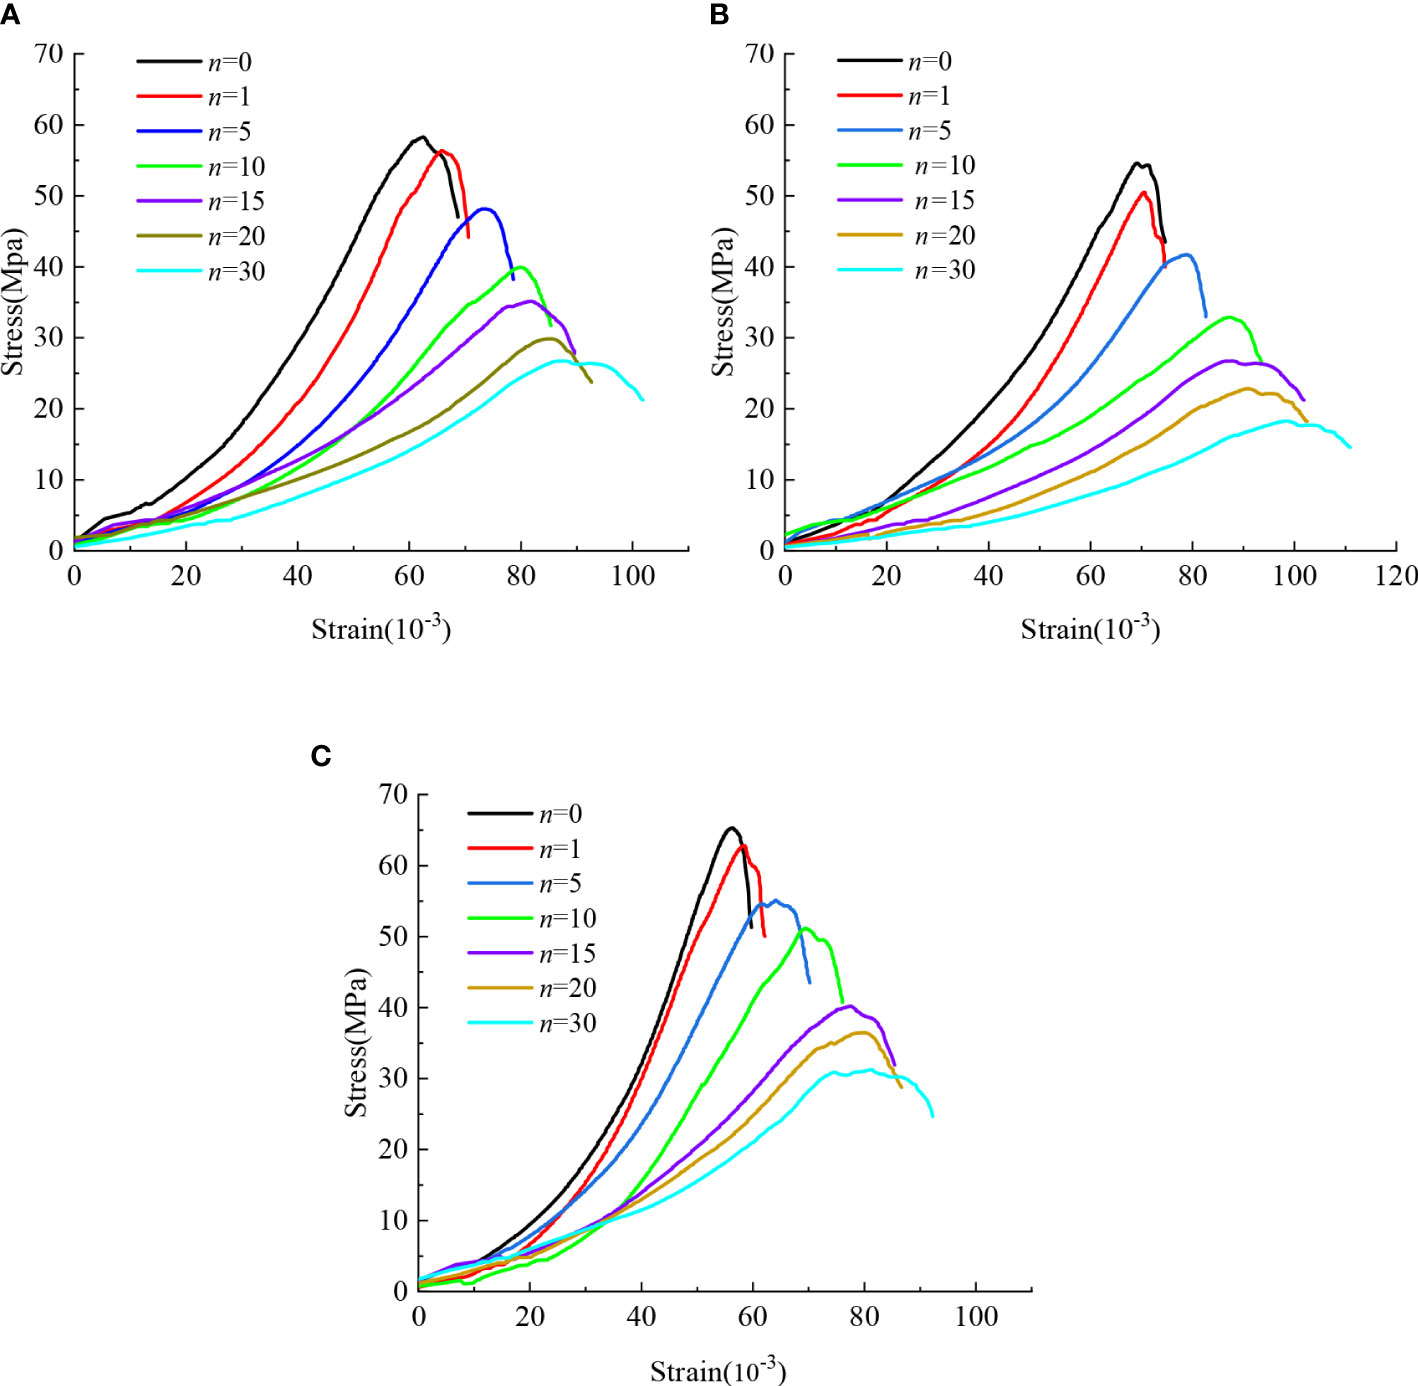
Figure 4 Static stress-strain curves of three kinds of jointed rock: (A) type I filling jointed rock; (B) type II filling jointed rock; (C) type III filling jointed rock.
From Figure 4, it can be seen that the stress-strain curves of the three filled jointed rocks have similar trends, and the curves move downward to the right with the increase of the number of freeze-thaw cycles. Based on the previous research results (Chai et al., 2020b), the static compression process of rock samples is divided into four stages: the compaction stage, the elastic stage, the plastic yielding stage, and the destruction stage. For the rock samples with same filling material, with the increase of the number of freeze-thaw cycles, the compaction stage of the curve gradually lengthens, and the slope in the elastic stage of the curve gradually decreases. At the same time, there is an obvious plastic yielding stage, and the decline rate in the destruction stage becomes slower.
To further study the static properties of the filled jointed rocks under the freeze-thaw, the static peak compressive strength corresponding to each condition is obtained from Figure 4, and the results are shown in Table 3. From the Table 3, it can be seen that the compressive strength of rock samples corresponding to the same number of freeze-thaw cycles is: Type III > Type I > Type II. This is because the filling layer, as the weak layer of the rock samples, has a “barrel effect” on the compressive strength of the rock samples. From a material perspective, the filling materials of type I and type II both are mixed with lime, sand and water, and under the premise of consistent lime content, the sand content of type I is greater than that of type II. The combination of fine sand as a fine aggregate material and a cementitious material (lime) greatly increases the friction between material particles, so the stability of Type I filling material is higher than that of Type II filling material. For the jointed rock samples of type I and type III, on the condition of the same sand content, the filling materials of type III contain part of clay, which enhances the cohesion among the particles of each material, so the stability of type III is higher than that of type I and type II.
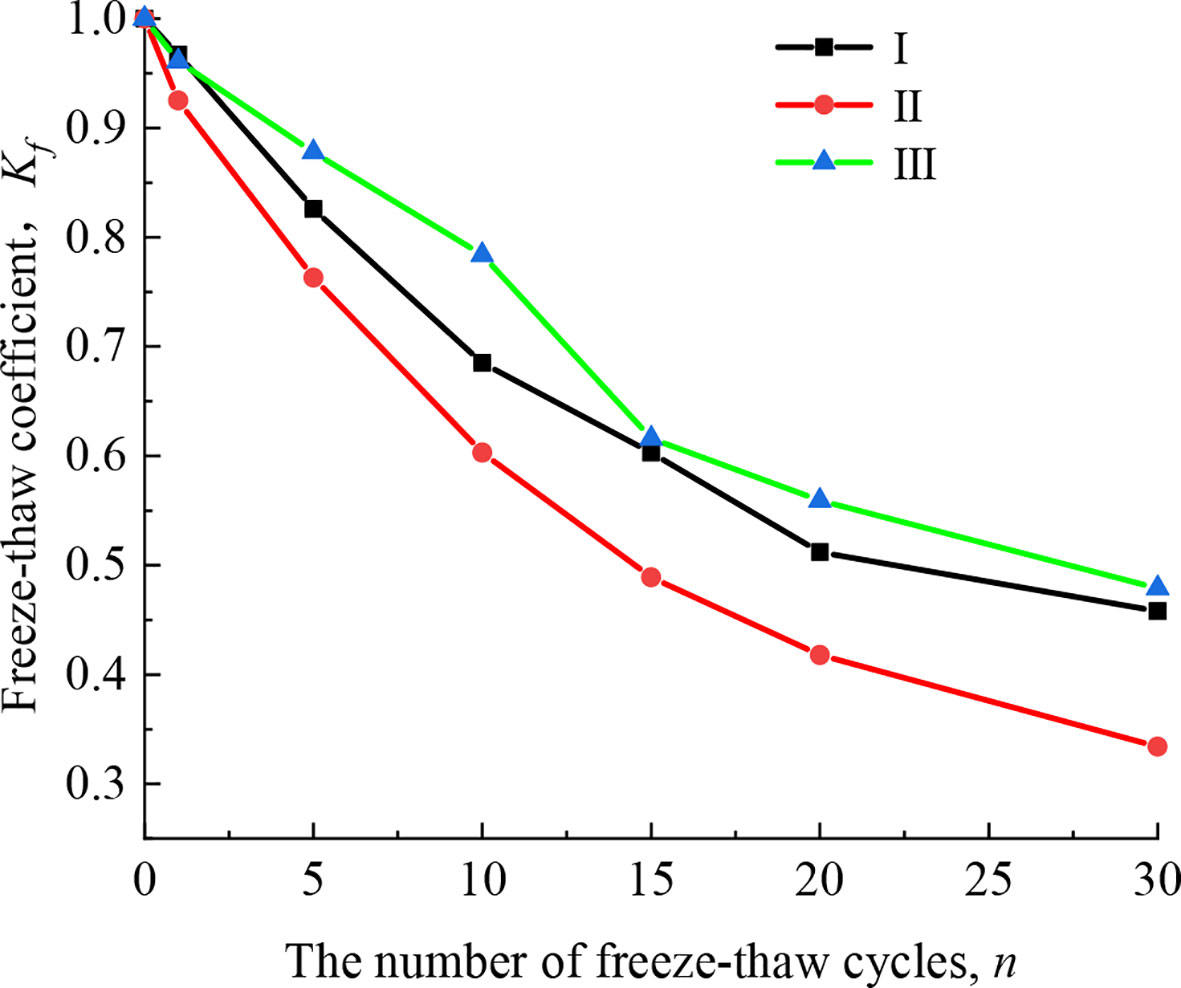
The decreasing trend of static peak compressive strength of the three types of filled jointed rocks is similar: first decreasing sharply and then decreasing at a slower rate. For example, after 15 freeze-thaw cycles, the strength of type II filled jointed rock decreased the most by 51.1%; type I is the followed by 39.7%; type III has the smallest strength loss rate of 38.4%, accounting for 3/4 of the strength loss during the its full freeze-thaw cycle. After 30 freeze-thaw cycles, the peak compressive strengths of the three types of filled jointed rocks are respectively 45.8%, 33.4%, and 47.9% of those before the freeze-thaw cycles, with strength loss rates greater than 50%. To better present the change regularity of compressive strength with the number of freeze-thaw cycles, the freeze-thaw coefficient is adopted and is expressed as:
where Rs and Rf are the uniaxial saturated compressive strengths (MPa) of the filled jointed rocks before and after the freeze-thaw cycles, respectively. The results of freeze-thaw coefficients were compared and analyzed as shown in Figure 5.
As shown in Figure 5, the freeze-thaw coefficient of the rock samples decreases nonlinearly with the increase of the number of freeze-thaw cycles, indicating that the peak compressive strength of the filled jointed rocks is deteriorating continuously. The decreasing trend of the curve can also show the damage and deterioration rate of the rock samples at each stage of the freeze-thaw.
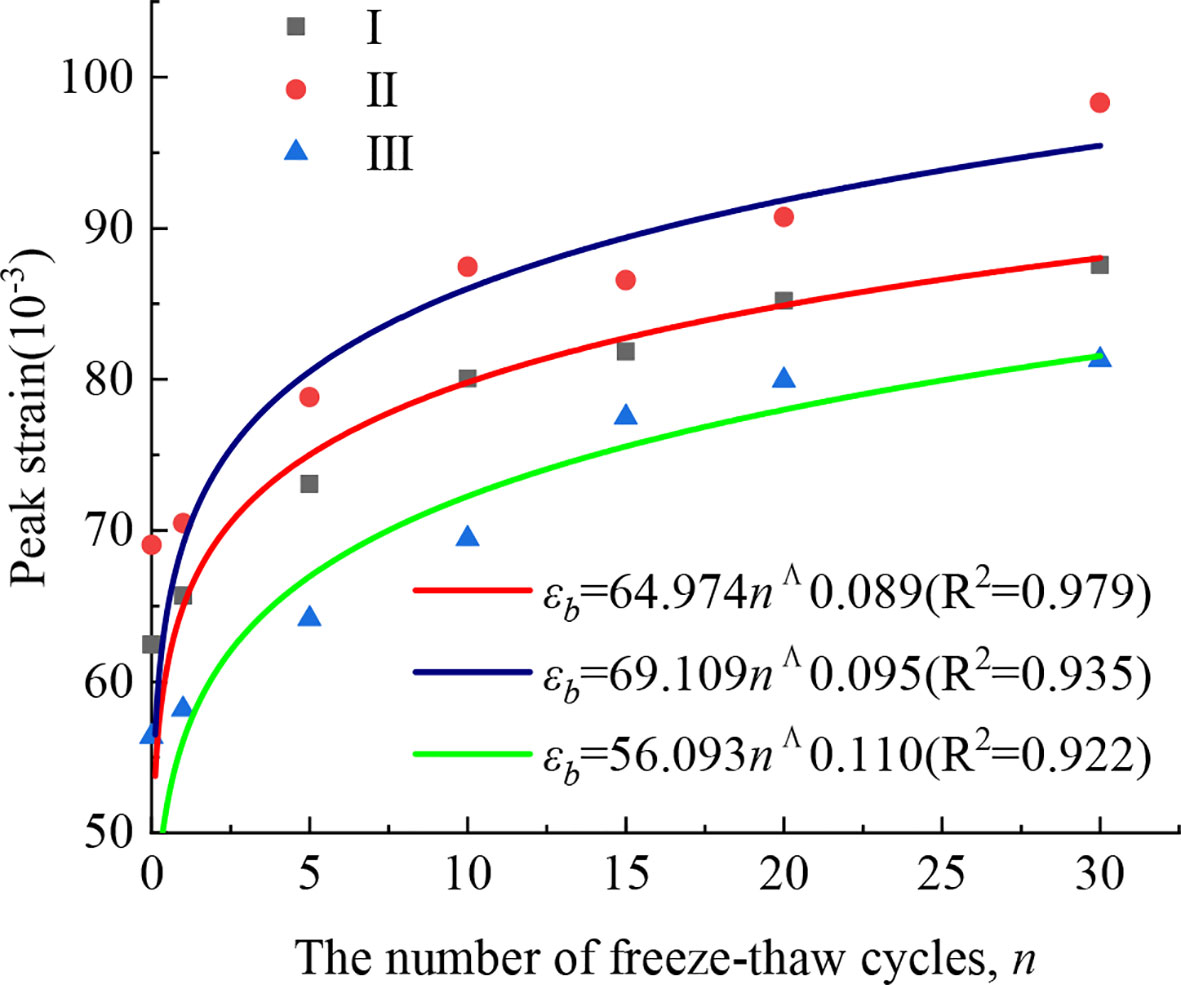
The static peak strain shows different trends, and all three types of rock samples show an increase in peak strains of more than 40% after 30 freeze-thaw cycles. The curve fitting of the peak strain under various freeze-thaw cycles is shown in Figure 6. The peak strains of the rock samples increase with the increase of the number of freeze-thaw cycles, and the growth rate of peak strains is greater in the early stage of the freeze-thaw than that in the middle and late stage. With the increase of freeze-thaw times, the deformation of the rock samples gradually tends to stabilize, and the rock samples show a trend of decreasing brittleness and increasing ductility.
The curve of static peak strains with the number of freeze-thaw cycles shown in Figure 6 can be fitted as:
where ϵb is the static peak strain; n is the number of freeze-thaw cycles; a and b are the fitting coefficients. In Eq. (4), it can be seen that the peak strains of all the three types of filled jointed rocks increases exponentially, and the fitting parameter b is greater than 0 and less than 1, indicating that the peak strains increases with the increase in the number of freeze-thaw cycles. However, with the continuous increase in the number of freeze-thaw cycles, the rising trend of peak strains becomes slower, indicating that the fracture development is gradually completed and stable after the rock samples undergoes a certain number of freeze-thaw cycles, i.e., the filled jointed rocks will not be in an endless deterioration process. By comparing the curve fitting coefficients, it is found that the coefficient a is negatively correlated with the strength of the filling layers.
From Section 4.1, it can be seen that the filled jointed rocks are in the process of continuous cumulative damage under the action of freeze-thaw cycles. The continuous deterioration of rock samples under the freeze-thaw action is further confirmed by the change regularity of static parameters of rock samples in this section. To illustrate the inherent relationship between the strength eterioration and cumulative damage, Figure 7 shows the change regularity of static peak stress and peak strain with the change of cumulative damage degree. The certain accumulated damage threshold in the Figure 7 can divide the curve into two zones (Region A and Region B) with different trends. The data points before this damage threshold are relatively discrete, and the results of the rock samples with three filling materials show significant differences. However, beyond this threshold, the results of the three types rock samples tend to be similar. Therefore, it can be inferred that the joint filling layers have been damaged after reaching this damage threshold and lost their contributions to the overall strength and deformation. Subsequently, the change regularity of peak stress and strain with the damage degree of rock samples is mainly determined by the rocks on both sides. The damage threshold in this test is about D’n=0.5.
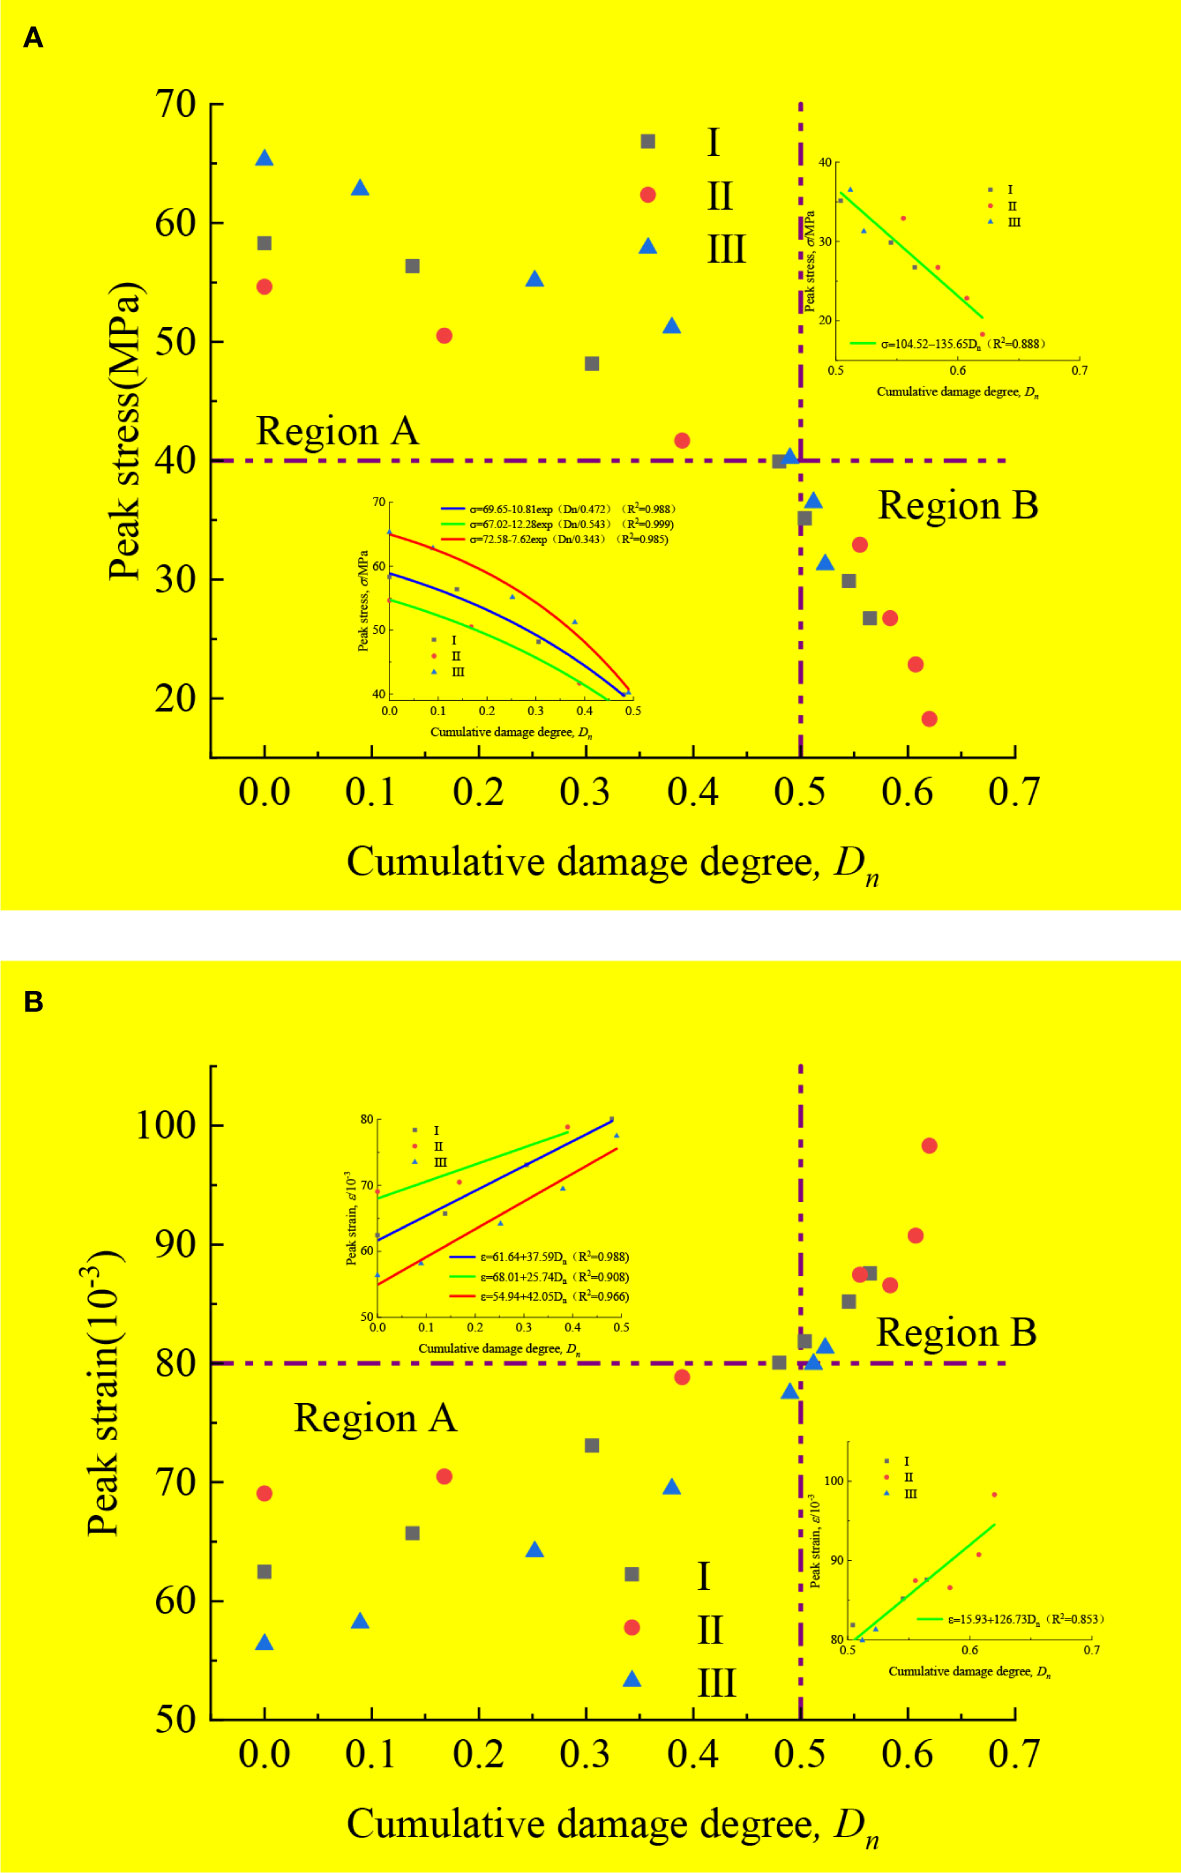
Figure 7 Variation of static peak stress and strain with cumulative damage degree: (A) peak stress-cumulative damage degree; (B) peak strain-cumulative damage degree.
By fitting the curve of Figure 7, the relationship between the peak stresses in Region A and Region B and the cumulative damage degree can be obtained as:
The fitting relations of peak strain and cumulative damage degree in the two zones are:
The fitting parameters are shown in Table 4.
Obviously, the fitting coefficients of the curve in Region A are related to the filling material properties, and α´ and b´ in this test are positively correlated with the strength of the filling layers, while β´, γ´ and a´ are negatively correlated with the strength of the filling layers. The fitting coefficients in Region B are only related to the properties of the rock on both sides.
From the perspective of failure state, after undergoing multiple freeze-thaw cycles of damage, the rock sample exhibits a trend from splitting failure to shear failure due to decreased strength and increased strain. Figure 8 shows the final damage morphology of type III rock samples with 0 and 30 freeze-thaw cycles. It is obvious that the rock sample after 30 cycles exhibits oblique cracks in a shear failure pattern.
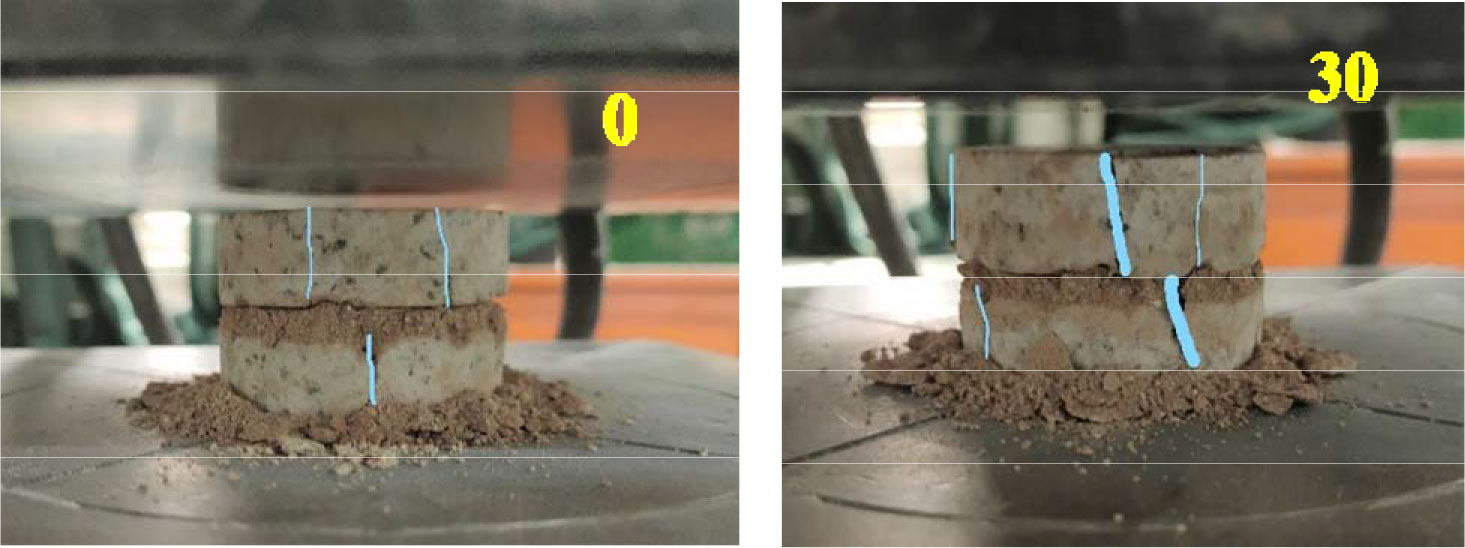
Figure 8 Static compression failure diagrams of type III rock samples with 0 and 30 freeze-thaw cycles.
3.3 Analysis of dynamic impact results
The SHPB device is used to conduct impact tests on rock samples after freezing and thawing. Referring to the three-wave method used by Bayram (Bayram, 2012), the electrical signals collected from the impact tests are converted into the stress, strain, and strain rate of the rock samples, and the dynamic stress-strain curves of each filled jointed rock under freezing and thawing cycles are further calculated, as shown in Figure 9. Compared to the static pressure curve shown in Figure 4, the slope of the dynamic stress-strain curve in the initial stage is relatively larger, mainly because the SHPB test belongs to high strain rate compression, and the impact process is completed in an instant. The deformation of the filling layers is slower than the transfer of stress. In the elastic stage, the slope of the curve (i.e., dynamic compression modulus) tends to decrease with increasing freeze-thaw action. Similarly, the slope of the curve in yielding stage decreases with increasing freeze-thaw times, indicating that the ductility of the rock samples is increasing under the freeze-thaw action.
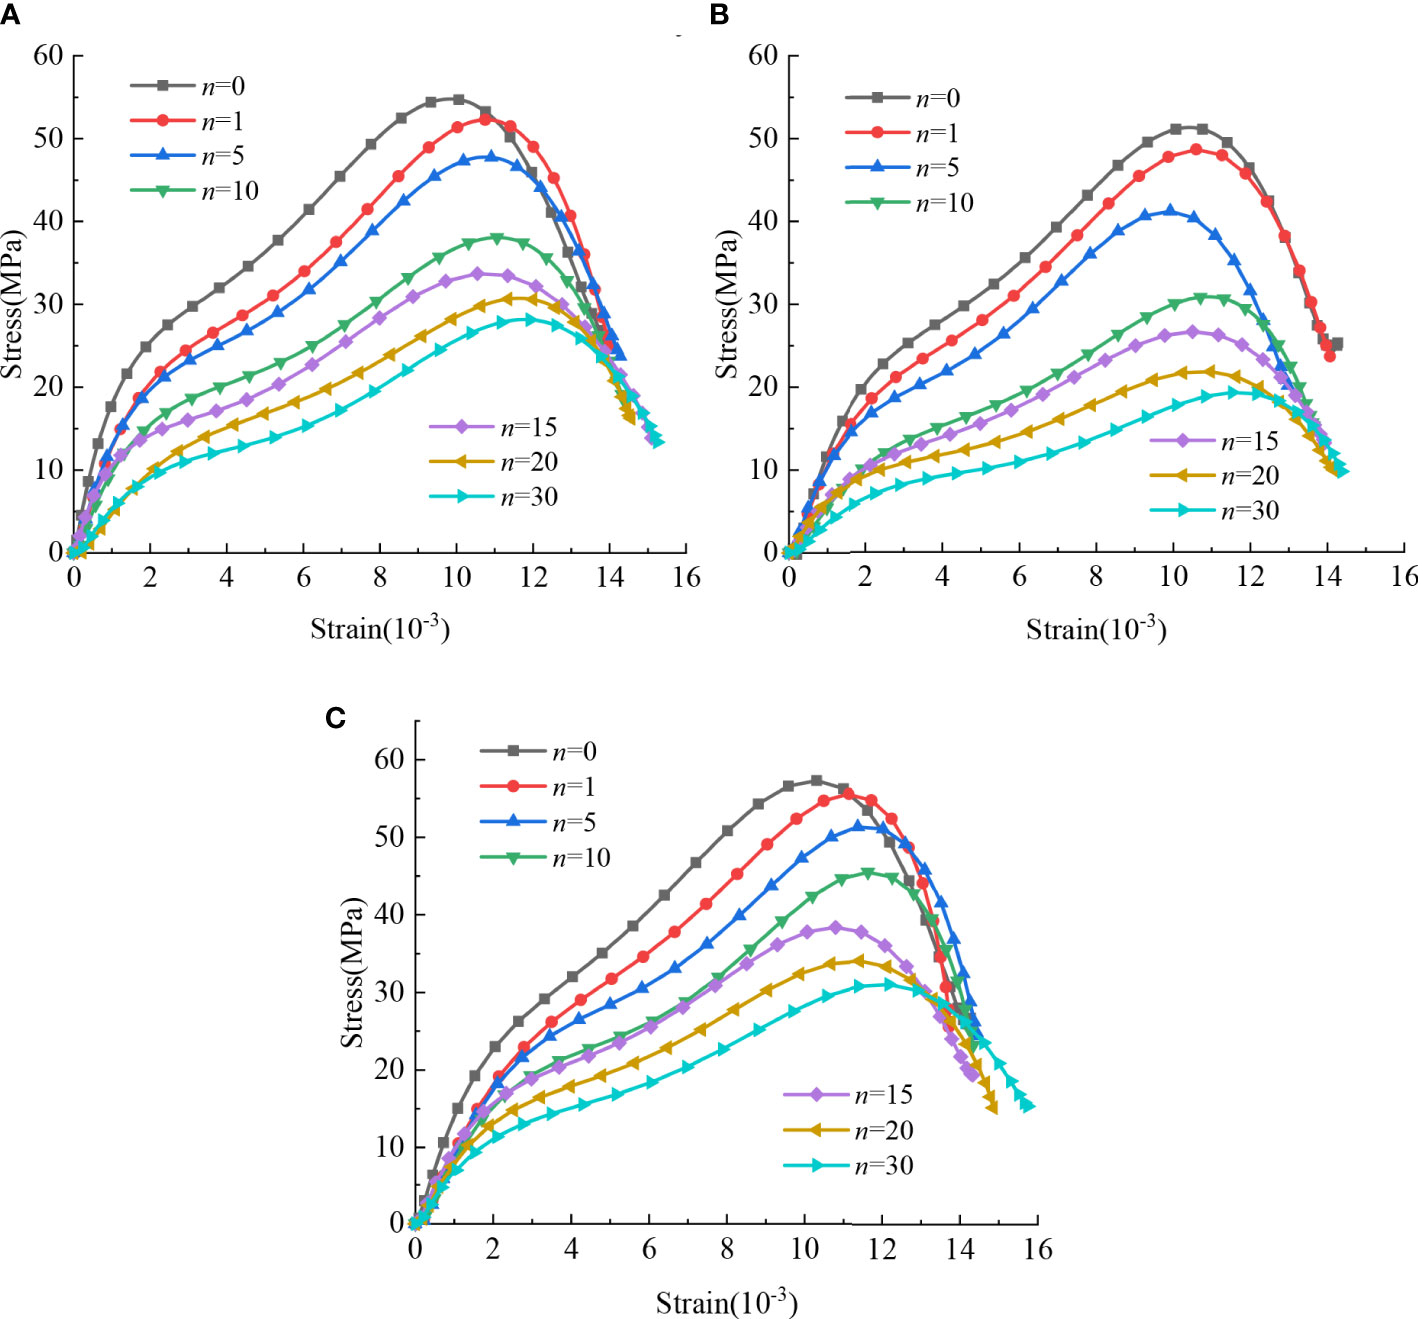
Figure 9 Dynamic stress-strain curves of three kinds of jointed rock: (A) type I filling jointed rock; (B) type II filling jointed rock; (C) type III filling jointed rock.
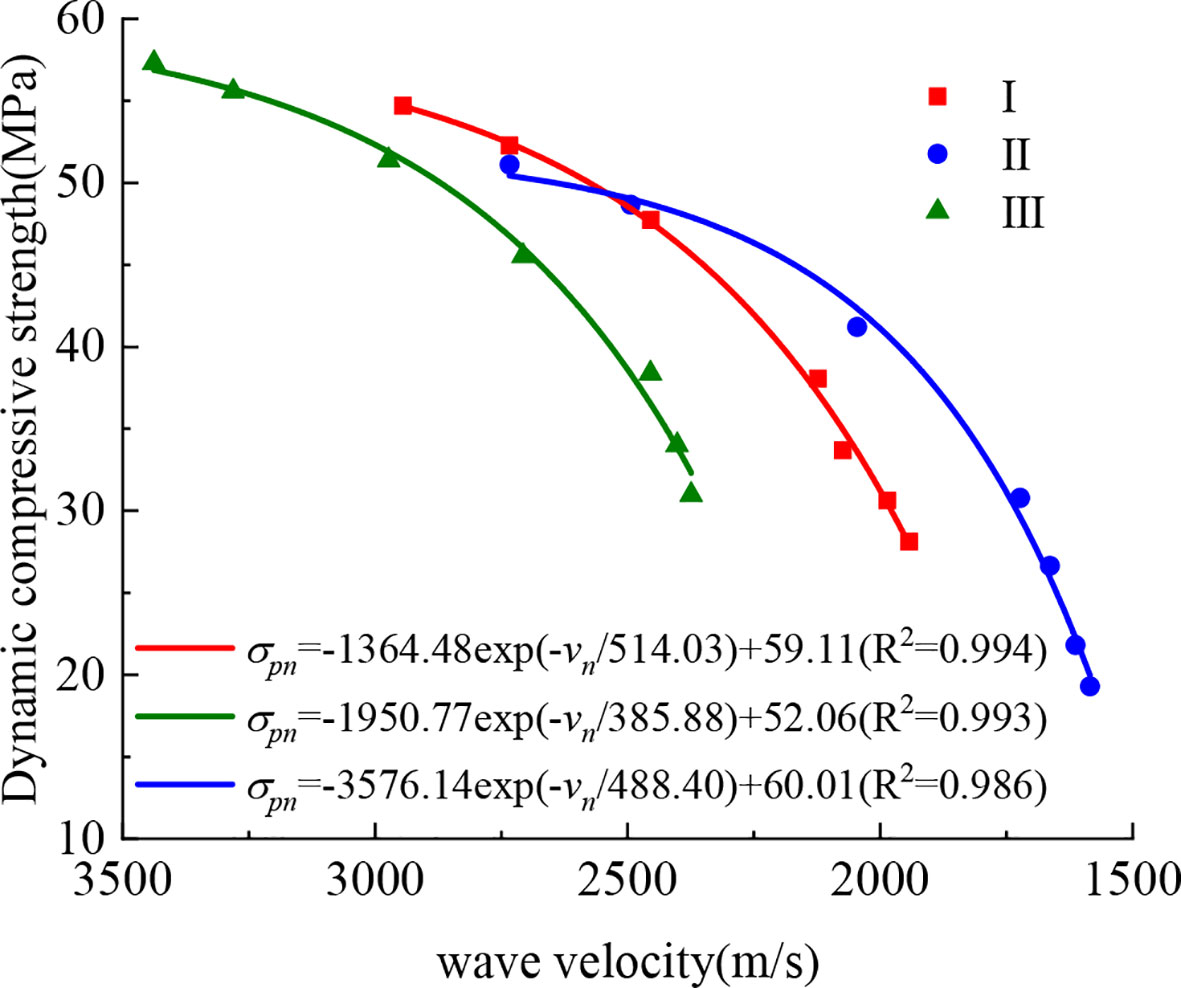
As can be seen from Figure 9 that the dynamic stress-strain curves of the three types of filled jointed rocks have similar trends. With the increase of the number of freeze-thaw cycles, the dynamic peak compressive strength of the jointed rock samples gradually decreases. The dynamic peak strain of the rock samples changes in an unclear way, and there are fluctuations. The dynamic compressive strength of the rock samples is in continuous deterioration process under the action of freeze-thaw cycles, and the strength damage continues to accumulate with the increase of the number of freeze-thaw cycles. The regularity of dynamic strength of the three types of rock samples under the action of the same freeze-thaw cycles is consistent with that of static compressive strength. According to the analysis of Section 3.1, the macroscopic damage of rock samples under the freeze-thaw action can be manifested as wave velocity deterioration. In order to explore the relations between strength damage and wave velocity damage, the dynamic peak compressive strength of each condition is fitted with the corresponding wave velocity, as shown in Figure 10.
It can be seen from Figure 10 that the wave velocities of the three types of rock samples have a good correlation with the dynamic peak compressive strength. The dynamic compressive strength of the rock sample shown in the figure decreases nonlinearly with the attenuation of the wave velocity. From the change regularity of the fitting curve of strength versus wave velocity, it can be seen that if the wave velocity value vn of the filled jointed rocks after the freeze-thaw is measured, the corresponding dynamic compressive strength σpn can be calculated by the formula where 、 、 are the fitting coefficients.
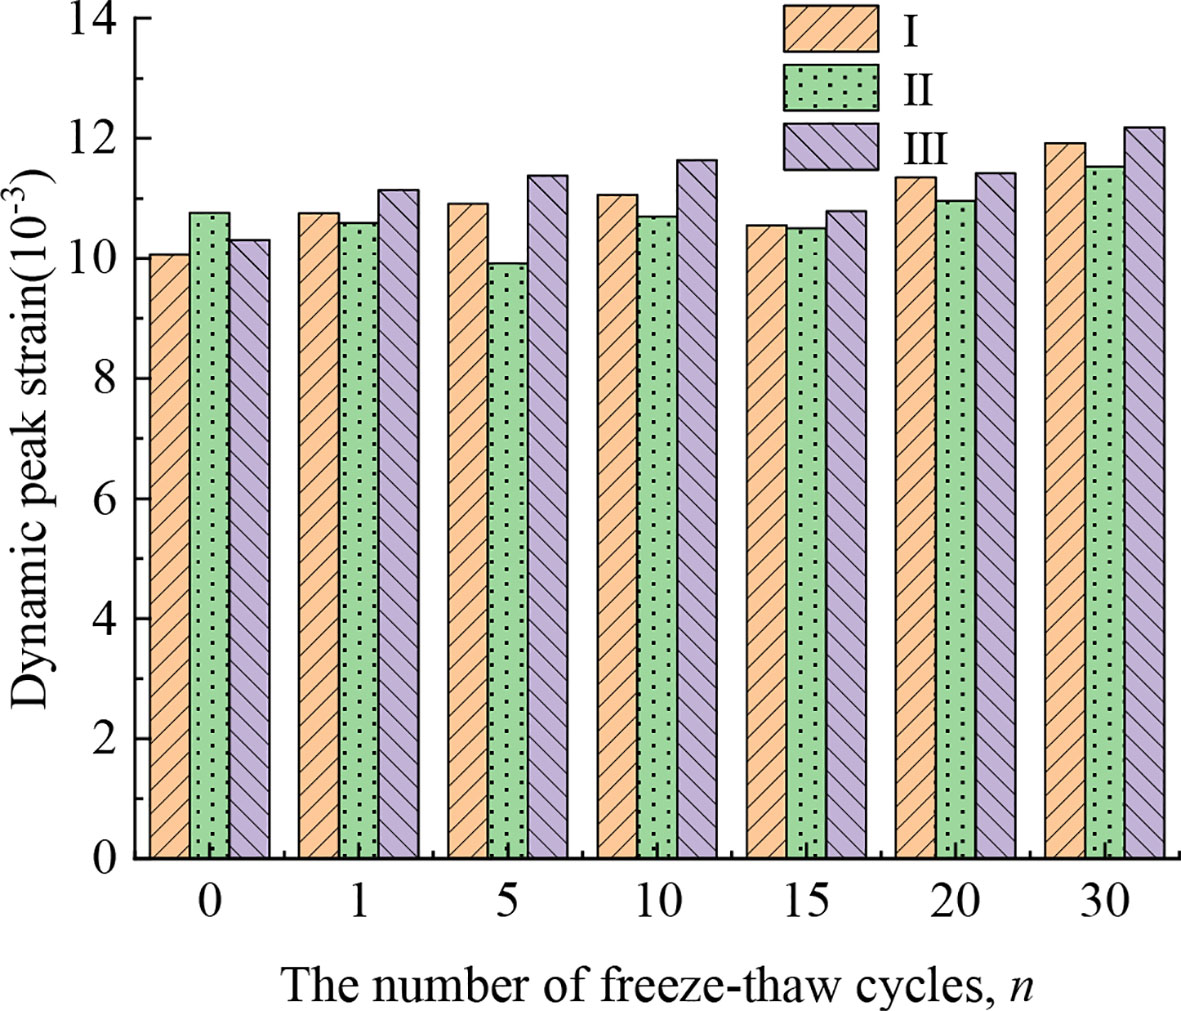
Comparing the static peak strain in Figure 6, it is found that the amplitude and range of dynamic peak strain changes are much smaller than the static peak strain. Compared with the change trend of static peak strain, the dynamic peak strain has a certain discreteness with the change of freeze-thaw times. As shown in Figure 11, the value of dynamic peak strain ranges from 0.01 to 0.013, which is approximately 1/10 to 1/5 of the static peak strain. This is mainly due to the fact that uniaxial compression belongs to a low strain rate test, while dynamic impact is a kind of high strain rate test. The latter acts on the rock samples for an extremely short time, causing the rock samples to be damaged by compression in a very short time, which results in smaller dynamic peak strain values and a more complex change regularity of the rock samples.
3.4 Analysis of impact failure
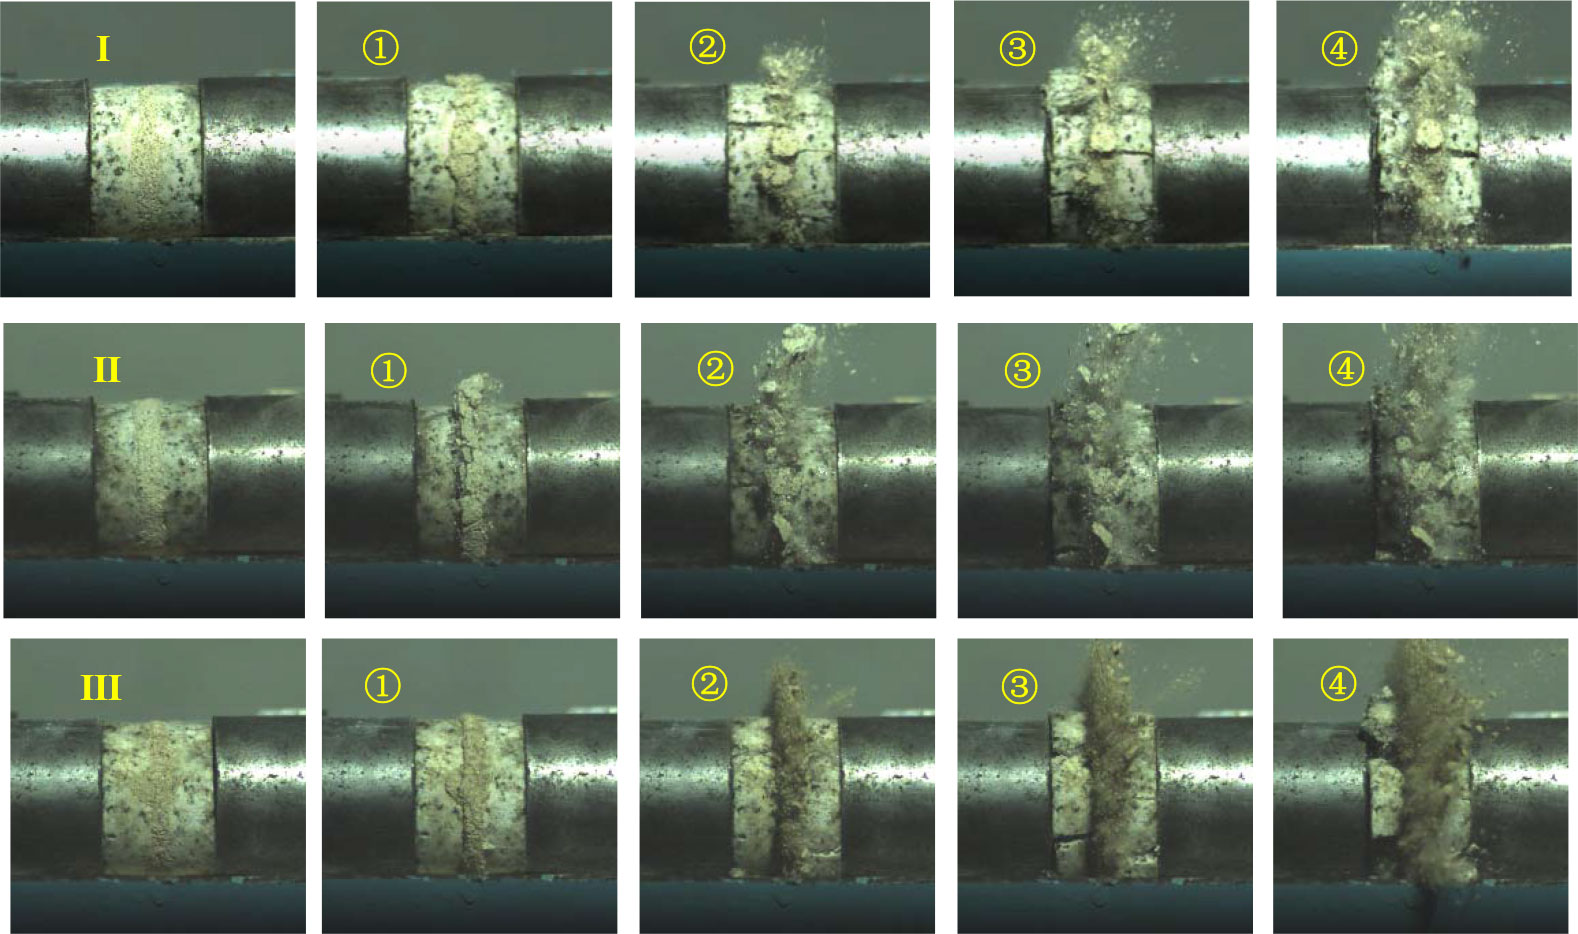
Figure 12 shows the failure process of each rock sample after 10 freeze-thaw cycles recorded by a high-speed camera. Based on the stress-strain curves, it is found that the impact process of the filled jointed rock sample after freeze-thaw damage contains filling layer compaction, overall elastic compression, crack growth, filling layer splash and rock sample destruction. From Figure 12, it can be seen that the filling layers are firstly destroyed by compaction under the impact load, and its filling layer destruction appears as granular clasts splash due to the lowest filling layer strength of type II, while the filling layers of type I and III are compressed and slightly lateral expansion occurs. As the impact continues, the filling layer emits joint debris around under the impact load, and the rocks on both sides bear the impact load to generate cracks. Under the impact load, the cracks gradually develop, penetrate, and thicken, ultimately leading to complete destruction of the rocks on both sides.
3.5 Effect of freeze-thaw cycles on wave propagation characteristics in filled jointed rocks
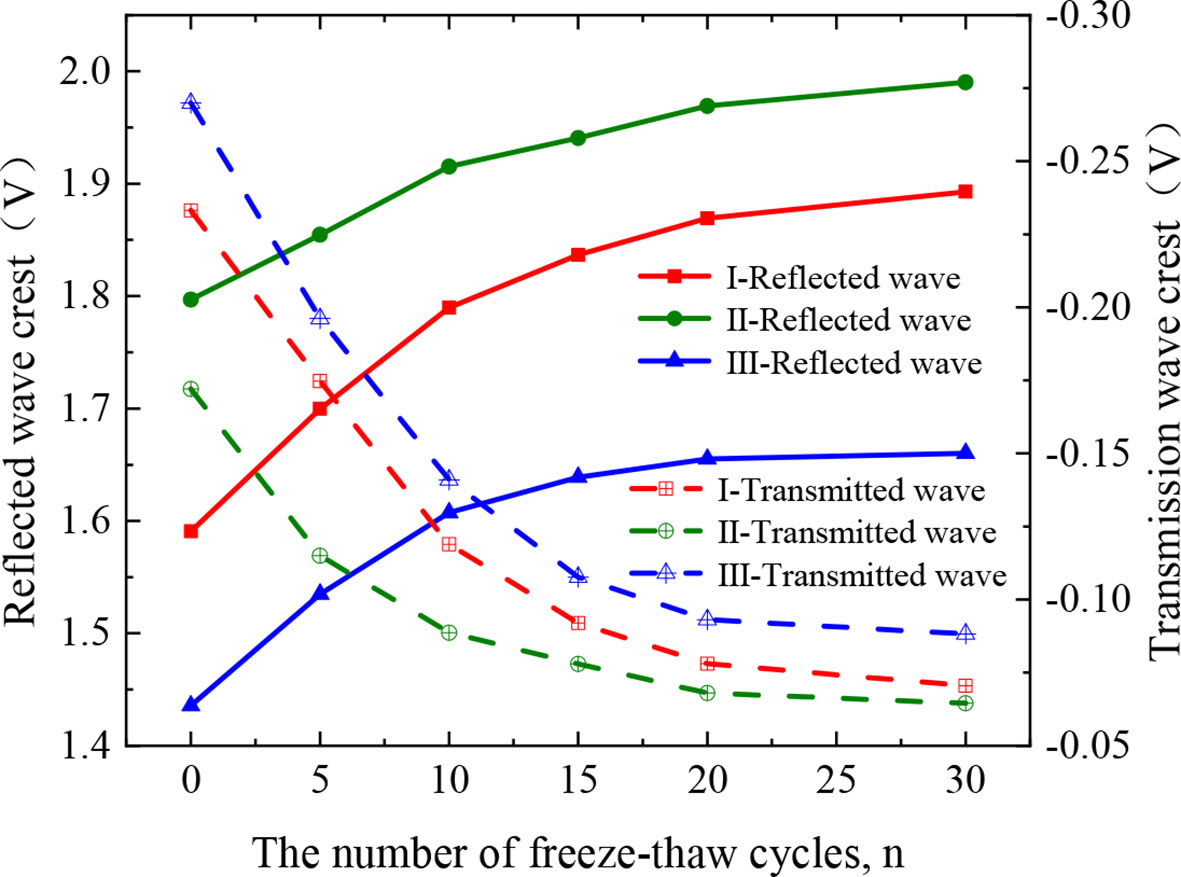
This SHPB test is performed by controlling the impact pressure (0.15 MPa) to maintain the initial velocity of the impact bar to ensure consistent amplitude values of the incident wave. Figure 13 shows the waveform curves of reflected and transmitted in filled jointed rocks after 0, 5, 10, 15, 20 and 30 freeze-thaw cycles. Due to the consistent shape of the incident wave, it is not reflected in this figure. As shown in Figure 13, as the number of freeze-thaw cycles increases, the amplitude of the reflected wave continuously increases, while the amplitude of the transmitted wave decreases. This is mainly due to the fact that the filled jointed rocks are in the process of continuous freeze-thaw damage and deterioration, and the pores and fractures in the jointed layers are increasing, which leads to the continuous decrease of the overall density and the increase of the average wave impedance of rock samples. According to the relation between reflection coefficient R and wave impedance zp in the reference (Chai et al., 2020b), Eq. (7) shows that the average impedance of the rocks increases and the reflected wave amplitude keeps rising and the transmitted wave amplitude keeps decreasing.
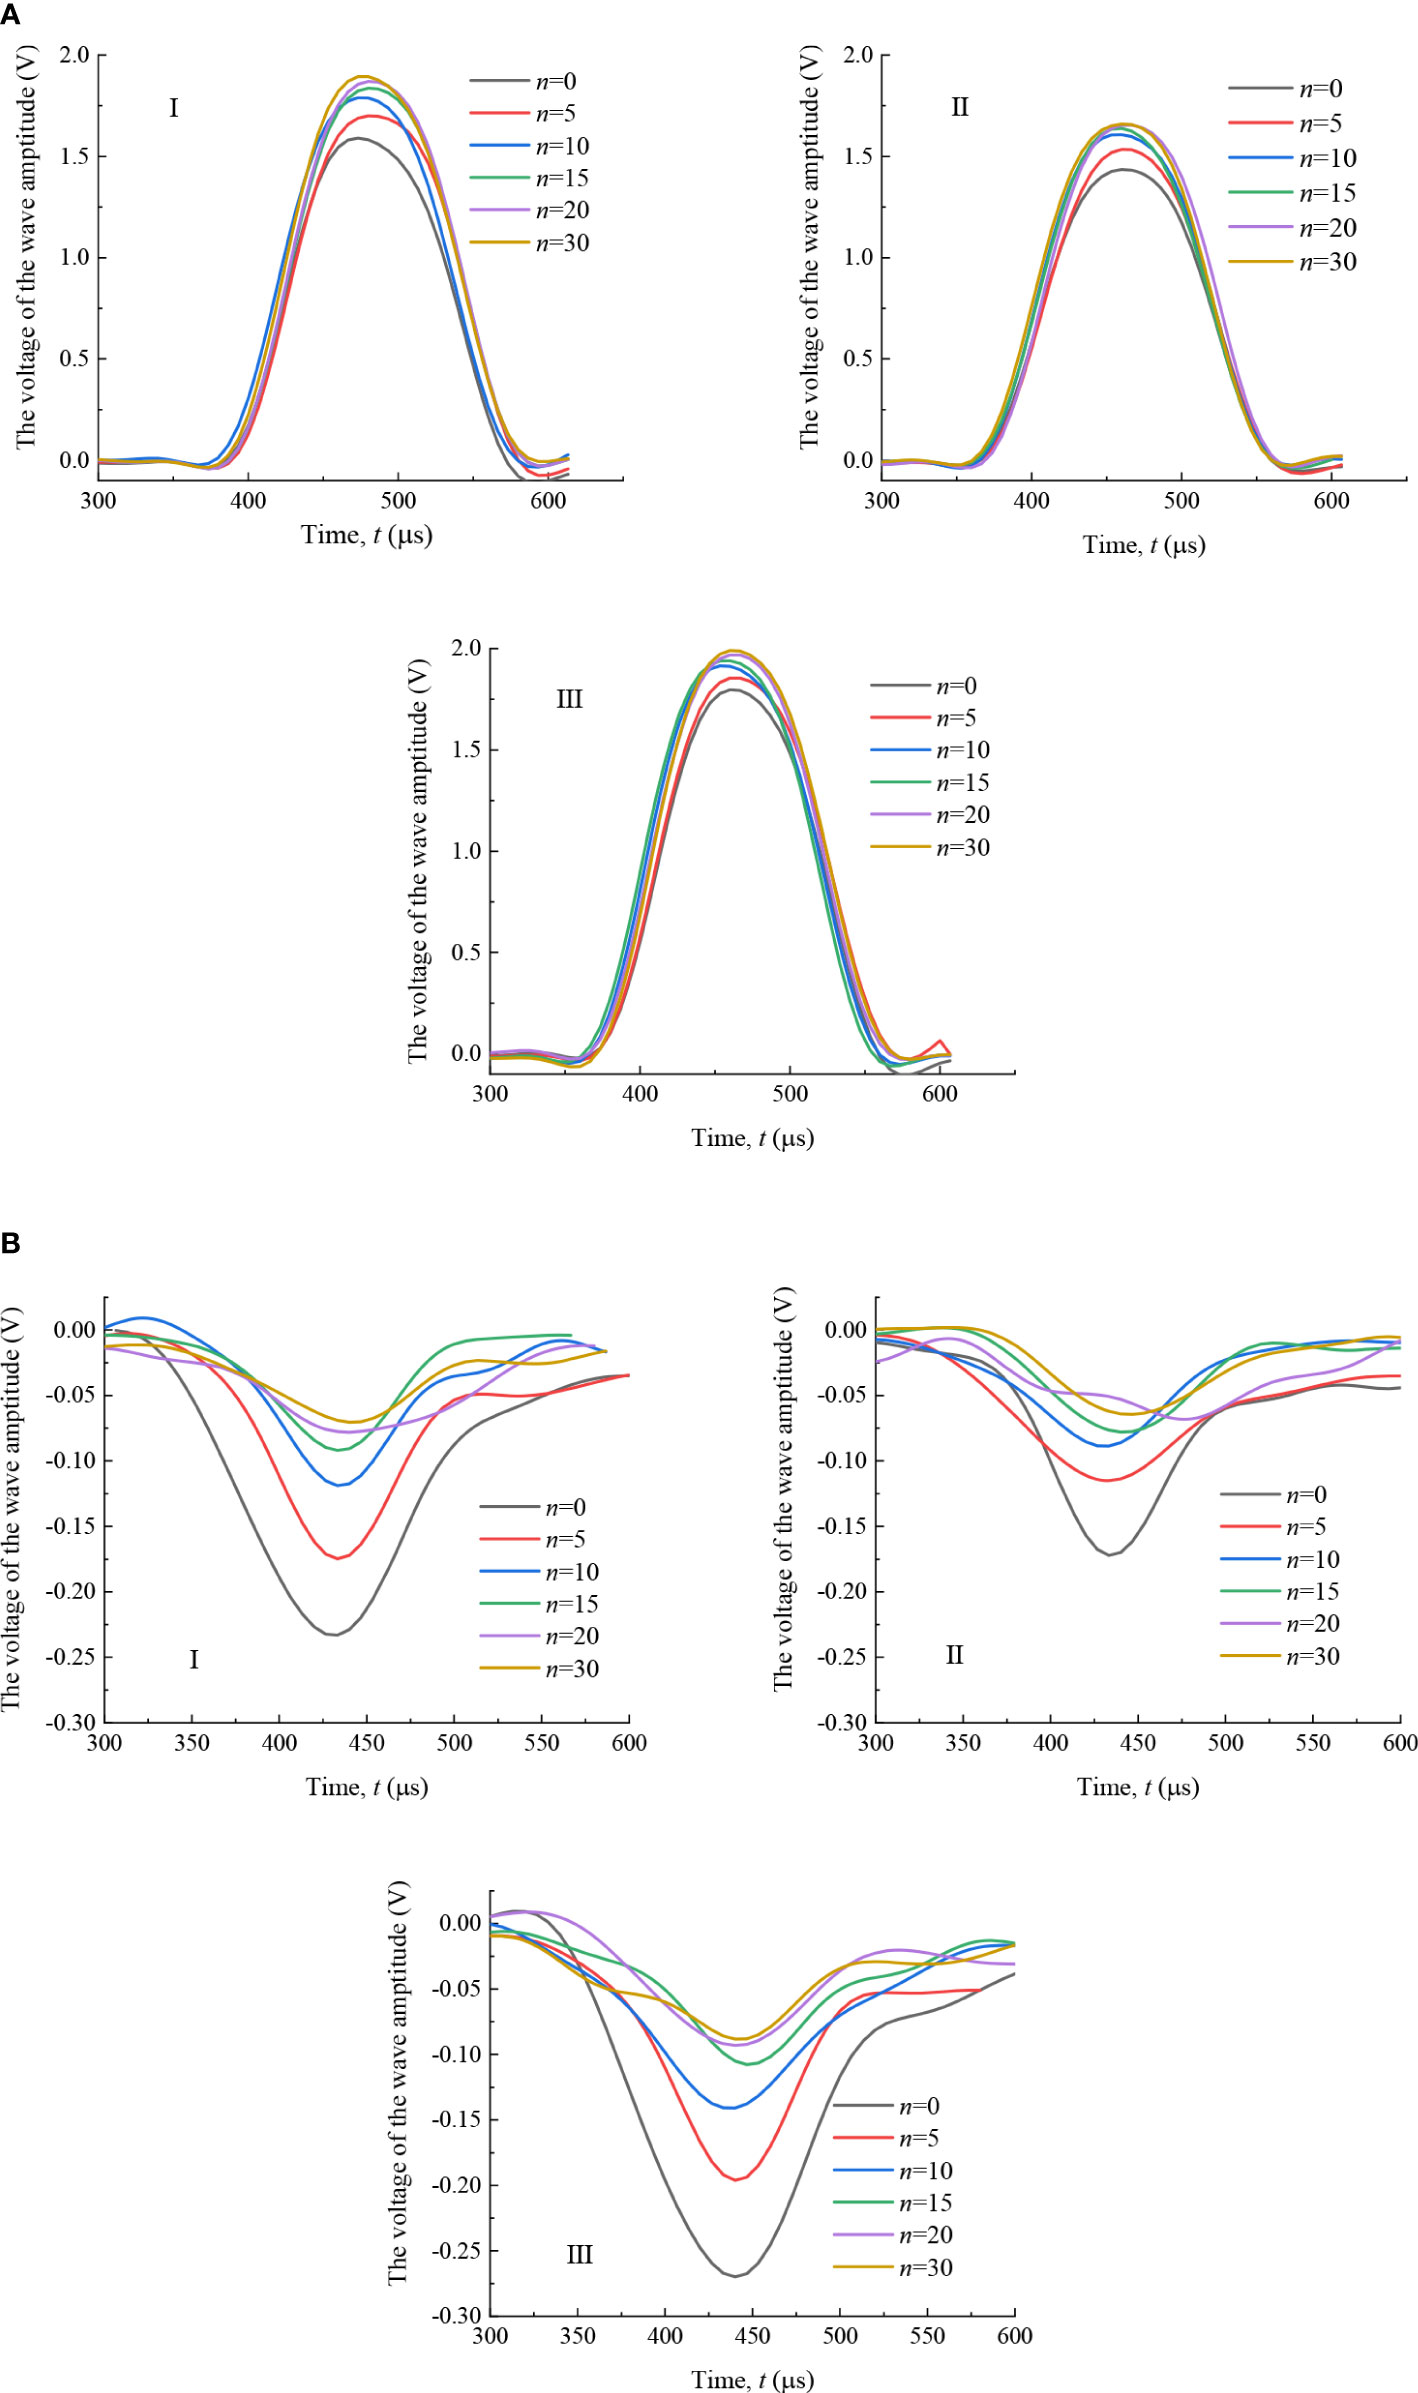
Figure 13 Reflection and transmission waveform curves of jointed rock under freeze-thaw cycle: (A) reflected wave; (B) transmitted wave.
where zp1 is the wave impedance of the bar and zp2 is the wave impedance of the rock sample.
It can also be seen from Figure 13 that the change of the amplitude of transmitted and reflected waves with the freeze-thaw cycles is larger before 15 freeze-thaw cycles. As the freeze-thaw cycles continue, the change gradually decreases. Based the analysis of the dynamic mechanical properties of rock samples, it is shown that the deterioration rate of the rock samples in the early stage is faster than in the later stage. In addition, the fluctuation regularity of transmitted waves in each rock sample is good in the early stage of the freeze-thaw, but it is gradually complex with the increase of freeze-thaw times, which indicates that the transmitted wave propagation path is gradually complex, further indicating that the freezing and thawing caused the development of pores and fractures in the filled jointed rock in multiple directions.
To further study the influence of freeze-thaw action and filling materials on the transmitted and reflected effect of stress wave propagation of the filled jointed rocks, the transmitted and reflected wave amplitudes of each rock sample were compared and analyzed, as shown in Figure 14.
From Figure 14, it can be seen that the freeze-thaw action and the filling joint materials jointly affect the stress wave transmission and reflection law of the filled jointed rocks. Under the condition of the same filling material, the peak value of reflected wave increases with the increase of the freeze-thaw cycle times, while the peak value of the transmitted wave decreases. Under the condition that the freeze-thaw action is the same, the amplitude of reflected wave is negatively correlated with the strength of the filling materials, while that of transmitted wave is positively correlated with the material strength. This indicates that the filling materials and the freeze-thaw action have different effects on the transmitted and reflected mechanism of stress waves, which shows that the lower the strength of filling materials is and the more freeze-thaw cycle times are, the weaker the reflected ability of stress waves is and the stronger the transmitted ability is.
3.6 Analysis of energy dissipation of dynamic impact damage
The impact process of filled jointed rocks is driven by external energy to complete the damage. According to the one-dimensional stress wave theory, the incident energy Wi, reflected energy Wr and transmitted energy Wt of the rock samples under each operating condition can be calculated from the cross-sectional area of the pressure bar A, the elastic modulus E, the stress wave velocity C0 and the corresponding strain, expressed as:
where (m=i, r, t) are respectively the incident strain, reflected strain and transmitted strain, which can be directly calculated by the three-wave method when obtaining the dynamic stress-strain curve. The corresponding dissipation energy Ws can also be calculated according to the law of energy conservation:
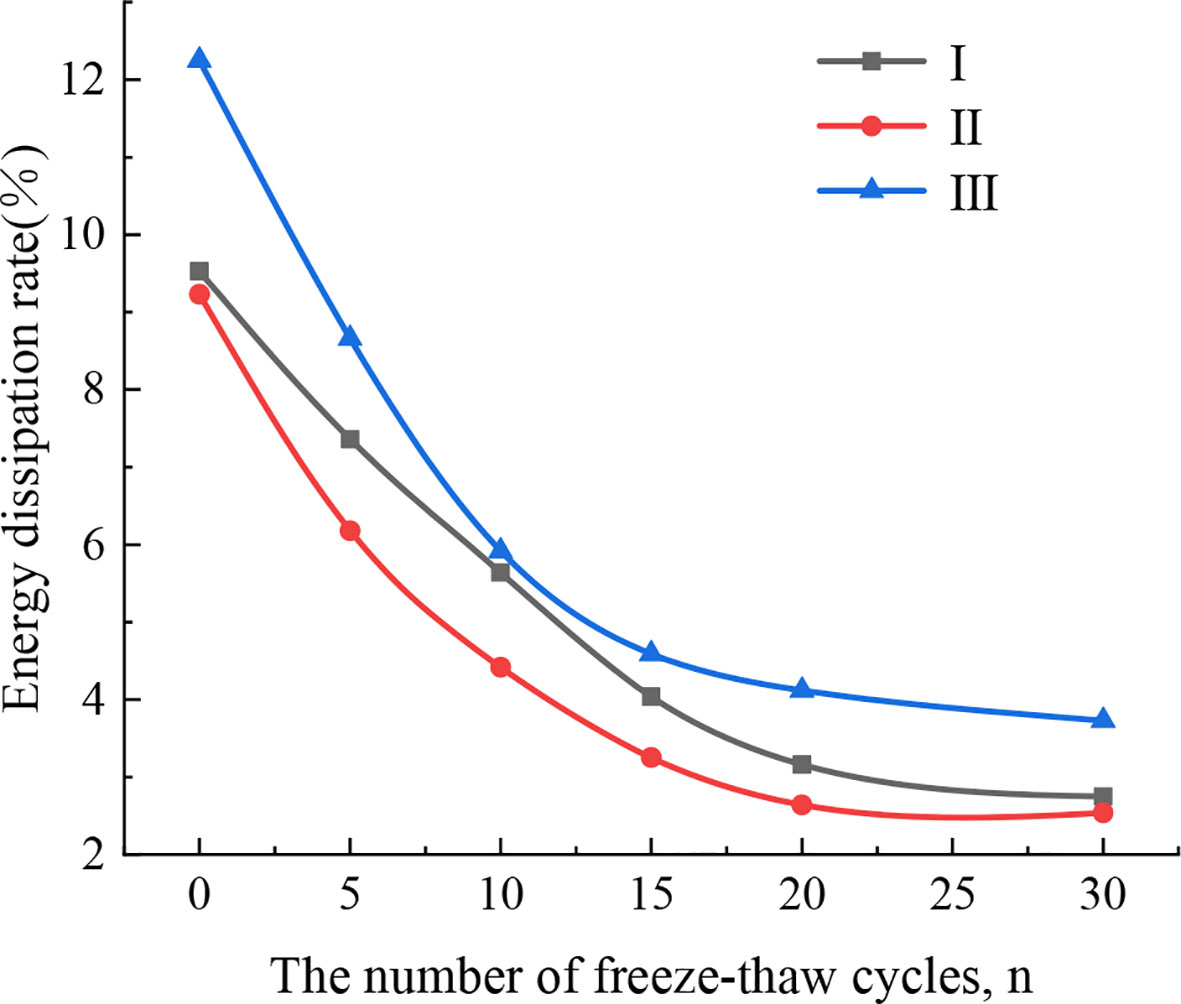
Accordingly, the energy dissipation rate Ws/Wi can be used to analyze the energy dissipation regularity of the stress wave of the filled jointed rocks under the freeze-thaw action. The energy dissipation rate of different filling materials under different number of freeze-thaw cycles can be obtained from the calculation results, as shown in Figure 15.
From Figure 15, it can be seen that the energy dissipation rate of rock samples is positively correlated with the strength of the filling materials, indicating that the stronger the filling material, the greater the energy consumed by the rock sample to undergo failure after undergoing the same freeze-thaw cycles. Considering the accumulated damage of each rock sample, it can be found that under the same freeze-thaw cycle times, the higher the strength of the filling layers is, the smaller the accumulated damage is and the larger the energy dissipation rate during impact damage is. This is mainly due to that the higher density of the filling layer with higher strength requires more energy for destruction. In addition, the energy dissipation rate of the same filled jointed rocks gradually decreases with the increase of freeze-thaw cycle times, and the rate of in energy dissipation rate decreases with the continuous effect of freeze-thaw action.
4 Conclusions
In this paper, the experimental study on the static and dynamic compression characteristics of filled jointed rock samples under different freeze-thaw cycles are carried out, and the corresponding failure characteristics are accordingly analyzed. The main conclusions are as follows:
(1) With the increase of freeze-thaw cycles, the wave velocity of the filled jointed rock deteriorates continuously. After 30 freeze-thaw cycles, the wave velocity of the jointed rock decreases by more than 30%, and the wave velocity of the rock mass with lower filling material strength decreases more. This indicates that the wave velocity value of the filled jointed rocks is positively correlated with the strength of the filling materials. The fitting formula of freeze-thaw cumulative damage evolution model is .
(2) The static and dynamic peak compressive strength of the filled jointed rock decrease continuously with the increase of freeze-thaw cycles, and the strength loss rate of the static peak compressive strength of the rock sample is greater than 50% after 30 freeze-thaw cycles, indicating that the freeze-thaw action has a significant impact on the strength deterioration of the filled jointed rocks, and the freeze-thaw damage has a continuous accumulation process. The dynamic and static peak compressive strengths of the jointed rock decrease with the decrease of the filling layer strength under the same number of freeze-thaw cycles.
(3) The static peak strain of the filled jointed rocks shows an obvious rising trend with the increase of freeze-thaw cycle times and is much larger than the dynamic peak strain in numerical value. The trend of dynamic peak strain change is not obvious, and the numerical range is 0.01 ~ 0.013. This is mainly due to the fact that dynamic impact belongs to high strain rate tests, the rock is compressed and destroyed in a very short time, and the impact process undergoes obvious splashing of broken rock debris. Therefore, the dynamic peak strain change law is complex and the value is small.
(4) Under freeze-thaw cycles, there is a damage accumulation threshold for the filled jointed rock samples, and the damage accumulation threshold for this filled jointed rock sample is 0.5. After reaching the threshold, the joint filling layer has been destroyed, and the damage deterioration is basically complete. The filling layer will lose its contribution to the subsequent freeze-thaw process of overall strength and deformation, and the strength and peak strain will be determined by the rocks on both sides.
(5) Under the same freeze-thaw condition, the peak value of reflected wave amplitude and energy dissipation rate increases with the increase of filling material strength. Under the same filling material condition, the peak value of reflected wave amplitude and energy dissipation rate decreases with the increase of freeze-thaw times.
Data availability statement
The original contributions presented in the study are included in the article/supplementary material. Further inquiries can be directed to the corresponding author.
Author contributions
All authors listed have made a substantial, direct, and intellectual contribution to the work and approved it for publication.
Funding
The work described in this paper was supported by the National Natural Science Foundation of China (No. 42172302 & No.41902277), the Natural Science Basic Research Plan in Shaanxi Province, (No. 2023-YBGY-085), Key Laboratory of Hydraulic and Waterway Engineering of the Ministry of Education, Chongqing Jiaotong University (SLK2021A04), and Fundamental Research Funds for the Central Universities, CHD (No. 300102282201), and for which the authors are very thankful.
Conflict of interest
The authors declare that the research was conducted in the absence of any commercial or financial relationships that could be construed as a potential conflict of interest.
Publisher’s note
All claims expressed in this article are solely those of the authors and do not necessarily represent those of their affiliated organizations, or those of the publisher, the editors and the reviewers. Any product that may be evaluated in this article, or claim that may be made by its manufacturer, is not guaranteed or endorsed by the publisher.
References
Bayram F. (2012). Predicting mechanical strength loss of natural stones after freeze–thaw in cold regions. Cold. Reg. Sci. Technol. 83-84, 98–102. doi: 10.1016/j.coldregions.2012.07.003
Chai S. B., Wang H., Yu L. Y., Shi J. H., Abi E. (2020a). Experimental Study on Static and Dynamic Compression Mechanical Properties of Filled Rock Joints. Lat. Am. J. Solids. Stru. 17, 1–15. doi: 10.1590/1679-78255988
Chai S. B., Wang H., Jing Y. L., Jia N. (2020b). Experimental study on dynamic compression characteristics of rock with filled joints after cumulative damage. Chin. J. Rock Mech. Eng. 39, 2025–2037. doi: 10.13722/j.cnki.jrme.2020.0310
Deng H. W., Dong C. F., Li J. L., Zhou K. P., Tian W. G., Zhang J. (2014a). Experimental Study on Sandstone Freezing-Thawing Damage Properties under Condition of Water Chemistry. Appl. Mech. Mater. 3207, 556–562. doi: 10.4028/www.scientific.net/AMM.556-562.826
Deng J. H., Wang X. C., Wu A. J. (2014b). Experiment of Freezing-Thawing Cycles and Analysis of Damage Characteristics for Argillaceous Dolomite. Adv. Mater. Res. 1065-1069, 1884–1893. doi: 10.4028/www.scientific.net/AMR.1065-1069.1884
Deng H. W., Yu S. T., Deng J. R., Ke B., Bin F. (2019). Experimental Investigation on Energy Mechanism of Freezing-Thawing Treated Sandstone under Uniaxial Static Compression. Ksce. J. Civ. Eng. 23, 2074–2082. doi: 10.1007/s12205-019-1278-5
Fan L. F., Xu C., Wu Z. J. (2020). Effects of cyclic freezing and thawing on the mechanical behavior of dried and saturated sandstone. B. Eng. Geol. Environ. 79, 755–765. doi: 10.1007/s10064-019-01586-z
Huang S. B., Liu Q. S., Cheng A. P., Chen Y. Z. (2018). A statistical damage constitutive model under freeze-thaw and loading for rock and its engineering application. Cold. Reg. Sci. Technol. 145, 142–150. doi: 10.1016/j.coldregions.2017.10.015
Huang X. L., Qi S. W., Williams A., Zou Y., Zheng Y. (2015). Numerical simulation of stress wave propagating through filled joints by particle model. Int. J. Solids. Struct. 69-70, 23–33. doi: 10.1016/j.ijsolstr.2015.06.012
Jia S. L., Wang Z. L., Wang J. G., Lu Z. T., Wang H. C. (2021). Experimental and theoretical study on the Propagation Characteristics of stress wave in Filled Jointed Rock Mass. PloS One 16, e0253392. doi: 10.1371/journal.pone.0253392
Jiang H. B., Li K. N., Jin J. (2019). The variation characteristics of micro-pore structures of underground rocks in cold regions subject to freezing and thawing cycles. Arab. J. Geosci. 13, 86–93. doi: 10.1007/s12517-019-4936-5
Li J. L., Zhu L. Y., Zhou K. P., Chen H., Gao L., Lin Y., et al. (2021a). Non-linear creep damage model of sandstone under freeze-thaw cycle. J. Cent. South. Univ. 28, 954–967. doi: 10.1007/s11771-021-4656-3
Li Y., Cheng X. W., Ma Z. L., Li X. H., Wang M. (2021b). Dynamic response and damage evolution of Zr-based bulk metallic glass under shock loading. J. Mater. Sci. Technol. 93, 119–127. doi: 10.1016/j.jmst.2021.03.052
Li J. C., Li H. B., Jiao Y. Y., Liu Y. Q., Xia X., Yu C. (2014). Analysis for oblique wave propagation across filled joints based on thin-layer interface model. J. Appl. Geophys. 102, 39–46. doi: 10.1016/j.jappgeo.2013.11.014
Li J. C., Ma G. W. (2009). Experimental study of stress wave propagation across a filled rock joint. Int. J. Rock Mech. Min. Sci. 46, 471–478. doi: 10.1016/j.ijrmms.2008.11.006
Li B., Zhang G. H., Ma W., Liu M. H., Li A. Y. (2022). Damage mechanism of sandstones subject to cyclic freeze-thaw (FT) actions based on high-resolution computed tomography (CT). B. Eng. Geol. Environ. 81, 374. doi: 10.1007/s10064-022-02872-z
Li J. L., Zhou K. P., Liu W. J., Deng H. W. (2017). NMR research on deterioration characteristics of microscopic structure of sandstones in freeze–thaw cycles. Trans. Nonferrous Metals Soc China. 26, 2997–3003. doi: 10.1016/S1003-6326(16)64430-8
Liu T. T., Li X. P., Li J. C., Li H. B., Zheng Y., Luo Y. (2017). Numerical study on s-wave transmission across a rough, filled discontinuity. Arab. J. Geosci. 10, 249. doi: 10.1007/s12517-017-3030-0
Liu G. J., Peng Y. X., Zuo Q. J., Su Y., Wu L. (2022). Comparative study on tunnel blast-induced vibration for the underground cavern group. Minerals. 12, 1246. doi: 10.3390/min12101246
Liu S. M., Sun H. T., Zhang D. M., Yang K., Wang D. K., Li X. L., et al. (2023). Nuclear magnetic resonance study on the influence of liquid nitrogen cold soaking on the pore structure of different coals. Phys. Fluids. 35, 012009. doi: 10.1063/5.0135290
Lu Y. N., Li X. P., Chan A. (2019). Damage constitutive model of single flaw sandstone under freeze-thaw and load. Cold. Reg. Sci. Technol. 159, 20–28. doi: 10.1016/j.coldregions.2018.11.017
Matsuoka N. (1990). Mechanisms of rock breakdown by frost action: An experimental approach. Cold. Reg. Sci. Technol. 17, 253–270. doi: 10.1016/S0165-232X(05)80005-9
Mousavi S. Z. S., Tavakoli H., Moarefvand P., Rezaei M. (2020). Micro-structural, petro-graphical and mechanical studies of schist rocks under the freezing-thawing cycles. Cold. Reg. Sci. Technol. 174, 103039. doi: 10.1016/j.coldregions.2020.103039
Nicholson D. T., Nicholson F. H. (2000). Physical deterioration of sedimentary rocks subjected to experimental freeze–thaw weathering. Earth Surf. Process. Landf. 25, 1295–1307. doi: 10.1002/1096-9837(200011)25:12<1295::AID-ESP138>3.0.CO;2-E
Qiao C., Wang Y., Tong Y. J., Yang H. P., Li C. H., Qian C. (2021). Deterioration Characteristics of Pre-flawed Granites Subjected to Freeze-Thaw Cycles and Compression. Geotech. Geol. Eng. 39, 5907–5916. doi: 10.1007/s10706-021-01904-x
Singh M., Rao K. S., Ramamurthy T. (2002). Strength and Deformational Behaviour of a Jointed Rock Mass. Rock Mech. Rock Eng. 35, 45–64. doi: 10.1007/s006030200008
Su Q. Q., Ma Q. Y., Ma. D. D., Yuan P. (2021). Dynamic mechanical characteristic and fracture evolution mechanism of deep roadway sandstone containing weakly filled joints with various angles. Int. J. Rock Mechanics Min. Sci. 137, 104552. doi: 10.1016/j.ijrmms.2020.104552
Tan X. J., Chen W. Z., Yang J. P., Gao J. J. (2011). Laboratory investigations on the mechanical properties degradation of granite under freeze–thaw cycles. Cold. Reg. Sci. Technol. 68, 130–138. doi: 10.1016/j.coldregions.2011.05.007
Wang Y., Han J. Q., Li C. H. (2020). Acoustic emission and CT investigation on fracture evolution of granite containing two flaws subjected to freeze–thaw and cyclic uniaxial increasing-amplitude loading conditions. Constr. Build. Mater. 260, 119769. doi: 10.1016/j.conbuildmat.2020.119769
Wang P., Xu J. Y., Liu S., Liu S. H., Wang H. Y. (2016a). A prediction model for the dynamic mechanical degradation of sedimentary rock after a long-term freeze-thaw weathering: Considering the strain-rate effect. Cold. Reg. Sci. Technol. 131, 16–23. doi: 10.1016/j.coldregions.2016.08.003
Wang P., Xu J. Y., Liu S., Wang H. Y., Liu S. H. (2016b). Static and dynamic mechanical properties of sedimentary rock after freeze-thaw or thermal shock weathering. Eng. Geol. 210, 148–157. doi: 10.1016/j.enggeo.2016.06.017
Xu G. M. (2006). Study on mechanical charateristics of rock at low temperature, damage due to freezing and thawing and mutiphysical coupling problems of rock in cold regions (Wuhan, China: Chinese Academy of Science).
Yang C., Zhou K. P., Xiong X., Deng H. W., Pan Z. (2021). Experimental investigation on rock mechanical properties and infrared radiation characteristics with freeze-thaw cycle treatment. Cold. Reg. Sci. Technol. 183, 103232. doi: 10.1016/j.coldregions.2021.103232
Yi L. C., Qu D. X., Gang W., Li X. P., Zhang G. (2020). Degradation model of the dynamic mechanical properties and damage failure law of sandstone under freeze-thaw action. Soil. Dyn. Earthq. Eng. 132, 106094. doi: 10.1016/j.soildyn.2020.106094
Zhang J. F., Xu R. P., Liu Y., Zhang H. M. (2022). Study on micro-pore evolution law and shear mechanical behavior of grouting fractured rock mass under freeze-thaw cycle. Chin. J. Rock Mech. Eng. 41, 676–690. doi: 10.13722/j.cnki.jrme.2021.0568
Zhang H. M., Yang G. S. (2010). Research on damage model of rock under coupling action of freeze-thaw and load. Chin. J. Rock Mech. Eng. 29, 471–476. Available at: http://rockmech.whrsm.ac.cn/EN/abstract/abstract19977.shtml.
Zhao S. P., Feng Z. D., Li L. X., Zhao X. J., Lu L., Chen S., et al. (2022). Dynamic mechanical properties, deformation and damage mechanisms of eutectic high-entropy alloy AlCoCrFeNi2.1 under plate impact. J. Mater. Sci. Technol. 134, 178–188. doi: 10.1016/j.jmst.2022.05.060
Zhou Z. L., Cai X., Ma D., Chen L., Wang S. F., Tan L. H. (2018). Dynamic tensile properties of sandstone subjected to wetting and drying cycles. Construction And Building Materials 182, 215–232. doi: 10.1016/j.conbuildmat.2018.06.056
Keywords: filled jointed rock, freeze-thaw cycles, compressive mechanical properties, damage deterioration, dynamic properties
Citation: Chai S, Liu H, Song L, Li X, Fu X and Zhou Y (2023) Static pressure and dynamic impact characteristics of filled jointed rock after frozen-thaw cycle damage. Front. Ecol. Evol. 11:1222676. doi: 10.3389/fevo.2023.1222676
Received: 15 May 2023; Accepted: 07 July 2023;
Published: 20 July 2023.
Edited by:
Xuelong Li, Shandong University of Science and Technology, ChinaReviewed by:
Shufeng Pei, North China University of Water Conservancy and Electric Power, ChinaYaxiong Peng, Hunan University of Science and Technology, China
Yun Lin, Central South University, China
Gang Wang, Shaoxing University, China
Hailiang Jia, Xi’an University of Science and Technology, China
Copyright © 2023 Chai, Liu, Song, Li, Fu and Zhou. This is an open-access article distributed under the terms of the Creative Commons Attribution License (CC BY). The use, distribution or reproduction in other forums is permitted, provided the original author(s) and the copyright owner(s) are credited and that the original publication in this journal is cited, in accordance with accepted academic practice. No use, distribution or reproduction is permitted which does not comply with these terms.
*Correspondence: Shaobo Chai, c2hiY2hhaUBjaGQuZWR1LmNu
 Shaobo Chai
 Huan Liu
 Lang Song1
 Xiaodong Fu
 Yongqiang Zhou

