- 1Architectural Survey and Design Institute, Lanzhou University of Technology, Lanzhou, China
- 2Key Laboratory of Urban and Architectural Heritage Protection of the Ministry of Education, SouthEast University-NorthWest Center (SEU-NWC), School of Design Art, Lanzhou University of Technology, Lanzhou, China
- 3School of Humanities and Law, Northeastern University, Shenyang, China
Introduction: Scientific evaluation of the suitability of human settlement in arid areas and a grasp of their spatial differentiation characteristics are of great significance for the implementation of regional human settlement environment (HSE) improvement according to local conditions.
Methods: In this study, we took Gansu Province (GS), a typical arid area in China, as the research object. First, based on field research, we used the analytic hierarchy process to determine the weights of 12 evaluation indicators and build an HSE evaluation model from the two dimensions of nature and humanities. Then, we conduct a comprehensive evaluation of each factor based on the GIS spatial analysis module. Finally, we used the GIS natural breakpoint method and zoning statistics to understand the suitability of the HSE and its spatial distribution characteristics in GS Province.
Results: The study findings can be summarized as follows: (1) The spatial distribution of the suitability of the natural environment in GS Province shows that the east-central part of the province is significantly higher than the northwestern, and there is a big difference between localities. (2) The comprehensive suitability of human settlement in GS Province appears as a spatial distribution characteristic, gradually decreasing from the central urban area to the surrounding areas. The suitability index of the living environment is between 0.26 and 0.71. (3) The area sizes of the five types of suitability are ranked as the following: low suitable (138,502 km2) > moderately suitable (133,761 km2) > critical suitable (97,244 km2) > high suitable (47,459 km2) > unsuitable (38,980km2); in 14 cities, the average value of habitat suitability index is more than 0.5 accounting for 42.9%.
Discussion: Our research not only fills a gap in the research of human settlement in arid zones but also provides policy support for government departments to improve human settlement.
1 Introduction
The natural environment and social environment are included as the human settlement environment (HSE), which is regarded as the place for people to live, work, entertain, and commute. Good HSE and climate conditions impact residential satisfaction in flatter areas and sustainable development in rural and arid areas(Ossendorf et al., 2019; Luo et al., 2021; Timmermann et al., 2022). However, increasing urbanization and industrialization cause the deterioration of the urban and rural HSE. Due to the extreme climate change caused by human activities, the HSE in arid areas has been the most affected in China. In this case, to what extent has the suitability of the HSE in arid areas been affected? To make a scientific assessment that is the premise of the regional land space development, conducive to the improvement of resources and environmental carrying capacity (Feng and Zhen, 2022).
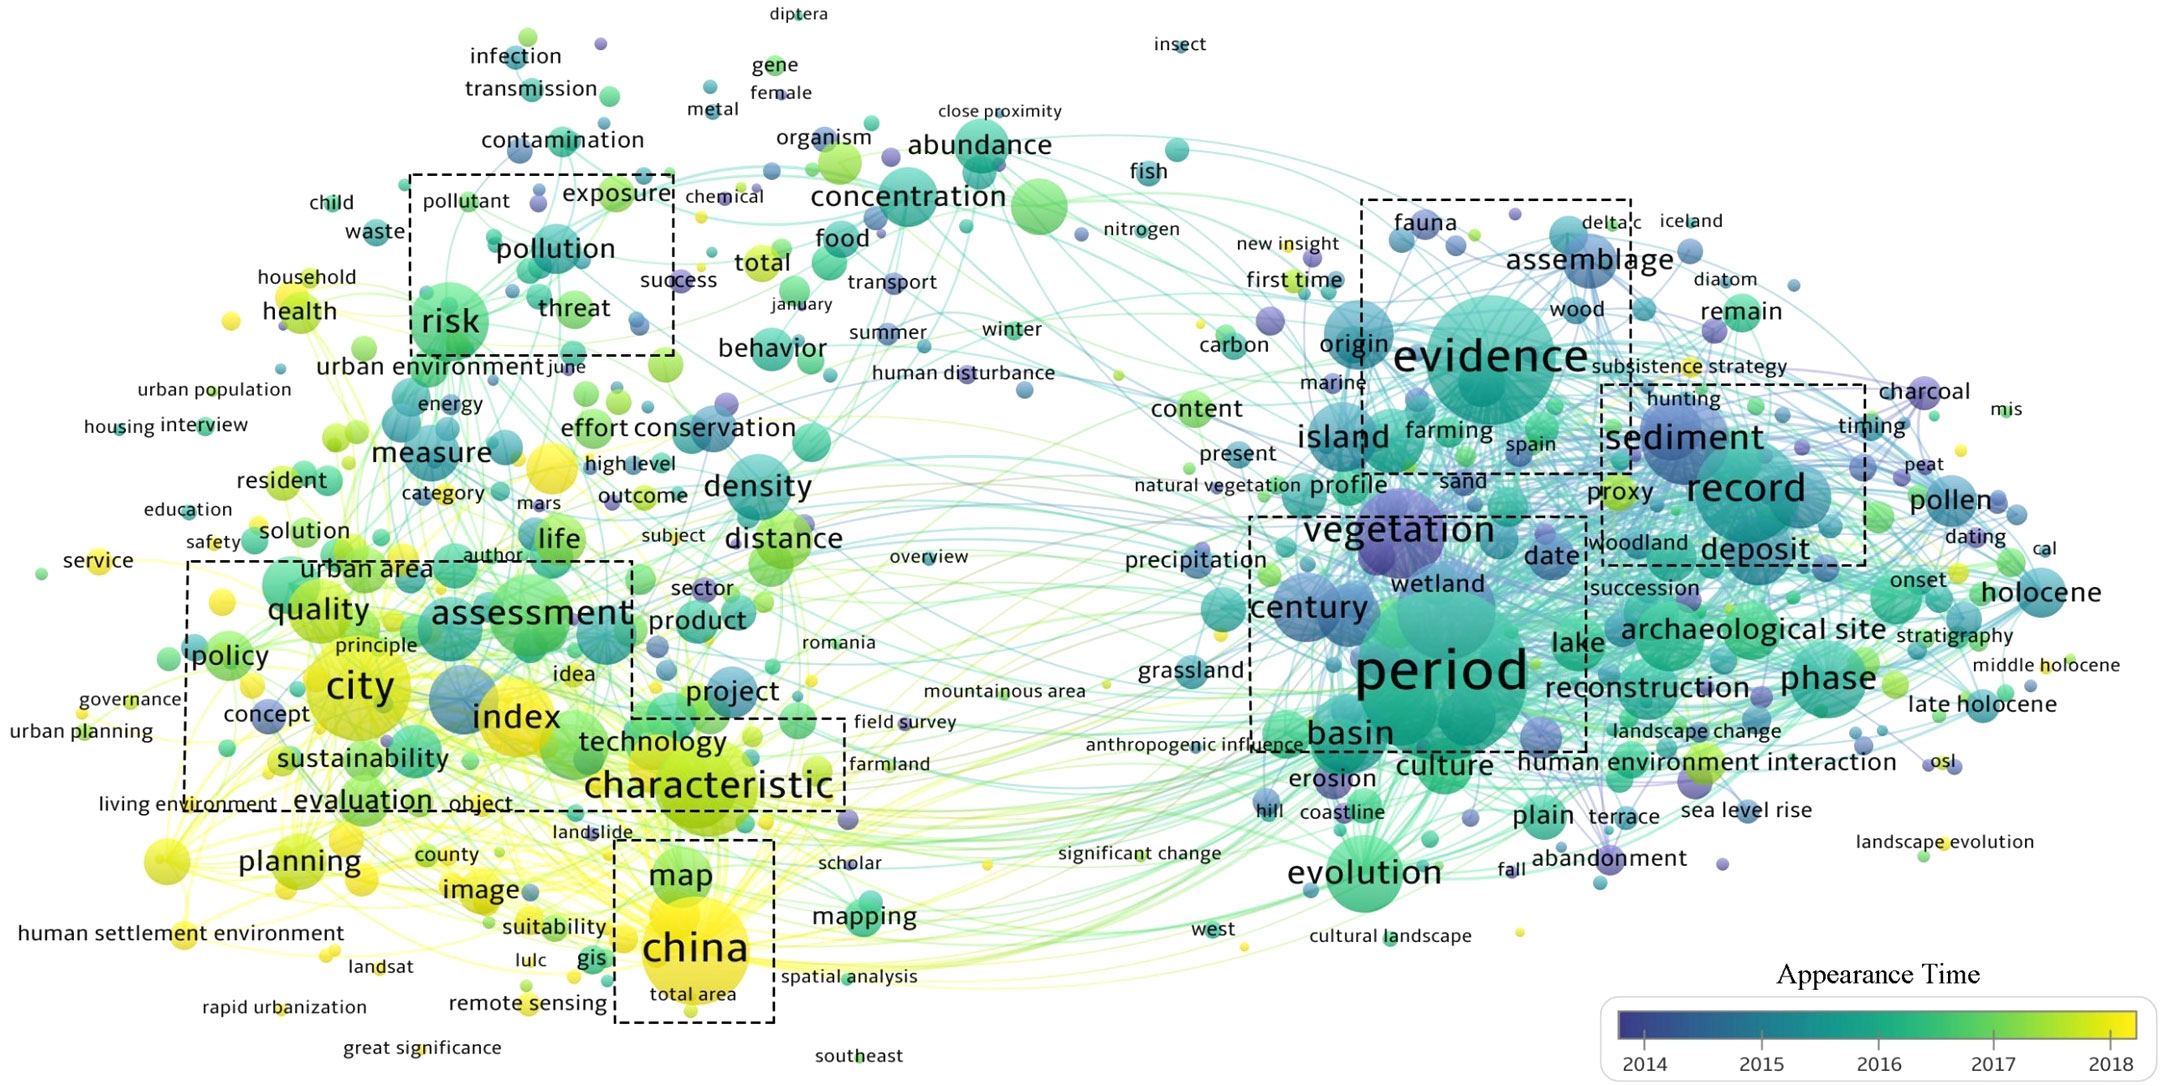
Since the concept of HSE was put forward by Doxiadis in the 1950s, it has been the focus of the research fields of Human settlement science (Hoffmann, 2022), geography (Liu and Li, 2022), ecology (Li G et al., 2021) and urban and rural planning (Luo et al., 2021). Due to its outstanding spatial analysis and computing capabilities, geographic information systems are widely used by scholars in geographic spatial analysis and research on the suitability distribution of human settlements (Wang et al., 2017; Ustaoglu and Aydınoglu, 2020; Luo et al., 2021; Valjarević et al., 2021; Liu and Li, 2022; Younes et al., 2022). In addition, in order to accurately grasp the research progress on the suitability of human settlements in arid areas, we used VOSviewer literature analysis software to search for relevant literature in the Web of Science. Current research hotspots on the suitability evaluation of human settlements in arid areas focus on the historical stages and evolution of human settlements, the risks of human settlements, and the construction of suitability evaluation indicators and systems (Figure 1).
The perspective of previous research has shifted from the traditional natural environment to different preferences based on material, economic, and public services, using the natural breakpoint method in GIS to analyze the spatial distribution characteristics of HSE suitability in central urban areas (Wang et al., 2017). There are also scholars who explore the spatial reconstruction and internal evolution mechanism of the HSE from the perspectives of rural livability, and population mobility (Ma et al., 2022), and use the modified gravity model to evaluate the spatial network of the HSE (Song et al., 2023). From the perspective of grid units, GIS spatial calculation tools are used to analyze the impact of human settlements on landscape fragmentation (Li D. et al., 2021). Some scholars have also constructed an HSE quality evaluation system in GIS from the four dimensions of safety, society, economy, and health (Guo et al., 2023). By constructing a two-stage model of spatiotemporal and factor analysis (Xue et al., 2021), a simulation model for the development of flexible human settlements was established. Use GIS spatial analysis tools to reveal different spatial patterns of human settlements and their influencing factors (Liu and Li, 2022). The research data is transformed from survey data such as statistical yearbooks and questionnaire interviews into geographical data such as satellite images and land use (Wang et al., 2019); its evaluation index system covers physical geography, social economy, and public services. The research scale covers provinces (Yingying et al., 2022; Song et al., 2023), cities (Chen et al., 2022), villages (Zhao et al., 2019), communities (Aghamohammadi et al., 2021), and resettlement in arid areas (Gong et al., 2021; Zhang W et al., 2022).
The vigorous development of the economy, society, and science and technology has brought disruptive progress to the suitability evaluation and spatial distribution research of HSE in arid areas. Feng used the GIS spatial classification method to divide the suitability of the HSE into five levels: unsuitable, borderline suitable, generally suitable, relatively suitable, and highly suitable, assigning values of 1, 2, 3, 4, and 5 respectively. Then a comprehensive evaluation of various factors of the natural environment and cultural environment is carried out, and finally, the natural breakpoint method in GIS is used to grade the suitability results of the HSE (Feng and Zhen, 2022). In addition, Ali Younes also used the geographical information system combined with the fuzzy AHP (analytic hierarchy process) to select a total of 19 indicators of geology, infrastructure, environment, and human factors. After obtaining the single factor weight through the AHP, the unified resolution was imported into GIS for calculation. To study the spatial distribution characteristics of different suitability of human settlements in arid areas, and provide local governments with the best locations for refugee camp settlements based on GIS comprehensive evaluation results (Younes et al., 2022). These methods provide a better paradigm for subsequent research.
The AHP can analyze the impact of different types of factors more objectively than other methods, so it is widely used in research on human settlements and land suitability (Ustaoglu and Aydınoglu, 2020; Chen et al., 2022; Chowdhury et al., 2022; Younes et al., 2022). Chen et al. first used the AHP to determine the weights of natural ecological factors such as terrain relief and vegetation types and human factors such as transportation and GDP. Secondly, 3S technology is used to construct an adaptability evaluation model of human settlements in mountainous areas based on analysis such as projection transformation, remote sensing interpretation, and information extraction, and points out that areas with superior natural environments and developed economies are the most suitable for human settlements (Chen et al., 2022). Xue Luo et al. used GIS to select only five natural environment elements, including surface relief (RDLS), land cover index (LCI), annual average surface temperature (LST), and water resource index (WRI), to analyze the suitability of the HSE in mountainous areas. (Luo et al., 2021). In addition, some scholars have constructed an HSE evaluation index system through the AHP to calculate the index weights, and then combined geographical detectors and GIS spatial overlay analysis (Song and Li, 2023) to explore the suitability of the HSE and land use in urban development (Ustaoglu and Aydınoglu, 2020).
However, although a small number of studies have paid attention to the suitability evaluation of human settlements in arid areas and its spatial distribution characteristics, with the help of some big data such as satellite remote sensing and the AHP (Ustaoglu and Aydınoglu, 2020; Younes et al., 2022; Guo et al., 2023). However, the research data are mostly based on remote sensing data and statistical yearbooks, and there is a lack of refined and long-term field investigation and research on the study area. Research methods mostly use a single questionnaire analysis and AHP, selecting a small number of natural environment or humanistic environment influencing factors, and lack of selecting multiple influencing factors from both natural and humanistic dimensions from an objective and subjective perspective (Wang et al., 2021; Xue et al., 2021). Moreover, there is no scientific selection of indicators after field surveys, and then the AHP is used to construct an evaluation index system for the suitability of human settlements in arid areas and determine the weight of each indicator. More importantly, China’s arid areas have complex terrain, backward transportation, and slow development. The regional population faces many challenges such as environmental degradation, resource shortages, and tense relationships between man and land. In particular, the situation in typical arid areas represented by GS Province is more severe, and the HSE issues in these areas should receive more attention.
Therefore, in order to effectively deal with the above problems, we refer to existing research to effectively combine traditional statistical data with big data such as physical geography, remote sensing images, and land use. And comprehensively consider the influence of natural and cultural environmental factors. In addition, the innovation of this study compared with traditional research is that we conducted a field survey based on the HSE in arid areas, and consulted five experts based on the field survey and interview results to screen out the influencing factors more scientifically and objectively. Then, the GIS spatial analysis method and AHP were used to select 12 evaluation indicators from the two dimensions of natural elements and humanistic elements, and standardized processing was carried out to eliminate the dimensional influence of different data and overcome the inaccuracy of single-factor evaluation. Finally, by constructing a method model suitable for the suitability evaluation of human settlements in arid areas, the suitability of human settlements and its spatial distribution characteristics in arid areas were analyzed and countermeasures were proposed. Therefore, this study can not only provide targeted policy reference for improving the HSE in arid areas but also help to improve the quality of the HSE and its sustainable development in similar areas.
2 Study area and data sources
2.1 Study area
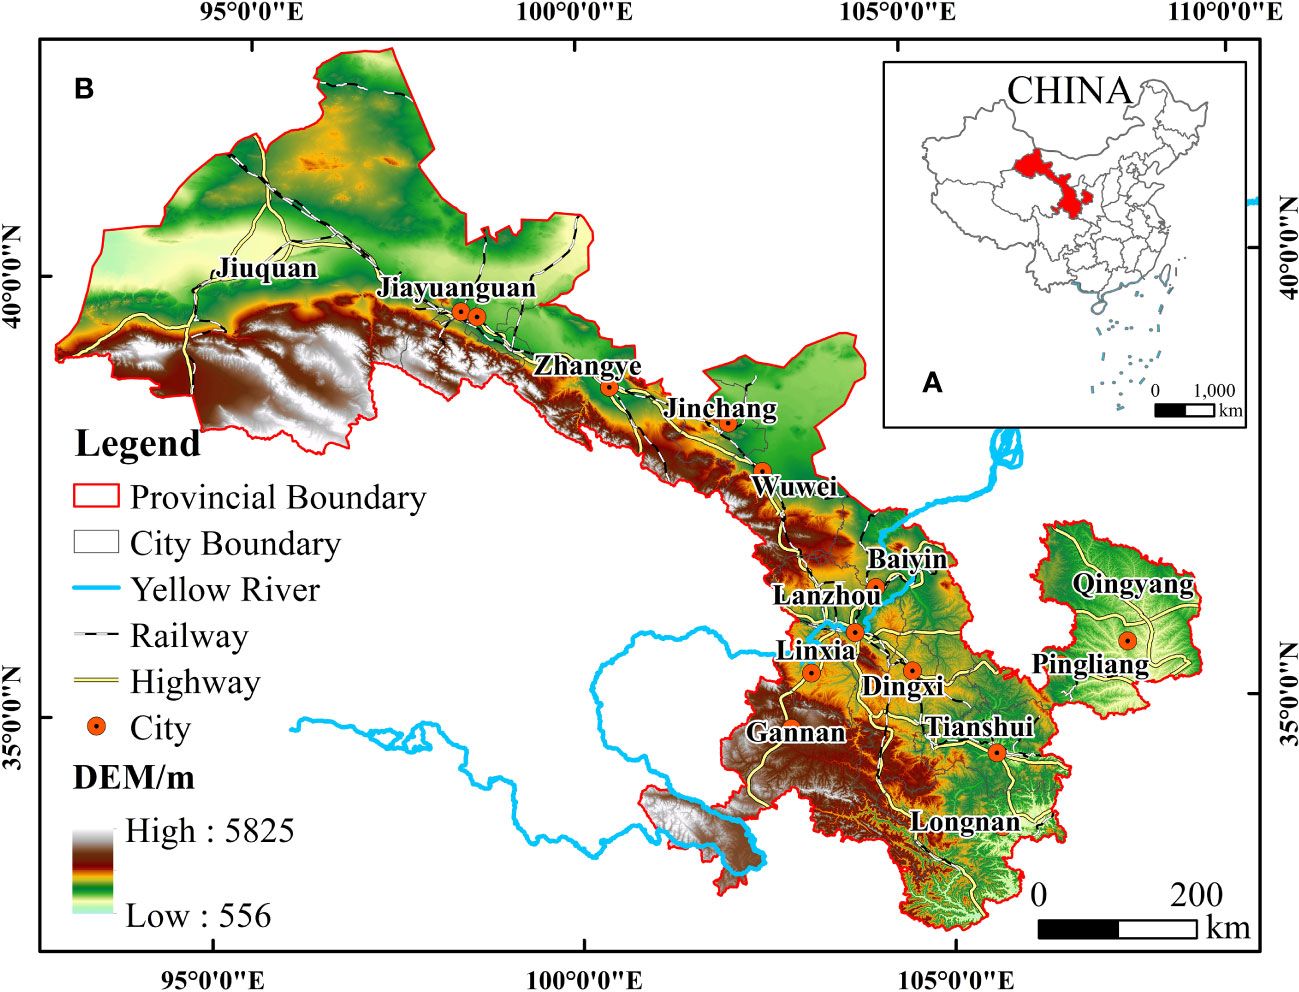
GS Province is located in the arid area of northwest China, with the Yellow River passing through it. The total land area of GS Province reaches 455,900 km², with arid areas accounting for 75% of the total area. The altitude is between 556 and 5825 m (Figure 2). As of the end of 2022, GS Province has a permanent population of 24.9242 million, an urbanization rate of 54.19%, a regional GDP of 1.12016 billion yuan, and a per capita disposable income of 23273.1 yuan. GS Province has a complex topography and a fragile HSE. Its climate types include four major climate types: subtropical monsoon climate, temperate monsoon climate, temperate continental (arid) climate, and plateau alpine climate (Fang et al., 2020). The annual average temperature is 0–15 °C, and most areas have a dry climate; water resources include a total of 9 water systems including the Yellow River, with surface water resources of 28.62 billion m³, and per capita water resources of only 1150 m³, which is far lower than the international standard (2000 m³/person). The topography and climate types of GS Province have similar characteristics to those of southern Kazakhstan, the western United States, and Mongolia. However, extreme climate conditions and heat waves continue to affect the HSE, human livelihoods, and health and well-being in similar areas (Hoffmann, 2022; Zhang D et al., 2022). Therefore, the HSE in arid areas like GS Province should pay more attention.
2.2 Data collection and preprocessing
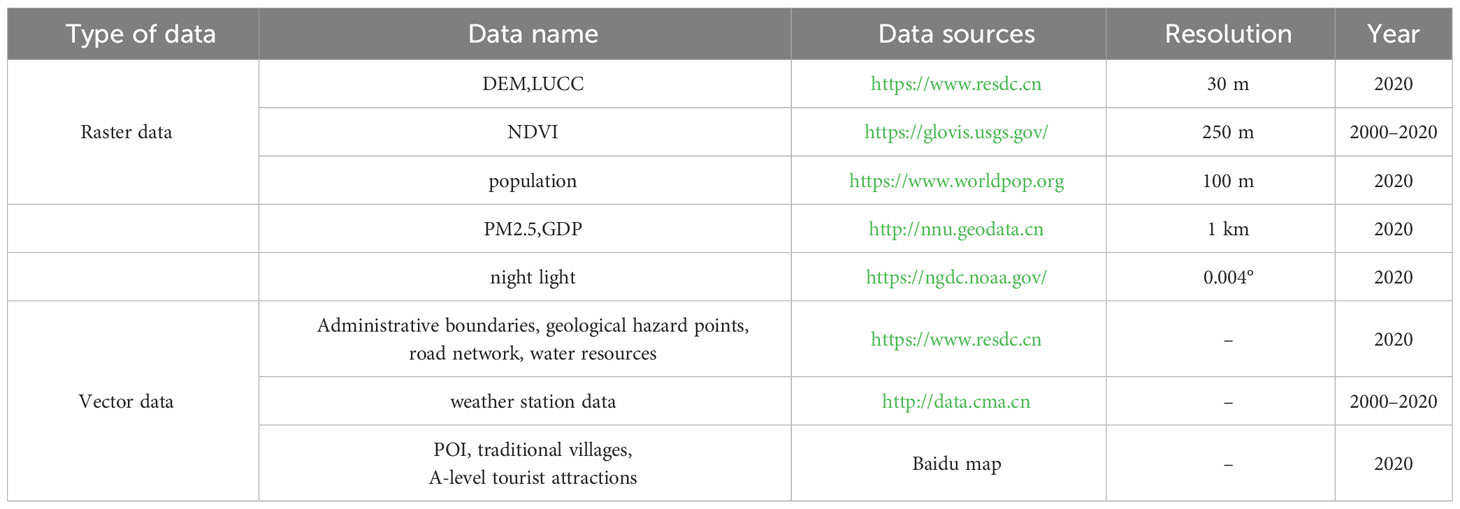
The research data used in this study mainly include raster data and vector data, see Table 1 for details.
(1) Raster data. The land use data and digital elevation model data (DEM) used in this study are from the Resources and Environment Center of the Chinese Academy of Sciences (https://www.resdc.cn). The normalized difference vegetation index (NDVI) is derived from the United States Geological Survey (https://glovis.usgs.gov/). Population density data combines the results of global population data assessments established by the University of Southampton with data from China’s seventh census. PM2.5 and GDP data come from the China National Earth System Science Data Center (http://nnu.geodata.cn). Nighttime light data comes from the National Oceanic and Atmospheric Administration (https://ngdc.noaa.gov/). All raster data are clipped, merged, and converted according to the study area to form a basic database with the same resolution (100 m × 100 m).
(2) Vector data. The administrative boundary, spatial distribution of geological disaster points, road network, water system, and other vector data used in the research are all from the Resource and Environmental Science and Data Center of the Chinese Academy of Sciences (https://www.resdc.cn). The meteorological data comes from the China Meteorological Science Data Sharing Service Platform (http://data.cma.cn/). Due to the discontinuous characteristics of the acquired meteorological data in terms of spatial distribution, the research refers to the existing research (Zhao et al., 2020), using the ArcGIS platform to conduct spatial interpolation analysis on the meteorological data of 58 meteorological stations in the study area and obtain the continuous meteorological data of the entire GS Province. POI data such as shopping, medical care, education, parks, traditional Chinese villages, and A-level tourist attractions are all derived from the 2020 Baidu map. All vector data were subjected to projection conversion, data correction, fusion cropping, and interpolation processing in GIS10.8 software, and then cropped according to the study area to form a basic database with the same resolution (100 m × 100 m).
3 Research methods
3.1 Research technology route
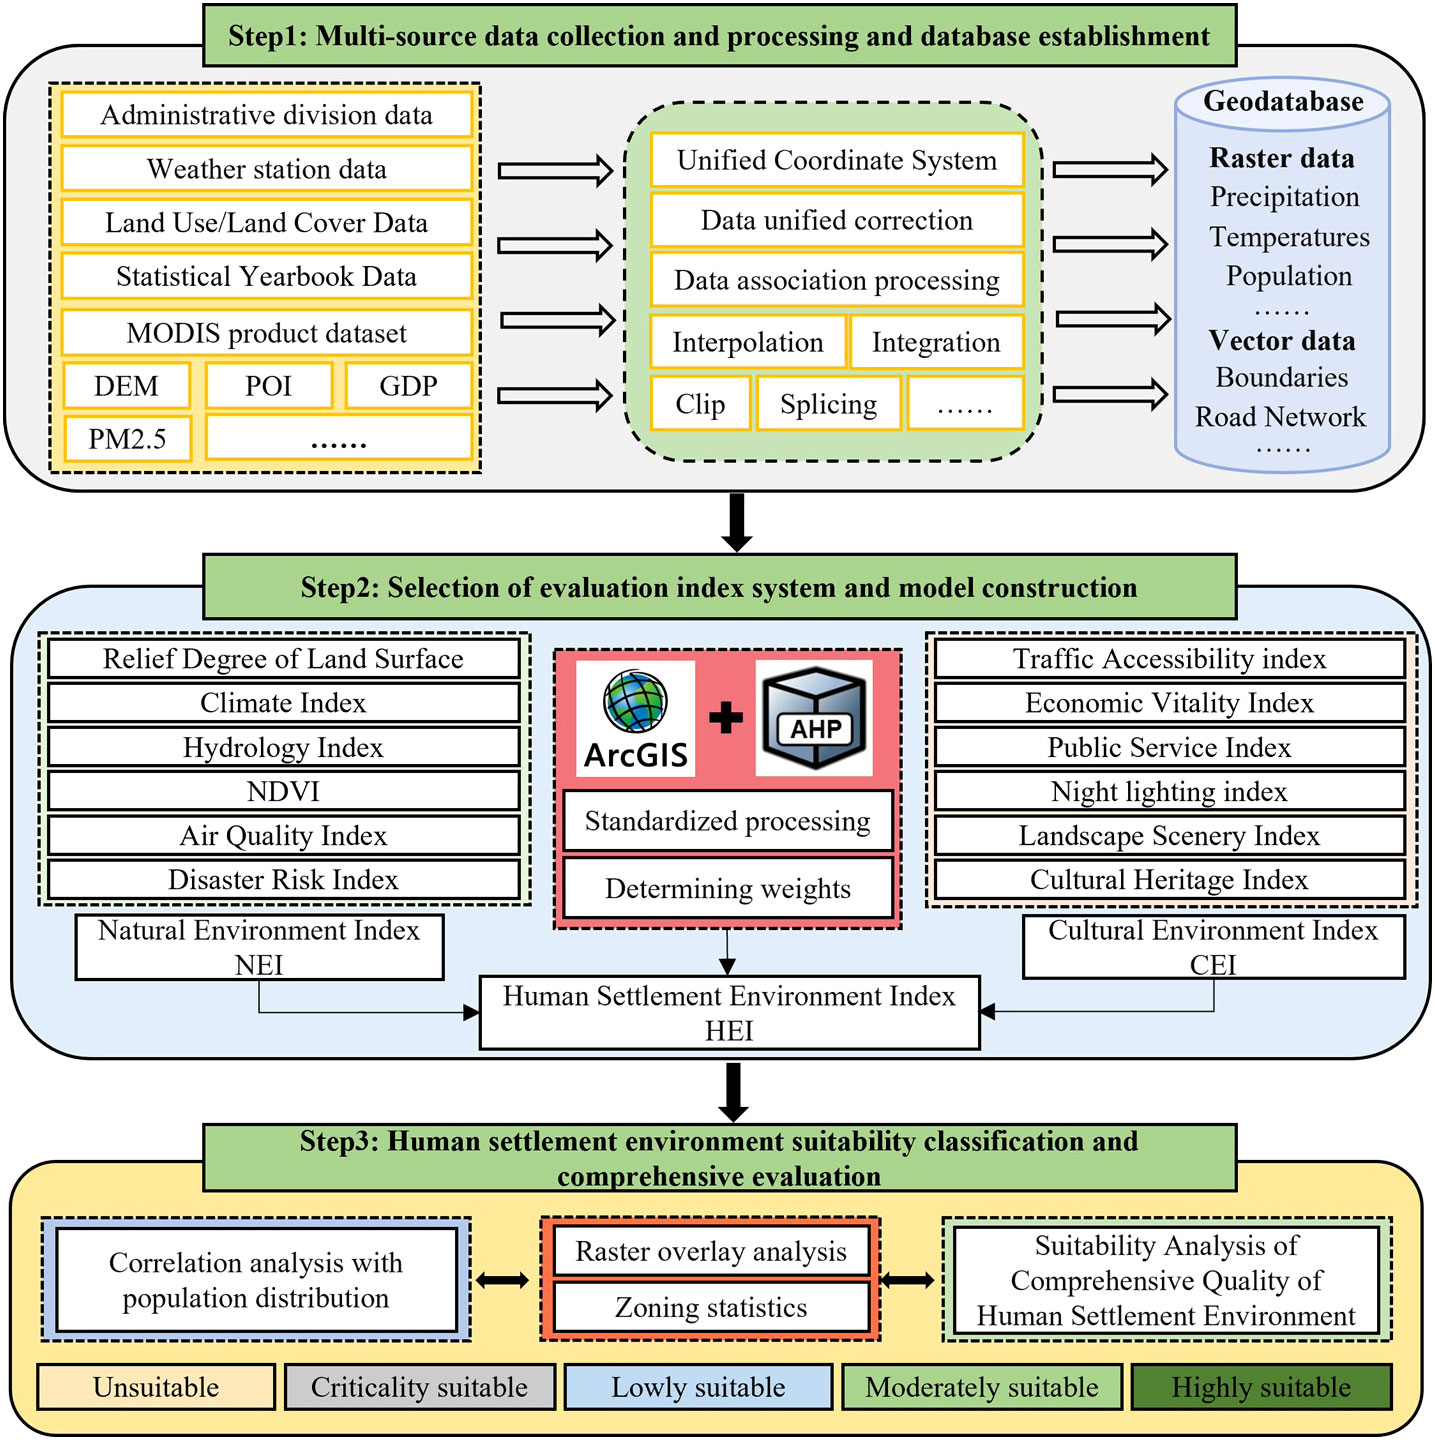
The linear weighting method and the hierarchical synthesis method are commonly used for the comprehensive evaluation of HSE suitability (Aghamohammadi et al., 2021; Xue et al., 2021; Chen et al., 2022; Song et al., 2023). However, the natural conditions in arid areas have absolute restrictions on the HSE. The use of linear weighting cannot well reflect the internal relationship of suitability evaluation indicators (Hao et al., 2020), but the hierarchical synthesis method can obtain more accurate results based on the actual conditions of the study area. Therefore, this study conducted hierarchical calculations and comprehensive evaluations of various influencing factors on the suitability of the HSE and finally used the GIS natural breakpoint method to classify the suitability of the HSE. The technical route is shown in Figure 3. The first step is to collect and process multi-source data and establish a basic database. After the acquired administrative boundaries, meteorological stations, land use, GDP, DEM, and other data are processed in ArcGIS for projection conversion, interpolation processing, etc., a basic database containing raster and vector data is established. The second step is to build the HSE suitability evaluation index system and model. Six indicators were selected to construct the natural environment index and the cultural environment index respectively, and the 12 indicators were processed through the range standardization method in ArcGIS to eliminate the influence of dimensions between different data in the calculation (Guo et al., 2023). Referring to existing literature (Younes et al., 2022), AHP was used to determine the weight of the HSE suitability evaluation index and construct an HSE evaluation model. The third step is the suitability classification and comprehensive assessment of the HSE. Through overlay operations and partition statistics in GIS, and with reference to existing research (Luo et al., 2021), the HSE suitability results are divided into five categories: high suitability, medium suitability, low suitability, critical suitability, and unsuitability. We also spatially matched the population density distribution and the suitability of the HSE to verify the accuracy of the evaluation results (Zhang D. et al., 2022), thereby improving the scientific nature of the research.
3.2 Human settlement suitability evaluation index and calculation method
3.2.1 Natural environment suitability evaluation index
3.2.1.1 Relief degree of land surface
RDLS as a comprehensive representation of regional altitude and surface cutting degree can express regional natural environment conditions and is a basic model for systematic analysis of human settlement suitability. The topographical relief is calculated using the method proposed by Feng et al. (2008):
In the formula: RDLS represents the regional terrain relief; ALT represents the average altitude within a certain area centered on a certain grid unit; (H)max is the highest altitude in the study area; (H)min is the minimum altitude in the study area Elevation; A is the total area of a certain grid area; P(A) is the area with a slope less than or equal to 5° within the area.
3.2.1.2 Climate index
CI reflects the comfort of the living environment to a certain extent and is one of the important indicators for evaluating the livability of a region. Temperature humidity index (THI) is the comprehensive influence of meteorological factors such as temperature and relative humidity on human thermal perception; wind efficiency index (WEI) is the heat exchange between the human body and the surrounding environment. It reflects the comfort level of the local living environment. This study draws on the existing research (Feng and Zhen, 2022), and uses the temperature and humidity index and wind efficiency index as indicators for evaluating the climate suitability of the HSE in the study area. Calculated as follows:
In the formula: THI is the temperature humidity index, WEI is the wind effect index; CI is the climate index; t is the monthly average temperature (°C); f is the relative humidity (%); v is the average wind speed at a height of 10 m above the ground (m/s); s is the sunshine hours (h/d); NTHI and NWEI are normalized temperature and humidity index and normalized wind effect index respectively.
3.2.1.3 Hydrology index
Hydrological conditions in arid areas are an important guarantee for the quality of residents’ lives and living environment. Precipitation and water area are important indicators of the effective reserve and abundance of regional water resources, while water extraction distance reflects the difficulty of obtaining water resources. Therefore, combined with the characteristics of the Northwest arid region, with the help of existing research (Wang et al., 2017; Feng and Zhen, 2022), the hydrological index (HI) was constructed using the water area, distance from the water source, and precipitation to characterize the regional water resource conditions. It is calculated as follows:
In the formula: HI is the hydrological index; NAP is the normalized annual precipitation; WA is the normalized water area; NWD is the normalized distance from the water; α, β, and are the weights of the annual precipitation and the distance from the water, respectively. Referring to relevant research results (Loritz et al., 2019), set α to 0.6, β to 0.2, to 0.2.
3.2.1.4 Normalized difference vegetation index
A good vegetation environment can not only create a comfortable climate environment but also relieve emotional stress. Therefore, areas with more suitable human settlements tend to have relatively higher vegetation coverage (Guo et al., 2023). NDVI is an important remote sensing index that reflects the growth state of vegetation. This index can identify healthy and sparse vegetation areas through the difference in reflection of vegetation at different wavelengths. It is calculated as follows:
In the formula: NIR represents the DN value of the near-infrared band; R represents the DN value of the red band in the MODIS data.
3.2.1.5 Air quality index
PM2.5 is the most common air pollutant in Northwest China, posing a serious threat to the living environment and regional sustainable development (Feng and Zhen, 2022). Air pollutants produced during the development of cities and human society often change the ecological environment of the region, and severe pollution can also cause harm to human survival. Therefore, comprehensively considering the causal relationship between human economic activities and air pollution, PM2.5 is included as the main indicator of AQI in the HSE suitability evaluation system. It is calculated as follows:
In the formula: AQI is the normalized air quality index; (PM2.5)max and (PM2.5)min are the maximum and minimum values of the air quality index, respectively.
3.2.1.6 Disaster risk index
Disaster risk refers to the possibility of personal danger from natural disasters. Due to the special topography and complex geological environment of GS Province, as well as the high degree and large number of geological disaster hazards, the degree of disaster risk is included in the HSE suitability evaluation system with reference to existing literature (Wang et al., 2017). Disaster risk data mainly includes landslides, ground fissures, ground subsidence, landslides, debris flows, slopes, etc. It is calculated as follows:
In the formula: DRI is the disaster risk index, DZZH is the nuclear density of geological hazards, DLD is the distance from the fault zone, , , and are the weights of DZZH and DLD, respectively. After consulting five geological experts in GS Province and two professors of geography Opinions, set and to be 0.55 and 0.45 respectively.
3.2.2 Cultural environment suitability evaluation index
3.2.2.1 Traffic accessibility index
Regional transportation accessibility not only affects regional economic and social development but also directly affects the convenience of residents’ lives. Due to the undulating terrain, high altitude, and crisscrossing mountains in GS Province, the cost distance method can produce more accurate results than the shortest path method. Concerning existing literature (Feng and Zhen, 2022), and with each administrative center in the study area as the source point, the expressway speed standard is set at 100 km/h; the national highway speed standard is 75 km/h; the provincial road speed standard is 60 km/h; the county road speed standard is 40 km/h; the ordinary railway speed standard is 80 km/h, and the high-speed railway speed standard is 200 km/h. Using cost distance to calculate 1 h accessibility of regional road network in ArcGIS. Calculated as follows:
In the formula: TAI is the traffic accessibility index; V is the driving speed, (COST)max and (COST)min are the maximum and minimum values of time cost distance, respectively.
3.2.2.2 Economic vitality index
POI (Points of Interest) contains the spatial location and attribute information of various facilities in the region. Its distribution density and agglomeration trend are important manifestations of regional economic vitality (Feng and Zhen, 2022). Because POI data can only reflect the spatial location and cannot directly represent the intensity of social and economic activities, the economic vitality index (EVI) is constructed by combining the spatial distribution of GDP with the kernel density of POI. The calculation formula is as follows:
In the formula: EVI is the economic vitality index; is the normalized kernel density estimate; NGDP is the normalized total GDP; h is the bandwidth, set to 1km; k is the Gaussian kernel function; xi is i sample points with independent and identical distribution.
3.2.2.3 Public service index
High-quality public services provide basic guarantees for human production and life and directly affect residents’ subjective feelings about the regional cultural environment. Therefore, the public service index (PSI), which consists of the completeness of public service facilities and infrastructure, has an important impact on the quality of the HSE. Refer to the existing literature (Wang et al., 2017; Li D et al., 2021) to analyze the kernel density of the POI data in the study area, count the maximum values of various kernel densities in different regions, and measure each HSE from the four aspects of shopping, medical care, education, and parks degree of infrastructure perfection. Calculated as follows:
In the formula: PSI represents the public service index; represents the weight of shopping, medical care, education, and parks; represents the accessibility index of shopping, medical care, education, and parks in GS Province.
3.2.2.4 Night lighting index
The night light comes from the DMSP/OLS sensor of the linear scanning service system carried by the US meteorological satellite. The system uses visible light/near-infrared bands to retrieve the night light index (NLI), and the gray value ranges from 0 to 63. The NLI can better reflect the degree of regional population agglomeration, economic vitality, and urbanization development level. Therefore, referring to existing research (Luo et al., 2021; Yang et al., 2022), the night light is included as an important evaluation index of the humanistic elements of the HSE. Calculated as follows:
In the formula: NLI is the night light index; (NLI)max and (NLI)min are the maximum and minimum values of night light, respectively.
3.2.2.5 Landscape scenery index
Good landscape style is an important component of a high-quality HSE, which can directly or indirectly improve residents’ happiness and satisfaction in life (Sowifska-fwierkosz, 2016). Therefore, the study selects A-level scenic spot data and uses ArcGIS analysis tools to obtain its kernel density and normalize it to build landscape scenery index (LSI). Calculated as follows:
In the formula: LSI is the landscape index; (LSI)max and (LSI)min are the maximum and minimum values of the kernel density of tourist attractions, respectively.
3.2.2.6 Cultural heritage index
The good cultural heritage of the region can not only cultivate people’s aspirations, but also root their hometown feelings and improve residents’ sense of belonging and identity (Foster and Saleh, 2021). GS Province also has an extremely rich number of traditional villages, but their locations are relatively scattered and the terrain seriously hinders spatial connectivity and accessibility, making it impossible to conduct a SWOT analysis of a single cultural heritage value. Therefore, the study selects the normalized value of traditional village core density to construct regional CHI, which can better comprehensively reflect the cultural heritage of the HSE. Calculated as follows:
In the formula: CHI is the cultural heritage index; (CHI)max and (CHI)min are the maximum and minimum values of kernel densities of traditional villages and intangible cultural heritage, respectively.
3.2.3 Construction of evaluation model for the suitability of human settlement
When evaluating the suitability of human settlement, both natural and human factors should be considered comprehensively. Therefore, the study calculates the natural environment element index of human settlement, the cultural environment element index, and the comprehensive index of HSE suitability respectively (Luo et al., 2021). The calculation formula is as follows:
In the formula: is the natural index of the i-th grid; is the cultural index of the i-th grid; is the comprehensive human settlement index of the i-th grid. a is the weight of RDLS; b is the weight of CI; c is the weight of HI; d is the weight of NDVI; e is the weight of AQI; f is the weight of DRI. g is the weight of the TAI; h is the weight of the EVI; i is the weight of the PSI; j is the weight of the NLI; k is the weight of the LSI; l is the weight of the CHI.
3.3 Determination of the weight of evaluation indicators for the suitability of human settlement
3.3.1 Index standardization based on GIS
The data sources, statistical methods, and data formats of different indicators are different. Therefore, this study uses the range standardization method to standardize each single factor index to eliminate the dimensional influence of different data and overcome the inaccuracy of single factor evaluation. Positive indicators such as the CI, HI, NDVI, AQI, TAI, EVI, PSI, NLI, LSI, and CHI can adopt the maximum effect standardization formula (21), that is, the larger the value, the greater the suitability, and vice versa. The minimum effect standardization formula (22) can be used for reverse indicators such as RDLS and DRI, that is, the larger the value, the smaller the suitability, and vice versa.
In the formula: is the normalized value of a certain index of the i grid; is the original value of the i grid point; is the maximum value of all grids; is the minimum value of all grids.
3.3.2 Determining the index weight based on AHP
Firstly, according to the suggestions of 5 experts and scholars from GS Province on the current situation and characteristics of the HSE in the study area, the importance of the evaluation index of the HSE in the arid area was ranked. Then, the AHP method was used to determine the weight value of each evaluation index in the evaluation of the suitability of the human settlement in the study area, and a framework for the evaluation of the suitability of the human settlement was constructed (Figure 4). Specific steps are as follows:

Figure 4 The suitability evaluation framework of human settlement ((A) is the target layer, (B) is the comprehensive layer, and (C) and (D) are the index layers).
3.3.2.1 Build a judgment matrix
The judgment matrix in the AHP is a key step in quantifying the weight of indicators, which determines the applicability of the weights of various indicators of the suitability of human settlement. By referring to existing research literature (Luo et al., 2021; Younes et al., 2022), and refer to scholars compare the evaluation indicators in the target layer, criterion layer, and index layer in pairs, to construct the judgment matrix.
3.3.2.2 Calculate the weight of a single factor
Because the natural elements and human elements in the HSE are equally important, when calculating the maximum eigenvector and maximum eigenvalue of the judgment matrix constructed above, normalization is performed.
In the formula, is the weight value of the evaluation factor, is the normalization of the eigenvector, and is the eigenvector of the judgment matrix.
Firstly, the judgment matrix of the criterion layer is constructed with the aid of the AHP software, and its relative weight value is calculated (Table 2).
Secondly, construct the suitability judgment matrix of the natural environment (Table 3) and cultural environment (Table 4), and their relative weight values.
3.3.2.3 Single judgment matrix consistency test
To avoid the judgment matrix being largely subject to the subjective limitations of human factors, it is necessary to conduct a consistency check on the constructed judgment matrix. That is, the maximum eigenvalue is brought into the following formula to calculate the consistency index:
In the formula, the Consistency index (CI) is the consistency test index; n is the number of judgment matrix indexes; is the maximum eigenvalue. When CI = 0, the matrix has complete consistency, and the closer to 0, the better the consistency, and vice versa.
3.3.2.4 Integrity judgment matrix consistency test
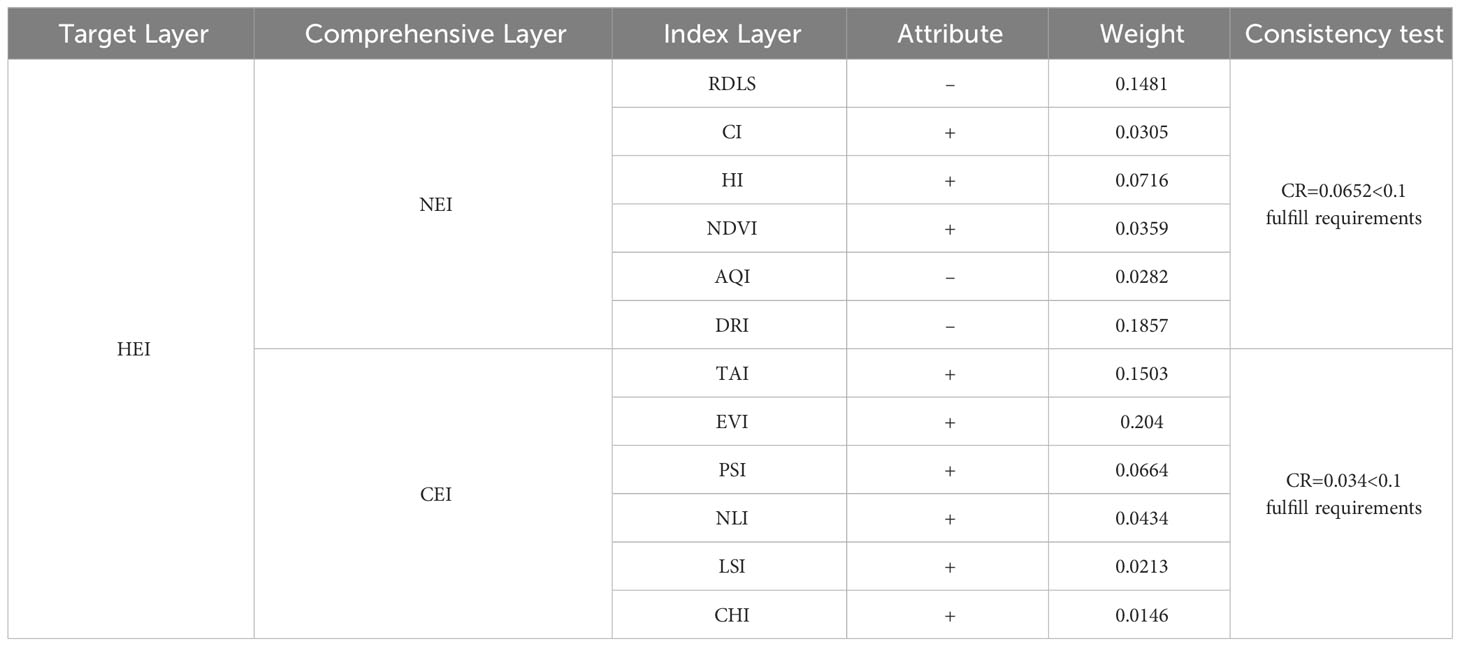
In the formula, the Random Consistency Index (RI) is the consistency inspection index. According to the ci and RI calculated above, use the formula (27) to calculate the CR value, When CR < 0.1, the judgment matrix can meet the consistency verification, and the quantified index weight will appear, otherwise it should be modified until the condition is met. The final results show that the CR of the judgment matrix are: 0, 0.0652, and 0.034, respectively, and their values are all less than 0.1, indicating that the consistency of the matrix is good. Finally, the weights of each index are shown in Table 5.
3.4 Comprehensive evaluation method for the suitability of human settlement
In the process of comprehensive evaluation of the HSE in arid areas, RDLS, CI, HI, NDVI, AQI, and DRI are selected for the natural environment, and TAI, EVI, PSI, NLI, LSI, and CHI are selected for the cultural environment to establish a comprehensive evaluation of the suitability of the HSE. (Formula (1)–Formula (20)). The spatial resolution of all indices is unified to 100 m × 100 m, and then the index weights are obtained according to the AHP, and mathematical operations and spatial superposition analysis are performed in GIS. Finally, the comprehensive evaluation results of the suitability of HSE in arid areas are obtained (the higher the suitability, the closer to 1, and vice versa). In addition, in order to verify the credibility of the HSE suitability evaluation model in arid areas, the HEI was first spatially aligned with population density distribution and land area data in the spatial analysis module in the ArcGIS toolbox. Then the suitability index, population density, and land area of each pixel in the corresponding raster are calculated. Finally, the obtained data was imported into SPSS software to perform cross-Pearson correlation analysis, and the suitability of the HSE in arid areas was fitted to a certain extent with the help of the frequency cumulative percentage curve.
4 Results and analysis
4.1 Evaluation of the suitability of natural environment in GS Province
4.1.1 Comprehensive suitability of natural environment
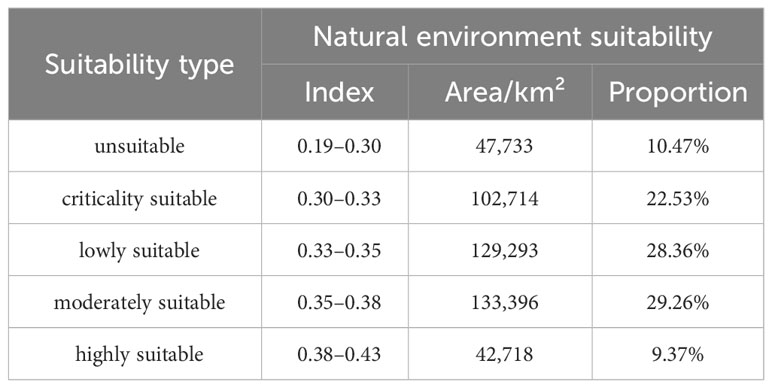
The natural environment index of GS Province is significantly higher in the eastern and central parts than in the northwest, with large local differences. The five types of suitability areas are MZ (133,396 km²) > LZ (129,293 km²) > CZ (102,714 km²) > UZ (47,733 km²) > HZ (42,718 km²) (Table 6). Among them, Qingyang City has a relatively high natural environment index due to its geographical location close to the Yellow River Basin, few natural disasters, high vegetation coverage in most areas, and relatively sufficient precipitation; Longnan City in the southeast has serious soil erosion, landslides, and debris flows. The frequency of natural disasters such as natural disasters is relatively high, so the overall suitability of the natural environment for human settlements is low. Jiuquan City in the northwest is adjacent to the Qilian Mountain National Nature Reserve in the south and has undulating terrain, is close to the desert in the north, and has scarce precipitation. Therefore, the natural environment index is relatively low.
The study used the natural breakpoint method to divide the natural environment index of human settlement in GS Province into HZ (0.38–0.43), MZ (0.35–0.38), LZ (0.33–0.35), CZ (0.30–0.33), UZ (0.19–0.30). The results of the study found that the NEI in GS Province was between 0.19 and 0.43 (Figure 5A), the suitability of the natural environment for human settlement was dominated by MZ and LZ, and the area of high suitability for the natural environment was the smallest, which was the same as the previous research results (Wei et al., 2022). Among them, the natural environment unsuitable zone is mainly distributed in the nature reserves in the southwest and the disaster-prone areas in the southeast. In Tianshui City in the middle, due to the restrictions on historical relics and blocks, the traffic network in some areas is blocked, and the geographical environment leads to backward infrastructure., so the suitability of these areas is significantly lower than that of the surrounding area (Figure 5B).
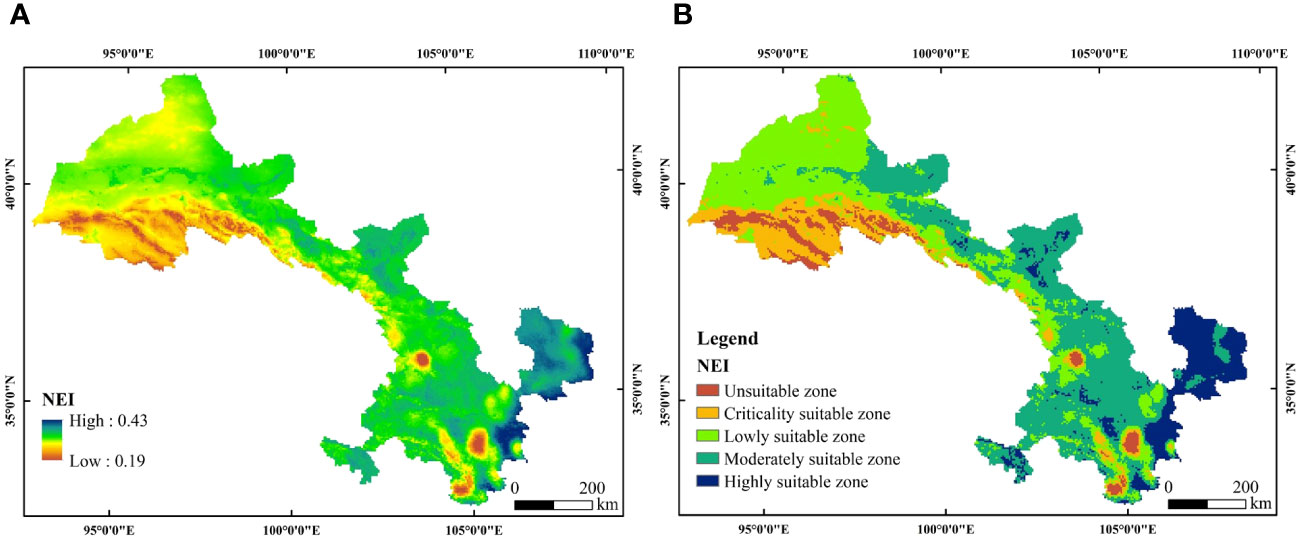
Figure 5 Spatial distribution of natural environment quality and suitability in GS Province: (A) is the natural environment index, (B) is the suitability of the natural environment.
4.1.2 Single factor suitability of the natural environment
The RDLS in the study area presents spatial distribution characteristics of steepness in the south and gentleness in the north, with an index between 0.59 and 6.33 (Figure 6A). Affected by the Qilian Mountains and other mountains along the line, the mountainous terrain in the southern part of the study area is the most undulating, and the north is close to the Tengger Desert in Inner Mongolia. The terrain is relatively flat, so RDLS exhibits significant spatial distribution characteristics. The CI in the southeast of the study area is significantly higher than that in the northwest, with the index ranging from 0.01 to 0.85. The northeast is close to Xinjiang and Inner Mongolia and has the characteristics of high altitude, large temperature difference between day and night, and low precipitation, so the CI is overall low; while the southeast is located in the Yellow River Basin, with relatively low altitude, relatively high vegetation coverage, and relatively abundant precipitation, so the CI is relatively high (Figure 6B). HI in the study area shows a spatial distribution characteristic of being high in the southeast and low in the northwest, with the index ranging from 0 to 0.96 (Figure 6C). The southeast is close to the Yellow River Basin, so the water source is relatively abundant, and the relatively flat terrain is conducive to water collection for life and industry in GS Province. The northwest has high altitude, arid climate, and crisscross ravines, resulting in less precipitation and difficulty in water collection. Therefore, the HI is generally low.
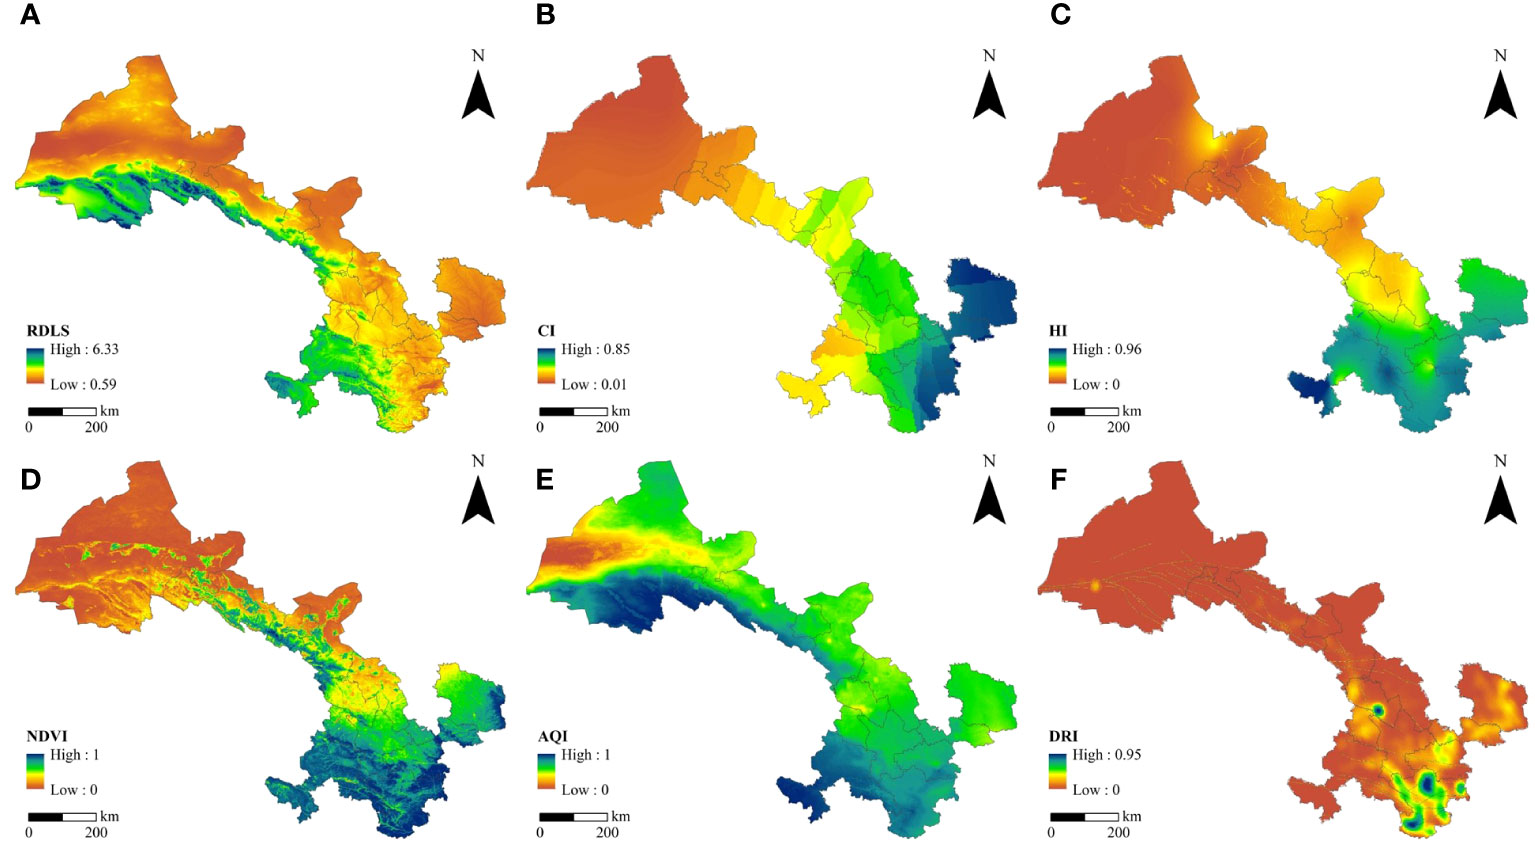
Figure 6 Spatial distribution of the suitability of each index of the natural environment in GS Province: (A) is Relief degree of land surface, (B) is Climate Index, (C) is Hydrology Index, (D) is Normalized Difference Vegetation Index, (E) is Air Quality Index, (F) is Disaster Risk Index.
The NDVI of the study area shows a spatial distribution characteristic that is significantly higher in the southern mountainous area than in the northern desert area (Figure 6D). Due to its proximity to the Yellow River Basin, relatively abundant precipitation and water sources, and good vegetation growth conditions, the vegetation coverage in the southern part is significantly higher. In the northern desert area. The AQI in the study area shows spatial aggregation characteristics of surface shape in the north and point shape in the middle, with an index of 13.9–53.9 (Figure 6E). Regional PM2.5 high-value areas are mainly concentrated in the main urban areas of Jiuquan City and Lanzhou City, which are dominated by secondary industries, with an average value as high as 53.9 μg/m3; low-value areas are concentrated in the southern Qilian Mountains and Gannan Prefecture, with an average value of only 13.9 μg/m3. The DRI in the study area shows a significantly different spatial distribution characteristic that gradually decreases from south to north (Figure 6F). Due to the comprehensive influence of precipitation, soil type, and geological environment, Longnan City has the highest number of landslides and debris flows, so the DRI is the highest in the south; Zhangye City, Jinchang City, and the northern part of Jiuquan City in the study area have low water and arid climate all year round. The historical number and frequency of disasters are low, so the DRI is the lowest.
4.2 Evaluation of cultural environment suitability in GS Province
4.2.1 Comprehensive suitability of the cultural environment
The quality of human settlements and cultural environment in GS Province shows the characteristics of a circle gradually decreasing from the central city as the core to the surrounding areas. The comprehensive index of cultural environment is between 0.00–0.5. The quality of the cultural environment in the main urban area of Lanzhou City is the highest and the southern mountainous area of Jiuquan City is the lowest (Figure 7A). As the administrative center of GS Province, Lanzhou City has complete urban functions, a relatively concentrated population, complete supporting facilities, and a developed transportation network. Therefore, the overall human settlement and cultural environment is relatively high. However, the northern mountainous area is sparsely populated and has a harsh geographical environment. At the same time, the high mountains and steep slopes hinder the development of production and life. Therefore, the quality of the humanistic environment is the lowest, which also highlights the necessity and urgency of implementing immigration (Zhang W et al., 2022). In addition, there are many towns and larger villages scattered along the main transportation roads. These areas have developed transportation and although the living standards of residents are not as good as those in urban areas, their comprehensive index of humanistic factors is higher compared with villages in mountainous areas.
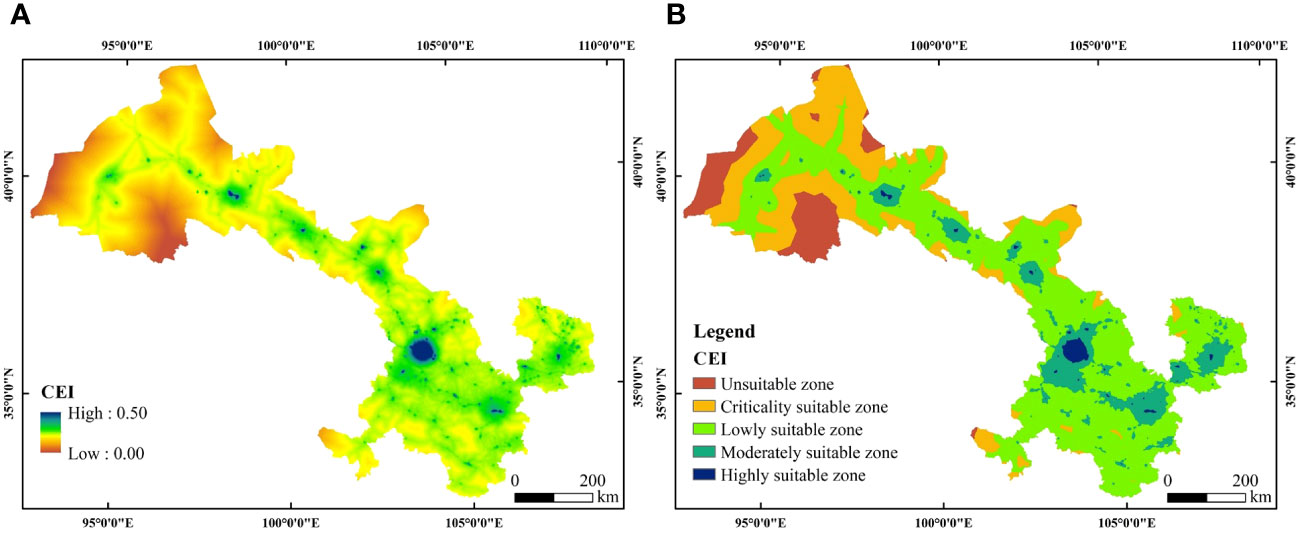
Figure 7 Spatial distribution of cultural environment quality and suitability in GS Province: (A) is the cultural environment index, (B) is the cultural environment suitability.
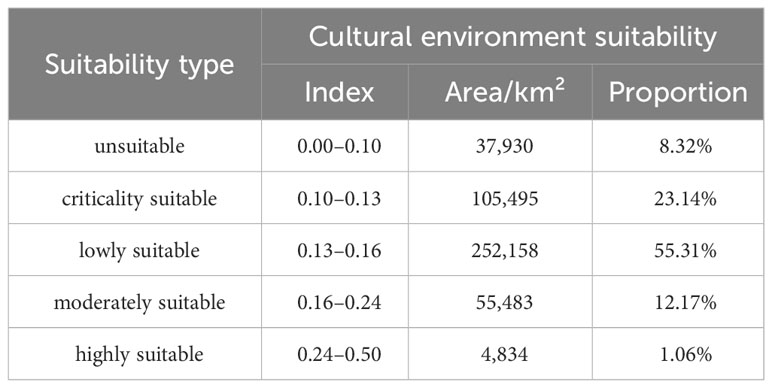
The ArcGIS natural breakpoint method was used to classify the human settlement and cultural environment index of GS Province into unsuitable (0–0.10), low suitable (0.10–0.13), borderline suitable (0.13–0.16), medium suitable (0.16–0.24), and high suitable (0.24–0.50) and other five categories. The research results found that the LZ area accounts for the largest proportion and the HZ area accounts for the smallest proportion in the suitability of human settlement and cultural environment in GS Province. The five types of suitability area sizes are LZ (252,158 km²) > CZ (105,495 km²) > MZ (55,483 km²) > UZ (37,930 km²) > HZ (4,834 km²) (Table 7). Among them, the humanistic environment UZ is mainly distributed in the edge area of the Tengger Desert in the north and the mountainous area in the south. Lanzhou City in the center has a relatively concentrated population density, complete public service facilities, and the Yellow River passing through the city, which makes its landscape and historical and cultural heritage relatively small. High, so the regional suitability is significantly higher than that of surrounding cities (Figure 7B).
4.2.2 Single factor suitability of the cultural environment
The TAI in the study area spatially shows the distribution characteristics of high in the east and low in the west, high in the south and low in the north, high in the flatland and low in the mountainous area, and the distribution pattern of TAI is consistent with the sparseness of the road network, and the index is between 0 and 1 (Figure 8A). The EVI of the study area shows the spatial differentiation characteristic of decreasing step by step from the central city to the surrounding townships, presenting a significant central circle structure, with an index in the range of 0–0.86, of which Lanzhou City has the highest EVI, followed by Jiuquan City (Figure 8B). The spatial distribution pattern of PSI in the study area is similar to the trend of EVI changes, showing a trend of decreasing step by step from the central city to the surrounding areas, with the index lying between 0 and 1 (Figure 8C), the more economically dynamic and densely populated the area, the higher the PSI, and vice versa, the lower the PSI.
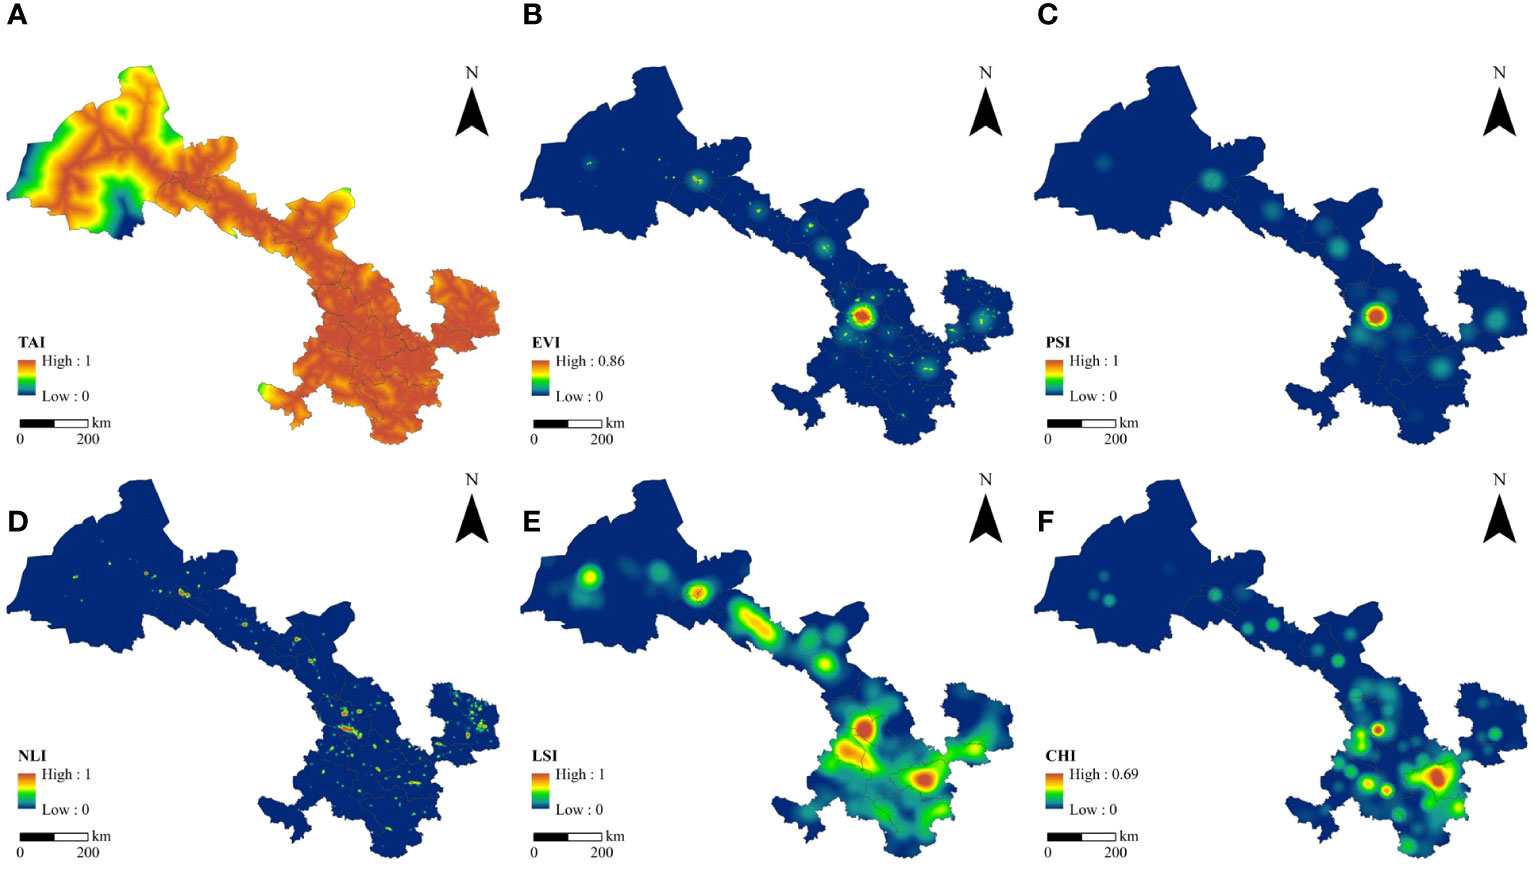
Figure 8 Spatial distribution of the suitability of various indicators of the cultural environment in GS Province: (A) is Traffic Accessibility Index, (B) is Economic Vitality Index, (C) is Public Service Index, (D) is Night light index, (E) is Landscape Scenery Index, (F) is Cultural Heritage Index.
The NLI in the study area shows star-shaped spatial differentiation characteristics, with the maximum value located in the central city, and the index ranges from 0 to 63 (Figure 8D). Affected by the administrative hierarchical structure, the central urban area is significantly higher than the surrounding areas, and the urban areas are larger. The LSI in the study area shows spatial differentiation characteristics of high in the middle and low on the four sides, with the index ranging from 0 to 1 (Figure 8E). It mainly has the characteristics of a circle extending from the center to Lanzhou City, Tianshui City, and Longnan City in the center. In addition, it also forms a spatial distribution characteristic of a significant band-like distribution of LSI in and around the Hexi Corridor in the north and its surrounding areas. The CHI in the study area shows a spatial distribution characteristic of gradually decreasing from Tianshui City in the south to the surrounding areas, and the CHI in the south is significantly higher than that in the north (Figure 8F), with the index ranging from 0 to 0.69.
4.3 Comprehensive suitability evaluation of HSE in GS Province
4.3.1 Spatial distribution characteristics of comprehensive suitability of human settlement
The comprehensive suitability of the HSE in GS Province shows a spatial distribution characteristic of gradually decreasing from the central urban area to the surrounding areas. The suitability index is between 0.26 and 0.71 (Figure 9A), with the highest in the central urban area of Lanzhou and the southern part of Jiuquan City. The lowest in mountainous areas. Lanzhou City has a relatively concentrated population and obvious transportation location advantages. It is an important node city in the Belt and Road strategy and the core city of the Lanxi urban agglomeration. Therefore, its natural and cultural environment suitability is relatively high (Figure 9B). Secondly, the five cities in the Hexi Corridor have a unique geographical environment that breeds rich natural scenery and scenic spots. Therefore, industries and populations are concentrated in the central city, thus improving the quality of the HSE to a certain extent. However, due to the vast land, sparse population, and special geographical environment, the rural areas in these areas are relatively scarce in resources and the supporting facilities are relatively backward. Therefore, the suitability of the HSE is rapidly declining.
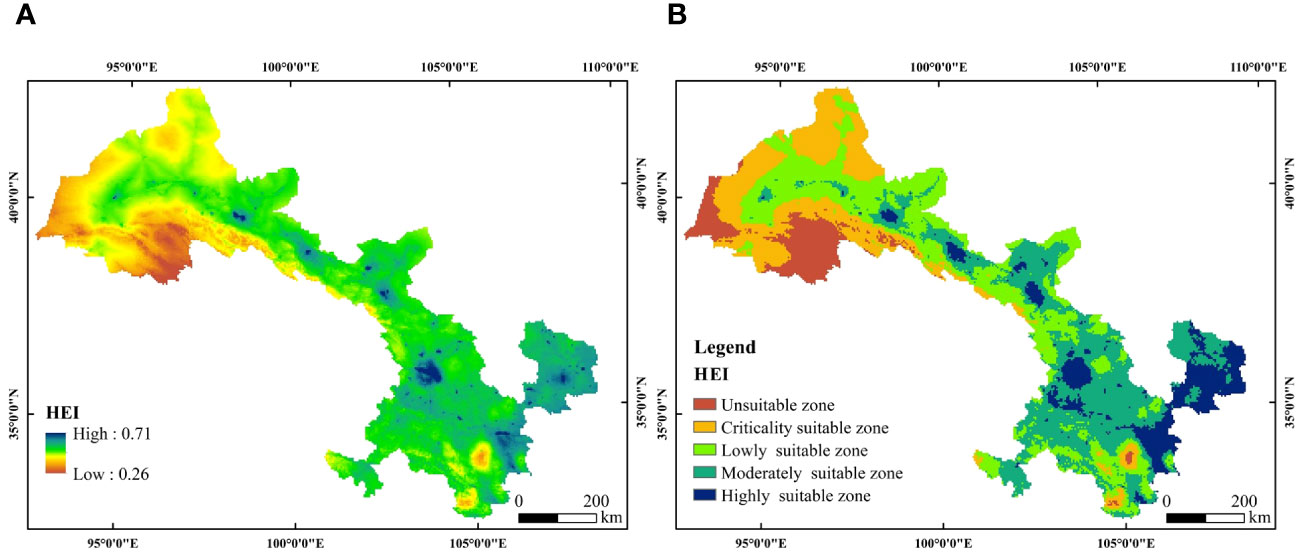
Figure 9 Spatial distribution of HSE quality and suitability in GS Province: (A) is the human settlement environment index, (B) is the suitability of the human settlement environment.
4.3.2 Different types of zoning for the suitability of human settlement
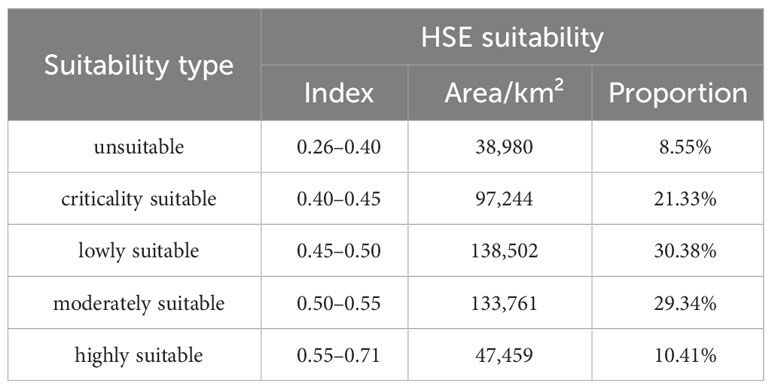
The ArcGIS natural breakpoint method was used to classify the HEI of GS Province into unsuitable (0.26–0.40), low suitable (0.40–0.45), borderline suitable (0.45–0.50), moderately suitable (0.50–0.55), and highly suitable (0.55–0.71). The research results found that the comprehensive suitability of the HSE in GS Province is dominated by LZ (138,502 km²) and MZ (13,3761 km²), with UZ (38,980 km²) accounting for the smallest area (Table 8). The proportions of the five types of HSE suitability are LZ (30.38%) > MZ (29.34%) > CZ (21.33%) > HZ (10.41%) > UZ (8.55%).
4.3.2.1 Highly suitable zone
The HSE highly suitable zone (HZ) is 47,459 km², accounting for 10.41% of the total area, with a suitability index of 0.55–0.71, and is mainly located in the southeastern part of the study area, as well as the main urban areas of the cities in the central Hexi Corridor, with a small portion of them located in the suburbs and tourist attractions. It presents the characteristics of multi-core spatial distribution with Qingyang City as a belt, Lanzhou City as a block, and Zhangye City as a point, this type of Habitat HZ has a relatively concentrated population and convenient urban transport, and the vitality of economic development is much greater than that of the surrounding areas.
4.3.2.2 Moderately suitable zone
The HSE moderately suitable zone (MZ) is 133,761 km², accounting for 29.34 percent of the total area, with a suitability index between 0.50 and 0.55, mainly distributed in the central part of the study area, around the HZ and with a high degree of integration of geographic location. It presents the spatial distribution characteristics of spreading step by step from the central city to the surrounding area, mainly in the main urban areas of Lanzhou City, Tianshui City, and the suburbs of the city, and these areas are subject to the convenience of transport facilities and public services brought by the HZ and also form a relatively concentrated economic and social development trend.
4.3.2.3 Lowly suitable zone
The HSE lowly suitable zone (LZ) is 138,502 km², accounting for 30.38% of the total area, with a suitability index of 0.45–0.50, and is mainly distributed in the northwestern part of the study area, with a few areas in the central part. It presents the spatial distribution characteristics of the band in the northwest, point in the center, and circle in the south concentrated in the urban fringe area, of which Jiuquan and Jiayuguan cities have the largest proportion of human settlement LZ. These areas, due to the extension of the transport network of the central city and the trade of foreign economy, drive the local population gathering and economic development, but the public service facilities are not perfect enough and only meet the basic needs of human survival.
4.3.2.4 Criticality suitable zone
The HSE criticality suitable zone (CZ) is 97,244 km², accounting for 21.33% of the total area, and the suitability index is between 0.40 and 0.45, mainly distributed in the northern part of the study and around the Qilian Mountain Reserve, as well as a small area in the south. The spatial distribution of the Tengger Desert fringe and Qilian Mountain Reserve to the core city of the Hexi Corridor is characterized by a band shape. This type of area is already difficult to meet the needs of human production and life due to the fragile ecological environment, low transport accessibility, and backward public service facilities.
4.3.2.5 Unsuitable zone
The HSE unsuitable zone (CZ) is 38,980 km², with the smallest area share of 8.55%, and the suitability index is in the range of 0.26–0.40, and it is mainly distributed in the south-west of the study area, located in the area where the Qilian Mountains and the Tibetan Plateau meet, and a small portion of it is located in the southern geological disaster area of Longnan City. These areas have always been unsuitable for human habitation due to the perennial snow and ice cover, the growth of primitive forests, and the lack of transport networks, but this does not mean that these areas do not have value; on the contrary, these areas are rich in natural resources and ecological products for the arid zone, and always maintain the security and stability of the regional ecosystem.
4.4 Matching of population distribution and human settlement suitability
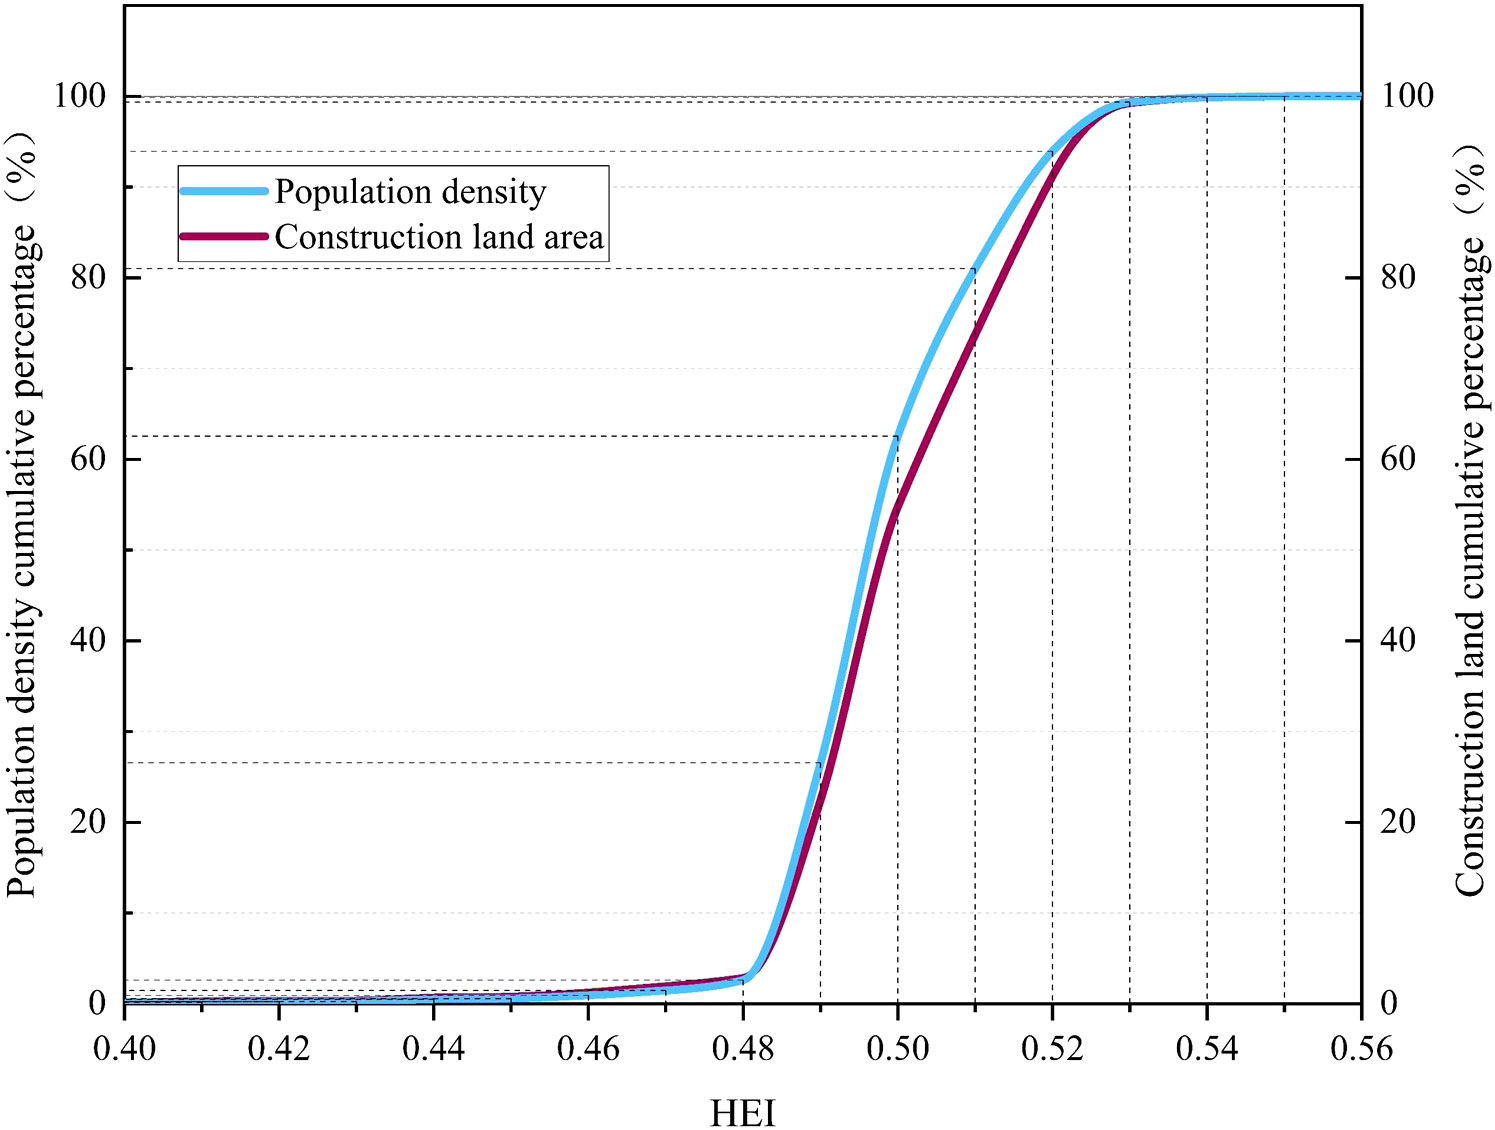
The HSE is a product created by human production and life in natural and social environments, which has a significant impact on population distribution (Zhang D. et al., 2022). Therefore, the correlation coefficients of 0.30 (p < 0.01), 0.18 (p < 0.01), and 0.52 (p < 0.01) were found by analyzing the correlation between HEI and population density and construction land area, respectively, which were all highly significant and statistically significant. The results of cumulative percentage curves show that the distribution of population density and HEI in GS Province have similar spatial distribution characteristics, i.e., the higher the HEI, the higher the population density of the area, and the cumulative percentage curves of population and land area have similar trends but do not overlap, and they are all in the form of “S” (Figure 10). When the HEI is 0.5, the slope of the cumulative percentage of population curve is the largest, which indicates that the population distribution is the most intensive on the land with HEI of 0.5; the greater the HEI is, the smaller the slope is, which reflects the corresponding population density increase is less; the proportion of the population with HEI of less than 0.48 is less than 10%, while the proportion of the population with HEI of more than 0.48 is more than 90%, which indicates that the land with higher suitability for the habitat is more densely clustered. This indicates that the higher the habitat suitability, the more population is clustered on the land, which is the same as the results of existing studies (Wang et al., 2017; Zhang D. et al., 2022), which verifies the credibility of the habitat suitability evaluation model.
5 Discussion
5.1 The HSE in arid areas is affected by many factors and has significant boundary characteristics
As an important habitat space for humans, the quality of the HSE is the result of the joint interaction of multiple factors between humans and nature (Ossendorf et al., 2019; Luo et al., 2021; Timmermann et al., 2022). Humans and nature jointly affect the suitability of the HSE. A safe and stable natural environment is the foundation of the HSE, and a convenient and comfortable humanistic environment is the soul of the HSE (Wang et al., 2017). In terms of the suitability of the HSE in arid areas In terms of evaluation, CI and HI are the main influencing factors of regional human settlement quality, which is basically consistent with the conclusions of existing studies (Feng and Zhen, 2022). In addition, the HEI of the 14 cities in the study area shows significant administrative boundary differences, with 42.9% of cities having an average HEI greater than 0.5 (Figure 11). It is worth noting that Pingliang City has a relatively small administrative area but a complete overall infrastructure. Therefore, the accessibility of transportation networks and public service facilities within the same period of time is relatively high. Therefore, the average value of the suitability of the HSE is It is the largest among the 14 cities in GS Province. Therefore, in the future, in the process of improving the suitability of the HSE in arid areas and mountainous areas, the impact of surrounding cities should be taken into consideration, and targeted regional integrated improvements in the quality of the HSE should be carried out to achieve the common goal of transportation networks and public services. Build and share (Luo et al., 2021).
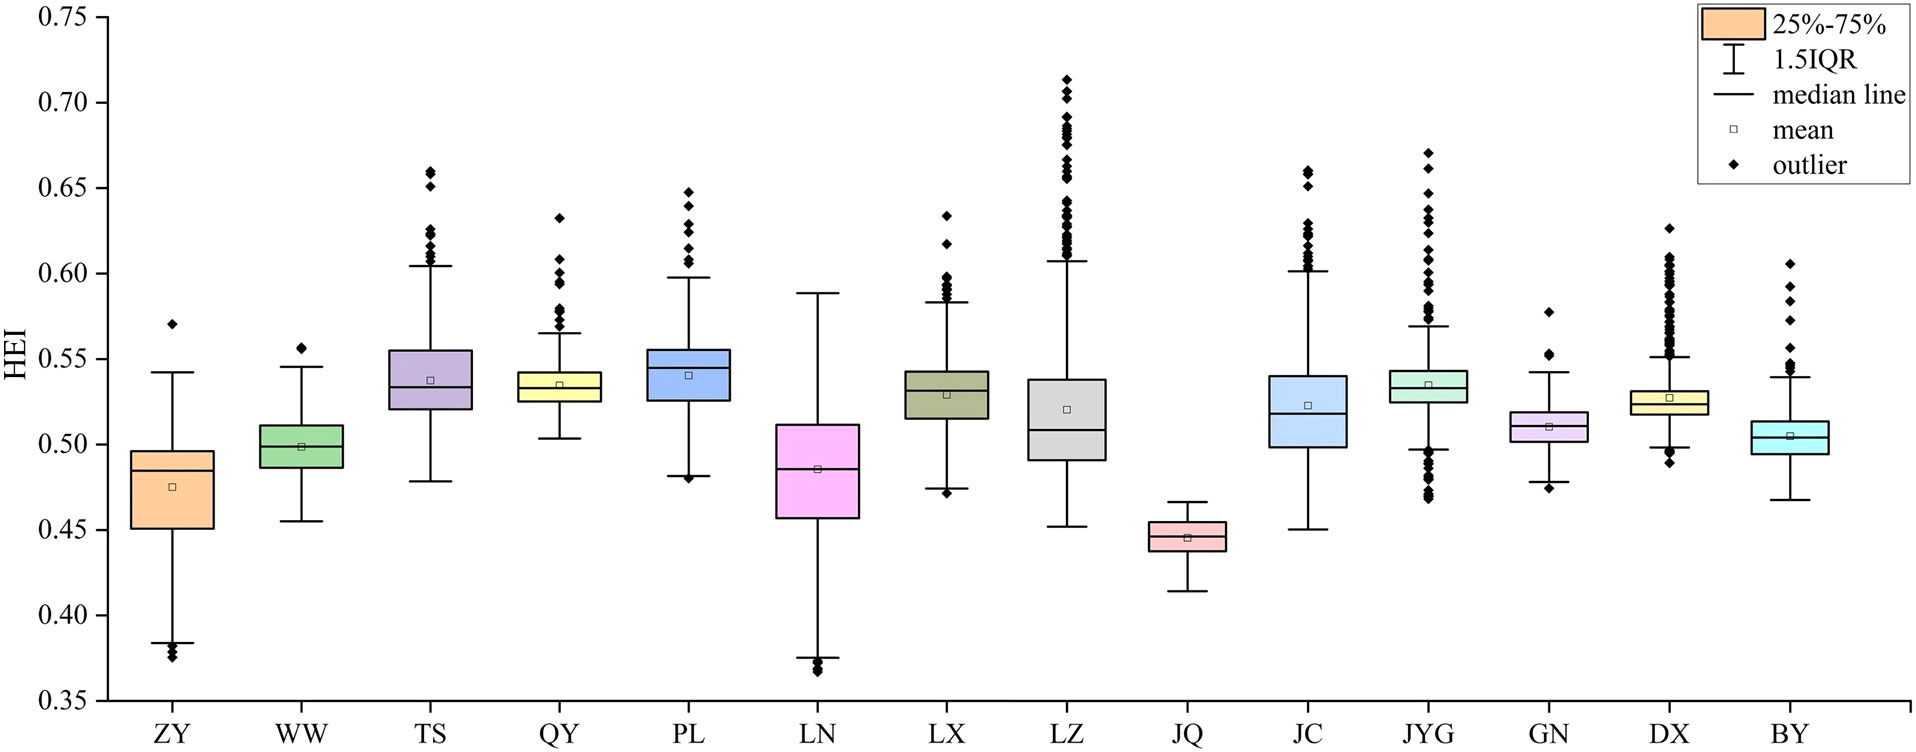
Figure 11 The comprehensive index of HSE in 14 cities. ZY, Zhangye; WW, Wuwei; TS, Tianshui; QY, Qingyang; PL, Pingliang; LN, Longnan; LX, Lingxia; LZ, Lanzhou; JQ, Jiuquan; JC, Jingchang; JYG, Jiayuguan; GN, Gannan; DX, Dingxi; BY, Baiying.
5.2 The combination of GIS and AHP can more truly reflect the suitability of human settlements in arid areas
In traditional research on the suitability of human settlements in arid areas, statistical yearbooks, expert scoring methods, and questionnaires are often used (Zhao et al., 2019; Wang et al., 2021; Xue et al., 2021), as well as a single GIS spatial analysis method (Zhang D. et al., 2022; Song and Li, 2023). Although these methods can calculate the suitability of regional HSE to a certain extent, they are divorced from the actual situation of the study area and have too much subjectivity in the selection of index weights, resulting in deviations between the reasons for index selection and the accuracy of the evaluation results. In addition, existing research often focuses on the impact of the natural environment on the HSE (Luo et al., 2021; Chen et al., 2022), while ignoring the decisive role of the cultural environment such as public services on the quality of life and happiness of regional residents (Wang et al., 2019), resulting in the final evaluation of the HSE being dominated by natural factors, making it impossible to obtain accurate scientific results. Therefore, this study is both innovative and improved compared with existing studies in terms of method model and indicator selection. This study uses the Analytical Hierarchy Process and ArcGIS software to take advantage of the objectivity of the Analytical Hierarchy Process in determining indicator weights and the advantages of GIS in large-scale spatial operations. Integrating the impact of the two dimensions of nature and culture on the HSE in arid areas, natural environment indicators such as RDLS, CI, HI, NDVI, AQI, and DRI were combined with cultural environment indicators such as TAI, EVI, PSI, NLI, LSI, and CHI. Combining qualitative and quantitative methods, comprehensively refer to relevant research results and relevant norms and standards, and combine it with field surveys to understand the actual characteristics of the study area. We use the natural breakpoint method to divide the suitability of the HSE into five evaluation levels, so as to obtain and grasp the spatial distribution rules of the suitability of the HSE in GS Province more truly and objectively. This can better provide methodological reference and model support for the suitability assessment of human settlements in similar arid areas.
6 Conclusion and prospect
Extreme climates and heat waves continue to threaten human livelihoods and the living environment. The separation of landforms and precipitation conditions in arid areas has led to dispersed settlements, tense relationships between man and land, and fragile ecological environments, making them more susceptible to extreme conditions. Therefore, this study takes the suitability of the HSE in arid areas as the research object, combines the natural environment with the cultural environment, and uses GIS and AHP to explore the spatial distribution of suitability of the HSE in GS Province. It is expected to provide scientific models and decision-making support to guide the population to concentrate in moderately suitable and highly suitable areas, thereby effectively realizing the sustainable development of man and nature. The main conclusions of the study are as follows: (1) The spatial distribution of the natural environment index for human settlement shows a significant increase in the central and eastern regions compared to the northwest, with significant local differences. The highest proportion of natural environments with relatively high suitability is 29.26% and the lowest proportion of natural environments with high suitability is 9.37%. The areas with unfavorable natural environments are mainly distributed in the nature reserves in the southwest and disaster-prone areas in the southeast. (2) The spatial distribution of the suitability of the cultural environment in the study area presents a circle structure that gradually decreases from the core city to the surrounding area. The highest proportion of the low suitable area of the cultural environment is 55.31%, and the lowest proportion of the high suitable area is 1.06%. The unsuitable areas for the cultural environment are mainly distributed in the northern Tengger Desert fringe area and the southern mountainous area. (3) The comprehensive suitability of human settlement in GS Province presents a spatial distribution characteristic, gradually decreasing from the central urban area to the surrounding areas. The area sizes of the five types of suitability are ranked as the following: LZ > MZ > CZ > HZ > UZ. 42.9% of cities have an average suitability index of human settlement greater than 0.5. The distribution of population density and the suitability index of human settlement have similar spatial distribution characteristics.
When constructing the evaluation index system for the suitability of the HSE in arid areas, this study has tried its best to fully consider the factors that affect the suitability of the HSE. It innovatively combines field survey results with remote sensing image data to more objectively and truly reflect the actual living environment status of the study area, and combines GIS and AHP to obtain evaluation results from a more scientific and objective perspective. However, due to reasons such as the unavailability of some data sources, the constructed indicator system still cannot cover all factors. The evaluation of each suitability index can basically analyze the suitability zoning of the HSE, but the comprehensive results lack the analysis of the internal contradictions and coordination of the suitability of the HSE. Therefore, in similar research in the future, we can try to use high-precision, long-series satellite remote sensing data combined with GIS and AHP to form more scientific and complete evaluation methods and models. Try to identify areas with suitable HSE and their population potential scale and spatial distribution location, and repeatedly revise the intrinsic influencing factors and driving mechanisms of the HSE in arid areas through multiple field surveys, so as to propose targeted strategies.
Data availability statement
The raw data supporting the conclusions of this article will be made available by the authors, without undue reservation.
Author contributions
MG: Conceptualization, Data curation, Formal Analysis, Methodology, Project administration, Resources, Software, Writing – original draft. BL: Conceptualization, Funding acquisition, Investigation, Project administration, Supervision, Writing – review & editing. WZ: Conceptualization, Data curation, Formal Analysis, Methodology, Project administration, Software, Visualization, Writing – review & editing.
Funding
The author(s) declare financial support was received for the research, authorship, and/or publication of this article. This research was funded by the National Natural Science Foundation of China (Grant No. 72303243/51208243), Scientific Research Project of the Department of Housing and Urban-Rural Development of Gansu Province (Grant No. JK2022-16), Chinese Medicine Culture Square in Gansu province of Central guiding local science and technology development special project (Grant No.ZZ2023S50900001), the Fundamental Research Funds for the Central Universities of Zhongnan University of Economics and Law (Grant No. 31513110407).
Acknowledgments
All authors of this study are grateful to the data support from The National Earth System Science Data Center, National Science & Technology Infrastructure of China (http://www.geodata.cn).
Conflict of interest
The authors declare that the research was conducted in the absence of any commercial or financial relationships that could be construed as a potential conflict of interest.
Publisher’s note
All claims expressed in this article are solely those of the authors and do not necessarily represent those of their affiliated organizations, or those of the publisher, the editors and the reviewers. Any product that may be evaluated in this article, or claim that may be made by its manufacturer, is not guaranteed or endorsed by the publisher.
References
Aghamohammadi N., Fong C. S., Idrus M. H. M., Ramakreshnan L., Sulaiman N. M. (2021). Environmental heat-related health symptoms among community in a tropical city. Sci. Total Environ. 782, 146611. doi: 10.1016/j.scitotenv.2021.146611
Chen W., Zhu K., Wu Q., Cai Y., Lu Y., Wei J. (2022). Adaptability evaluation of human settlements in Chengdu based on 3S technology. Environ. Sci. Pollut. Res. 29, 5988–5999. doi: 10.1007/s11356-021-15998-6
Chowdhury P., Mukhopadhyay B. P., Bera A. (2022). Hydrochemical assessment of groundwater suitability for irrigation in the north-eastern blocks of Purulia district, India using GIS and AHP techniques. Phys. Chem. Earth Parts A/B/C 126, 103108. doi: 10.1016/j.pce.2022.103108
Fang F., Ma L., Fan H., Che X., Chen M. (2020). The spatial differentiation of quality of rural life based on natural controlling factors: A case study of Gansu Province, China. J. Environ. Manage 264, 110439. doi: 10.1016/j.jenvman.2020.110439
Feng Z., Tang Y., Yang Y., Zhang D. (2008). Relief degree of land surface and its influence on population distribution in China. J. Geographical Sci. 18, 237–246. doi: 10.1007/s11442-008-0237-8
Feng Y., Zhen J. (2022). Comprehensive suitability evaluation and spatial optimization of human settlements environment in inner Mongolia. J. Geo-Information Sci. 24, 1204–1217. doi: 10.12082/dqxxkx.2022.210718
Foster G., Saleh R. (2021). The Circular City and Adaptive Reuse of Cultural Heritage Index: Measuring the investment opportunity in Europe. Resour. Conserv. Recycl. 175, 105880. doi: 10.1016/j.resconrec.2021.105880
Gong W., Juang C. H., Wasowski J. (2021). Geohazards and human settlements: Lessons learned from multiple relocation events in Badong, China – Engineering geologist’s perspective. Eng. Geol. 285, 106051. doi: 10.1016/j.enggeo.2021.106051
Guo Y., Chen P., Zhu Y., Zhang H. (2023). Study on comprehensive evaluation of human settlements quality in Qinghai Province, China. Ecol. Indic 154, 110520. doi: 10.1016/j.ecolind.2023.110520
Hao Q., Shan Q. Q., Deng L. (2020). Evaluation on natural suitability of human settlement in the context of territorial space planning. China Land Sci. 34, 86–93. doi: 10.11994/zgtdkx.20200512.101919
Hoffmann R. (2022). Contextualizing climate change impacts on human mobility in African drylands. Earths Future 10, e2021EF002591. doi: 10.1029/2020EF001958
Li G., Fang C., Qi W. (2021). Different effects of human settlements changes on landscape fragmentation in China: Evidence from grid cell. Ecol. Indic. 129, 107927. doi: 10.1016/j.ecolind.2021.107927
Li D., Huang W., Shen F., Cheng Y., Chen M. (2021). Evaluation of human suitability of human settlement environment in anhui province based on grid. J. Geo-Information Sci. 23, 1017–1027. doi: 10.12082/dqxxkx.2021.200346
Liu H., Li X. (2022). Understanding the driving factors for urban human settlement vitality at street level: A case study of Dalian, China. Land 11 (5), 646. doi: 10.3390/land11050646
Loritz R., Kleidon A., Jackisch C., Westhoff M., Ehret U., Gupta H., et al. (2019). A topographic index explaining hydrological similarity by accounting for the joint controls of runoff formation. Hydrol Earth Syst. Sci. 23, 3807–3821. doi: 10.5194/hess-23-3807-2019
Luo X., Yang J., Sun W., He B. (2021). Suitability of human settlements in mountainous areas from the perspective of ventilation: A case study of the main urban area of Chongqing. J. Clean Prod. 310, 127467. doi: 10.1016/j.jclepro.2021.127467
Ma L., Liu S., Tao T., Gong M., Bai J. (2022). Spatial reconstruction of rural settlements based on livability and population flow. Habitat Int. 126, 102614. doi: 10.1016/j.habitatint.2022.102614
Ossendorf G., Groos A. R., Bromm T., Tekelemariam M. G., Glaser B., Lesur J., et al. (2019). Middle Stone Age foragers resided in high elevations of the glaciated Bale Mountains, Ethiopia. Sci. (1979) 365, 583–587. doi: 10.1126/science.aaw8942
Song R., Li X. (2023). Urban human settlement vulnerability evolution and mechanisms: the case of Anhui province, China. Land 12. doi: 10.3390/land12050994
Song R., Li X., Hou X. (2023). Spatial network structure and driving factors of human settlements in three Northeastern provinces of China. Front. Ecol. Evol. 11, 1206808. doi: 10.3389/fevo.2023.1206808
Sowifska-fwierkosz B. (2016). Index of Landscape Disharmony (ILDH) as a new tool combining the aesthetic and ecological approach to landscape assessment. Ecol. Indic 70, 166–180. doi: 10.1016/j.ecolind.2016.05.038
Timmermann A., Yun K. S., Raia P., Ruan J., Mondanaro A., Zeller E., et al. (2022). Climate effects on archaic human habitats and species successions. Nature 604, 495–501. doi: 10.1038/s41586-022-04600-9
Ustaoglu E., Aydınoglu A. C. (2020). Suitability evaluation of urban construction land in Pendik district of Istanbul, Turkey. Land Use Policy 99, 104783. doi: 10.1016/j.landusepol.2020.104783
Valjarević A., Filipović D., Živković D., Ristić N., Božović J., Božović R. (2021). Spatial analysis of the possible first Serbian conurbation. Appl. Spat Anal. Policy 14, 113–134. doi: 10.1007/s12061-020-09348-1
Wang W., Gong H., Yao L., Yu L. (2021). Preference heterogeneity and payment willingness within rural households’ participation in rural human settlement improvement. J. Clean Prod. 312, 127529. doi: 10.1016/j.jclepro.2021.127529
Wang Y., Jin C., Lu M., Lu Y. (2017). Assessing the suitability of regional human settlements environment from a different preferences perspective: A case study of Zhejiang Province, China. Habitat Int. 70, 1–12. doi: 10.1016/j.habitatint.2017.09.010
Wang Y., Zhu Y., Yu M. (2019). Evaluation and determinants of satisfaction with rural livability in China’s less-developed eastern areas: A case study of Xianju County in Zhejiang Province. Ecol. Indic 104, 711–722. doi: 10.1016/j.ecolind.2019.05.054
Wei H., Gao Y., Han Q., Li L., Dong X., Liu M., et al. (2022). Quality evaluation and obstacle identification of human settlements in the qinghai–tibet plateau based on multi-source data. Land 11, 1479. doi: 10.3390/land11091479
Xue Q., Yang X., Wu F. (2021). A two-stage system analysis of real and pseudo urban human settlements in China. J. Clean Prod. 293, 126272. doi: 10.1016/j.jclepro.2021.126272
Yang S., Yang X., Gao X., Zhang J. (2022). Spatial and temporal distribution characteristics of carbon emissions and their drivers in shrinking cities in China: Empirical evidence based on the NPP/VIIRS nighttime lighting index. J. Environ. Manage 322, 116082. doi: 10.1016/j.jenvman.2022.116082
Yingying G., Xueming L., Jun Y. (2022). Comprehensive suitability evaluation of urban human settlements based on GWR: A case study of Liaoning Province. Scientia Geographica Sin. 2022, 2097–2108. doi: 10.13249/j.cnki.sgs.2022.12.006
Younes A., Kotb K. M., Abu Ghazala M. O., Elkadeem M. R. (2022). Spatial suitability analysis for site selection of refugee camps using hybrid GIS and fuzzy AHP approach: The case of Kenya. Int. J. Disaster Risk Reduct 77, 103062. doi: 10.1016/j.ijdrr.2022.103062
Zhang W., Zhou L., Zhang Y., Chen Z., Hu F. (2022). Impacts of ecological migration on land use and vegetation restoration in arid zones. Land 11 (6), 891. doi: 10.3390/land11060891
Zhang D., Zhou C., Zhou Y., Zikirya B. (2022). Spatiotemporal relationship characteristic of climate comfort of urban human settlement environment and population density in China. Front. Ecol. Evol. 10. doi: 10.3389/fevo.2022.953725
Zhao C., Gong J., Wang H., Wei S., Song Q., Zhou Y. (2020). Changes of temperature and precipitation extremes in a typical arid and semiarid zone: Observations and multi-model ensemble projections. Int. J. Climatol. 40, 5128–5153. doi: 10.1002/joc.6510
Keywords: human settlement environment, arid area, GIS, analytic hierarchy process, suitability
Citation: Geng M, Liu B and Zhang W (2023) Study on suitability and spatial distribution of human settlement environment in arid areas based on GIS and analytic hierarchy process. Front. Ecol. Evol. 11:1282749. doi: 10.3389/fevo.2023.1282749
Received: 24 August 2023; Accepted: 25 September 2023;
Published: 11 October 2023.
Edited by:
Fang Chen, Chinese Academy of Sciences (CAS), ChinaReviewed by:
Aleksandar Valjarević, University of Belgrade, SerbiaCorrado Zoppi, University of Cagliari, Italy
Copyright © 2023 Geng, Liu and Zhang. This is an open-access article distributed under the terms of the Creative Commons Attribution License (CC BY). The use, distribution or reproduction in other forums is permitted, provided the original author(s) and the copyright owner(s) are credited and that the original publication in this journal is cited, in accordance with accepted academic practice. No use, distribution or reproduction is permitted which does not comply with these terms.
*Correspondence: Benteng Liu, bGl1YnRAbHV0LmVkdS5jbg==
 Manguo Geng
 Benteng Liu2*
 Wei Zhang