 Miriam Edelkind-Vealey
 Michael D. Ulyshen
 S. Kristine Braman
- 1Department of Entomology, University of Georgia, Athens, GA, United States
- 2Southern Research Station, USDA Forest Service, Athens, GA, United States
Introduction: Urban forests provide necessary habitat for many forest-associated bee species amidst development and fragmentation. These forest fragments provide a variety of important floral and non-floral resources for bees that encompass a diversity of functional guilds characterized by size, diet breadth, nesting, sociality, origin, and seasonality. The relative importance of forest edge vs. interior habitats to these organisms is not well understood.
Methods: Here, we compare bee communities between forest edge and interior locations at eight locations in Athens, GA, USA. We also explore the effects of stand structure, tree composition, ground cover type, and the presence of snags and downed wood on these organisms.
Results: We found bee abundance and richness to be higher at the forest edge than interior with distinct community compositions at both locations. Canopy cover, invasive shrub cover, ground cover, and tree diversity influenced the observed community composition. We also determined that the most impactful functional traits influencing bee community structure in urban forest fragments were nesting substrate, origin (native or exotic to North America), sociality, and diet breadth.
Discussion: Our findings will help establish the effects of local forest characteristics on the community composition, diversity, and abundance of wild bees and further our knowledge of the conservation value of urban forests for preserving wild bee communities.
1 Introduction
Wild bee communities have complex responses to anthropogenic landscape alterations that convert natural habitat into development or agricultural matrices (Harrison and Winfree, 2015; Baldock, 2020; Wenzel et al., 2020). While some land use change can enhance habitat complementarity in ways that can be beneficial to flower-visiting insects, semi-natural habitats such as forests play a critical role in maintaining the full complement of species endemic to an area. Extensive land use changes filter the taxonomic and functional diversities of bees (Ayers and Rehan, 2021), and high levels of deforestation can result in forest-dependent bees being replaced by habitat generalists or species adapted to open habitats (Harrison et al., 2018). Remnant forest patches therefore provide critical refugia to specialized groups of endemic species, including kleptoparasitic and early-emerging bee species, that do not have the necessary habitat features (i.e. forage and nesting requirements) to persist in other land use types (Harrison et al., 2018; Smith et al., 2019).
As more and more forests are lost to development, remaining forest patches are becoming increasingly degraded. For example, urban forests are characterized by encroachment of invasive plant and insect species. Exotic plants such as Chinese privet (Ligustrum sinense, Lour.) decrease floral resource availability and pollinator abundance near the forest floor and prevent regeneration of overstory trees (Ulyshen et al., 2010). Meanwhile, introduced bees, e.g., Osmia taurus Smith, 1873 and Osmia cornifrons Panzer, 1806, pose threats to native pollinators through competition for pollen and nesting resources and disease transmission (Potter and Mach, 2022; LeCroy et al., 2023).
While simplification of overstory tree composition, as commonly seen in planted or disturbed forests, may also have negative implications for pollinators, native tree diversity is beneficial for forest associated bee species (Ulyshen et al., 2023). Traylor et al. (2022) detected a positive correlation between bee diversity and flowering tree diversity in southeastern U.S. forests, suggesting that bees require compositionally diverse canopies. Further, many native bee species are detected in greater abundances in canopies dominated by insect-pollinated broadleaf species rather than conifer dominated canopies (Traylor et al., 2024). Wind-pollinated tree species such as oaks (Quercus spp.) also provide wild bees with invaluable pollen resources, which may be more nutritious than some herbaceous plant pollens (Wood et al., 2021).
Additionally, forest fragmentation from urbanization can increase the amount of edge habitat between developed and forested areas. Haddad et al. (2015) found that 70% of global forests lie within 1 km of an edge. Increased edge diminishes the biodiversity in mature forest habitat. However, this edge habitat increases connectivity between open and forested habitat which may be beneficial for bee diversity and abundance (Griffin and Haddad, 2021). Previous work suggests forest edges may increase pollinator network robustness (Ren et al., 2023).
Functional diversity protects habitats from further pollination network dissolution by maintaining resilience (Burkle et al., 2013). Maintaining functional diversity, or functional redundancy, ensures that ecosystem services are preserved by species occupying the same functional role as biodiversity is lost. Functional traits describe the ecological niche an organism occupies. These characteristics describe morphological, physiological, and phenological traits that elucidate an organism’s life history and infer its role in the environment (Violle et al., 2007). Wild bees occupy a diverse array of functional guilds encompassing nesting, sociality, diet breadth, size, and seasonality (Fortuin and Gandhi, 2021; Braman et al., 2023).
Estimates from northeastern US suggest that roughly 32% of bee species are forest associated, and an additional 31% of bees are habitat generalists which may use forests in some capacity (Smith et al., 2021). While we do not have estimates of forest-associated species within the southeastern US, recent studies within the same geographical area (Athens-Clarke, Co., Georgia, USA) suggest that forest cover impacts bee diversity at small and large spatial scales (Janvier et al., 2022; Traylor et al., 2022; Braman et al., 2023). We were interested in further determining species and functional diversity at the urban-forest interface. We first determined what bee species and functional groups are present in urban forest fragments. We then assessed local forest structural metrics including tree community, invasive shrub cover, ground cover type, etc. for their effects on wild bee community composition, diversity, and abundance at forest edge and interior. We anticipated local factors to have functional-group specific trends on the bee communities distinct to forest edge and interior.
2 Material and methods
2.1 Study sites
This study took place in the Southeastern United States, a region that was extensively forested prior to colonization by Western European countries. Forest cover was greatly reduced for cotton production in the 1800s before expanding in area following the abandonment of the cotton industry. Currently, forest cover is declining again due to urbanization and development (Miller, 2012). All sites were located in Clarke County, Georgia, within or nearby the city of Athens. Athens is the 5th largest city in the state with a population of over 127,000 people that is expanding at a rate of 0.5% per year. (World Population Review, https://worldpopulationreview.com/us-cities/athens-ga-population). Within the county, eight forested sites were chosen that were at least 1 km from each other to minimize autocorrelation (Osborne et al., 2008; Greenleaf et al., 2007). Forests were hardwood-dominated at all eight locations with common genera including Quercus, Carya, Acer, Fraxinus, Liquidambar, and Populus. There was also a minor pine component at all sites. All eight locations were situated near rivers or streams. Six sites were part of recreational parks or gardens, one site bordered a residential community while the eighth site bordered an organic farm. Sites (Figure 1; Supplementary Table 1) were chosen as typical representatives of mature, regenerated forest remnants typical of the southeastern U.S. piedmont.
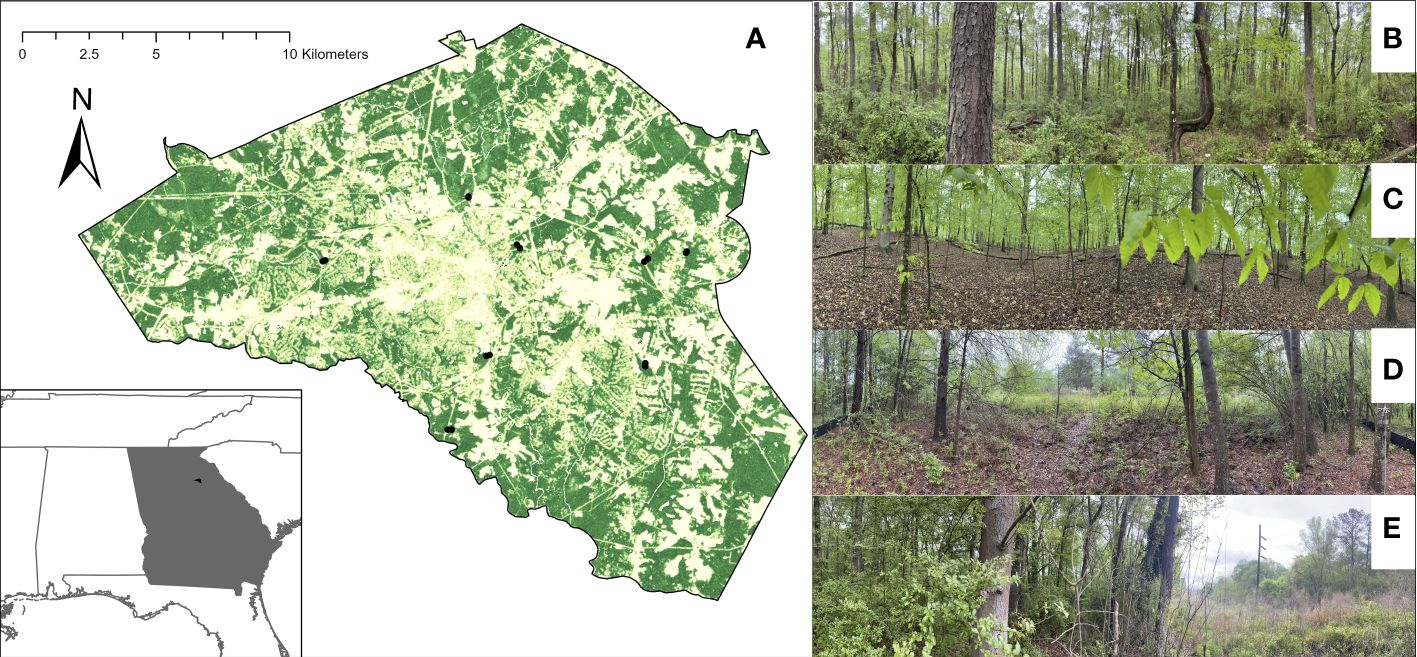
Figure 1 Sample sites and locations. (A) Forest cover and sampling sites indicated by black dots within Athens-Clarke, Co. USA. Examples of interior locations are shown in (B) and (C). Examples of edge locations are shown in (D) and (E).
All sites consisted of a forest and edge location. Edge traps were placed within 1m of literal edge line demarcation between forested and open adjacent land cover. Since selected sites were small forest patches, each interior location was chosen at least 100 m from the edge to ensure interior locations were distinct from any edge.
2.2 Passive sampling
Two methods of passive sampling were employed to collect the pollinator community at each forest interior and edge: colored pan traps and blue vane traps. A colored pan trap set consists of blue, white, and yellow colored bowls containing soapy water (Dawn™ dish soap). Each bowl was placed on a wire stand which held the pan traps approximately 30 cm off the ground. The bowls were oriented in a 3 m transect with a bowl at each meter mark. The bowls were placed in a random color order for 48 hours and collected weekly.
Along with the pan traps, we placed blue vane traps at the exact forest edge and 100 m to interior. Blue vane traps are a type of passive trap that consists of a yellow-painted collection container fitted with a fluorescent blue plastic funnel and vane. The collection container is filled with a preservative to prevent specimen decay. In 2022, we used a saltwater solution (Morton®) for the traps; however, we switched to propylene glycol for 2023. Blue vane traps ran continuously with their contents collected weekly. All traps were deployed in late February of 2022 and 2023. Sampling concluded in mid-August both years.
2.3 Bee processing and identification
All samples were stored in 75% ethanol until they could be processed. Bees were separated from the rest of the by-catch, placed in organza bags, and dried in a compact clothes dryer. Once dry, bees were pinned for identification.
Bees were identified to species using a variety of available resources (Discover Life keys; Mitchell, 1960, 1962; Gibbs, 2011; Gibbs et al., 2013). Honeybees (Apis melifera) were retained community as they are interacting and potentially competing with wild bees for floral resources despite not necessarily being a part of the wild bee.
Bees were designated to functional guilds. In the present study, we consider the following functional traits of wild bees per (Danforth et al., 2019; Fortuin and Gandhi, 2021; Braman et al., 2023; Brasil et al., 2023).
1. Nesting: Nesting substrate is separated into cavity, litter, softwood, soil, and occupied. Cavity nests are built in pithy stems and dead wood. Litter nests are built in leaf litter, grass, the organic layer above soil, or vacated rodent dens. Softwood nests are built in wood that has been heavily decayed but still holds shape. Occupied nests are not built, but rather, the maternal bee lays her egg in another bee species’ nest (kleptoparasitism).
2. Sociality: Wild bee sociality is classified as solitary, communal, eusocial, and kleptoparasitic.
3. Size: Size is divided into 3 groups based on intertegular width (mm): small (<2mm), medium (2.1–3mm), and large (>3mm).
4. Seasonality: Peak flight season can be separated into early (February-April), mid (May-July), and late-season (August-November).
5. Diet breadth: Bees may either be oligolectic (specializing on a single plant species or family) or polylectic (generalists).
6. Origin: Native or exotic to North America (Russo et al., 2021).
2.4 Habitat assessment
Environmental parameters measured are summarized in Table 1. At each location, we established a 0.1 ha circular plot centered around the passive traps (Supplementary Figure 1). Every tree within the plot was identified to species and diameter at breast height (DBH) was measured. Only mature trees with a DBH above 20 cm were considered. Trees were recorded as “insect pollinated” if known to have nectar producing flowers for insect pollinators (as per Traylor et al., 2022). While wind-pollinated trees are visited by bees for pollen, these trees do not require bees for pollination and reproduction (MacIvor et al., 2014; Ollerton, 2021). Tree community included species in the genera Pinus, Quercus, Nyssa*, Liriodendron*, Prunus*, Liquidambar, Celtis*, Acer*, Ulmus*, Carya, and Pyrus* (*denotes insect-pollinated). Median diameter and total basal area were calculated for both total and insect tree community. Canopy cover was measured at each trap using a densiometer and averaged at each location.
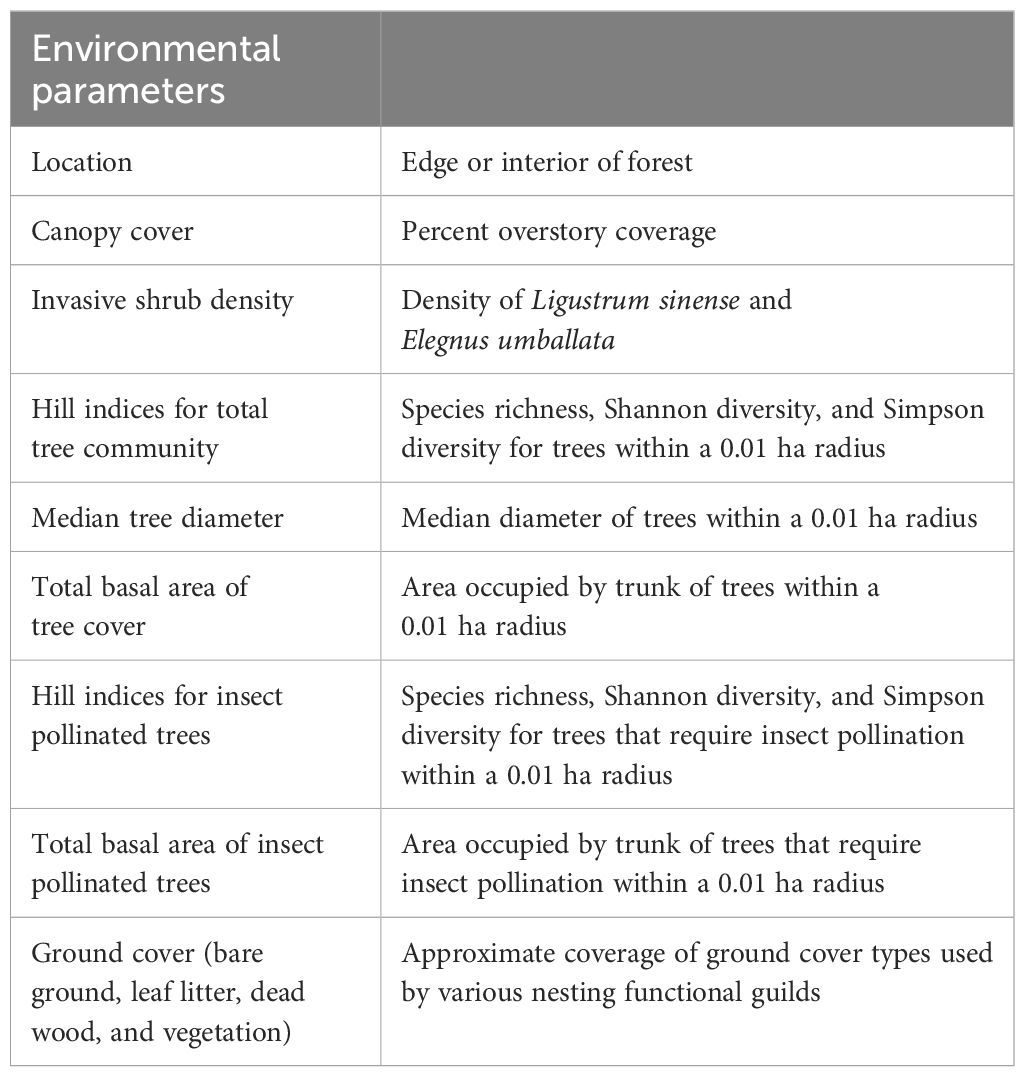
Table 1 Summary of measured environmental parameters.
Ground cover, downed wood, and invasive shrub cover was assessed along two intersecting 40-m transects centered around the passive traps. At every 10 m, we placed a quadrat and determined dominant ground cover type (leaf litter, wood, bare ground, or vegetation) at the four corners of the quadrat. Leaf litter depth was also measured at every quadrat corner with leaf litter present.
Along the entire length of the transect, we quantified invasive shrub cover and downed wood. For invasive shrub cover, we counted every stem of privet (Ligustrum sinsense) and autumn olive (Elaeagnus umbellata) above one meter on either side of the transect. We focused on these two species which dominated understory shrub community within our study sites.
Downed wood was quantified by measuring every piece of wood 5 cm in width or greater that intersected the transect. For each piece of wood, we measured total length and diameter of wood, Volume was calculated using the formula for a tapering cylinder. We also determined decay class for each piece of downed wood using the USDA Forest Inventory (United States Department of Agriculture, Forest Service, 2016). Each occurrence of downed wood was ranked on scale of 1 to 5, where 1 indicated the wood was recently downed and 5 indicated nearly decayed.
2.5 Statistical analysis
Statistical analyses were performed in R (R Core Team, 2022). Since sampling occurred with the same timeframe, sites, and passive sampling scheme, we combined 2022 and 2023 data for all analysis.
Tree and bee diversity for each site and location was calculated using Hill numbers as diversity indices (Chao et al., 2014) using the ‘hill_taxa’ function from the hillR package (Li, 2018). For trees, these calculations were made for all trees as well as for insect pollinated trees. Hill numbers serve as proxies for species richness (q=0), Shannon diversity (q=1), and Simpson diversity (q=2) (Roswell et al., 2021). Hill numbers were calculated for each location at each site using the. Estimated species richness was calculated using the Chao1 estimator using the ‘chao1’ function of the rareNMtests package (Cayuela and Gotelli, 2022).
Generalized linear mixed effect models (GLMMs) were constructed to test the effects of location and environmental parameters on each of the three Hill numbers (species richness, Shannon diversity, and Simpson diversity), abundance, and Chao1 estimator. The continuous environmental variables were first checked for independence from the categorical location variable. Secondly, they were assessed for multicollinearity using the ‘VIF’ function from the package car (Fox and Weisberg, 2019). We accepted variables with the VIF threshold less than 5 as a conservative measure. This left tree Shannon diversity, invasive shrub cover, and percent bare ground as our environmental variables. GLMMs were constructed with the ‘glmer’ function from the lme4 package (Bates et al., 2015). Each GLMM was created with the fixed effects as location, tree Shannon diversity, invasive shrub cover, and percent bare ground, the response variable as one of the Hill numbers, abundance or Chao1 estimator, and site as a random effect. Species richness and abundance were fit to a Poisson distribution, while Shannon diversity, Simpson diversity, and Chao1 estimator were fit to a Gaussian distribution. Post hoc tests were performed with the package emmeans (Lenth, 2023).
To describe bee community composition at forest edge and interior, we conducted non-metric multidimensional scaling (NMDS) using Bray-Curtis dissimilarities of locations with the metaMDS() function from the vegan package. The data was transformed using a Hellinger transformation to reduce the weight of rare and hyperabundant species. This transformation is appropriate for skewed ecological data (Legendre and Gallagher, 2001). A multiple regression using the envfit () function determines correlation of environmental parameters with NMDS axes (Oksanen et al., 2022). Significance of environmental parameters was assessed with 9999 permutations. Permutational analyses of variance (PERMANOVAs) compared Bray-Curtis dissimilarities between sample sites to determine if bee communities differed by forest location (edge vs. interior). PERMANOVAs were performed with the adonis2() function of the vegan package using 10000 permutations. We then performed indicator species analysis using the ‘multipatt’ function of the indicspecies package to determine which species were associated with edge or interior locations (De Cáceres and Legendre, 2009).
To determine how functional groups interplay with community composition and environmental variables a double canonical correspondence analysis (dCCA) was performed following Götzenberger et al. (2021). The dCCA first constrains species data by environmental parameters in a canonical correspondence analysis (CCA) determines how species respond to gradients of environmental variables. This CCA is secondarily constrained by functional traits to show how species respond to their environment based on their traits. First, we constructed a “trait free” CCA using the ‘dudi.coa’ function from the ade4 package to assess which environmental variables had the greatest impact on species community (Dray and Dufour, 2007). A permutation-based ANOVA determined which environmental factors were significant. For the dCCA, we secondarily constrained the species CCA from above with the functional traits (origin, diet breadth, nesting, seasonality, and sociality) using the ‘dbrda’ function written by Kleyer et al. (2012). This produces an ordination where environmental and functional traits are vectors scaled by effect size. A cluster analysis identified optimal species clusters based on functional designations and environmental parameters using the ‘hclust’ function of the stats package (Murtagh and Legendre, 2014; R Core Team, 2022).
While the CCA and dCCA tell us which environmental variables influence bee diversity, it does not give the direction of the effect. To extrapolate the direction of the effect of environmental parameters on functional trats, the meaningful environmental parameters for significant functional traits were used to generate linear models using the geom_smooth function (method = “lm”).
3 Results
During 2022 and 2023, we collected 3,770 individual bees. These bees belong to 122 described species of 28 genera within five families: Andrenidae, Apidae, Colletidae, Halictidae, and Megachilidae. Forty-one species were unique to forest edge, 13 species were unique to forest interior and 70 species were found at both locations. The 122 species were placed into functional guilds for nesting, origin, sociality, diet breadth (lecty), sociality and size (Figure 2; Supplementary Table 2). Nesting functional groups describe 30 species as cavity nesting, 6 species as litter nesting, 66 species as soil nesting, and 22 as occupied nesting. Origin describes 4 species as exotic and 122 as native. Sociality describes 21 species as eusocial or primitively eusocial, 71 species as solitary, and 22 species as parasitic. Diet breadth describes 10 species as specialists and 114 as specialists. Size functional groups were divided into 55 species as small, 43 species are medium, and 22 species as large. Seasonality functional groups encompass 67 early-season species, 55 mid-season species, and 4 late-season species.
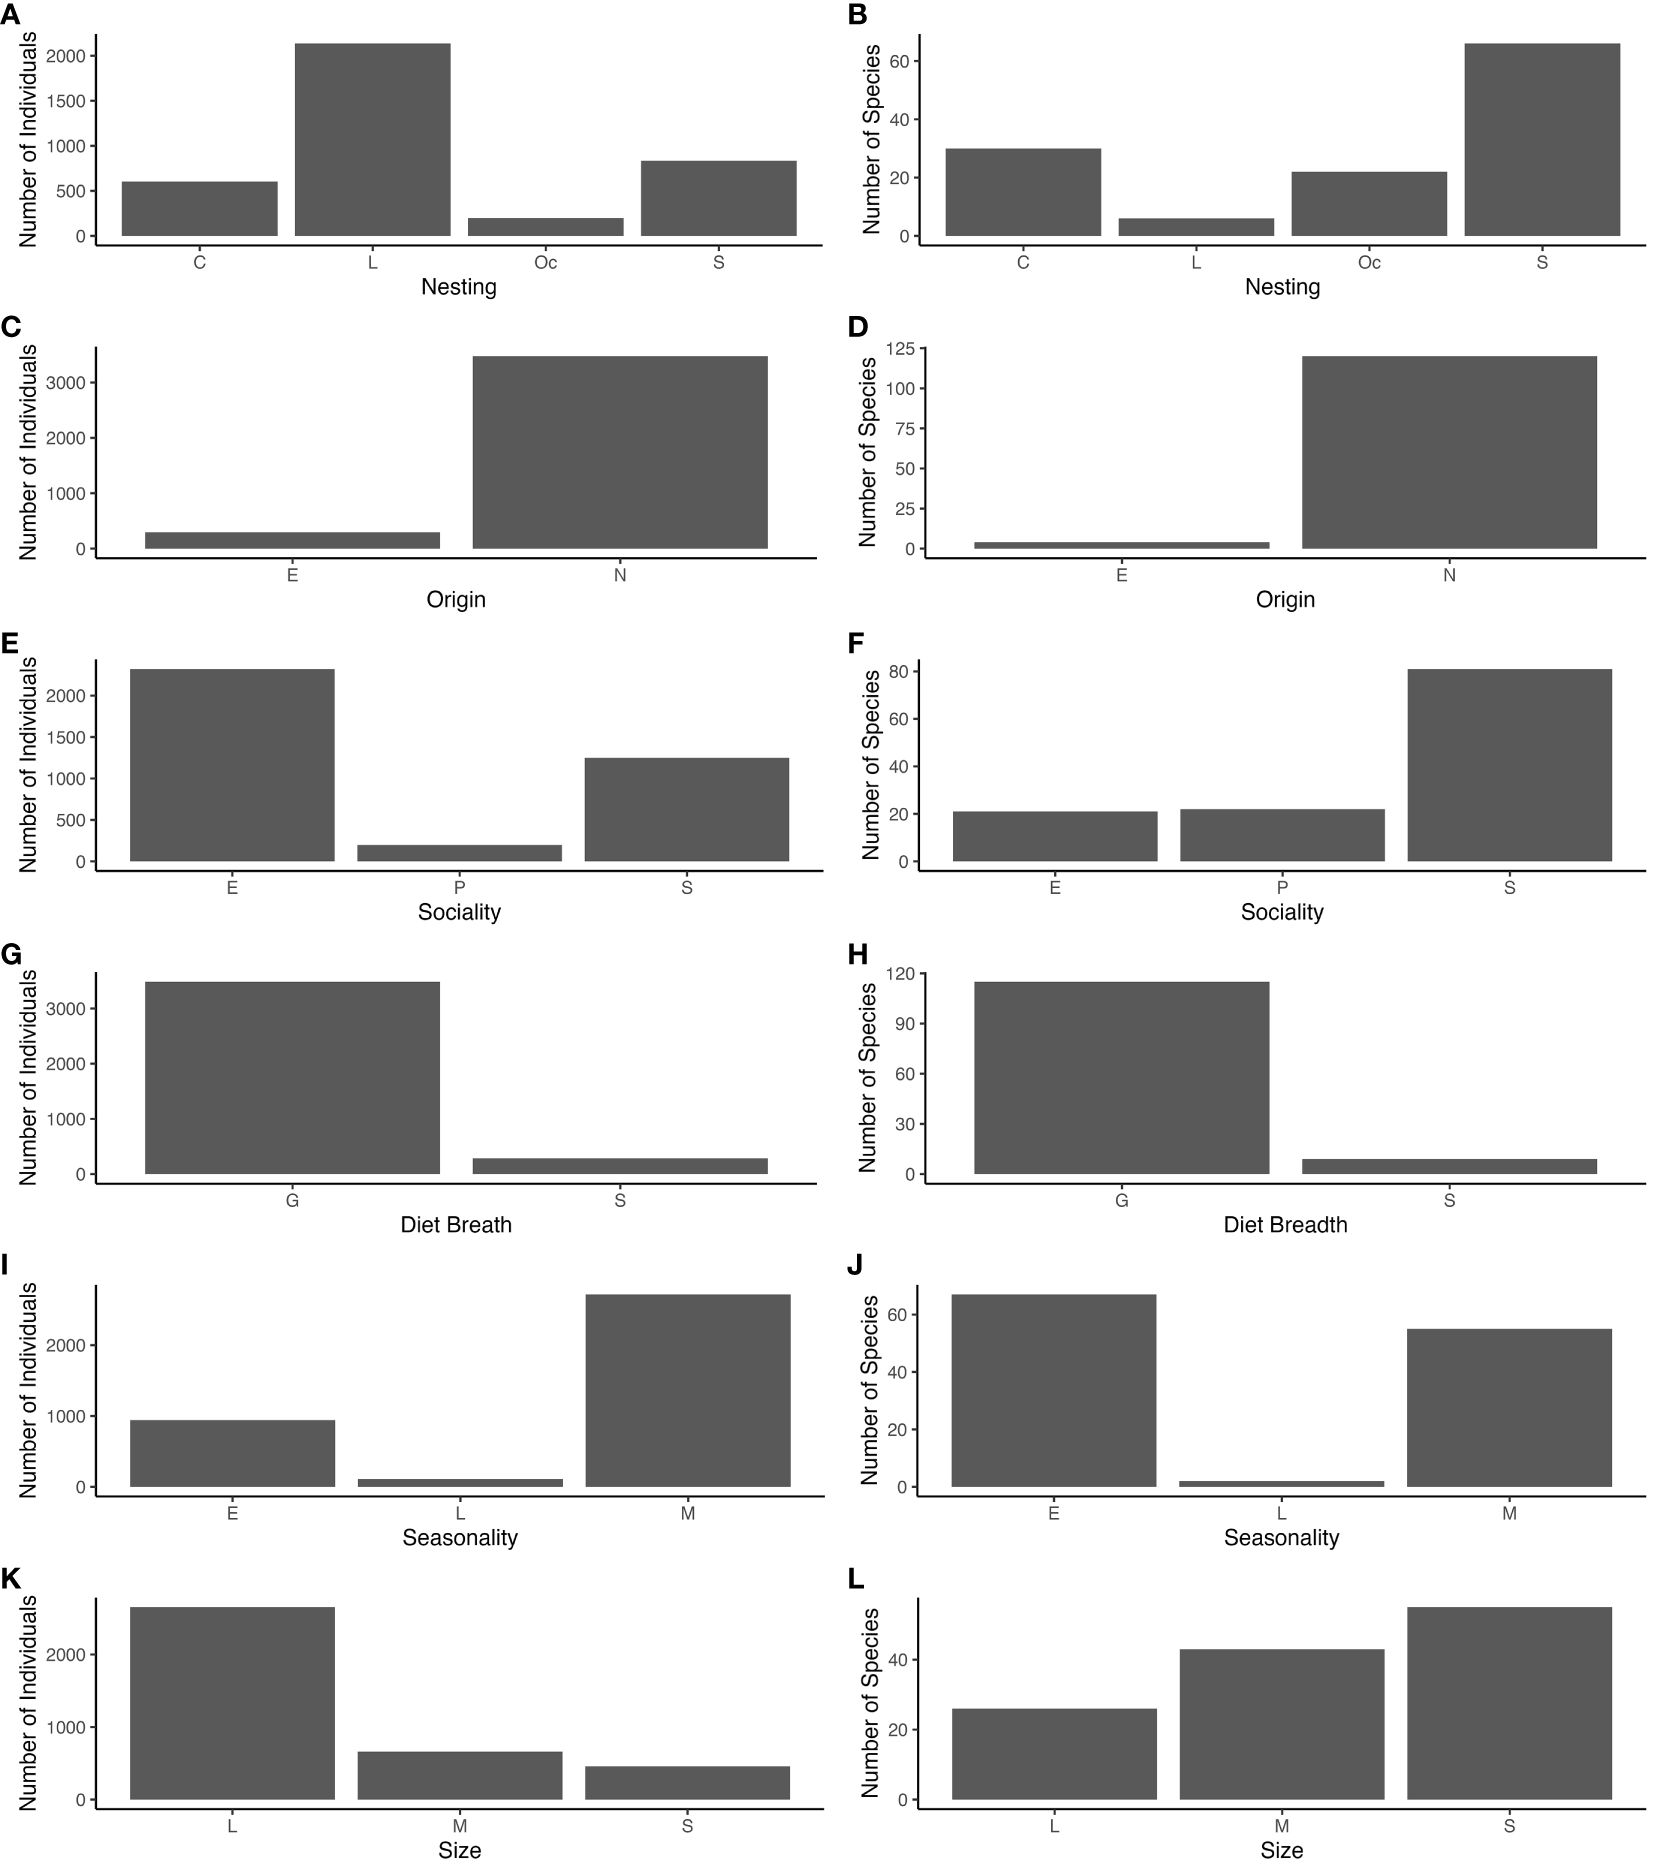
Figure 2 Total numbers of individuals (A, C, E, G, I, and K) and species richness (B, D, F, H, J and L) collected in the following functional groups: nesting (C=cavity, L=litter, O=occupied, S=soil); origin (E= exotic, N=native); sociality (E=eusocial, P=kleptoparasitic, S=solitary); diet breadth(G=generalist, S=specialist); seasonality (E=early, L=late, M=middle); size (S=small, M=medium, L=large).
3.1 Bee abundance and diversity
Bee abundance and diversity responded to location (edge vs. interior) and environmental variables differentially (Table 2). Location had a negative effect on abundance, a marginally negative effect on species richness, but a positive effect on Shannon diversity and Simpson diversity. Tree Shannon diversity had a negative effect on abundance but positive effect on the Chao 1 estimator. Invasive shrub cover had a marginally positive effect on abundance, but a marginally negative effect on Shannon diversity. Bare ground was positively associated with species richness and Chao1 estimator, but a marginally negative effect on Simpson diversity.
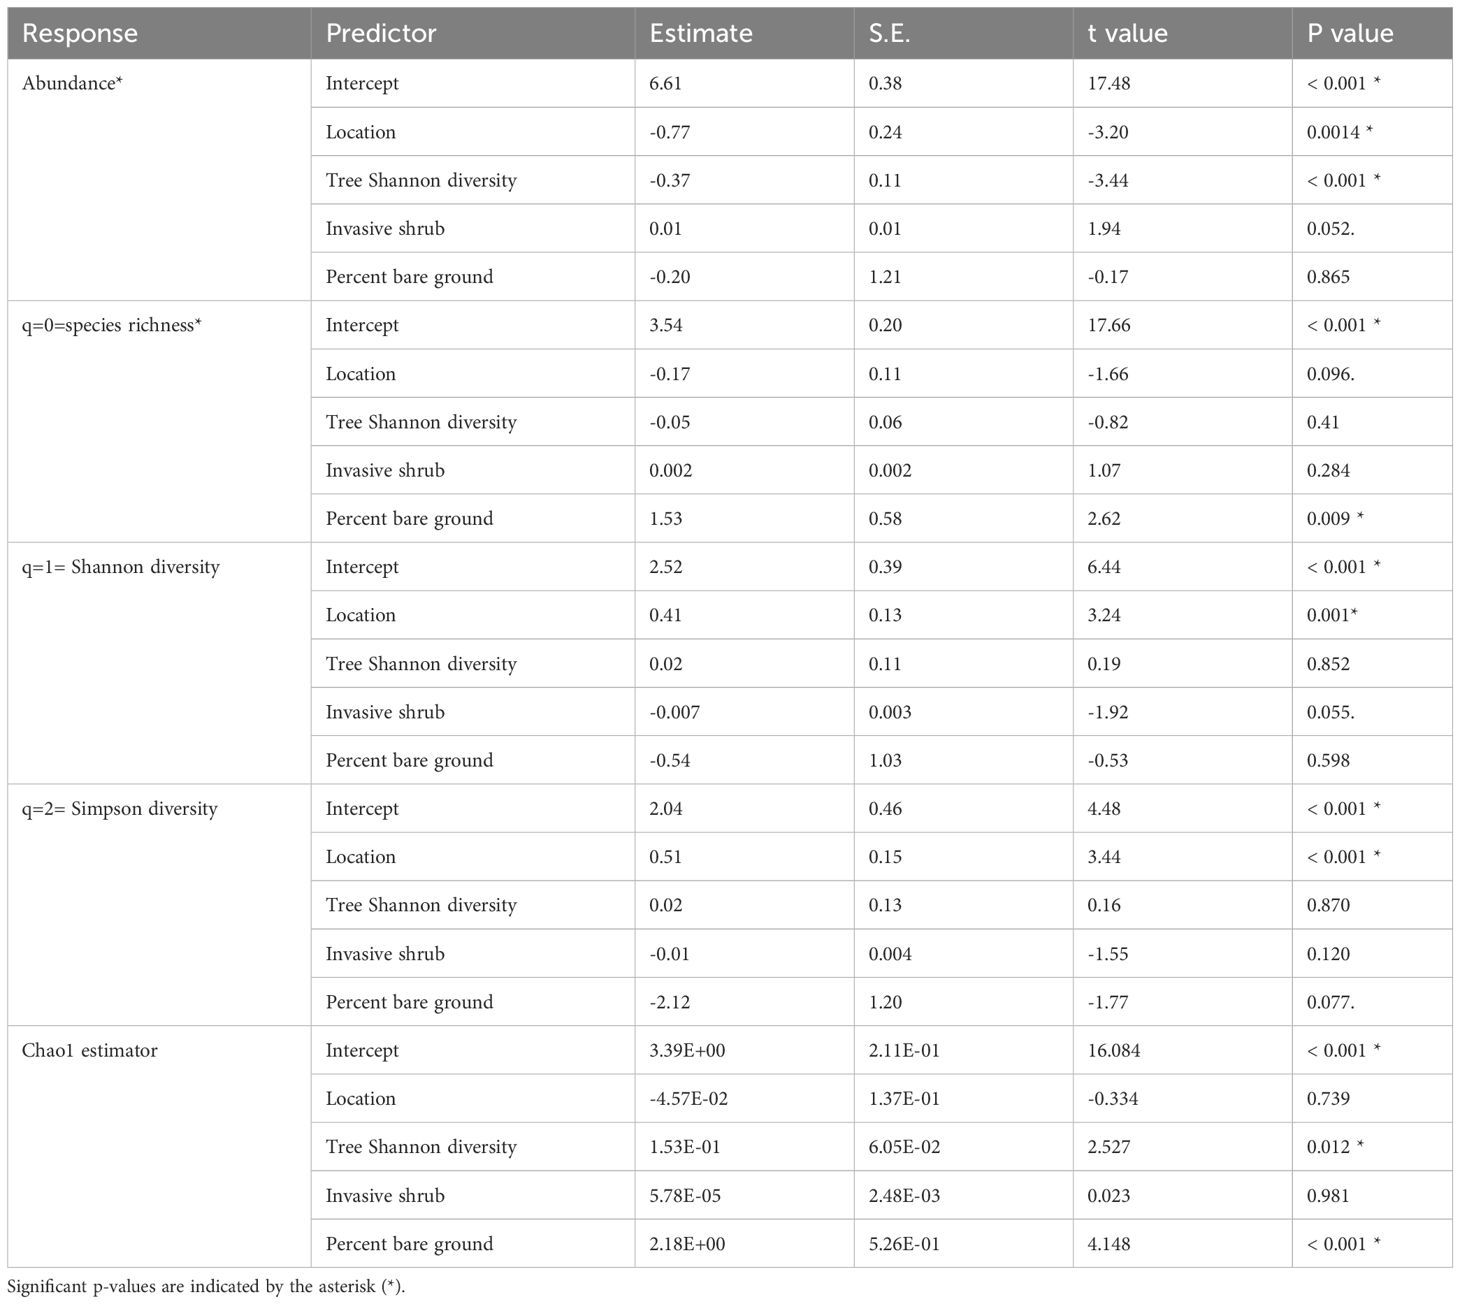
Table 2 Generalized linear mixed effect model coefficient, t value (or z value for abundance and species richness) for each predictor (location, tree Shannon diversity, invasive shrub, and percent bare ground) of bee diversity and abundance.
3.2 Bee community composition
NMDS ordination visually identified distinct community composition at forest edge and interior (Figure 3). The multiple regression of environmental variables with NMDS axes revealed significant interactions with the following variables and NMDS axes: location (r2 = 0.4153, p=0.041), tree Simpson diversity (r2 = 0.4058, p= 0.033), insect pollinated tree species richness (r2 = 0.4058, p=0.033), canopy cover(r2 = 0.4813, p=0.009), and percent bare ground (r2 = 0.5408, p=0.007); see Supplementary Table 3. PERMANOVA confirmed distinct communities at both forested locations (F= 2.0549, p= 0.0107). Indicator species analysis revealed three species associated with edge habitat: Hoplitis truncata (Cresson, 1878) (F=0.866, p= 0.007), Ptilothrix bombiformis (Cresson, 1878) (F=0.858, p= 0.010), and Bombus pensylvanicus (DeGreer, 1773) (F=0.828, p= 0.019). No indicator species were solely associated with forest interior.
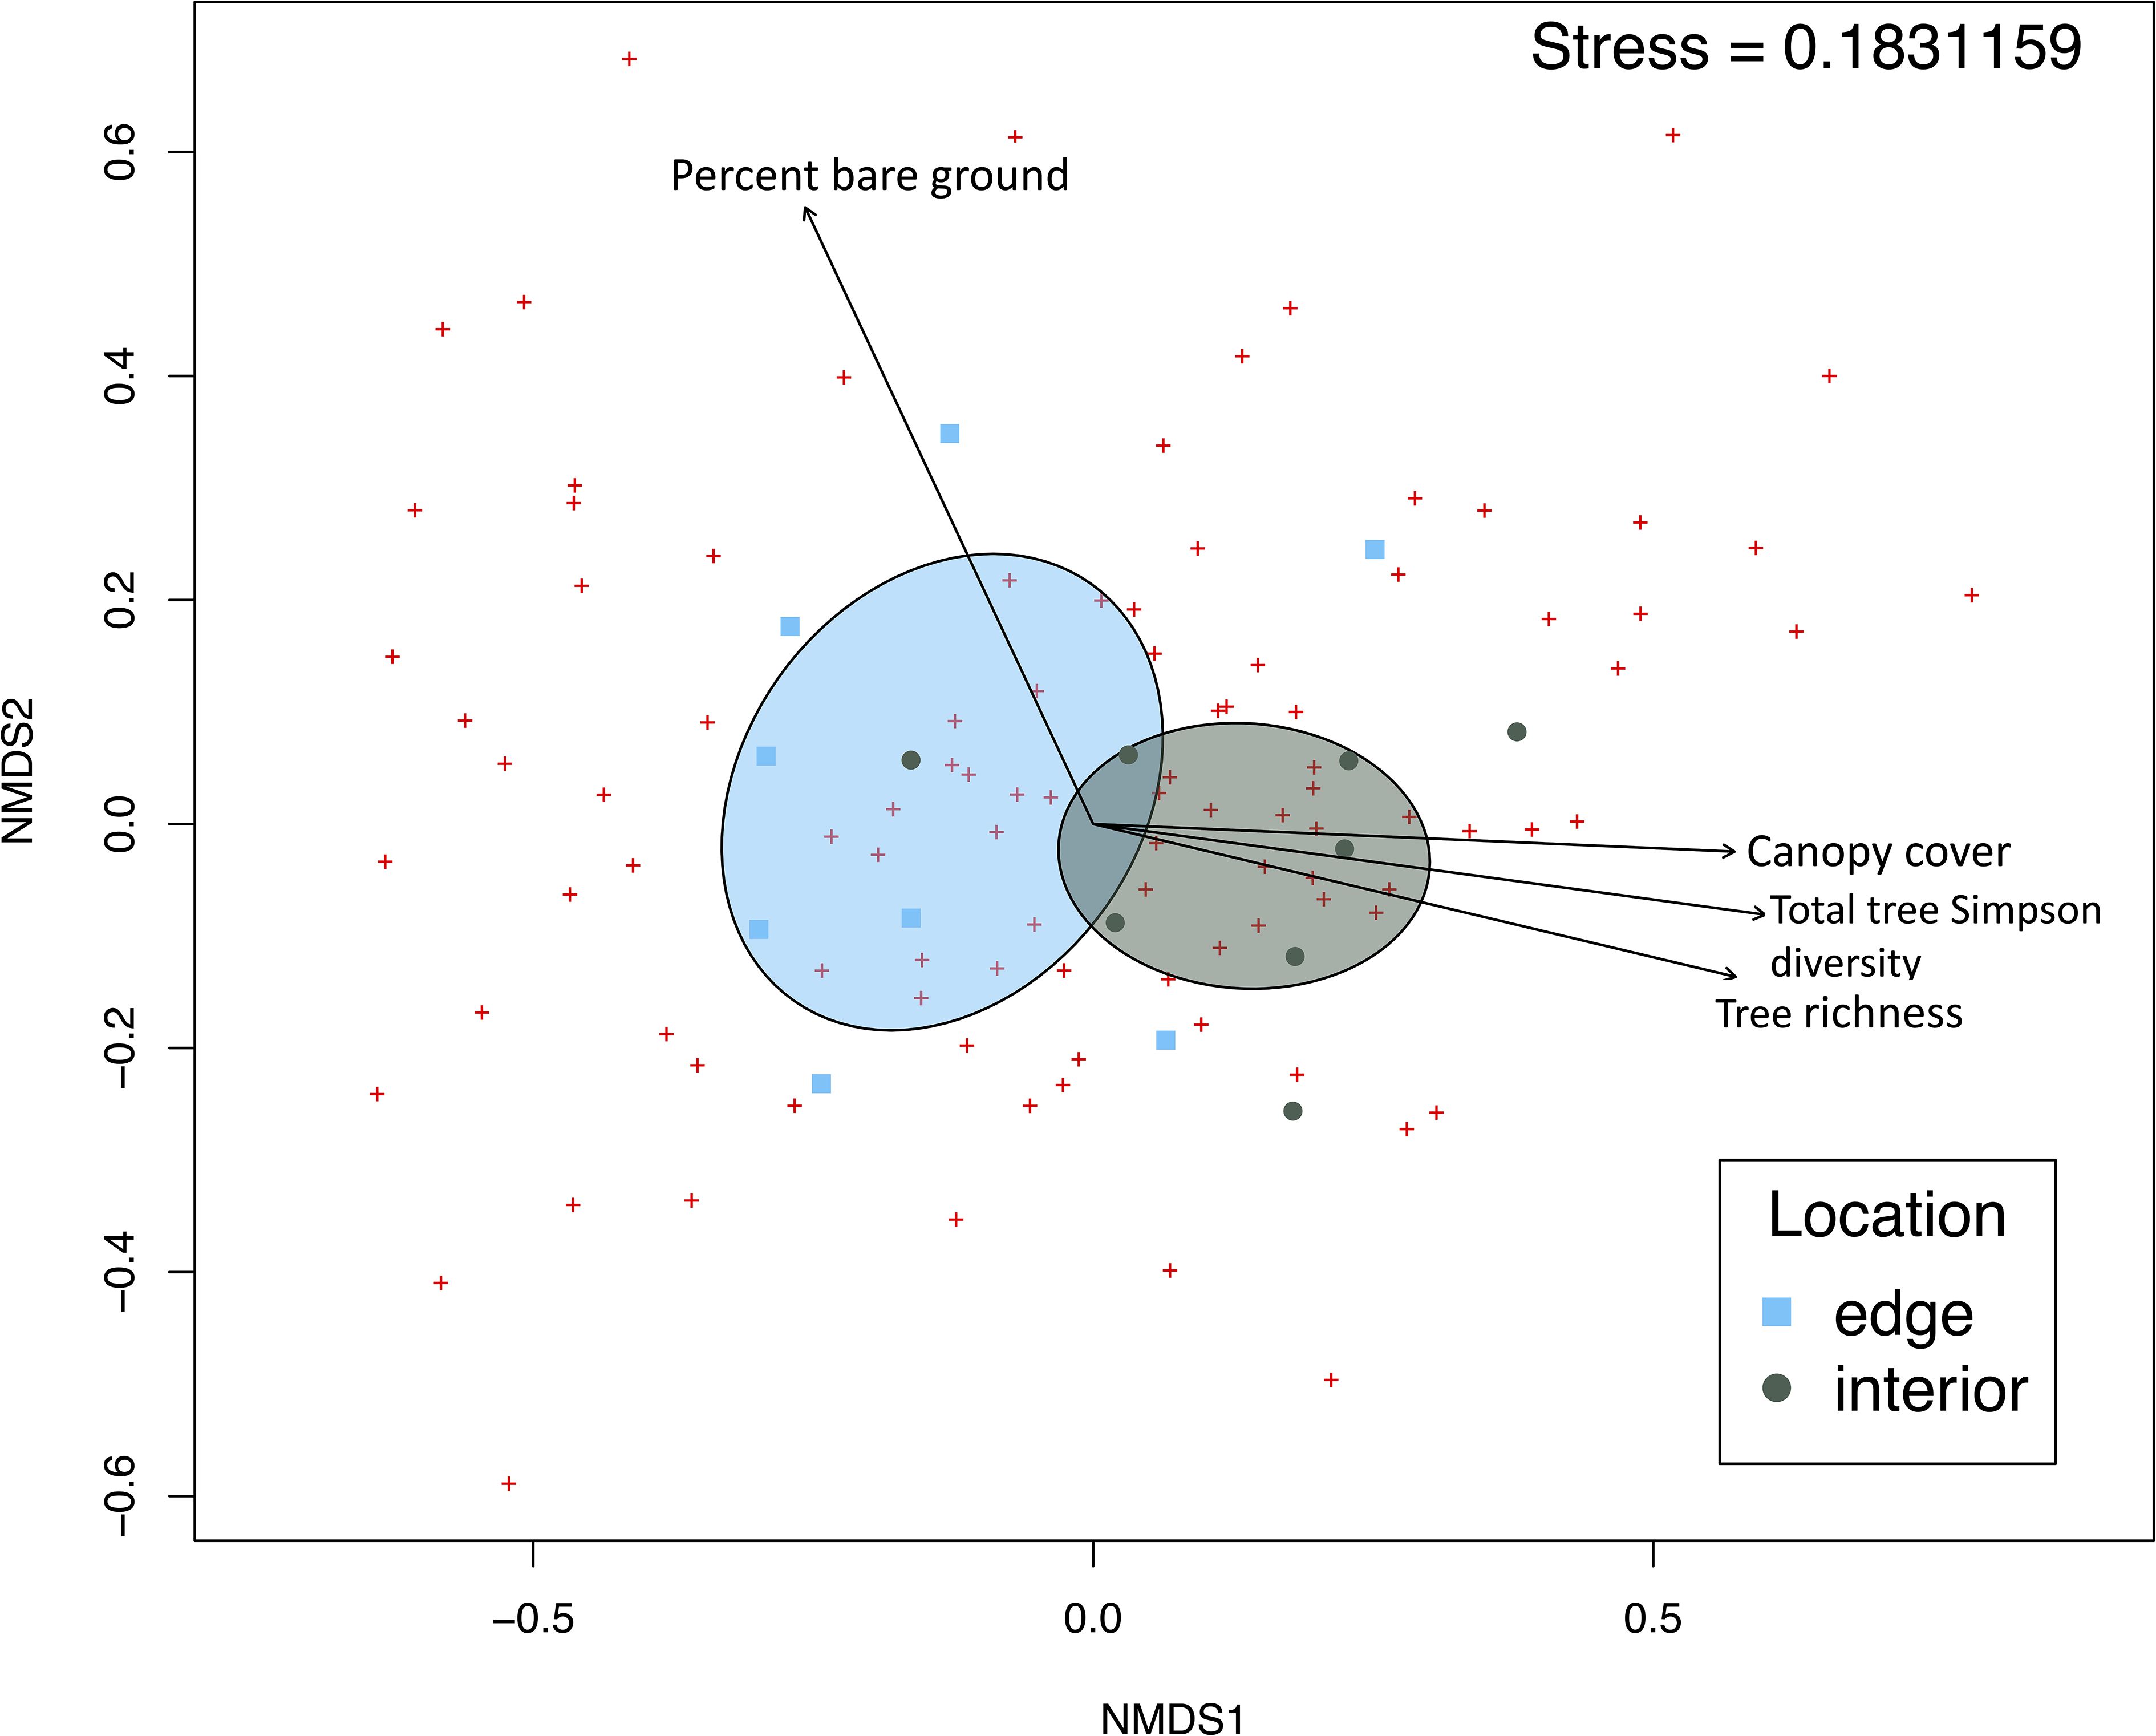
Figure 3 Non-metric multidimensional scaling ordination of bee community composition at forest locations. Points representing bee community at each location are plotted based on Bray-Curtis distances. Ellipses show standard deviation from centroid for each location cluster. Vectors show significant environmental parameters with p<0.01from the envfit() multiple regression.
Canonical correspondence analysis of community composition grouped species by environmental preferences (Supplementary Figure 2). Environmental parameters explained 32.7% of the species diversity (adj R2 = 0.326586). The greatest predictor of community composition was canopy cover (F= 2.416, p=0.001, df=1). Invasive shrub cover (F= 2.085, p= 0.002, df=1), tree Simpson diversity (F= 2.056, p= 0.003, df=1), location (F= 1.952, p= 0.004, df=1), insect associated tree Shannon diversity (F= 1.674, p= 0.011, df=1), and percent bare ground (F= 1.737, p= 0.017, df=1) also had significant effects on bee community composition.
3.3 Functional diversity
The cluster analysis revealed that the bee community separated into 32 groups when species diversity, functional diversity, and environmental parameters were considered (Supplementary Figure 3). Linear regressions suggest origin, nesting, diet breadth, and sociality all had significant effects on clusters. Origin (p<0.01,F= -0.004117), nesting (p<0.001, F= -0.04928), and sociality (p<0.01, F=-0.023436) had negative effects on clusters in the ordination space. Diet breadth (p<0.01, f=0.006824) had a positive effect within the ordination. Seasonality and size showed no significant effect. The dCCA shows species grouped into the 32 clusters overlayed with vectorized effects of functional traits and environmental parameters (Figure 4).
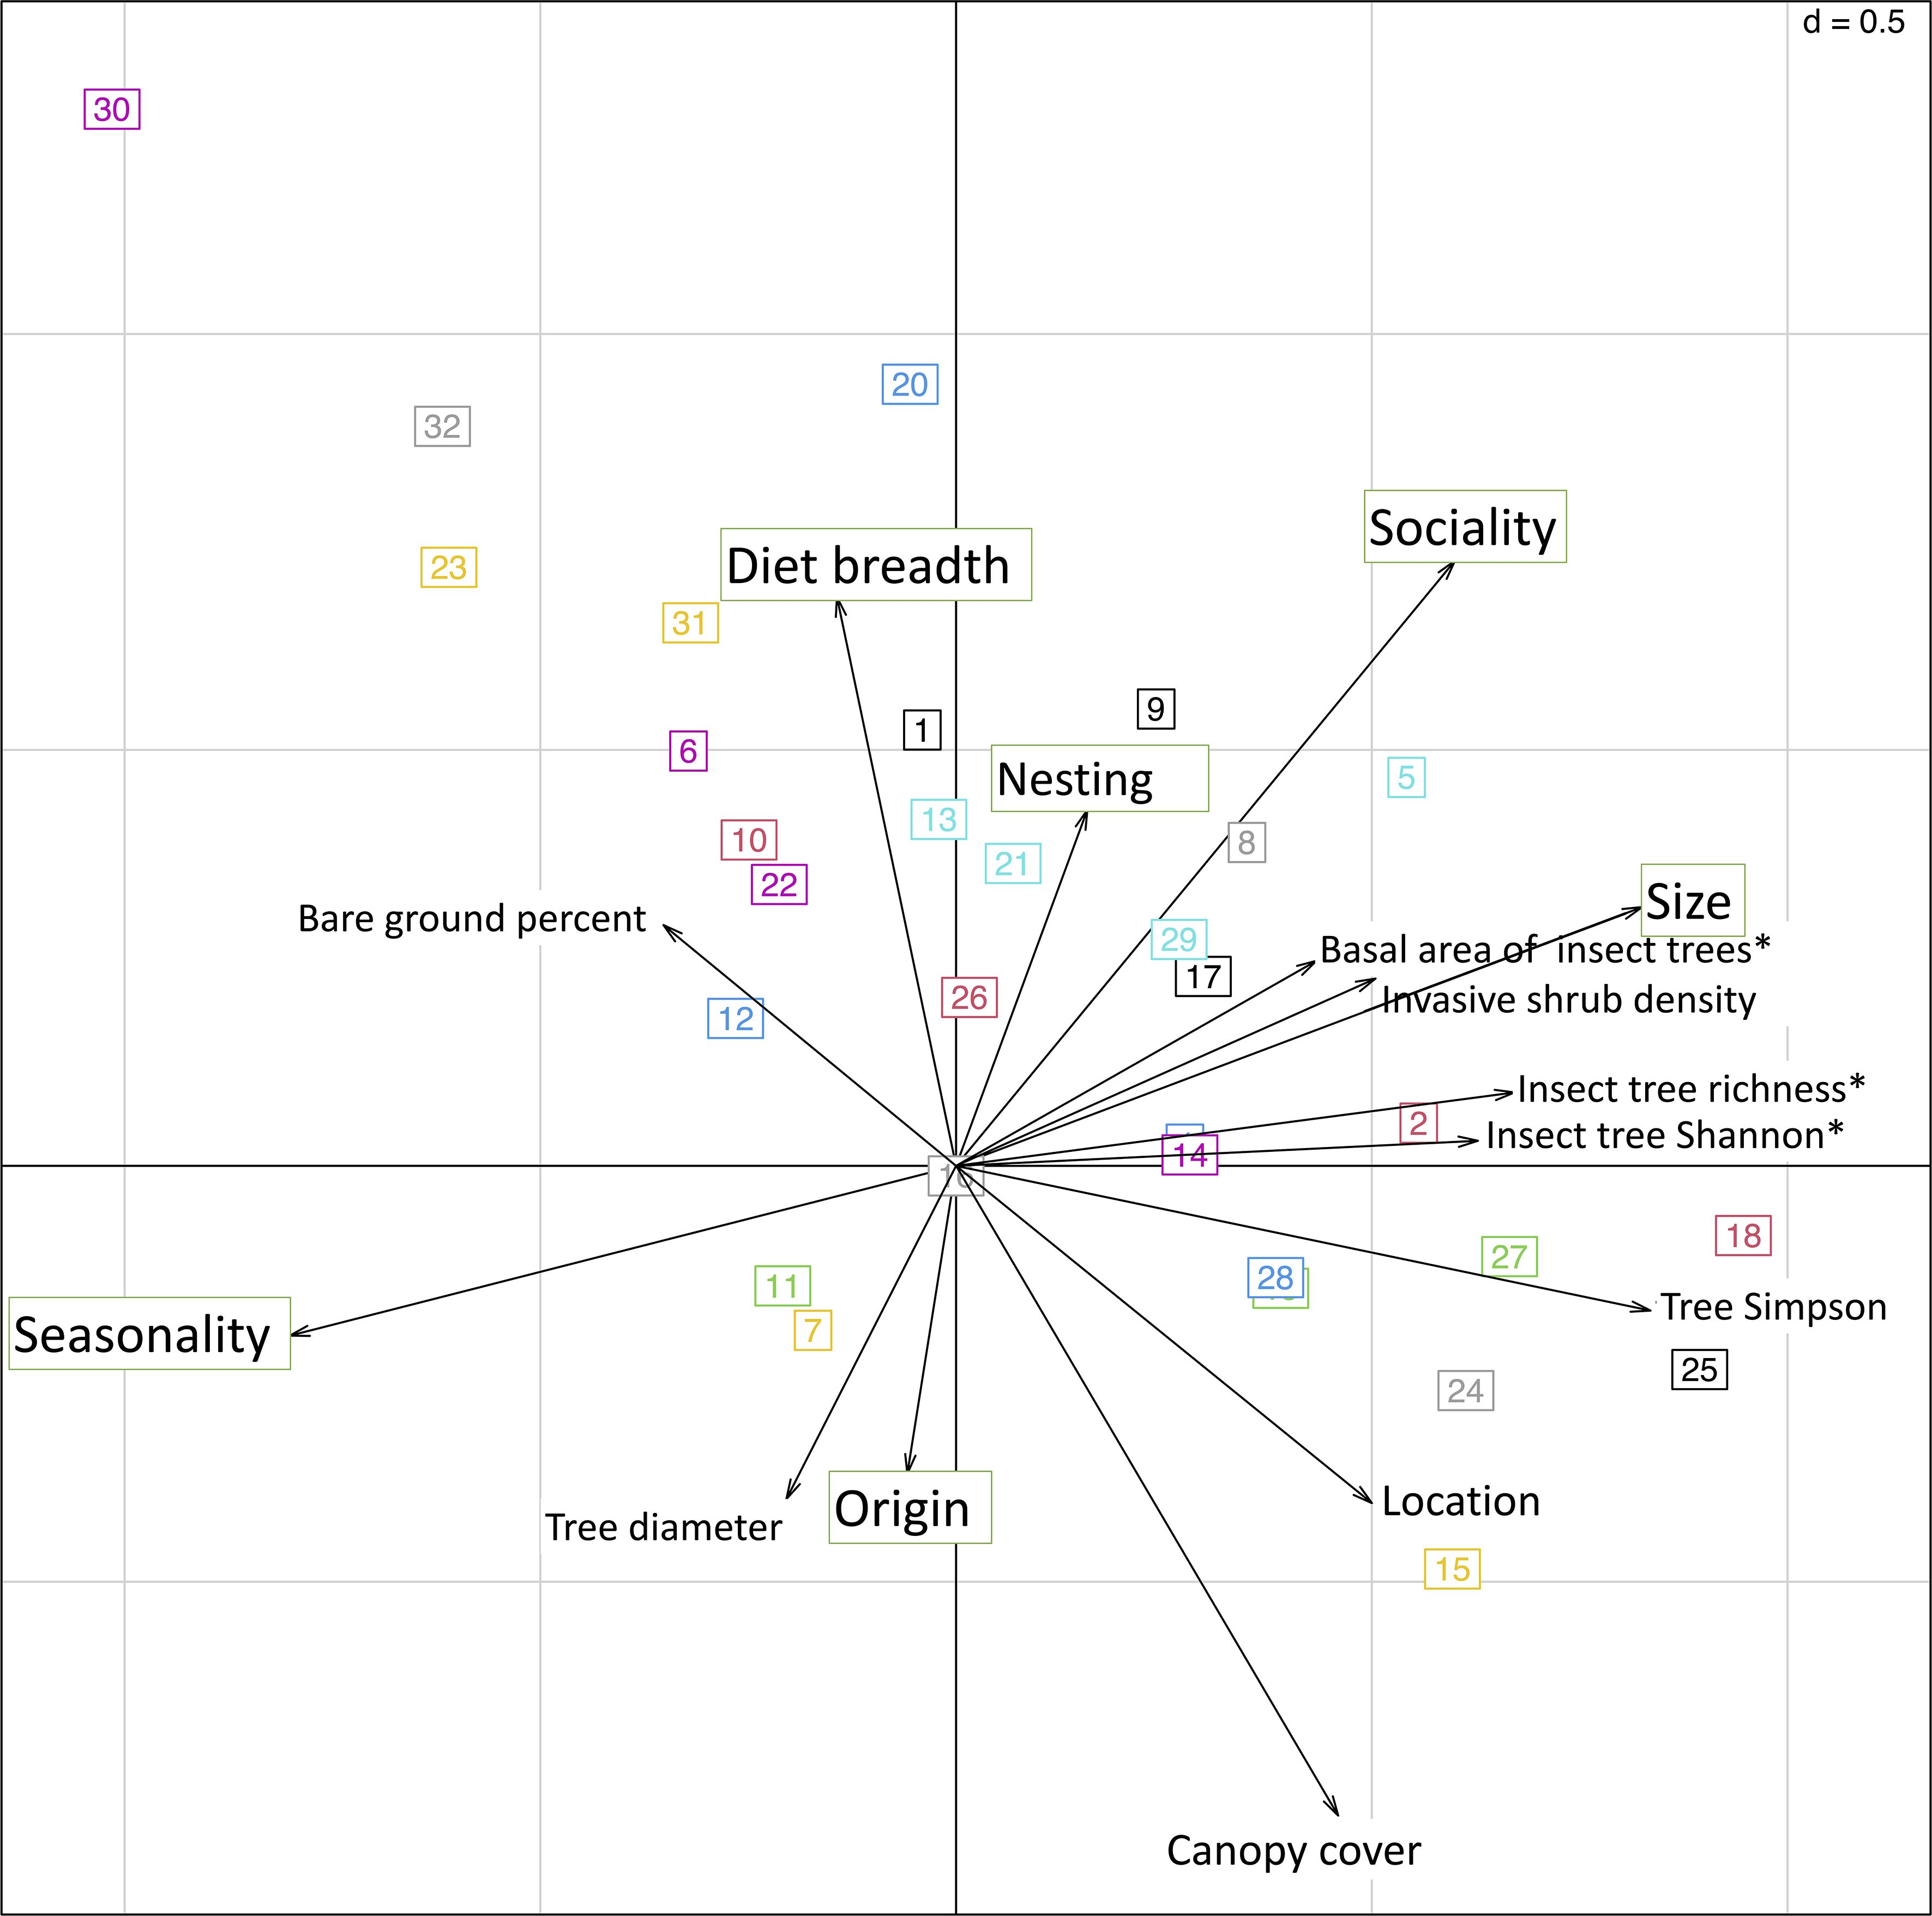
Figure 4 Double canonical correspondence analysis shows the relationship between functional trait size, seasonality, nesting, origin, sociality and diet breadth with local habitat parameters. Numbers in boxes depict functional response clusters from hierarchical cluster analysis of bee species responding similarly to environmental parameters.
Linear models of meaningful environmental parameters on significant functional groups indicated by the cluster analysis revealed interactions between canopy cover, invasive shrub cover, Simpson diversity of all trees, Shannon diversity of insect-pollinated trees, and percent bare ground on nesting, origin, sociality, and diet breadth (Supplementary Figures 4-8).
4 Discussion
Here, we determined local drivers of bee community composition and functional diversity in urban forest fragments. Species and functional diversity revealed different insights into the communities at the interior and edge of urban forests. The 122 sampled species represent 22% of the 542 bee species recorded in Georgia (Native Bees of Georgia, https://native-bees-of-georgia.ggc.edu/?page_id=28). We found greater abundance and species richness at forest edge than interior, and bee community composition was distinct between edge and interior locations (Figure 3). This community composition was largely driven by local environmental factors including canopy cover, invasive shrub cover, bare ground, and tree diversity. The bee community in urban forest fragments exhibits a diverse assemblage of functional traits (Figure 2). The functional community response to local environmental factors was largely influenced by origin, nesting, diet breadth, and sociality (Figure 4). While most of the species richness can be categorized as small, solitary, early-season, soil-nesting, native, generalists, abundance favored large, social, mid-season, litter-nesting, native, generalists. This discrepancy between richness and abundance largely is due to the hyperabundance of Bombus impatiens and Bombus bimaculatus.
Of the local environmental factors assessed, canopy cover is known to negatively impact bee abundance and richness as light availability is associated with greater diversity (Kilkenny and Galloway, 2008; Williams and Winfree, 2013). Here, canopy cover was found to be multicollinear with leaf litter. We found that more bare ground availability was associated with greater bee abundance and diversity. While over three-fourths of all bee species globally nest in the soil (Antoine and Forrest, 2021), over half of all species sampled in the present study were soil nesting species. Open areas and clearcuts support soil nesting bees (Fortuin and Gandhi, 2021). Ground cover generally has a negative impact on these, as they require open swaths of bare ground for nesting. Development may offer opportunities for exposed ground. However, a recent study indicated that closed canopy forests with frequent disturbance to leaf litter may be beneficial to ground nesting bees (Ulyshen et al., 2023).
While the cavity nesting functional guild was the most second most diverse group, we did not detect dead and downed wood as a predictor of bee community composition. However, deadwood in the canopy may have a greater contribution to nesting resources for cavity nesting bees (Urban-Mead et al., 2021; Milam et al., 2022). Alternatively, neighboring developed, and residential areas provide a plethora of wooden and stone structures such as walls and porches that offer alternative nesting substrates for cavity nesting bees.
Origin of bee species explained some of the relation between functional community and environment. While majority of bees sampled were native, Osmia taurus and Apis mellifera were the most abundant exotic species. Peponapis pruinosa, Xenoglossa strenua, and Megachile sculpturalis were also documented within the present study. Osmia taurus is native to east Asia and was first documented in Georgia between 2018 and 2020 (Gutierrez et al., 2023). This species is suspected to directly compete with and spread disease into native Osmia populations (LeCroy et al., 2023). We detected a slight positive association between invasive shrub cover and exotic bee abundance in the present study. This is consistent with a 2022 study that found more exotic than native bees on exotic woody shrubs in an urban setting (Potter and Mach, 2022). Previous studies suggest that nonnative shrub cover decreases bee diversity, particularly at the forest floor (Ulyshen et al., 2020).
Kleptoparasitic bees, as indicated by the occupied nesting and parasitic sociality functional guilds, are distinctly recognized as disturbance sensitive taxa that are associated with forested land cover (Sheffield et al., 2013; Harrison et al., 2018). These species tended to be small to medium in size; often emerging early (Supplementary Table 2). The highest kleptoparasite diversity captured lies within the genus Nomada. We also documented kleptoparasites in the genera Malecta, Holcopasites, Sphecodes, and Heriades in urban forests. While kleptoparisitc bees do not provision their own nests with pollen, they still rely on flowers for nectar and thus remain pollinators. Bees that fit into the occupied nesting functional group are more abundant in managed hardwood; compared to pine and clearcut stands (Fortuin and Gandhi, 2021). However, the presence of these bees depends on the presence of host species and whether they are cavity or soil nesting taxa. Due to their dependence on other bee taxa and sensitivity to disturbance, it has been proposed that kleptoparasites could be used a indicators of bee community health (Sheffield et al., 2013; Odanaka and Rehan, 2019). However, hosts species of these kleptoparasites are poorly understood. Future studies should focus efforts to further understand life history of kleptoparisitic species.
We did not find a significant relationship with bee community composition and size or seasonality. Several studies have found no difference in body size between forest types or with development (Fortuin and Gandhi, 2021; Braman et al., 2023). In a 2020 meta-analysis of functional traits in urban areas, body size again offered mix results where 8 studies found a positive relationship while others had none (Buchholz and Egerer, 2020).
Our finding of no relationship with seasonality and functional diversity groupings is unusual as previous studies suggest that forests are particularly beneficial for early season bees (Harrison et al., 2018; Urban-Mead et al., 2021). It is plausible that the abundance of mid-season bees (e.g. Bombus spp.) obscured the relationship between seasonality and habitat parameters. However, the lack of a relationship between seasonality and the observed bee community may also suggest that forest fragments support bees across seasons. While floral resources at the forest interior proliferate in spring with overstory tree bloom (Schemske et al., 1978; Heinrich, 1976), forests also provide non-floral resources including nesting materials for a bees across nesting functional guilds, honeydews for non-floral sugar sources, resins for nest building, and the physical structure of the forests can buffer bees from weather and climate change (Ulyshen et al., 2023).
The indicator species analysis revealed three species associated with forest edge: Hoplitis truncata, Ptilothrix bombiformis, and Bombus pensylvanicus. H. truncata is a small bee in the Megachilid family. While literature documents little on this species’ natural history, this bee is active early in the season and presumably builds nests in cavities or pithy stems as is common for species within the Megachilidae family. H. truncata likely formed the association with forest edges which provides abundant natural stems for the bees to create their nests. P. bombifomis is a large, mid-season, mallow specialist. These bees build turret-style nests from exposed mud and water (Rust, 1980). Their edge association is likely attributed to their diet breadth and nesting biology where both the flowers on which they specialize, and nesting substrates are found at edge into open areas. B. pensylvanicus is a large, generalist, social bee. B. pensylvanicus is an open area associated species, as they nest in grass and vacant rodent dens. The IUCN Redlist considers B. pensylvanicus as a vulnerable species (Hatfield et al., 2015). These three species can serve as a benchmark for future studies monitoring value of urban forest fragments.
These findings add to the growing body of literature suggesting that forest cover benefits bee diversity. The local environment created by forested ecosystems favors a variety of floral resources and nesting substrates (soil, leaf litter, cavities) that support wild bees within a variety of functional guilds. It is important to consider the interactions of different bees with varied functional traits and their environment when managing forest fragments to support diverse bee communities. Management should focus on augmenting forage and nesting resources. Diverse tree canopies provide pollen and nectar resources for early season bees (Urban-Mead et al., 2023; Wood et al., 2021). Insect-pollinated genera including Acer, Prunus, Liriodendron and wind-pollinated Quercus prove to be valuable pollen and nectar sources. Tree diversity further creates nesting opportunities, where tree roots create gaps of exposed soil for ground nesting species, and leaf litter provides materials for litter dwelling species. Fallen tree root balls expose bare ground, as well, and subsequently provide substrates for cavity nesting bees as the tree decomposes. While invasive plants may offer floral resources for native pollinators, their removal has been shown to bolster pollinator communities by increasing native flora while offering nesting opportunities in bare ground, leaf litter, or dead wood cavities (Ulyshen et al., 2020).
In habitats already fragmented by urbanization, further loss has negative effects on bee abundance and diversity (Winfree et al., 2009). While mature hardwood forests support a functionally diverse assemblage of wild bees (Fortuin and Gandhi, 2021), urban development provides unique avenues for pollinator conservation (Braman and Griffin, 2022). Protecting forest fragments amidst development ensures retention of functional diversity of wild bees. While recent pollinator monitoring has focused efforts on maintaining trees for bees, many gaps remain on what tree community structure and extent of forest is necessary for bee conservation. Undoubtedly, continued deforestation and landscape simplification may extirpate forest-associated species from their native landscapes.
Data availability statement
The raw data supporting the conclusions of this article will be made available by the authors, without undue reservation.
Author contributions
ME: Conceptualization, Data curation, Formal analysis, Investigation, Methodology, Visualization, Writing – original draft, Writing – review & editing. MU: Conceptualization, Data curation, Supervision, Writing – review & editing. SB: Conceptualization, Funding acquisition, Methodology, Supervision, Writing – review & editing.
Funding
The author(s) declare financial support was received for the research, authorship, and/or publication of this article. This project is based on research that was partially supported by the Georgia Agricultural Experiment Station with funding from the Hatch Act (Accession Number 224057) through the USDA National Institute for Food and Agriculture.
Acknowledgments
We would like to thank Charlie Braman and Dr. Conor Fair for their continued support with statistics and modeling. Katherine Odanaka graciously identified all species of Nomada in this study. Riley Forrestall, James Hussey, and Cullen Doyle all contributed to field collection and specimen processing. Finally, we would like to acknowledge Athens-Clarke County Leisure Services, the State Botanical Garden of Georgia, Woodland Gardens Organic Farm, and Oconee Forest Park for facilitating our study.
Conflict of interest
The authors declare that the research was conducted in the absence of any commercial or financial relationships that could be construed as a potential conflict of interest.
Publisher’s note
All claims expressed in this article are solely those of the authors and do not necessarily represent those of their affiliated organizations, or those of the publisher, the editors and the reviewers. Any product that may be evaluated in this article, or claim that may be made by its manufacturer, is not guaranteed or endorsed by the publisher.
Supplementary material
The Supplementary Material for this article can be found online at: https://www.frontiersin.org/articles/10.3389/fevo.2024.1389619/full#supplementary-material
References
Antoine C. M., Forrest J. R. K. (2021). Nesting habitat of ground-nesting bees: A review. Ecol. Entomology 46, 143–159. doi: 10.1111/een.12986
Ayers A. C., Rehan S. M. (2021). Supporting bees in cities: how bees are influenced by local and landscape features. Insects 12, 128. doi: 10.3390/insects12020128
Baldock K. C. (2020). Opportunities and threats for pollinator conservation in global towns and cities. Curr. Opin. Insect Sci. 38, 63–71. doi: 10.1016/j.cois.2020.01.006
Bates D., Maechler M., Bolker B., Walker S. (2015). Fitting linear mixed-effects models using lme4. J. Stat. Software 67, 1–48. doi: 10.18637/jss.v067.i01
Braman S. K., Griffin B. (2022). Opportunities for and impediments to pollinator conservation in urban settings: A review. J. Integrated Pest Manage. 13, 6. doi: 10.1093/jipm/pmac004
Braman C. A., McCarty E., Ulyshen M. D., Janvier A. J., Traylor C., Edelkind-Vealey M., et al. (2023). Urban bee functional groups response to landscape context in the Southeastern US. Front. Sustain. Cities 5. doi: 10.3389/frsc.2023.1192588
Brasil S. N., Ayers A. C., Rehan S. M. (2023). The effect of urbanisation and seasonality on wild bee abundance, body size and foraging efforts. Ecol. Entomol. 48 (4), 499–507.
Buchholz S., Egerer M. H. (2020). Functional ecology of wild bees in cities: towards a better understanding of trait-urbanization relationships. Biodiversity Conserv. 29, 2779–2801. doi: 10.1007/s10531-020-02003-8
Burkle L. A., Marlin J. C., Knight T. M. (2013). Plant-pollinator interactions over 120 years: loss of species, co-occurrence, and function. Science 339, 1611–1615. doi: 10.1126/science.1232728
Cayuela L., Gotelli N. J. (2022). “rareNMtests: ecological and biogeographical null model tests for comparing rarefaction curves,” in R package version 1.2. Available at: https://CRAN.R-project.org/package=rareNMtests.
Chao A., Chiu C. H., Jost L. (2014). Unifying species diversity, phylogenetic diversity, functional diversity, and related similarity and differentiation measures through Hill numbers. Annual review of ecology, evolution, and systematics. 45, 297–324. doi: 10.1146/annurev-ecolsys-120213-091540
Danforth B. N., Minckley R. L., Neff J. L. (2019). The solitary bees: biology, evolution, conservation (Princeton, NJ: Princeton University Press). doi: 10.1515/9780691189321
De Cáceres M., Legendre P. (2009). Associations between species and groups of sites: indices and statistical inference. Ecology 90, 3566–3574. doi: 10.1890/08-1823.1
Dray S., Dufour A. B. (2007). The ade4 package: implementing the duality diagram for ecologists. J. Stat. software 22, 1–20. doi: 10.18637/jss.v022.i04
Fortuin C. C., Gandhi K. J. K. (2021). Functional traits and nesting habitats distinguish the structure of bee communities in clearcut and managed hardwood and pine forests in Southeastern USA. For. Ecol. Manage. 496, 119351. doi: 10.1016/j.foreco.2021.119351
Fox J., Weisberg S. (2019). An R Companion to Applied Regression. 3rd ed. (Thousand Oaks CA: Sage). Available at: https://socialsciences.mcmaster.ca/jfox/Books/Companion/.
Gibbs J. (2011). Revision of the metallic Lasioglossum (Dialictus) of eastern North America (Hymenoptera: Halictidae: Halictini). Zootaxa 3073, 1. doi: 10.11646/zootaxa.3073.1
Gibbs J., Packer L., Dumesh S., Danforth B. N. (2013). Revision and reclassification of Lasioglossum (Evylaeus), L.(Hemihalictus) and L. (Sphecodogastra) in eastern North America (Hymenoptera: Apoidea: Halictidae). Zootaxa. 3672, 1–117. doi: 10.11646/zootaxa.3672.1.1
Götzenberger L., de Bello F., Dias A. T., Moretti M., Berg M., Carmona C. P. (2021). Trait-Based Ecology Tools in R. doi: 10.20350/digitalCSIC/12663
Greenleaf S. S., Williams N. M., Winfree R., Kremen C. (2007). Bee foraging ranges and their relationship to body size. Oecologia 153, 589–596. doi: 10.1007/s00442-007-0752-9
Griffin S. R., Haddad N. M. (2021). Connectivity and edge effects increase bee colonization in an experimentally fragmented landscape. Ecography 44, 919–927. doi: 10.1111/ecog.05299
Gutierrez G. M., LeCroy K. A., Roulston T. A. H., Biddinger D. J., López-Uribe M. M. (2023). Osmia taurus (Hymenoptera: Megachilidae): A non-native bee species with invasiveness potential in North America. Environ. entomology 52, 149–156. doi: 10.1093/ee/nvad005
Haddad N. M., Brudvig L. A., Clobert J., Davies K. F., Gonzalez A., Holt R. D., et al. (2015). Habitat fragmentation and its lasting impact on Earth’s ecosystems. Sci. Adv. 1, e1500052. doi: 10.1126/sciadv.1500052
Harrison T., Gibbs J., Winfree R. (2018). Forest bees are replaced in agricultural and urban landscapes by native species with different phenologies and life-history traits. Global Change Biol. 24, 287–296. doi: 10.1111/gcb.13921
Harrison T., Winfree R. (2015). Urban drivers of plant-pollinator interactions. Funct. Ecol. 29, 879–888. doi: 10.1111/1365-2435.12486
Hatfield R., Jepsen S., Thorp R., Richardson L., Colla S., Jordan S. F. (2015)Bombus pensylvanicus. In: The IUCN Red List of Threatened Species 2015 (Accessed 19 January 2024).
Heinrich B. (1976). Flowering phenologies: bog, woodland, and disturbed habitats. Ecology 57, 890–899. doi: 10.2307/1941055
Janvier A. J., Ulyshen M. D., Braman C. A., Traylor C., Edelkind-Vealey M., Braman S. K. (2022). Scale-dependent effects of landscape context on urban bee diversity. J. Insect Conserv. 26, 697–709. doi: 10.1007/s10841-022-00402-6
Kilkenny F. F., Galloway L. F. (2008). Reproductive success in varying light environments: direct and indirect effects of light on plants and pollinators. Oecologia 155, 247–255. doi: 10.1007/s00442-007-0903-z
Kleyer M., Dray S., Bello F., Lepš J., Pakeman R., Strauss B., et al. (2012). Assessing species and community functional responses to environmental gradients: which multivariate methods? J. Veg. Sci. 23, 805–821. doi: 10.1111/j.1654-1103.2012.01402.x
LeCroy K. A., Krichilsky E., Grab H. L., Roulston T. H., Danforth B. N. (2023). Spillover of chalkbrood fungi to native solitary bee species from non-native congeners. J. Appl. Ecol. 60, 1067–1076. doi: 10.1111/1365-2664.14399
Legendre P., Gallagher E. D. (2001). Ecologically meaningful transformations for ordination of species data. Oecologia 129, 271–280. doi: 10.1007/s004420100716
Lenth R. (2023). “emmeans: Estimated Marginal Means, aka Least-Squares Means,” in R package version 1.8.5. Available at: https://CRAN.R-project.org/package=emmeans.
Li D. (2018). hillR: taxonomic, functional, and phylogenetic diversity and similarity through Hill Numbers. J. Open SourceSoftware 3, 1041. doi: 10.21105/joss.01041
MacIvor J. S., Cabral J. M., Packer L. (2014). Pollen specialization by solitary bees in an urban landscape. Urban Ecosyst. 17, 139–147. doi: 10.1007/s11252-013-0321-4
Milam J., Cunningham-Minnick M., Roberts H. P., Buelow C., King D. I. (2022). The contribution of canopy samples to assessments of forestry effects on native bees. Conserv. Sci. Pract. 4, e12690. doi: 10.1111/csp2.12690
Miller M. D. (2012). The impacts of Atlanta’s urban sprawl on forest cover and fragmentation. Appl. Geogr. 34, 171–179. doi: 10.1016/j.apgeog.2011.11.010
Mitchell T. B. (1960). “Bees of the eastern United States volume I,” in North Carolina Agricultural Experiment Station Technical Bulletin No, vol. 141. .
Mitchell T. B. (1962). “Bees of the eastern United States, volume 2,” in North Carolina Agricultural Experiment Station Technical Bulletin No, vol. 141. .
Murtagh F., Legendre P. (2014). Ward’s hierarchical agglomerative clustering method: which algorithms implement ward’s criterion? J. Classif 31, 274–295. doi: 10.1007/s00357-014-9161-z
Odanaka K. A., Rehan S. M. (2019). Impact indicators: Effects of land use management on functional trait and phylogenetic diversity of wild bees. Agriculture Ecosyst. Environ. 286, 106663. doi: 10.1016/j.agee.2019.106663
Oksanen J., Simpson G., Blanchet F., Kindt R., Legendre P., Minchin P., et al. (2022). “vegan: community ecology package,” (R package version 2.6–4). Available at: https://CRAN.R-project.org/package=vegan.
Ollerton J. (2021). Pollinators and pollination: nature and society (Exeter, UK: Pelagic Publishing Ltd). doi: 10.53061/JAOK9895
Osborne J. L., Martin A. P., Carreck N. L., Swain J. L., Knight M. E., Goulson D., et al. (2008). Bumblebee flight distances in relation to the forage landscape. J. Anim. Ecol. 77, 406–415. doi: 10.1111/j.1365-2656.2007.01333.x
Potter D. A., Mach M. B. (2022). Non-native non-apis bees are more abundant on non-native versus native flowering woody landscape plants. Insects 13, 238. doi: 10.3390/insects13030238
R Core Team (2022). R: A language and environment for statistical computing (Vienna, Austria: R Foundation for Statistical Computing). Available at: https://www.R-project.org/.
Ren P., Didham R. K., Murphy M. V., Zeng D., Si X., Ding P. (2023). Forest edges increase pollinator network robustness to extinction with declining area. Nat. Ecol. Evol. 7, 393–404. doi: 10.1038/s41559-022-01973-y
Roswell M., Dushoff J., Winfree R. (2021). A conceptual guide to measuring species diversity. Oikos 130, 321–338. doi: 10.1111/oik.07202
Russo L., de Keyzer C. W., Harmon-Threatt A. N., LeCroy K. A., MacIvor J. S. (2021). The managed-to-invasive species continuum in social and solitary bees and impacts on native bee conservation. Curr. Opin. Insect Sci. 46, 43–49. doi: 10.1016/j.cois.2021.01.001
Rust R. W. (1980). The biology of Ptilothrix bombiformis (Hymenoptera: Anthophoridae). J. Kansas Entomological Soc., 427–436.
Schemske D. W., Willson M. F., Melampy M. N., Miller L. J., Verner L., Schemske K. M., et al. (1978). Flowering ecology of some spring woodland herbs. Ecology 59, 351–366. doi: 10.2307/1936379
Sheffield C. S., Pindar A., Packer L., Kevan P. G. (2013). The potential of cleptoparasitic bees as indicator taxa for assessing bee communities. Apidologie 44, 501–510. doi: 10.1007/s13592-013-0200-2
Smith C., Harrison T., Gardner J., Winfree R. (2021). Forest-associated bee species persist amid forest loss and regrowth in eastern North America. Biol. Conserv. 260, 109202.
Smith C., Weinman L., Gibbs J., Winfree R. (2019). Specialist foragers in forest bee communities are small, social or emerge early. J. Anim. Ecol. 88, 1158–1167. doi: 10.1111/1365-2656.13003
Traylor C. R., Ulyshen M. D., Bragg D. C., McHugh J. V. (2024). Forest bees need compositionally diverse canopies. doi: 10.21203/rs.3.rs-4110135/v1
Traylor C. R., Ulyshen M. D., Wallace D., Loudermilk E. L., Ross C. W., Hawley C., et al. (2022). Compositional attributes of invaded forests drive the diversity of insect functional groups. Global Ecol. Conserv. 35, e02092. doi: 10.1016/j.gecco.2022.e02092
Ulyshen M. D., Horn S., Hanula J. L. (2020). Effects of chinese privet on bees and their vertical distribution in riparian forests. For. Sci. 66, 416–423. doi: 10.1093/forsci/fxz088
Ulyshen M. D., Soon V., Hanula J. L. (2010). On the vertical distribution of bees in a temperate deciduous forest. Insect Conserv. Diversity 3, 222–228. doi: 10.1111/j.1752-4598.2010.00092.x
Ulyshen M., Traylor C. R., Danforth B. N. (2023). Patterns of nest-site selection by Colletes thoracicus within a forested watershed. Apidologie 54, 56. doi: 10.1007/s13592-023-01035-7
United States Department of Agriculture, Forest Service (2016). “Forest inventory and analysis national core field guide,” in Volume 1: Fidel data collection procedures for phase 2 plots, Version 7.1. Available at: https://www.fia.fs.fed.us/library/field-guides-methods-proc/.
Urban-Mead K. R., Van Dyke M., Muñiz P., Young A. D., Danforth B. N., McArt S. H. (2023). Early spring orchard pollinators spill over from resource-rich adjacent forest patches. J. Appl. Ecol. 60, 553–564. doi: 10.1111/1365–2664.14350
Urban-Mead K. R., Muñiz P., Gillung J., Espinoza A., Fordyce R., van Dyke R., et al. (2021). Bees in the trees: Diverse spring fauna in temperate forest edge canopies. For. Ecol. Manag. 482, 118903.
Violle C., Navas M.-L., Vile D., Kazakou E., Fortunel C., Hummel I., et al. (2007). Let the concept of trait be functional! Oikos 116(5), 882–892. doi: 10.1111/j.0030–1299.2007.15559.x
Wenzel A., Grass I., Belavadi V. V., Tscharntke T. (2020). How urbanization is driving pollinator diversity and pollination–A systematic review. Biol. Conserv. 241, 108321. doi: 10.1016/j.biocon.2019.108321
Williams N. M., Winfree R. (2013). Local habitat characteristics but not landscape urbanization drive pollinator visitation and native plant pollination in forest remnants. Biol. Conserv. 160, 10–18. doi: 10.1016/j.biocon.2012.12.035
Winfree R., Aguilar R., Vázquez D. P., LeBuhn G., Aizen M. A. (2009). A meta-analysis of bees’ responses to anthropogenic disturbance. Ecology 90, 2068–2076. doi: 10.1890/08-1245.1
Keywords: wild bees, fragmentation, functional diversity, urban forest, diversity
Citation: Edelkind-Vealey M, Ulyshen MD and Braman SK (2024) Local factors influence the wild bee functional community at the urban-forest interface. Front. Ecol. Evol. 12:1389619. doi: 10.3389/fevo.2024.1389619
Received: 21 February 2024; Accepted: 26 April 2024;
Published: 13 May 2024.
Edited by:
Neelendra K. Joshi, University of Arkansas, United StatesReviewed by:
Michał Filipiak, Jagiellonian University, PolandKei Uchida, The University of Tokyo, Japan
Copyright © 2024 Edelkind-Vealey, Ulyshen and Braman. This is an open-access article distributed under the terms of the Creative Commons Attribution License (CC BY). The use, distribution or reproduction in other forums is permitted, provided the original author(s) and the copyright owner(s) are credited and that the original publication in this journal is cited, in accordance with accepted academic practice. No use, distribution or reproduction is permitted which does not comply with these terms.
*Correspondence: Miriam Edelkind-Vealey, bWlyaWFtLmVkZWxraW5kQHVnYS5lZHU=