 Andrew Møller Gray1,2*
 Alex Innes Thomson3
 Claudia Colesie1
 Peter Convey4,5,6
 Peter Fretwell4
 Alison G. Smith7
 Lloyd S. Peck4
 Matthew P. Davey3
- 1Global Change Institute, School of GeoSciences, University of Edinburgh, Edinburgh, United Kingdom
- 2Terrestrial Ecology Section, Norwegian Institute for Nature Research—NINA, Oslo, Norway
- 3Scottish Association for Marine Science (SAMS), Oban, United Kingdom
- 4British Antarctic Survey (BAS), Natural Environment Research Council, Cambridge, United Kingdom
- 5Department of Zoology, University of Johannesburg, Johannesburg, South Africa
- 6Millennium Institute Biodiversity of Antarctic and Sub-Antarctic Ecosystems, Santiago, Chile
- 7Department of Plant Sciences, University of Cambridge, Cambridge, United Kingdom
Snow algae form extensive blooms within Antarctica’s coastal snowpacks and are a crucial contributor to its scarce terrestrial ecosystems. There is limited knowledge about the factors that contribute to snow algal bloom occurrence, distribution, ecological niche thresholds, or the prevalence of suitable conditions for bloom formation. To address these knowledge gaps and gain a clearer understanding of the current and potential future distribution of blooms, a habitat suitability model, using a Bayesian additive regression tree approach, was established. The model incorporated remotely sensed observations of blooms, physical environmental predictor variables, and snow melt modelling based on different climate scenarios. This was used to describe the ecological niche of snow algae and predict its occurrence at a landscape scale across the Antarctic Peninsula. The findings revealed that most habitable snow was predicted north of latitude 66° S, with patch density, area, and habitable elevation decreasing poleward. Factors that strongly influenced bloom presence were days of snow melt and aspect, with blooms of red-colored algae being associated with longer seasons and north-facing slopes. The model outputs also suggested heterogeneous preferences for environmental conditions amongst red and green snow algae blooms, suggesting a diversity of ecological niches for bloom-forming algae. Long-term climate-change impacts were difficult to discern as extreme summer temperatures and melt during the timeframe of this study in 2021 exceeded the projected 2100 temperatures for parts of the Antarctic Peninsula. However, warmer conditions produced a greater area of potentially habitable snow at higher elevation and latitude. Conversely, small and low-lying islands were predicted to lose habitable snow under a warming scenario. Model and training imagery both indicated that algal blooms are forming on snow-covered icecaps in the South Shetland Islands, suggesting greater potential for glacier-based algal blooms in the future, should recent trends for extreme summer temperatures persist.
1 Introduction
The Antarctic Peninsula is a crucial indicator region for global climate change, having experienced exceptionally rapid warming in recent decades (González-Herrero et al., 2024; Clem et al., 2022). Increasing temperatures are changing the Peninsula’s landscape, with significant consequences for its ecosystems, generating greater snow and ice melt, along with increased occurrence of extreme weather events (Siegert et al., 2023), increased precipitation and new ice-free areas becoming available (Lee et al., 2017; Robinson, 2022). Antarctic snow and ice habitats have been particularly affected by climate change as warming temperatures have driven accelerated melting, as well as changes to seasonal melt dynamics, snow structure, chemistry, and precipitation patterns (Colesie et al., 2023).
Terrestrial snow and ice habitats in Antarctica, particularly in coastal regions, can be host to a variety of microorganisms such as bacteria, fungi and algae, as well as meiofaunal and invertebrate species (Pugh and Convey, 2008; Davey et al., 2019; de Menezes et al., 2019; Chown and Convey 2016). The algal component of the snow ecosystem is useful as a sentinel system for climate change, as thawing conditions within the snow can cause blooms to form in high densities and over large areas (Figure 1). In this state, the snow appears green or red and can be detected and monitored using satellite imagery (Hashim et al., 2016; Huovinen et al., 2018; Gray et al., 2020, 2021). Predictive models have forecast increasing loss and retreat of ice over the next century, with up to a 300% increase (depending on warming scenario) in ice-free territories across the Peninsula region from 2014 to 2100 (Lee et al., 2017). At the same time the zero-degree isotherm, north of which snow melt occurs, is shifting southwards (González-Herrero et al., 2024), potentially opening up new areas for bloom formation. Warmer temperatures and loss of ice and summer snowpacks will change the timing of availability and distribution of snow habitats along the Peninsula and could result in the disappearance of these habitats in some areas. Terrestrial snow and ice algae play important ecological roles in their environment, ranging from contributing to primary production and wider biogeochemical cycles, to influencing the albedo and physical structure of the snow or ice surface (Hodson et al., 2008; Gray et al., 2020; Khan et al., 2021). The consequences of major changes or loss of such habitat could, therefore, be ecologically significant for the region.
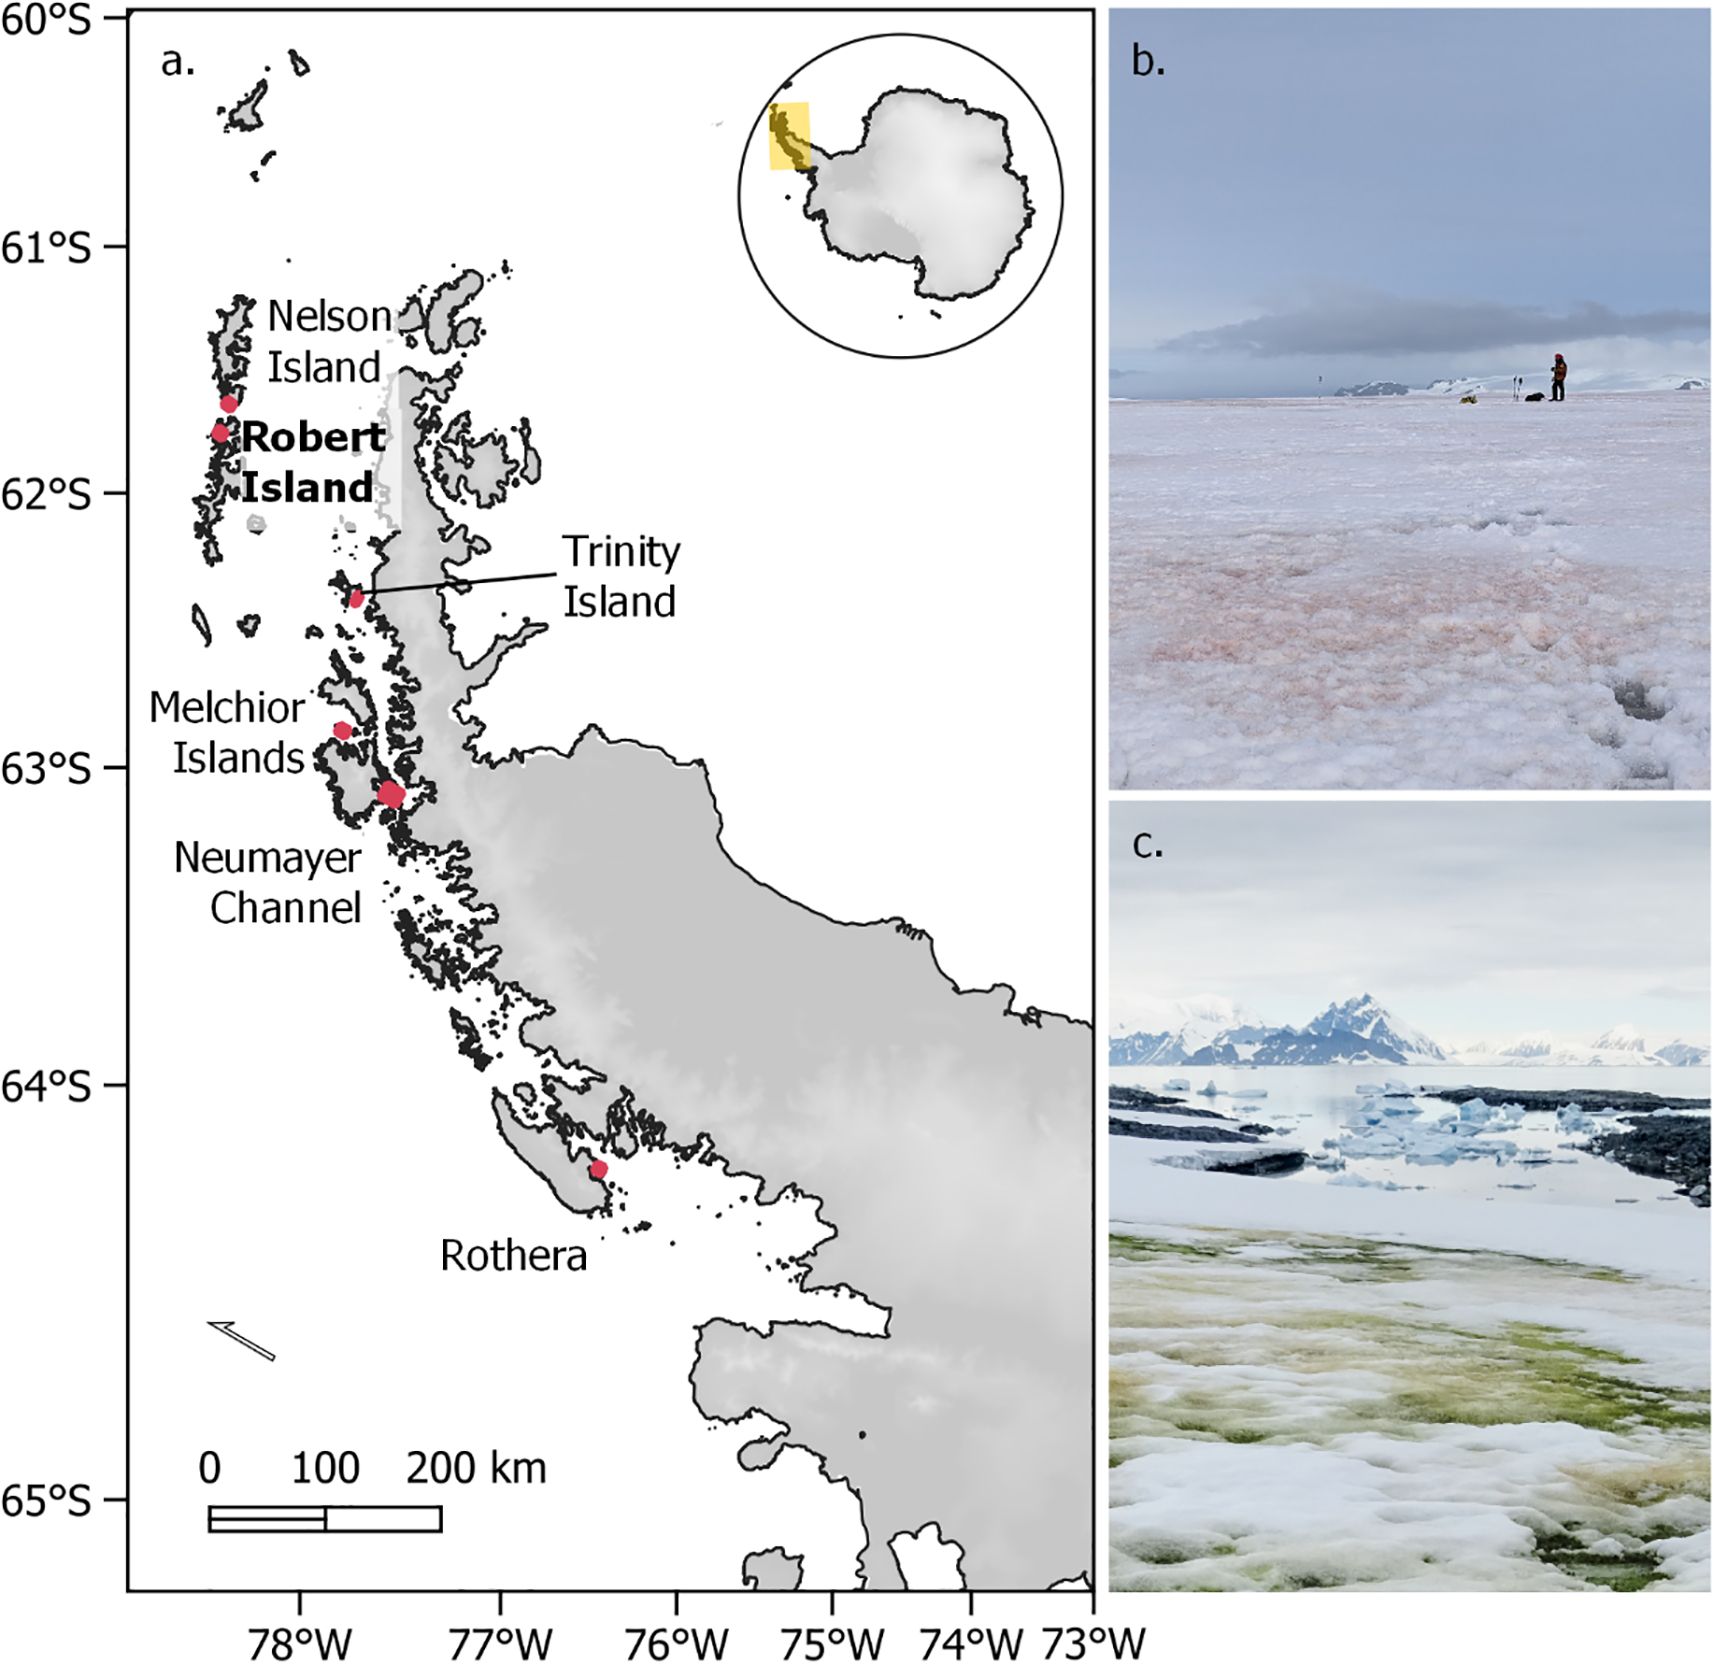
Figure 1. Study locations and bloom sites in the western Antarctic Peninsula region. (A) WorldView 2 and 3 image sites are shown in red, Robert Island ground validation site is highlighted in bold. Coordinates of these images are given in Table 1. (B) Example of a red snow algal bloom on Robert Island. (C) Example of a coastal green snow algal bloom at Anchorage Island, Ryder Bay. Photo credits (B) A. Gray, (C) M. Davey.
Although snow algae occur in polar and alpine areas globally (Benning et al., 2014; Hoham and Remias, 2020), Antarctic snow algae display several unique features, including regular bloom occurrence in coastal, nutrient rich snowpacks, and a higher proportion of endemic species compared to elsewhere in the world (Vyverman et al., 2010). Their contribution to ecological function in Antarctic and sub-Antarctic areas is also highly significant given the extent of the cryospheric habitat, and the limited presence of other photosynthetic life in the region. Despite their significance in Antarctica, our understanding of the processes and factors governing snow algal bloom occurrence remain limited due to the paucity of and challenges in obtaining regular in situ or remote sensed datasets. Snow melt duration (Roussel et al., 2024), light (Lavoie et al., 2005) and nutrient availability (Lavoie et al., 2005; Gray et al., 2020; Phillips-Lander et al., 2020; Roussel et al., 2024) have all been identified as important elements for production and bloom formation, though we lack the explicit link between Antarctic blooms and environmental conditions to assess what role these factors play, or to understand how prevalent bloom forming conditions are in Antarctica.
Previous distribution maps of snow algal blooms using remote sensing methods (Walshaw et al., 2024; Gray et al., 2020; Hashim et al., 2016; Huovinen et al., 2018) show the presence of green snow algae (GSA) across large parts of the coastal western Antarctic Peninsula region. However, satellite detection has limitations, as freely available imagery is generally too spatially coarse to detect small blooms, and too spectrally coarse to detect red snow algae (RSA) over very large areas without confounding false positives. For example, strong signals arising from iron-rich mineral debris within snow, when using band ratios to detect RSA (Chen et al., 2023). Higher resolution satellites, such as the WorldView platforms, are valuable assets for studying Antarctic ecology (e.g., Gray et al., 2021; Jawak et al., 2019; Sun et al., 2021). Their higher spectral resolution (relative to Sentinel 2 and Landsat) enables the detection of RSA alongside GSA (Gray et al., 2021), but the images are costly, and snapshots of a specific point in time meaning that it is difficult to view detailed changes in the dynamic snow habitat. On a physical level, all optical remote sensing methods are hampered by frequent cloud cover over the Antarctic Peninsula, limiting the number of available snapshots.
Habitat suitability modelling can complement remote sensing studies, addressing limitations in temporal resolution, spatial coverage, and data availability. Such models can explore how different environmental predictor variables influence occurrence, predict ecological preferences and distributions over a landscape scale, and forecast responses to climatic variability. For RSA, for example, Onuma et al. (2022) developed a model to estimate occurrence and growth dynamics on a global scale. However, the model differed mechanistically from a habitat suitability model, and related to the ecology of red blooms common in Arctic and alpine areas rather than the unique coastal green and red blooms found in Antarctica. Chen et al. (2023) explored seasonal RSA bloom development over King George Island with respect to climatic conditions but included significant areas of mineral debris within snow in their analysis, due to difficulties isolating RSA in Sentinel 2 imagery. An alternative approach to exploring the relationship between environmental factors and snow algae occurrence in Antarctica is to use models such as Bayesian additive regression trees (BART). BART provides a flexible and robust framework for ecological analysis due to its ability to handle nonlinear relationships, incorporate prior knowledge, and quantify uncertainty (Carlson, 2020; Chipman et al., 2010). In addition, due to the workflow wrapper developed by Carlson (2020), BART models have been gaining traction as a tool for modelling species distributions, including those of trees (Ahmadi et al., 2023) and marine invasive species (Poursanidis et al., 2022).
Our aim in this study was to understand the key factors contributing to the distribution of snow habitats capable of supporting blooms of snow algae throughout the Antarctic Peninsula region. To achieve this, we combined high-resolution satellite observations of snow algal blooms into a BART-based habitat suitability model. This model was then used to explore how environmental variables influenced potential bloom formation as well as distribution shifts (losses and gains) associated with inter-annual variability caused by contemporary extreme weather events as well as long-term predicted trends in climate. To test the factors affecting distribution, variables were chosen to represent growth requirements such as liquid water availability (cumulative snow melt, days of melt), potential nutrient availability (distance to the coast, distance from an animal colony) as well as physical attributes (surface type, slope, aspect).
2 Methods
To construct our model, we derived presence and absence observations of GSA and RSA blooms using satellite imagery from six different locations (Robert Island, Nelson Island (for validation), Trinity Island, Melchior Island, Neumayer Channel, and Ryder Bay) across the Antarctic Peninsula (Figure 1A) and six summer growth seasons (2013, 2017, 2019, 2020, 2021 and 2023). These were used to train a BART-based species distribution model using seven predictor variables based upon abiotic and bioclimatic factors, as described below and in the workflow schematic (Figure 2). Posterior distributions, showing the modelled probability of occurrence, were then mapped across the Antarctic Peninsula using actual climate conditions for 2021 and projected climatic conditions for 2100.
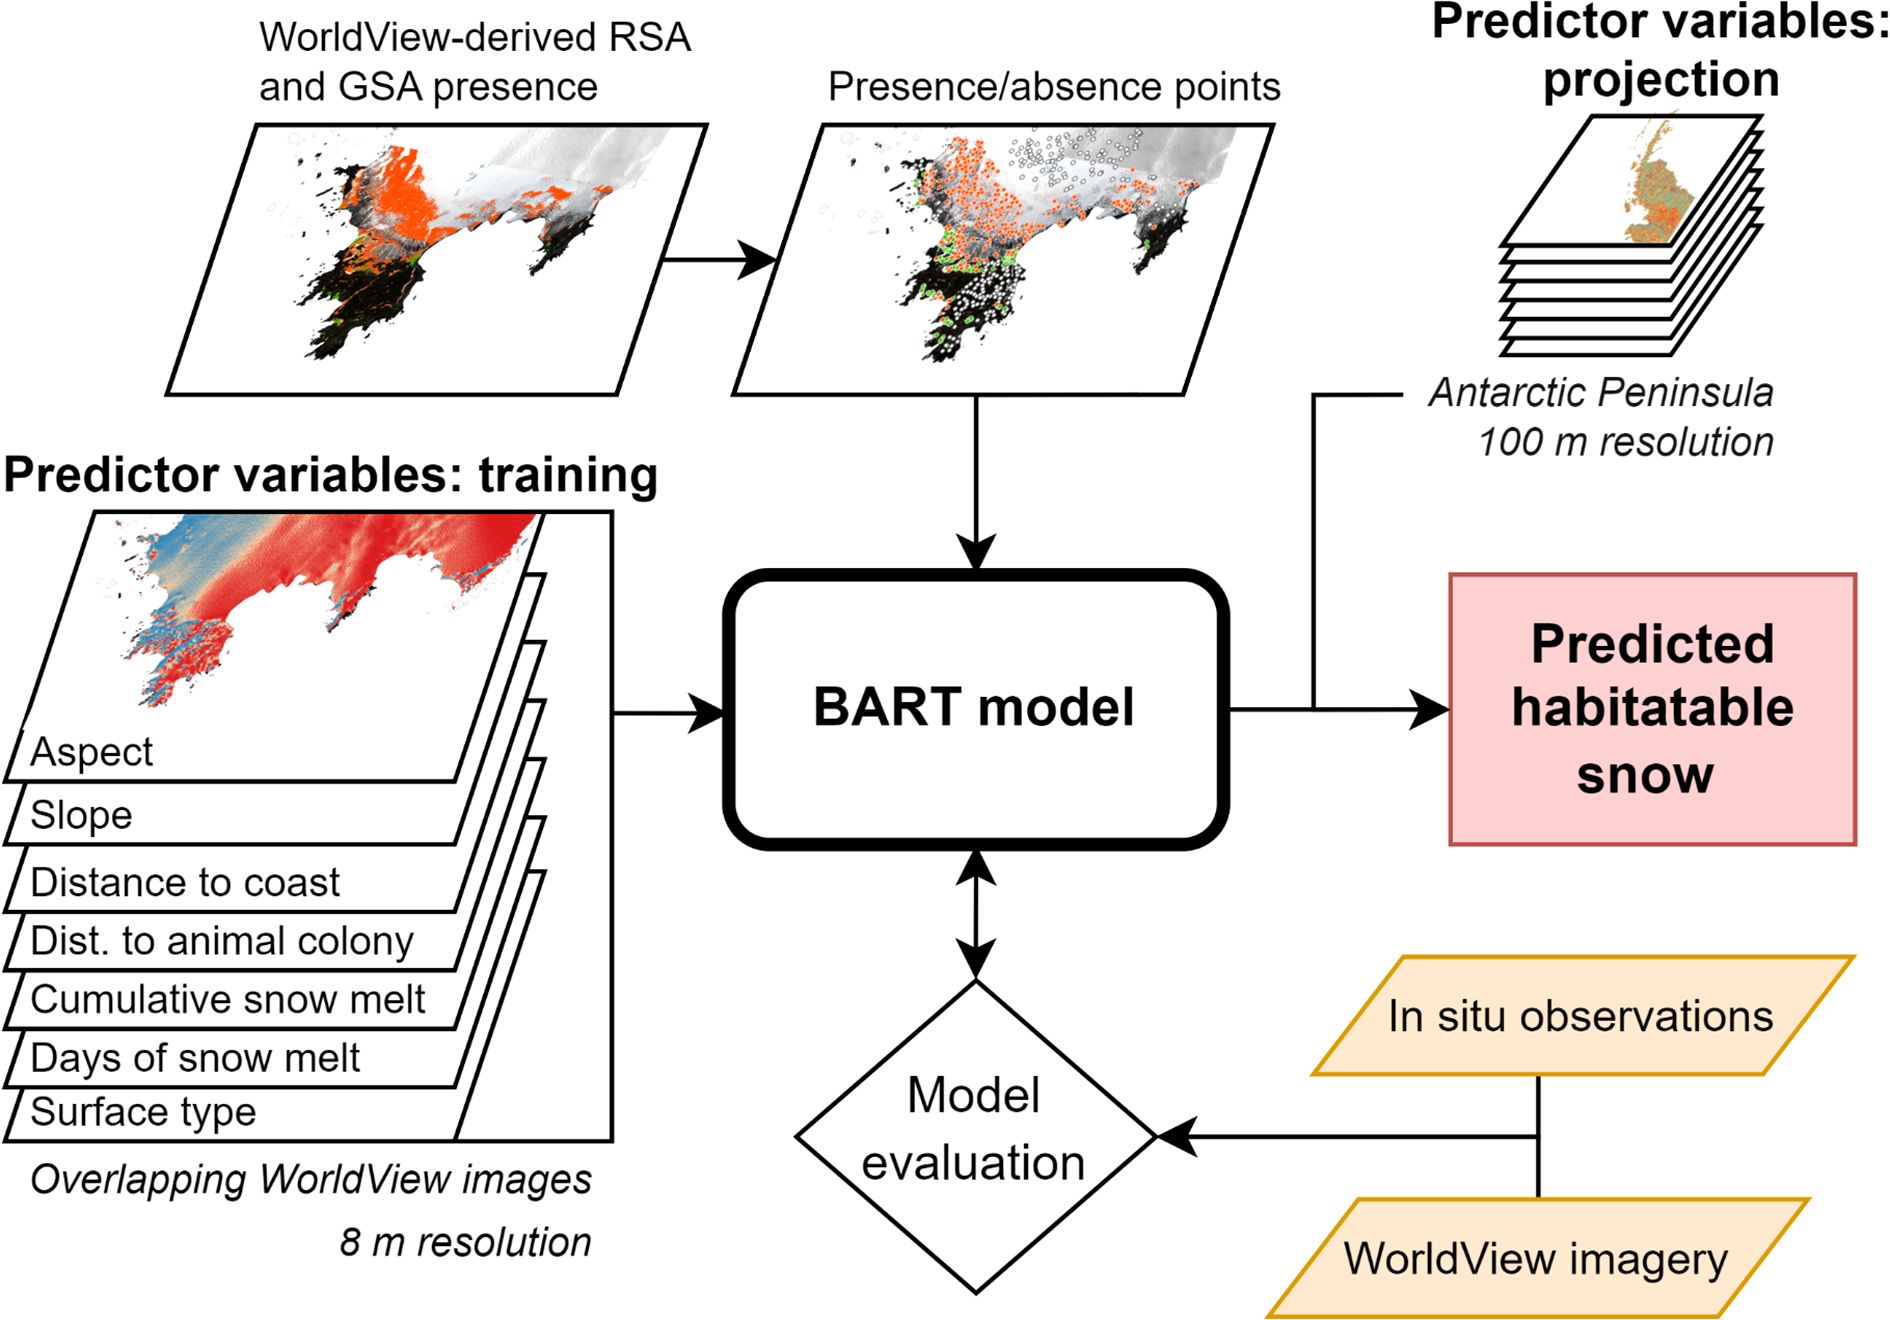
Figure 2. Workflow diagram of the construction of a BART model to produce current and future snow algae bloom probability distribution maps. Training variables overlap the spatial extent and temporal range of each WorldView image used to derive presence/absence data. Predictor variables, used to map habitable snow with the model, cover the Antarctic Peninsula. Model runs (inference) over the Antarctic Peninsula were performed using 2021 and 2100 data.
2.1 Remote sensing presence/absence training data
WorldView imagery (Maxar Technologies) was used to detect snow algae for training the model. It has a high spatial resolution (1.84 m (WorldView 2); 1.24 m (WorldView 3)) and has previously been used to identify GSA and RSA blooms in Antarctica (Gray et al., 2021). Table 1 shows the dates and locations of the scenes used in this study. Each image was an 8-band multispectral scene from WorldView 2 or 3 and was corrected to surface reflectance using the Py6s-derived Atmospheric and Radiometric Correction of Satellite Imagery (ARCSI v4.0.0) (Bunting and Clewley, 2022) software. 6S parameters were set as in Gray et al. (2021).
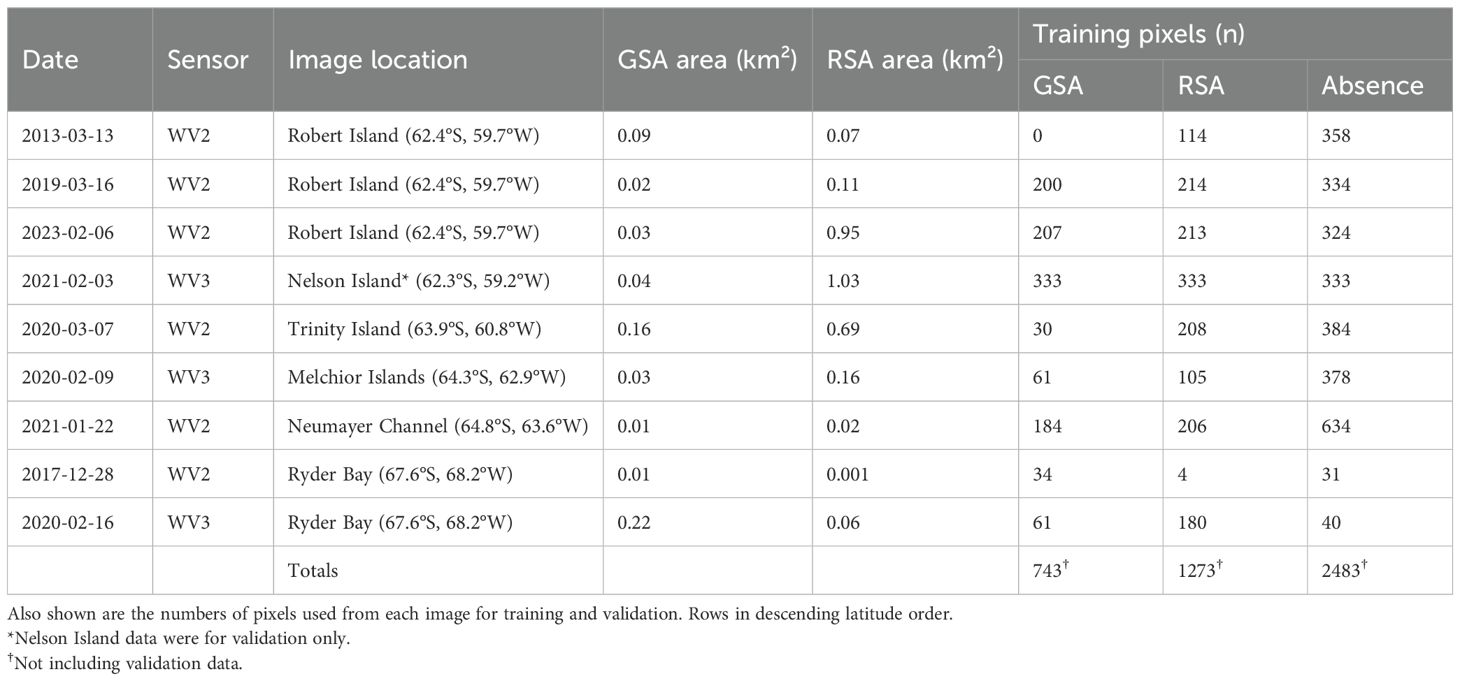
Table 1. The date, WorldView (WV) sensor, location and remote-sensed area estimates of red snow algae (RSA) and green snow algae (GSA) within the images used for training and evaluating the BART model.
Snow algae were detected within the images following the methodology of Gray et al. (2021). First, band thresholds were used to isolate snow and ice from ocean, rock, and vegetation. Algae were identified within snow- or ice-containing pixels utilizing the characteristic absorption of light by chlorophyll-a pigments within the algae, which occurs at around 680 nm, or Band 5 of the WorldView’s multispectral sensor. Instead of using a spectral angle mapper (SAM) approach (Gray et al., 2021) to distinguish GSA from RSA, we adapted the red-green normalized difference index (RGND) approach of Engstrom et al. (2022) for the WorldView sensor i.e., , to differentiate bloom color. This approach simplified classification and does not require in situ reference spectra. Clean and mineral-laden snow, for use as absence data in the model, were also identified within each image, and were defined as snow that did not contain a detectable chlorophyll signal. Remote sensed outputs underwent validation against in situ observations of 361 snow and ice algae blooms made between 30th January 2023 and 13th February 2023 on Robert Island, South Shetland Islands (locations shown in Figure 3A). A confusion matrix and Cohen’s Kappa coefficient were used to assess classification accuracy against bloom location, recorded by handheld GPS at the bloom center.
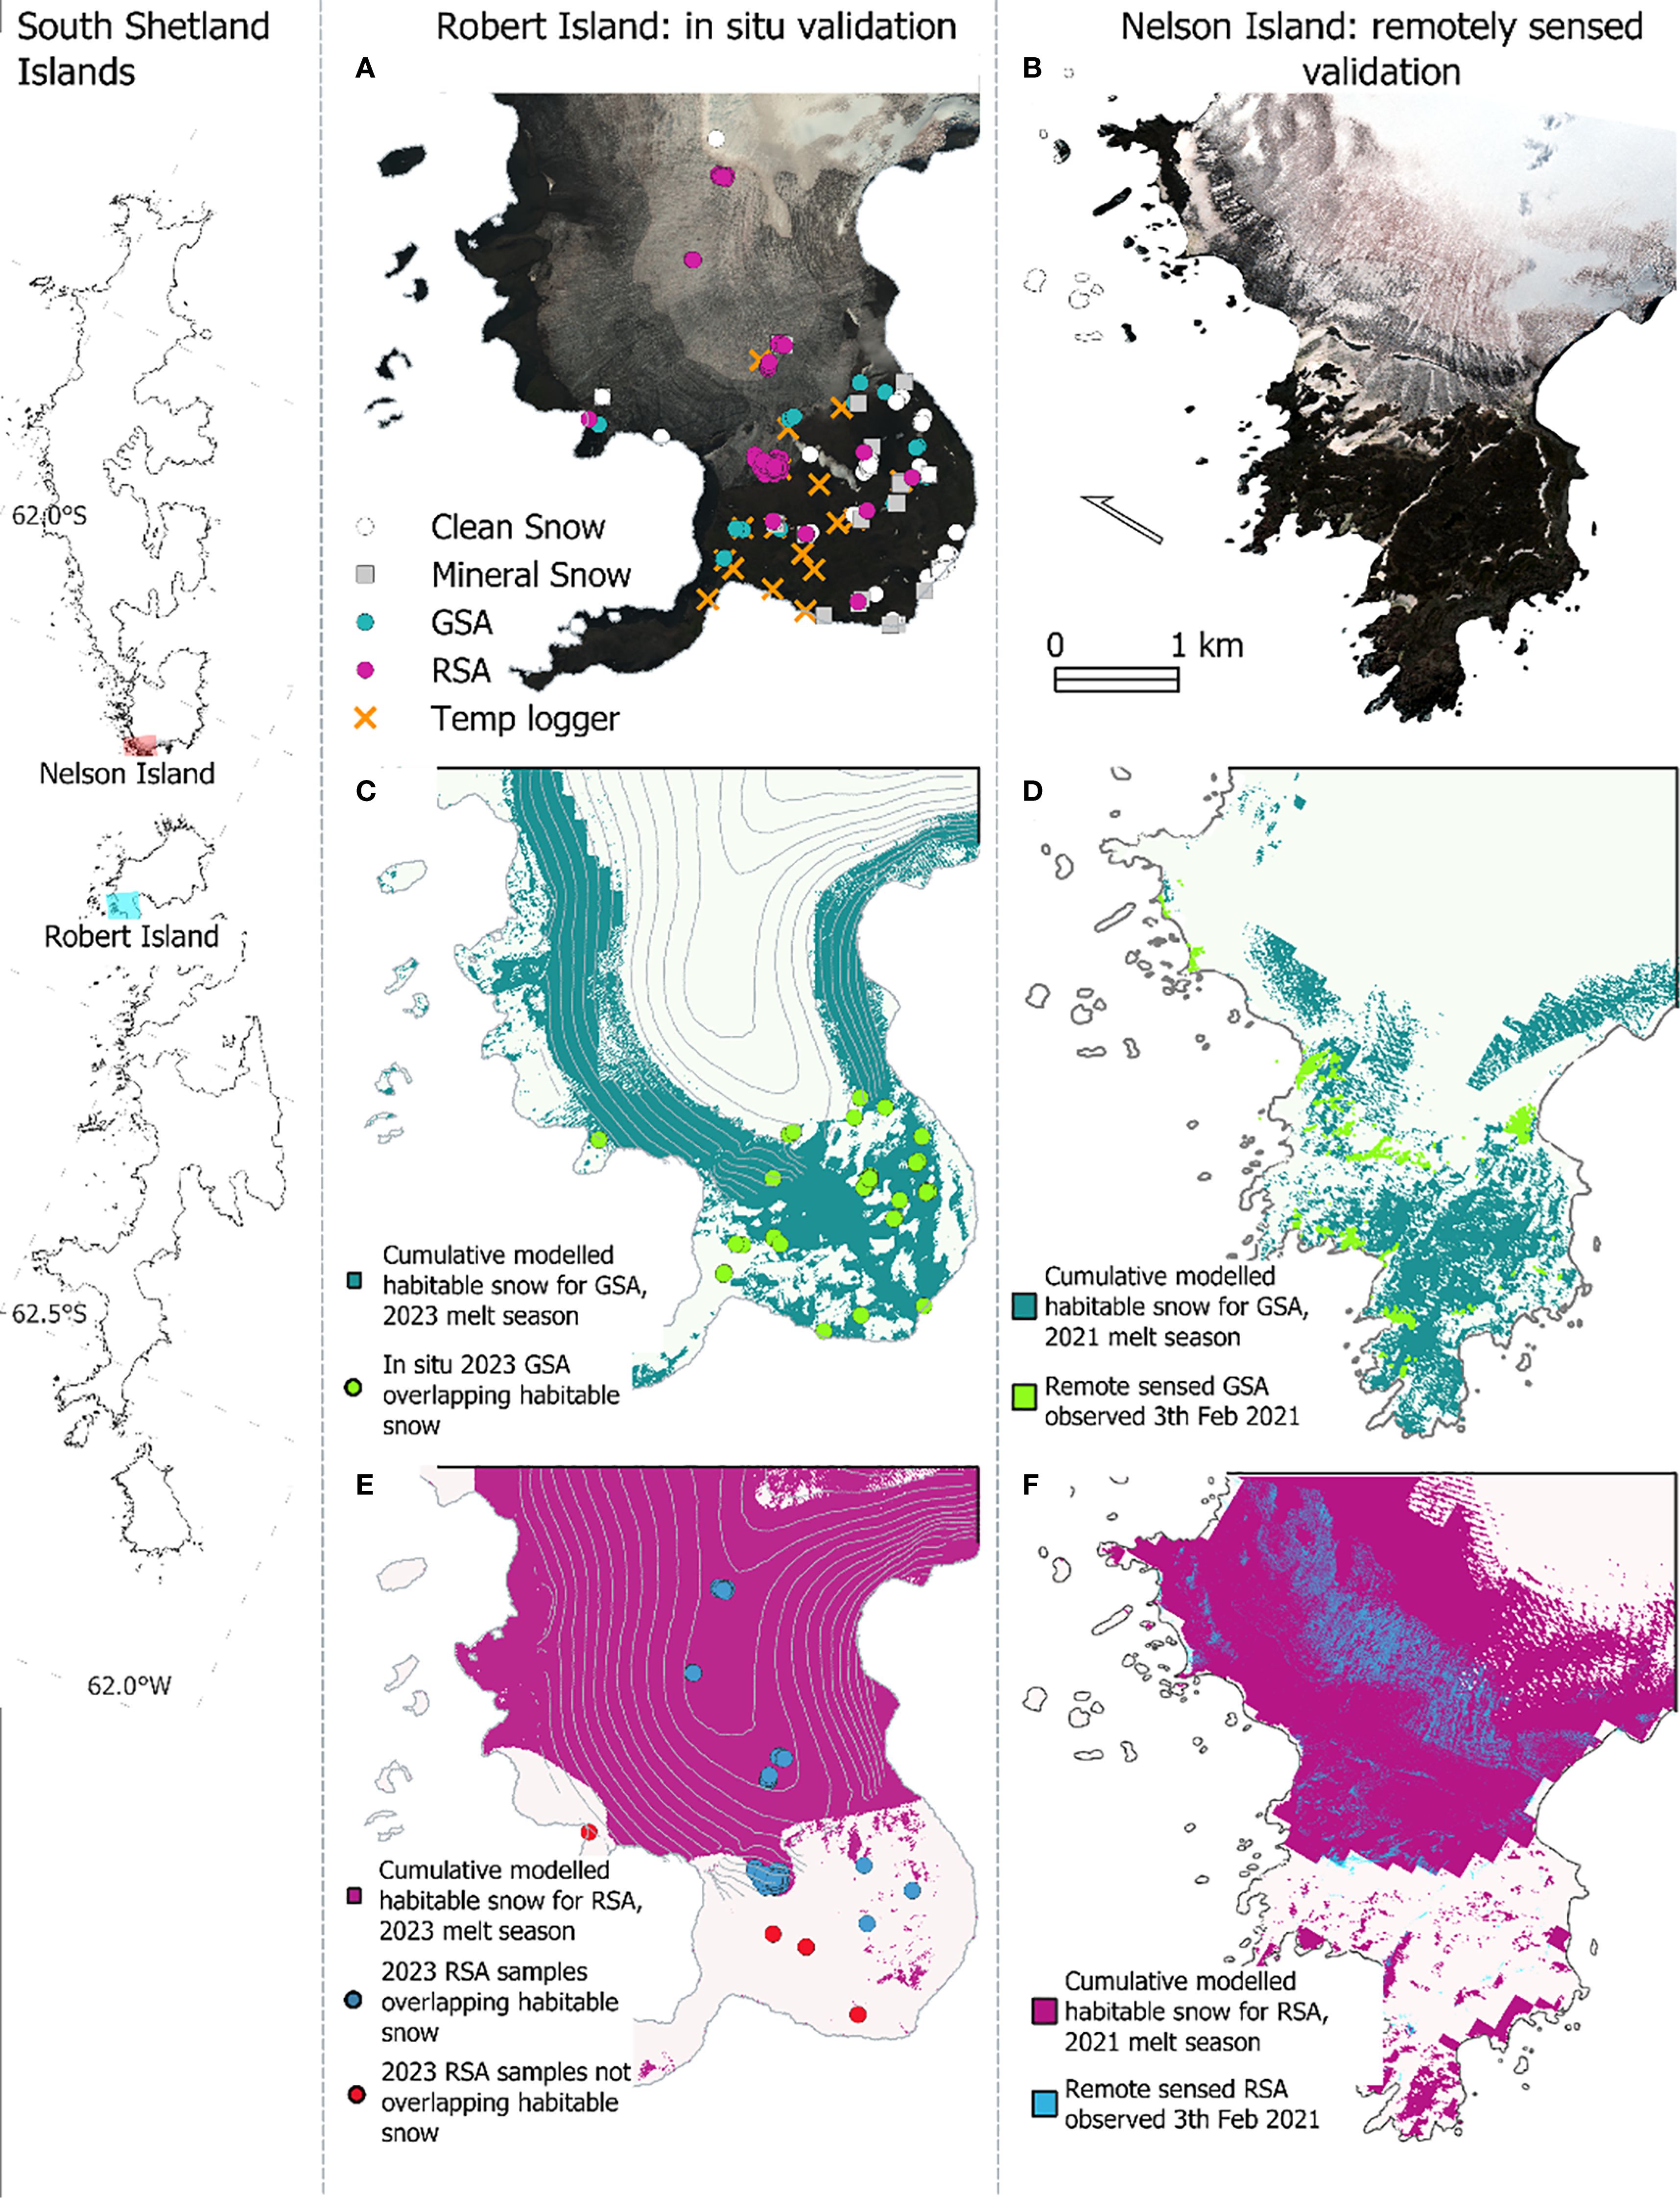
Figure 3. Model evaluation. (A) True color WorldView image of the Coppermine Peninsula region of Robert Island from 6th February 2023. Circles show the GPS sampling locations of in situ blooms, January and February 2023. (B) True color WorldView image of the Harmony Point region of Nelson Island from 3rd February 2021. (C, E) show cumulative modelled habitable snow for green snow algae (GSA) and red snow algae (RSA) on Robert Island. Points show the location of in situ observations of GSA (C) or RSA (E), color coded based on agreement with the BART model. (D, F) show observed GSA and RSA on 3rd February 2021 as well as cumulative modelled habitable snow between 1st November 2020 and 3rd February 2021. Remote sensed blooms are shown by overlain GSA (bright green pixels) and RSA (blue pixels) to allow comparison of modelled and observed blooms. Inset shows the South Shetland Islands, with the extent of a, c, and e shown in blue and b, d and f shown in red.
Pixels for each class, GSA, RSA and snow with no visible algal presence, were randomly chosen from each image to use as training data within the model. For each image, about 1% of the classified pixels were used for training, with visual inspection removing obviously misclassified pixels. The final per-image pixel counts are shown in Table 1. In total, 1777 pixels containing GSA, 1273 pixels containing RSA, and 1226 containing clean snow were used to train the BART model.
2.2 Assembly of predictor variables
Seven variables (summarized within Table 2) were selected to describe habitable snow conditions using the BART model. Principal component analysis (PCA) (RStudio (version 2022.02.3)) was used to ensure that predictor variables lacked collinearity across the training dataset (Supplementary Figure S1). The BART model was trained using 8 m resolution data at the locations shown in Figure 1, to more closely match the resolution of the remote sensed presence/absence data, and to maximize interpretation of microtopographic niches. Posterior predictive maps were produced at 100 m resolution for the Antarctic Peninsula, rather than 8 m resolution, due to the significant computational requirement. All predictors of snow algal blooms were processed as raster datasets and were derived as described below.
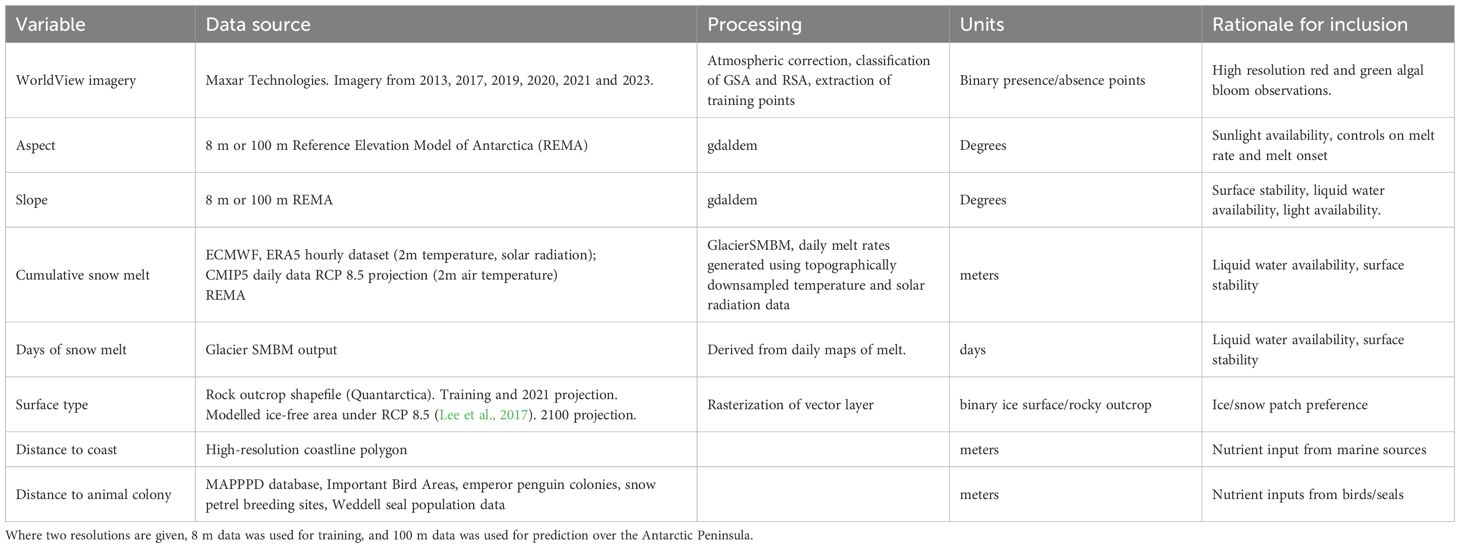
Table 2. Model components, data source, processing summary, units, and rationale for inclusion within the modelling framework.
2.2.1 Physical-based variables
The 8 m Elevation Model of Antarctica (REMA) (Howat et al., 2019) and 100 m gapless REMA (Dong et al., 2022) were used to derive slope (degrees) and aspect (degrees azimuth) variables using the gdaldem tool (GDAL version 3.4.3). Distance to the coast (in meters) was calculated from the high-resolution coastline polygon (Gerrish et al., 2020) included in the Quantarctica dataset (Matsuoka et al., 2018). Distance to animal colonies (in meters) was calculated using combined data from the Mapping Application for Penguin Populations and Projected Dynamics (MAPPPD) database (Humphries et al., 2017), Important Bird Areas (Harris et al., 2015; Matsuoka et al., 2018), Emperor penguin colonies (Fretwell and Trathan, 2021; Matsuoka et al., 2018), petrel breeding sites (Schwaller et al., 2018) and Weddell seal population data (LaRue et al., 2021). The surface type was a binary input, relating to whether a bloom occurred on permanent snow/ice or a seasonally snow-covered rocky outcrop or soil. For the 2021 model run, the rock outcrop map derived from Landsat 8 data was used to create an ice/rock vector layer (Burton-Johnson et al., 2016). For the 2100 run, modelled ice-free areas from Lee et al. (2017) under RCP 8.5 climate predictions (Lopez, 2016) were used.
2.2.2 Snow melt model variables – climate data and GlacierSMBM model
In trial model runs (data not shown), unprocessed air temperature or solar radiation variables were used, but were too spatially coarse to have predictive power in the complex mountainous terrain of the Antarctic Peninsula. We therefore include snow melt parameters in our model, using downsampled, high resolution climate data, as snow melt directly influences liquid water availability and habitat stability for snow algae. Simplified snow melt modelling was undertaken using the GlacierSMBM R package (Groos et al., 2017). This uses daily temperature (°C) and net radiation (W m-2) data as factors within a degree day model to estimate the daily melt of snow and/or ice on a per-pixel basis. Note that we were unable to predict the melt-out and disappearance of snow patches, as initial snow depth and accumulation data were not available for the region at high enough resolution. Instead, we aimed to improve the predictive value of the climate variables within the BART model by enhancing their resolution and interpreting their effects upon physical processes within the snowpack.
Daily mean 2 m air temperature and net solar radiation data were generated from the fifth generation ECMWF atmospheric reanalysis of the global climate (ERA5) hourly dataset in 0.5 x 0.25 degrees resolution (Hersbach et al., 2020) for 2013, 2017, 2019, 2020, 2021 and 2023, to correspond to the WorldView image dates. For the 2100 analysis, 2 m air temperature data from the CMIP5 daily data on single levels (Lopez, 2016) were used (RCP 8.5 warming scenario; HadGEM2-CC UK Met Office model, 1.875 x 1.25 degrees resolution).
Over the area used for training, temperature data were downsampled from their native resolution using the SAGA Lapse Rate Based Temperature Downscaling tool (SAGA v8.5.1). The 8 m Elevation Model of Antarctica (REMA) (Howat et al., 2019) was used as an elevation layer for down-sampling in the training datasets, whereas the 100 m REMA dataset was used for the Peninsula-scale posterior analysis. Lapse rates were either set as 0.68 °C per 100 m (Martin and Peel, 1978) or, in the case of Robert Island and Nelson Island images (see Figure 1A for locations), set as 0.8 °C per 100 m, calculated using Hobo MX2202 loggers installed across Coppermine Peninsula on Robert Island, from 2 m elevation to 130 m elevation, during the 2023 austral summer season (see Figure 3A for locations).
Solar radiation was used over global radiation to simplify downsampling, as shortwave radiation is more affected by topographic shading effects (Robledano et al., 2022). Net solar radiation data were downsampled using a sky view factor, generated using the 8 m or 100 m elevation models in SAGA. The sky view factor is a measure of terrain shading and was used to improve the model’s ability to simulate melt within topographic microclimates such as nival hollows and meltwater channels. Net solar radiation from 2021 was used in both 2021 and 2100 melt model runs, due to high uncertainty in future cloud cover and albedo conditions.
The Glacier SMBM melt model was run in RStudio on a daily interval at 8 m resolution from the 1st November (preceding the image date) up until the time of the WorldView image used for training. In the case of modelling melt across the Antarctic Peninsula for posterior analysis, this point was set to 21st January 2021 or 2100, which reflects austral mid-summer, and the model was run at 100 m resolution. The model outputs daily snow melt in meters, which was aggregated into a sum of melt for the “cumulative snow melt” predictor. The number of days where melt occurred in the snowpack on a per-pixel basis was aggregated into the “days of snow melt” predictor.
2.3 BART model processing
To build the training dataset, WorldView training pixels were converted into point data and used to sample each predictor variable raster layer. Cumulative snow melt and days of snow melt variables were specific to each image. For Robert Island and Ryder Bay imagery, this meant being mapped over the same location but using climate data corresponding to the date of each image. Sampled points were combined and exported as a table for input into our model. BART was run in RStudio using the embarcadero package (Carlson, 2020), a workflow wrapper for using BART for species distribution modelling. BART models were run using 200 trees and 1000 Markov Chain Monte Carlo (MCMC) iterations. Posterior model projections were mapped at 100 m resolution for the Antarctic Peninsula, using 2021 and 2100 temperature data as the basis of the snow melt variables in the raster stack used for prediction. The true skill statistics (TSS) and the area under the receiver operating characteristic curve (AUC) were used to assess model performance (Allouche et al., 2006). 95% credible intervals, i.e. the range over which a value has 95% probability were also produced using embarcadero and used to assess predictor and model performance. Binary maps of habitable snow were created using a threshold value based upon the maximum true skill statistic values (see Supplementary Figure S2). These values were 0.29 probability for GSA and 0.39 probability for RSA. Partial response curves for each predictor variable were constructed by running the model for a single variable whilst holding the other variables at their mean values.
We evaluated the model using three separate datasets. First, we ran model inference on a raster stack of training variables for Robert Island to produce a map of modelled habitable area that coincided with fieldwork conducted in 2023, then we compared this to the in situ sample locations for GSA and RSA taken between January and February 2023 (see Figures 3A, C, E). Secondly, we used remote-sensed locations of red and green blooms from within a WorldView image that wasn’t used for training the model (Harmony Point, Nelson Island; see Table 1 and Figure 3 for details). Here, a confusion matrix was applied using 1000 randomly chosen GSA, RSA, and clean snow pixels within the WorldView image and assessed against modelled habitable area using Cohen’s Kappa coefficient. Finally, we assessed the map of 2021, Peninsula-scale GSA habitat suitability by testing cooccurrence of modelled habitable areas with remote sensed GSA locations, observed within 2021 Sentinel 2 imagery taken from Walshaw et al. (2024). There is no commensurate RSA dataset available for Peninsula-scale RSA validation.
3 Results
3.1 Remote-sensed training data
There was substantial agreement between remote-sensed bloom locations and in situ GPS measurements taken on Robert Island in 2023 (GSA: κ = 0.78; RSA: κ = 0.73). Combined, the maximum total area of GSA and RSA identified within the WorldView images (excluding overlapped regions) was 3.4 km². The overlapped regions in the training imagery, both on Robert Island and in Ryder Bay, had marked differences in bloom area between different years and at different stages of the growth season (see Table 1). Robert Island, for example, had substantially more RSA coverage on 6th February 2023 (0.95 km²) compared to 16th March 2019 (0.11 km²) and 13th March 2013 (0.07 km²), despite the earlier timing of the image.
3.2 Model evaluation
The BART model performed well at predicting habitable snow for GSA and RSA across the Antarctic Peninsula. The true skill statistics (TSS) and the area under the receiver operating characteristic curve (AUC) values were high (i.e close to 1) and similar between GSA (TSS = 0.80; AUC = 0.96) and RSA (TSS = 0.84; AUC = 0.98) model runs, indicating good overall predictive accuracy with both sets of training data. Model performance is summarized in Supplementary Figure S2. Binary habitat suitability maps, where the mapped probability was above the model’s maximum TSS value, had good agreement with validation datasets. Comparing to in situ bloom GPS positions on Robert Island in 2023, all observed green snow algae (n = 57) were within the predicted areas habitable for GSA (Figure 3C), whereas 91% of in situ RSA observations (n = 140) were within areas predicted habitable for RSA (Figure 3E). Similarly, there was good agreement between modelled habitat suitability and remote-sensed GSA or RSA observations, respectively, Kappa scores of 0.76 and 0.75 (n = 1000) were observed for the Nelson Island WorldView validation image (Figures 3B, D, F). For the spatially coarser 2021 Peninsula-scale habitat suitability maps, 76% of remote sensed GSA blooms (n = 784) (Walshaw et al., 2024) were within areas indicated as habitable by the BART model.
The modelled extent of habitable snow was larger than the extent of the remote-detected algal blooms (Figures 3D, F). This was expected, first as the model does not capture all the environmental parameters determining algal bloom formation, and second as the model output is aggregated for the 2021 summer season whereas the remote sensed blooms are a snapshot from 3rd February 2021. Crucially, the upper elevation range of modelled habitable snow was similar to that over which blooms were observed and so the model captured the environmental envelope where snow was melting, enabling blooms to form.
3.3 Predictor variable importance
Figure 4 shows the predictor variable partial response curves, visualizing their relative contribution to the model across the range of values used for each predictor in training. Higher 95% credible intervals for distance to the coast, distance to animal colonies, and slope variables towards the extreme ends of their ranges are a result of low sample density there. Otherwise, the 95% credible interval was low (< 0.2) across the range of values observed within the training dataset. Except for the distance to coast and distance to animal colony predictors, the ranges in Figure 4 reflect the range of values observed within the Peninsula-scale posterior analysis. However, the flattening out of the relationship between occurrence and these two variables, also shown in Figure 4, shows that the training data captured the full extent of variation. This indicates that the scope of the model is suitable for predicting probabilities across this larger spatial extent. Figure 4 also shows the relative importance of each variable, with days of snow melt and aspect identified as the most important predictors for both GSA and RSA blooms.
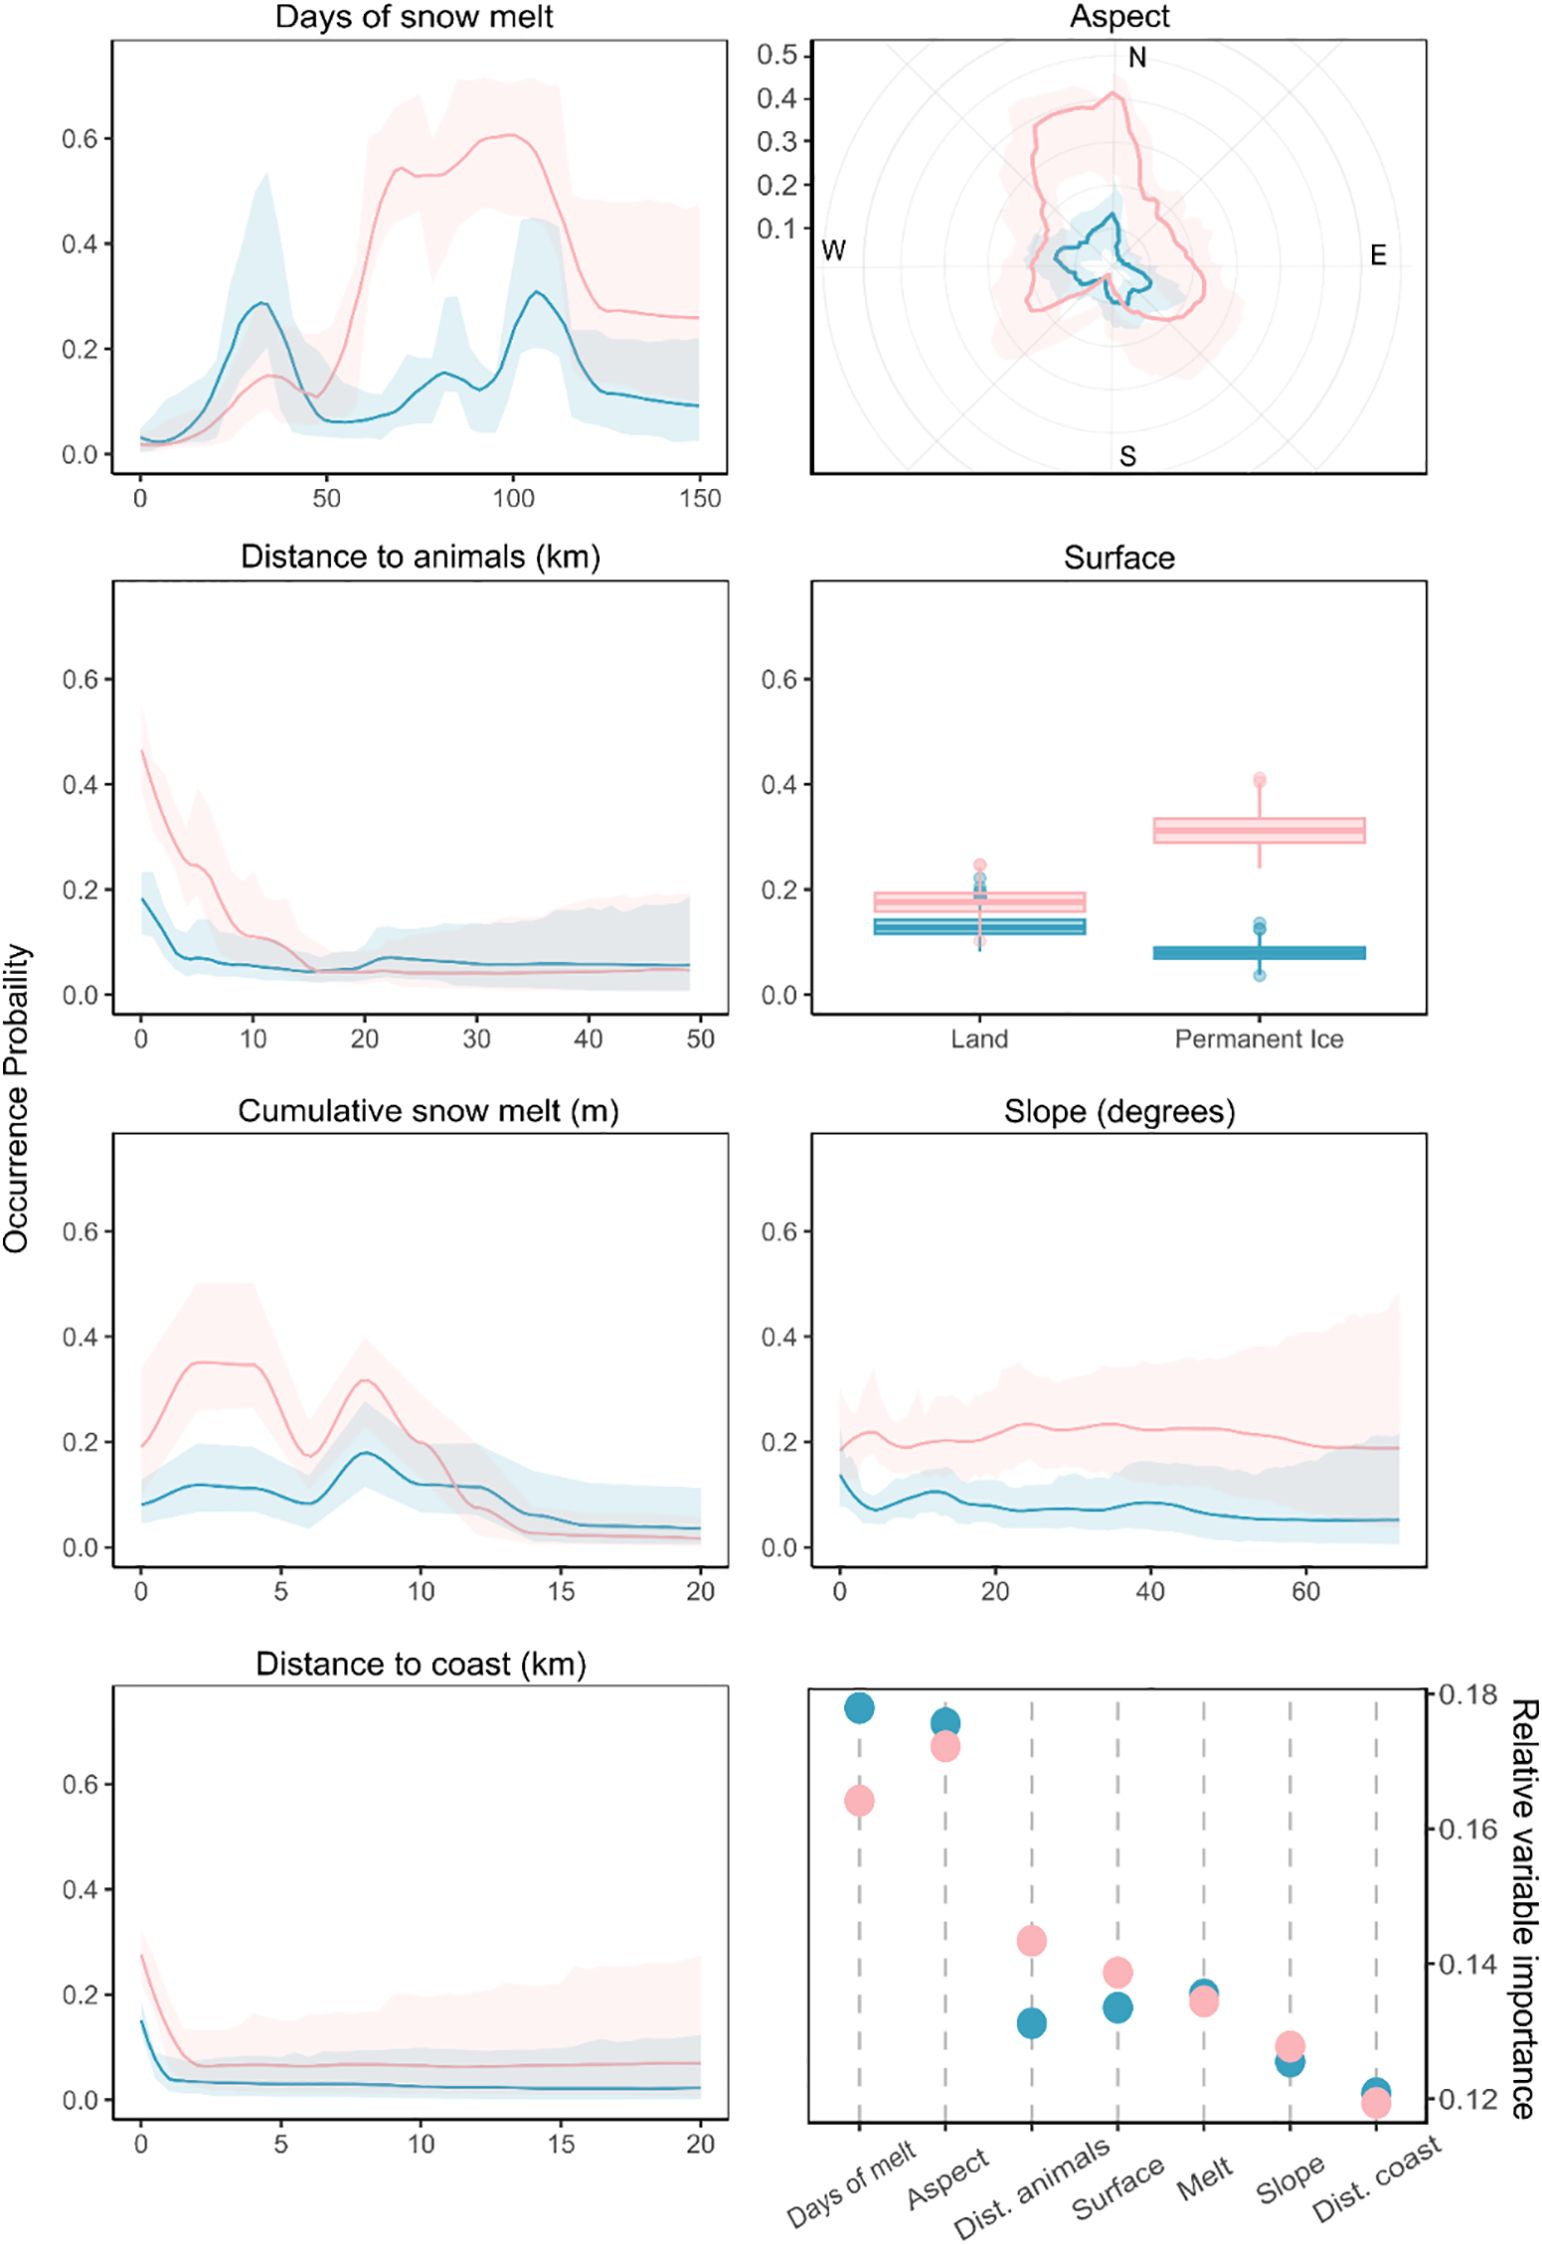
Figure 4. Partial response curves for the environmental variables used within the BART model. Individual predictor responses illustrate the shape of the relationship between the probability of occurrence and each environmental predictor for the green snow algae (GSA - light blue) and red snow algae (RSA - pink) model runs. Shaded area shows the 95% credible interval. Also shown, bottom right, is the relative predictive importance of the different environmental variables used within the BART model, shown for GSA and RSA.
3.4 Antarctic Peninsula-scale mapping of habitable snow
Based on 2021 climate conditions, habitable snow for GSA (Figures 5B, C) and RSA (Figures 5F, G) was distributed across much of the coastal regions of the western and north-eastern Antarctic Peninsula, as well as the South Shetland Islands and South Orkney Islands. The 95% credible intervals for GSA and RSA are shown in Figures 5A, E, respectively, and were generally low (95% credible interval < 0.5) across most of the Peninsula (mean 95% CI: 0.51 GSA; 0.46 RSA), though uncertainty was greater (> 0.8) across the Larsen ice shelf on the east of the Peninsula, and the Wordie, George VI, Wilkins, Bach, and Stange ice shelves towards the south-west of the Peninsula. Due to high uncertainty, and a lack of in situ observations of algal blooms on ice shelves, they were masked out of the area calculations shown in Figure 5 and discussed herein. Total habitable area under 2021 conditions was 479 km² for GSA and 1194 km² for RSA.
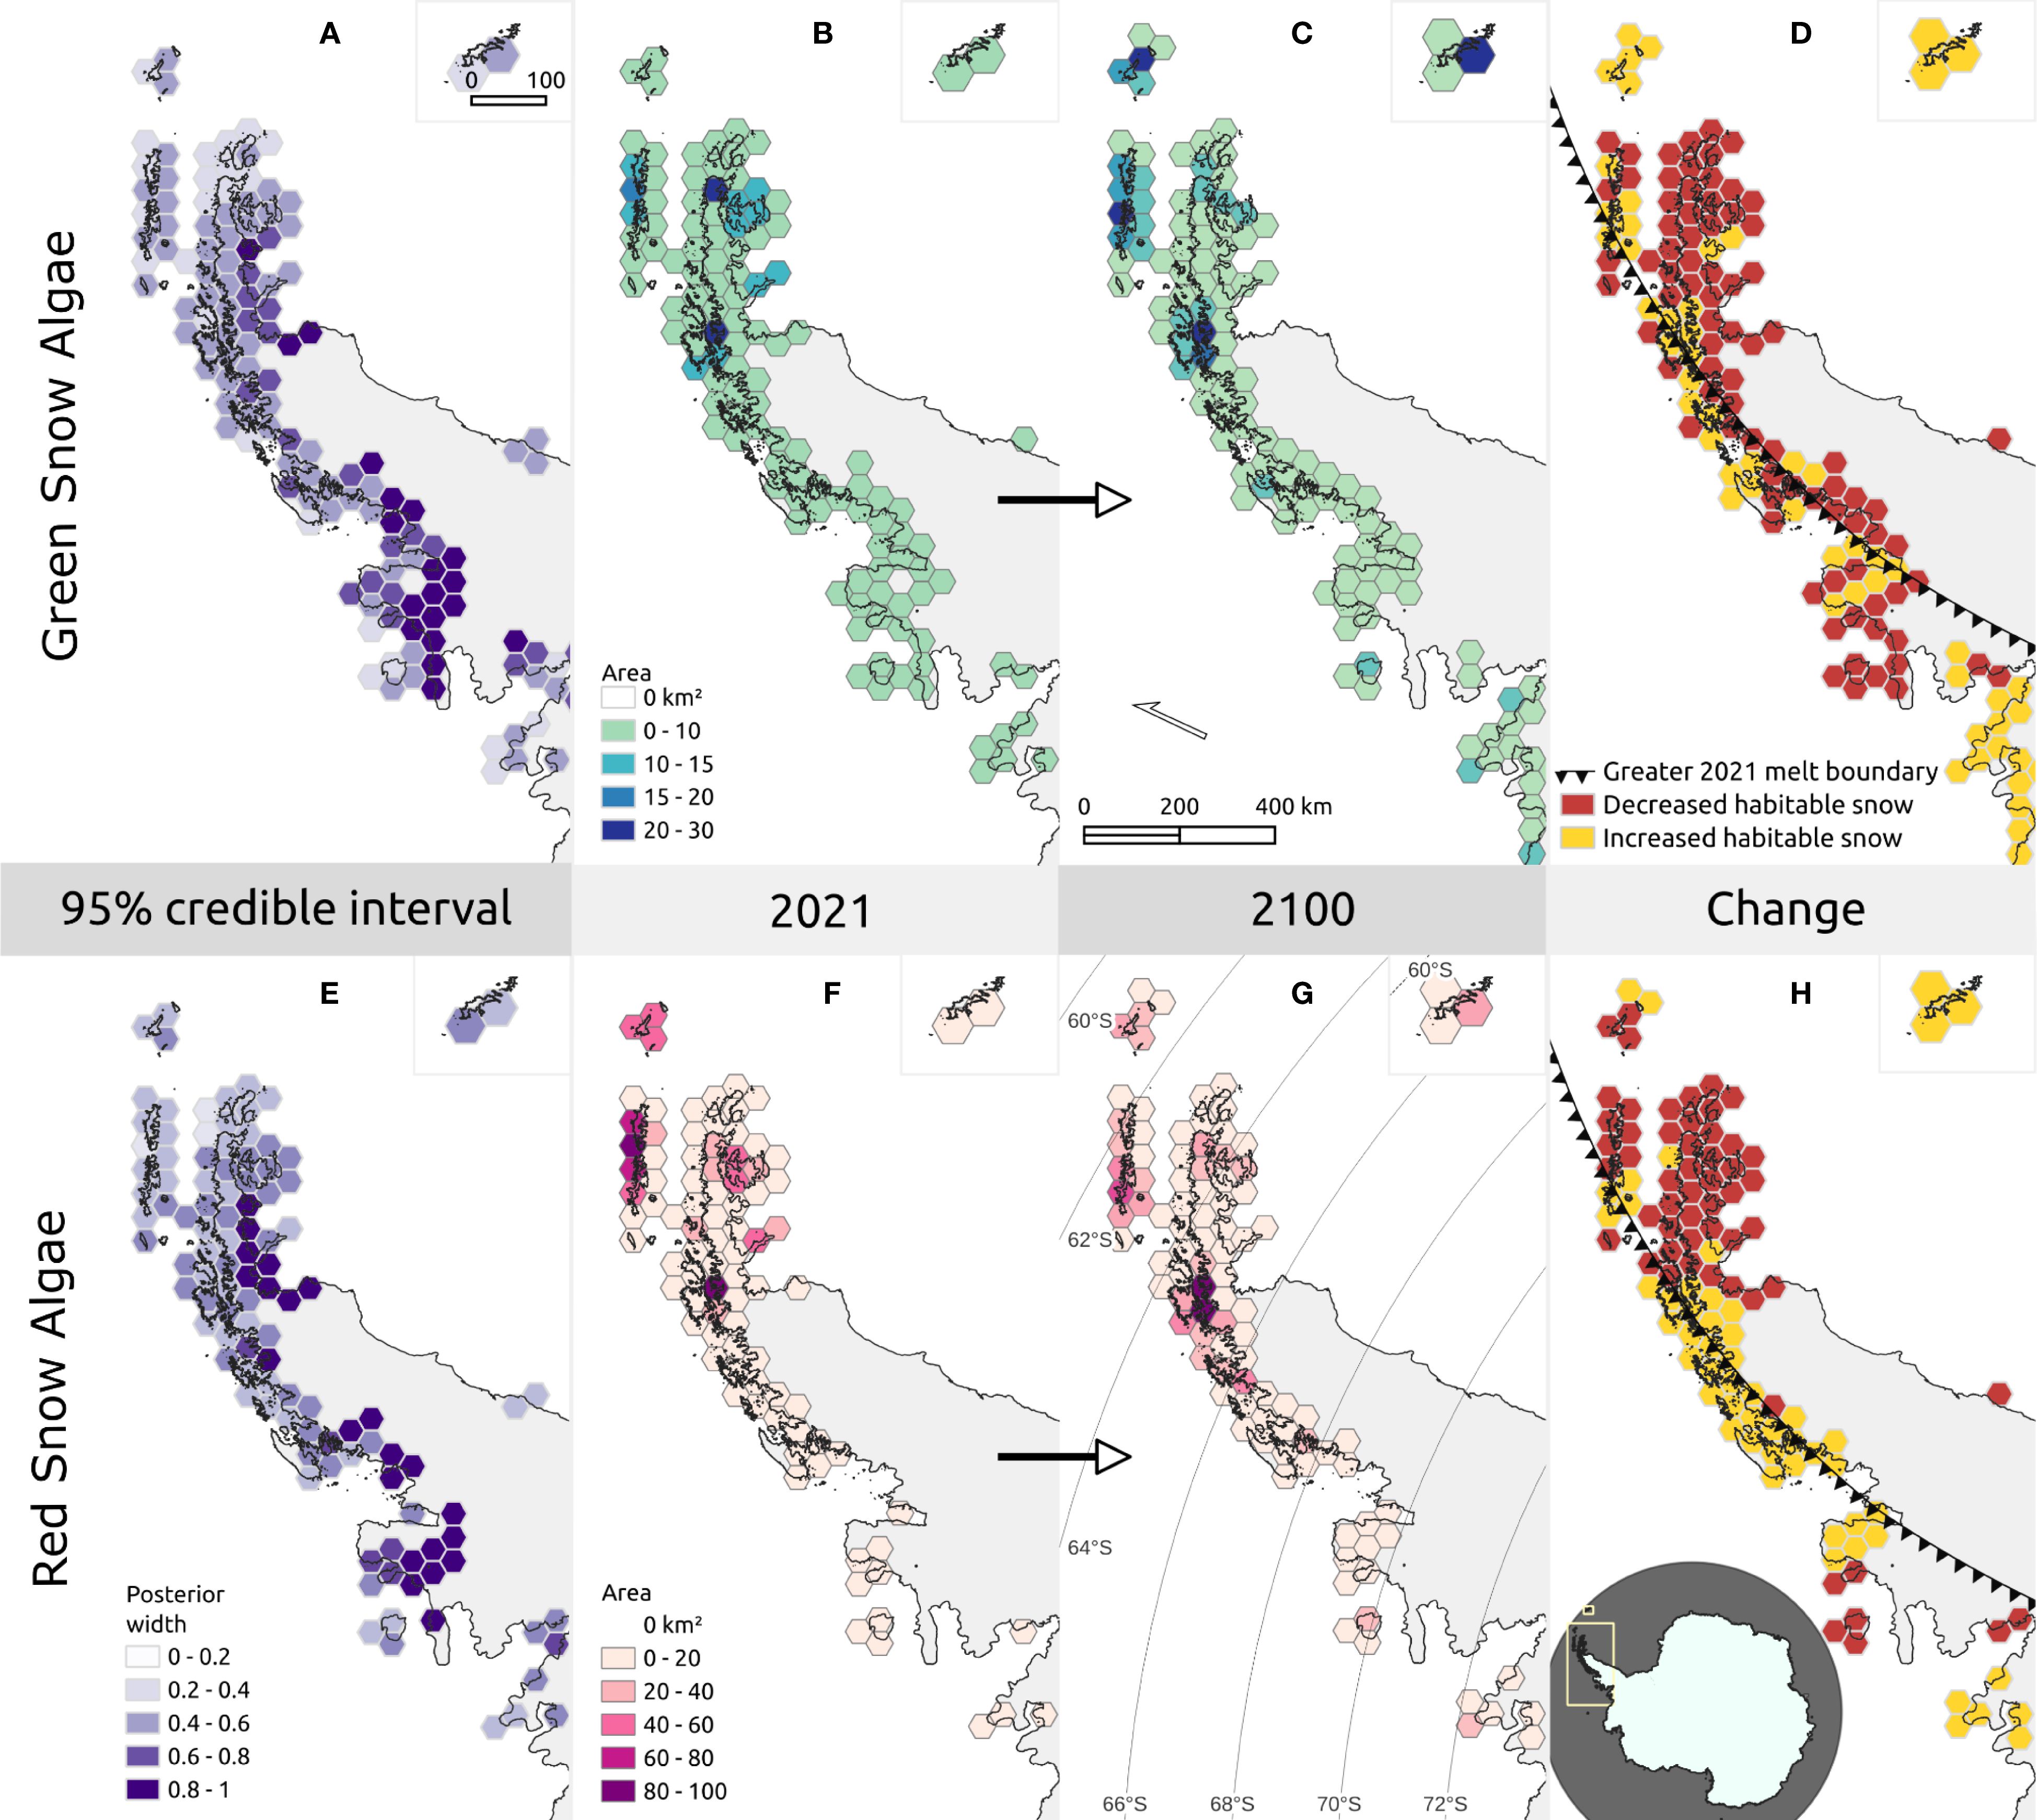
Figure 5. Habitable snow area changes across the Antarctic Peninsula. 50 km hexagonal grids showing the sum of area of habitable snow for green snow algae (GSA – (B, C)) and red snow algae (RSA – (F, G)) under 2021 (B, F) and predicted 2100 (C, G) climate conditions. Habitable area is cumulative from 1st November to 21st January (2021 or 2100). Maps (A) and (E) show the length of the 95% credible interval for areas that meet the models’ threshold criteria. Maps (D) and (H) show whether habitable area increased or decreased between 2021 and 2100 within each 50 km grid cell. The triangle marker line is the boundary of greater melt in 2021 than in 2100, where melt was greater to the east of the line and less to the west. Map insets are of the South Orkney Islands and are a different scale (also depicting a 50 km hexagonal grid). The map overview in h shows the extent of the main map views of the Antarctic Peninsula and of the South Orkney Islands inset in yellow.
The overall distribution trend across latitudes was similar in 2100 and 2021 for both GSA and RSA (Figures 5C, G), though a greater number of habitable areas were evident towards the south of the Peninsula in 2100. This was particularly true of RSA, which showed an increase in habitable area between 66°S and 70°S in 2100 versus 2021. Despite these trends, total habitable area for the Peninsula was smaller in the 2100 analysis than in 2021, with GSA predicted across 423 km² and RSA predicted across 924 km² in 2100. This is evident in Figures 5D, H, which show decreased habitable area concentrated in the north of the Peninsula. However, these findings should be viewed in the context of a strong, positive, temperature anomaly during the 2021 melt season, centered north-east of the Peninsula (Clem et al., 2022) which caused greater melt in some regions of the Peninsula in 2021 than predicted for 2100. The marker line in Figures 5D, H show the boundary between regions experiencing greater (east of the line) or lesser (west of the line) melt. This anomaly resulted in a mixed picture of change in habitable areas across the Peninsula, and masked Peninsula-wide trends.
The 2021 density distributions of GSA and RSA by latitude (Figures 6A, D, respectively) show that most habitable snow was found north of 66°S, with presence becoming patchier further south. However, the model predicted habitable snow for both GSA and RSA as far as 73°S, close to the 74°S extent of the analysis. Figures 6B, C (GSA) and 6e and 6f (RSA) also show a tendency for habitable areas to decrease in elevation and patch size at higher latitudes. The drop in habitable area density seen south of 66°S (Figure 6A) is accompanied by significantly lower lying (t(6421) = 15.3, p < 0.01) and smaller (t(6421) = 1.8, p = 0.07) patches of habitable snow, with the decreasing trend continuing from 66°S to 74°S. Most habitable area was at low elevation, with 54% occupying snow less than 50 m elevation. Smaller patches were picked out at higher elevations, particularly at around 64°S where there is a lot of higher elevation land adjacent to the ocean (e.g., Anvers Island, Brabant Island and mountainous terrain on the Danco Coast). The higher elevations shown in Figures 6B, E exceed field observations of bloom elevations in Antarctica, though not elsewhere (e.g., Onuma et al., 2022; Vimercati et al., 2019), but are predominantly (60%) one or two isolated pixels, indicative of model noise. RSA habitable areas (Figure 6F) were significantly higher (97 versus 48 m; t(6421) = 4.6, p < 0.01) and larger (0.038 versus 0.037 km2 t(6421) = 5.6, p < 0.01) than GSA (Figure 6C).
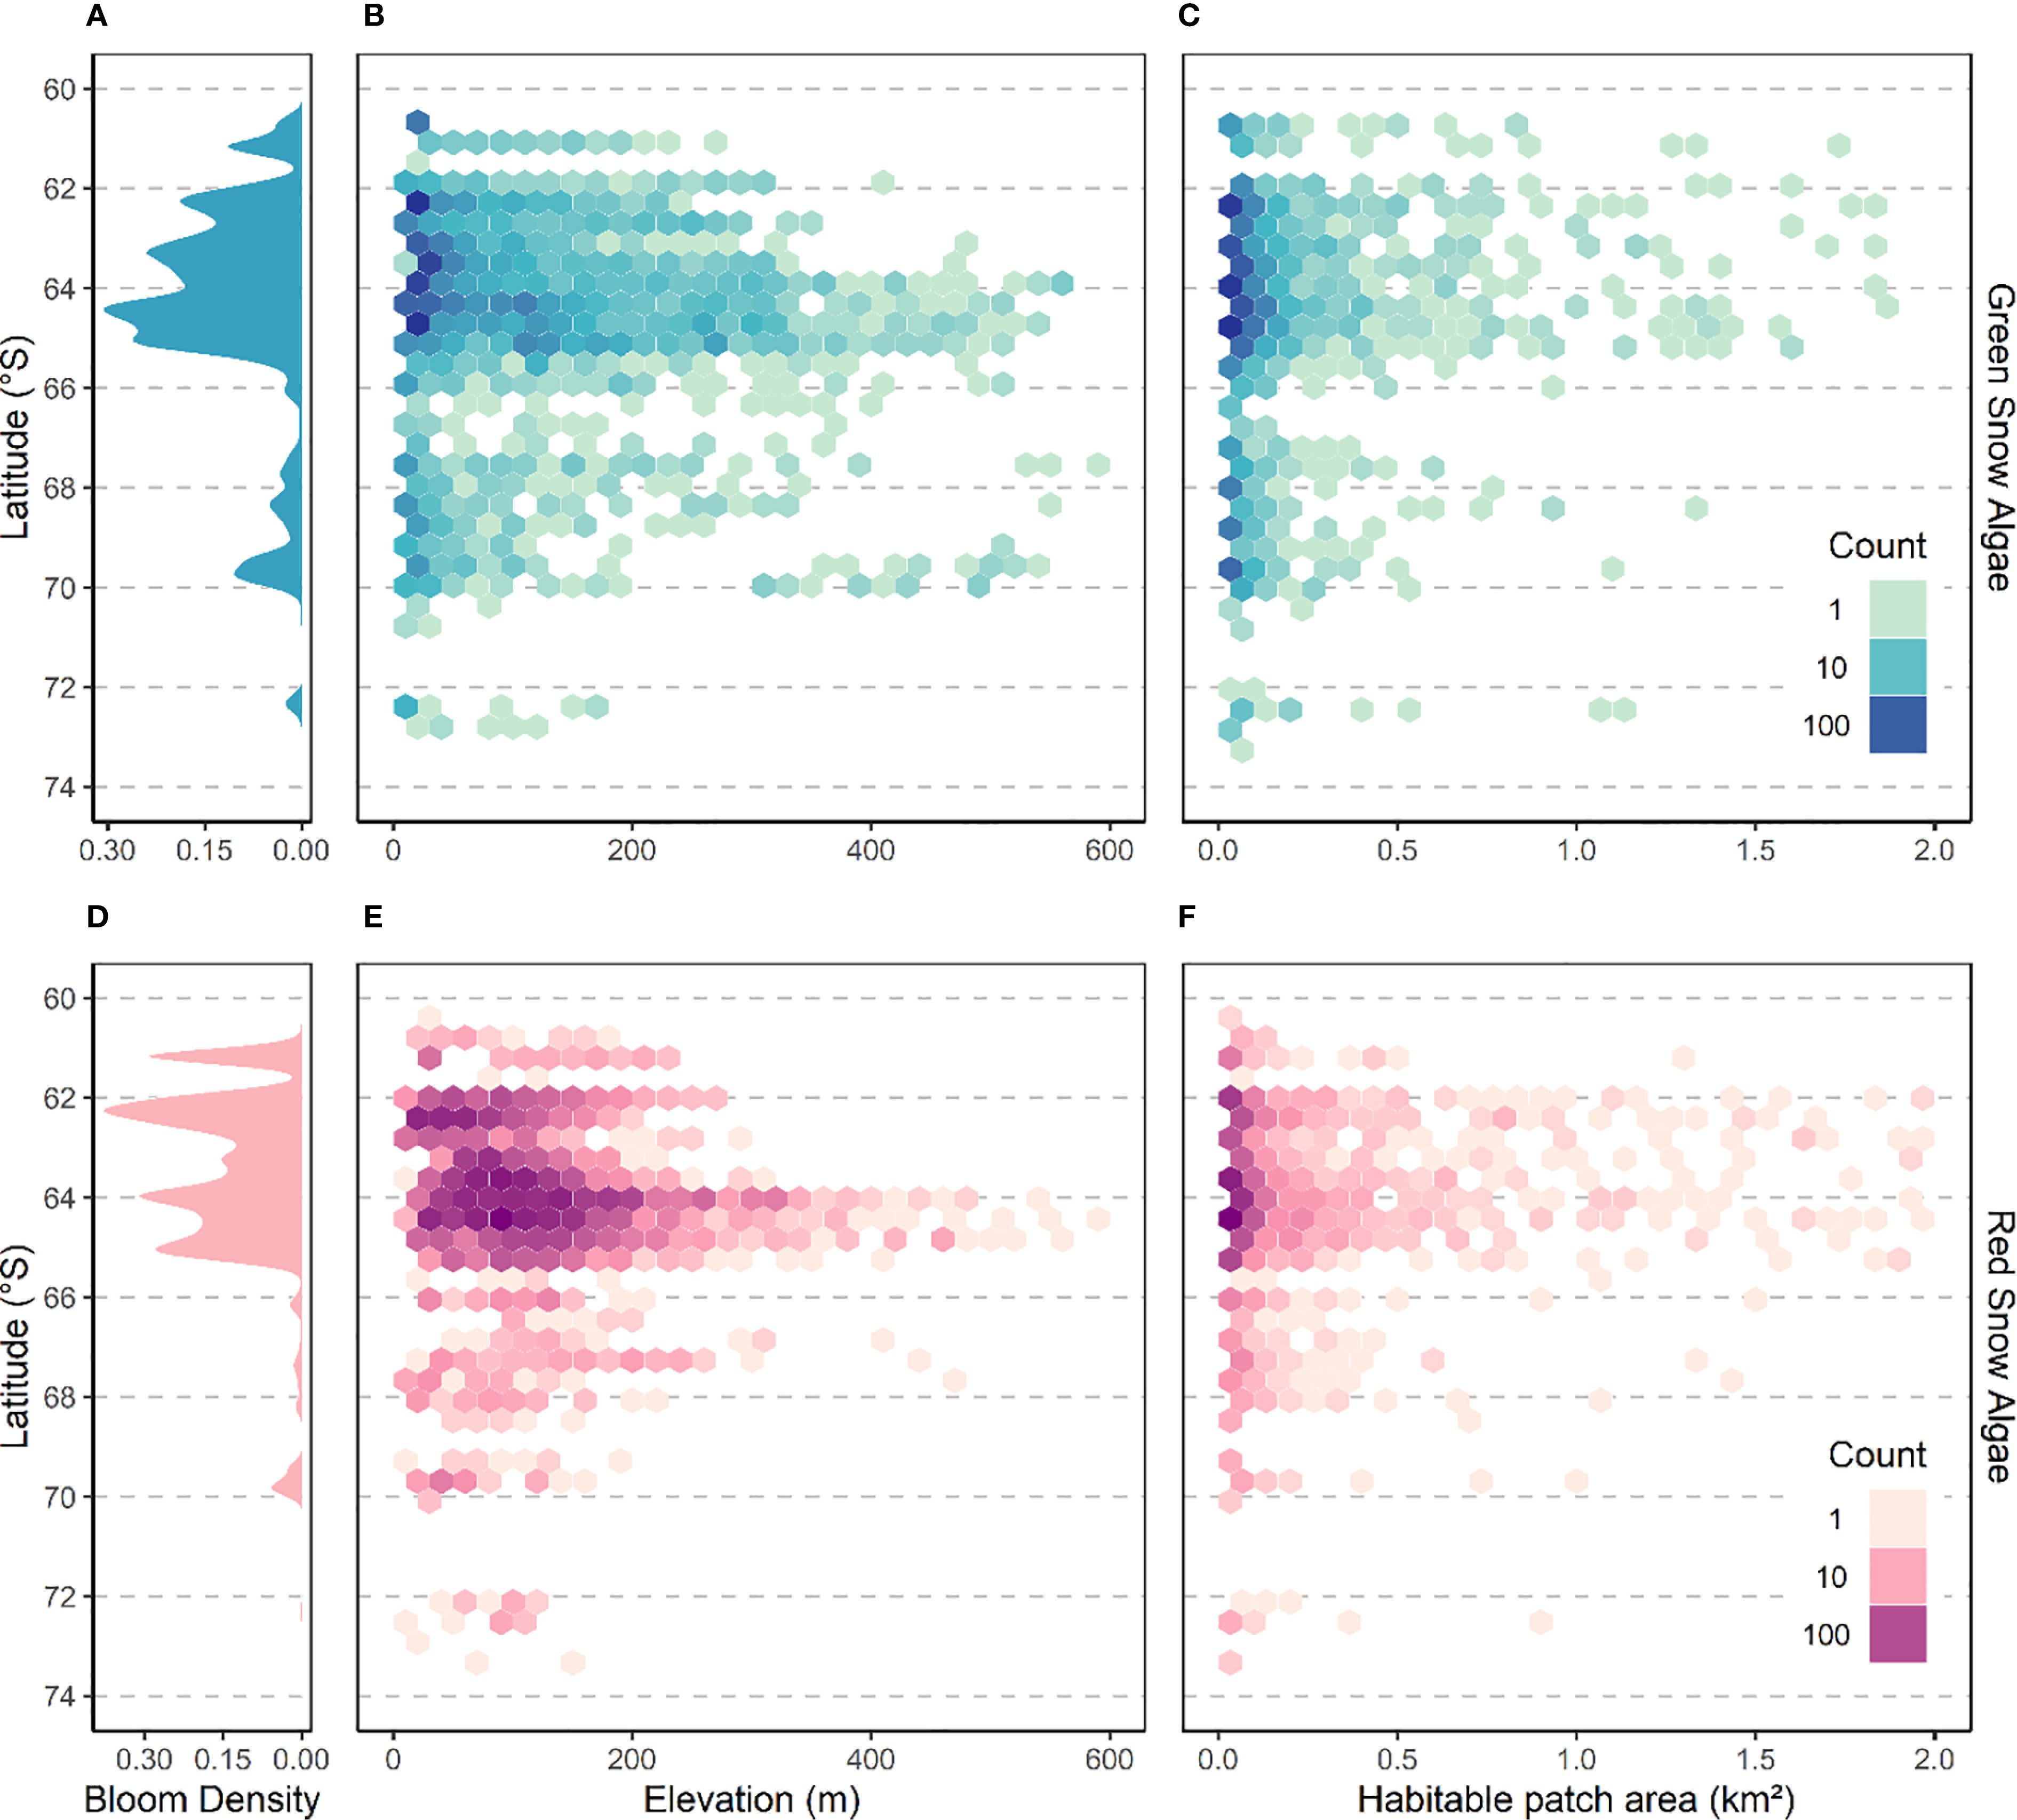
Figure 6. Latitude ((A) GSA, (D) RSA), elevation ((B) GSA, (E) RSA) and habitable patch (a contiguous habitable area) area ((C) GSA, (F) RSA) distribution of habitable areas for all blooms on the Antarctic Peninsula under 2021 conditions between 1st November and 21st January. Plots a and d show the latitudinal probability density distribution of pixels determined as habitable from model threshold values. Plots (B, E) show 2-dimensional density distribution of the elevation of each habitable pixel versus latitude. Plots c and f show 2-dimensional density distribution of the area of individual patches of habitable snow.
To examine the influence of warming in context of the 2021 temperature anomaly, we focused our analysis on modelled habitable areas that were predicted to be warmer in 2100 than in 2021. Total area increased with warming for both GSA (270 km² versus 217 km²) and RSA (711 km² versus 367 km²). However, there was no significant increase in the area of individual habitable patches of snow (GSA: t(8378) = 0.20, p = 0.84; RSA: t(9267) = 1.1, p = 0.27), indicating that total area increased as a result of a greater number of regions along the Antarctic Peninsula becoming habitable for snow algae.
Blooms also increased in elevation within warmed areas of the Antarctic Peninsula in 2100. Average elevation was significantly higher, GSA rising from 43 m to 57 m (t(8378) = -13.50, p < 0.01) and RSA from 50 m to 70 m (t(9267) = -7.91, p < 0.01). Similar patch sizes between 2100 and 2021 indicate that this change resulted from a shift in range rather than an expansion of patch area. Snow at higher elevations became more habitable as more and longer melt occurred there, at the same time as blooms at lower elevations became less prevalent. In the case of islands that experienced warming, the model predicted GSA to decrease in area on 70% of them (n = 559) and disappear from 43%, and RSA to decrease in area on 40% of them and disappear from 20%. This loss was compounded on small and low-lying islands, with GSA and RSA decreasing 69% and 42%, respectively, for islands less than 5 km², and 87% and 64%, respectively, on islands lower than 50 m in elevation. This range shift is illustrated in Figure 7, which shows an area of islands south of Anvers Island (64.8°S to 65.1°S) and the change in distribution of GSA and RSA between 2021 and 2100.
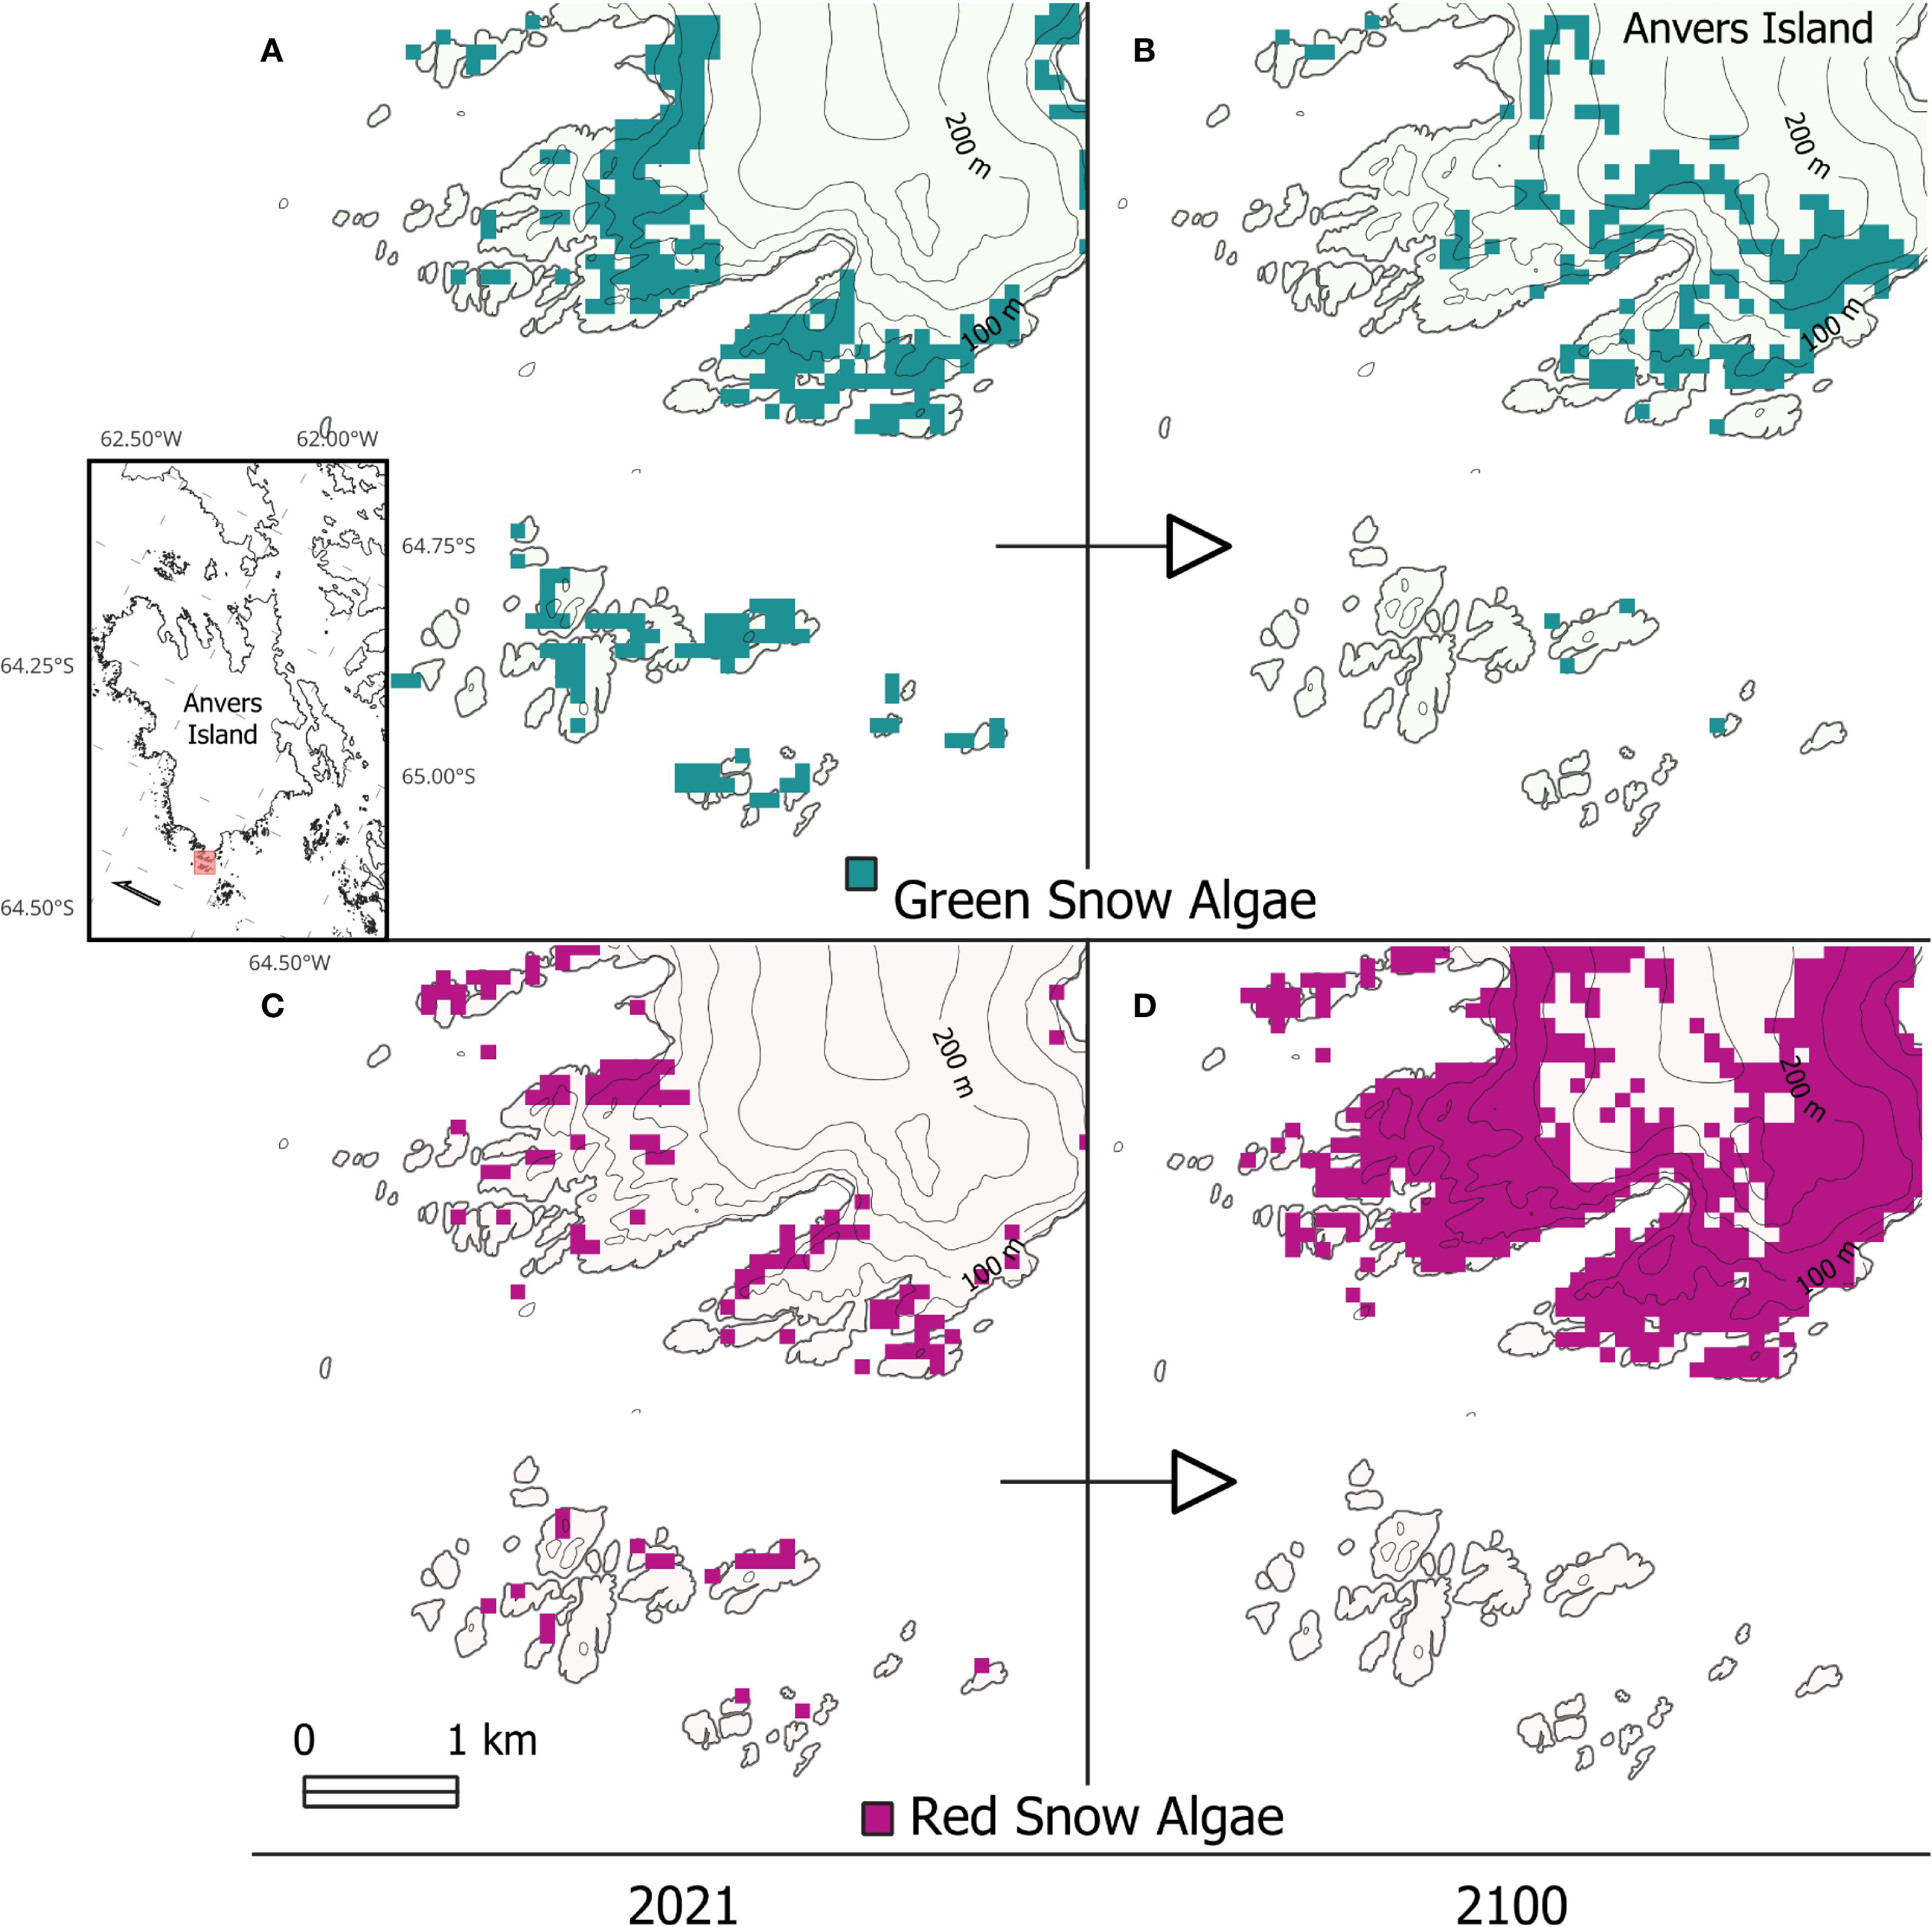
Figure 7. A close-up view of the vicinity of Anvers Island showing habitable snow for GSA (A, B) and RSA (C, D), for model runs using 2021 (A, C) and 2100 (B, D) conditions. Contours show 50 m intervals. Inset shows Anvers Island, with the extent of (A–D). shown in red.
4 Discussion
4.1 The ecological niche of Antarctic snow algae
We have included a wide range of physical variables in a habitat suitability model and compared those variables against a large dataset of snow algal bloom observations, collected over multiple years. Through this, we have been able to generate output response curves for predictor variables that offer insight into the habitat characteristics and ecological processes that govern the occurrence of seasonal snow algal blooms across the Antarctic Peninsula, the South Shetland Islands and South Orkney Islands. This work is the first landscape scale model to explore the mechanisms that influence the distribution of Antarctica’s unique red and green snow algal ecosystems, as well as to map their potential future changes.
Days of snow melt was identified as an important predictor variable for both GSA and RSA (Figure 4). The influence of longer periods of snow melt, in particular for RSA, suggests the need for longer periods of melt and warm temperatures for blooms to develop. This has been noted previously, and likely relates to bloom requirements for time to grow and multiply, as well as time to undertake the processes of secondary carotenoid formation and encystment, which is potentially critical for year-on-year re-dispersal and seeding (Onuma et al., 2022; Soto et al., 2023). Melt reflected the intensity of warming, and therefore melt rate, within the snowpack. Modelling snow melt to derive total cumulative snow melt and days of snow melt predictors instead of using elevation, temperature, and solar radiation layers directly, provided the BART model with more directly relevant information with respect to conditions for algal growth. This was because the temperature within melting snow will not vary significantly from 0 °C, whereas the melt model allows quantification of the duration and intensity of melt. The response curves for cumulative snow melt and days of snow melt displayed an interesting interplay whereby habitable probability was reduced by higher amounts of melt, whereas a greater number of melt days was influential (Figure 4). This again suggests a scenario where lower daily melt over a longer period provides a more stable snow environment for blooms to develop and complete their life cycle (Soto et al., 2023).
Aspect was another important predictor for both GSA and RSA. The partial dependence plots (Figure 4) show that GSA had little preference for a specific aspect when other variables were set to their mean values, indicating interaction with other variables i.e. aspect may be interdependent with slope, or may depend on the time point within a melt season. RSA showed a preference for occurrence on north facing slopes. Secondary carotenoid pigments, which drive the coloration of RSA blooms, have been shown to confer additional UV-A and UV-B photo-protection in encysted snow algae (Procházková et al., 2020). RSA bloom-forming taxa are therefore likely to be better adapted to high-irradiance conditions found in surface snow layers on north-facing aspects. Additionally, on higher-elevation snow, where air temperatures are below 0 °C, the radiative forcing of algal cells within the snowpack may be sufficient to initiate localized melting around the cell (Dial et al., 2018; Halbach et al., 2022). In this instance, direct irradiance may play a larger role in bloom formation than our modelled snow melt, which did not factor albedo into its prediction. Habitable areas for RSA were predicted at higher elevations relative to GSA (Figure 6E), possibly because this enhanced albedo-mediated melt was captured within the RSA training data set. Future work could incorporate albedo and melt effects relating to algal presence into an improved melt model to disentangle the effects of radiative heat transfer and aspect upon snow melt and habitat suitability.
The presence of multimodal distributions in the response curves for days of snow melt, melt depth and aspect, suggested heterogenous responses and preferences to variables within GSA and RSA communities (Figure 4). The clustering of training images in similar months was not responsible for the multimodality. Instead, snow melt-based predictor variables exhibited considerable spatial variation across the sampling range, resulting in an even distribution of inputs. The GSA response for days of snow melt shows an even distribution between an initial preference peak for short seasons of melt (mean ~30 days) and a second preference for longer seasons (mean ~110 days). Due to a lack of snow depth information, the model was unable to predict the total melt out of snowpacks. Shorter melt season lengths therefore reflected snow patches exposed to fewer days above melting temperature, rather than shorter seasons due to melt-out of the snow. The long-season peak is indicative of GSA communities that require melt over longer periods of time to form. The late-summer timing of most of the WorldView images used (Table 1) points to these blooms having occurred in long-lasting snowpacks which have experienced melt throughout the summer.
In contrast, a response peak at c. 30 days of snow melt for GSA (Figure 4) reflects occurrence in snowpacks with much shorter melting seasons, or in shaded aspects. In such cases opportunistic species that can capitalize on the short melting season are more likely to be the drivers of bloom formation. Field observations indicate that certain snow algae, such as Hydrurus spp. and Raphidonema spp., can grow rapidly to take advantage of saturated snow at the melting edge of snowpacks (Remias et al., 2013; Kol, 1972). These often manifest as smaller, more localized blooms, forming along snowpack margins and melt out zones (Luo et al., 2020; Remias et al., 2013). Increased detection of blooms in high resolution WorldView imagery similarly suggests that small blooms are more frequent than previously reported for the region (Gray et al., 2021).
The response curves for melt intensity and a preference for terrestrial snow packs highlighted a general preference of GSA for higher melt environments than RSA. This agrees with the concept of opportunistic GSA taking advantage of rapidly melting patches towards the end of the season, as well as supporting the hypothesis of GSA occurring in patches with longer melt seasons preferring saturated layers below the snowpack surface (Hoham and Remias, 2020). One exception among recorded red blooms in Antarctica is the occurrence of blooms dominated by the ciliated red chlorophyte Chlainomonas spp (Luo et al., 2020; Ling and Seppelt, 1993). Chlainomonas spp. elsewhere in the world are known to prefer wet snow conditions (Remias et al., 2016; van Hees et al., 2023). The secondary peak in the melt response curve for RSA might therefore reflect the presence of Chlainomonas-like species blooms in the observation dataset with a preference for more saturated snow conditions.
Multimodal distributions in the variable response curves highlight the heterogeneous community nature of the GSA and RSA bloom categories. The model is simplified to look at algal blooms as either green or red, though in reality there is a significant variety of communities, with many distinct species comprising a bloom regardless of its dominant color (Davey et al., 2019; Soto et al., 2023, 2020). The presence of multimodal distributions for days of snow melt, cumulative snow melt, and aspect suggest species- or group-specific responses within GSA or RSA are present. Determining how our modelled ecological niche reflects actual habitat niches for different snow algal species and functional groups remains a challenge for the future. These will require additional ecological and physiological studies both in situ and in the laboratory (Chevrollier et al., 2022; Halbach et al., 2022).
4.2 Distribution of habitable snow
Across the Antarctic Peninsula region, modelled habitable snow was generally on north-facing, low-lying and coastal slopes, though it was also present on other slope aspects. Seasonally snow-covered rocky outcrops provide suitable habitats for both GSA and RSA, whereas RSA had a greater probability of occurrence on snow-covered Antarctic glaciers than GSA (e.g. Chen et al., 2023). Exceptions to the latter observation were found on the lower latitude and low-lying ice caps of Signy, King George, Nelson, and Robert Islands, where cumulative snow melt and days of snow melt variables also provided habitable snow for GSA blooms. This is consistent with in situ and remote sensing observations, with GSA observed on Robert Island ice cap in 2023 and Robert Island and Nelson Island ice caps within Sentinel 2 imagery (Gray et al., 2020).
The 3.4 km² maximum snow algal area observed over a 463 km² area within WorldView imagery was almost double the area of GSA previously reported (1.95 km²) using coarser resolution Sentinel 2 imagery over the entire Antarctic Peninsula (35,000 km² area) (Gray et al., 2020). This highlights the benefits of using high-resolution satellites, such as WorldView, to complete this type of ecological study, both in terms of their ability to classify red blooms and in detecting smaller blooming areas with greater confidence.
The modelled extent of habitable snow was significantly greater than the observed bloom area. This is to be expected as the model parameters tested do not capture the full array of environmental factors which constrain habitat suitability for the algae, for instance omitting nutrient availability or precipitation. This relationship also suggests that stochastic processes of dispersal and recruitment, including mechanisms such as wind, birds, and precipitation (Marshall and Chalmers, 1997; Procházková et al., 2019; Gupta, 2021; Tesson and Šantl-Temkiv, 2018) may also limit the formation of new blooms. The elevation range of habitable snow was primarily influenced by the most important predictor, days of snow melt, as it defined snowpacks that were in a melting state long enough for blooms to form (see Figure 4 for the shape of that relationship). Therefore, in the case of larger, high elevation habitable areas within our model, snow may be suitable for bloom formation, but algae have yet to disperse upwards or establish at higher elevations. Alternatively, blooms may be present in higher elevation snowpacks, but only cross thresholds for remote-sensed detection during extreme summer seasons, for example within the 2023 Robert Island image used for training (Supplementary Figure S1A).
4.3 Climate change and extreme weather event effects upon habitable snow
The positive temperature anomaly in 2021 coupled with the modelled habitable snow area for 2021 versus 2100 predictions, highlights the ecological effects of extreme summer weather events and interannual climate variability experienced in the Antarctic Peninsula region. The 2021 anomaly was caused by a combination of low pressure drawing warmer northerly winds over the Peninsula and low sea ice concentrations in the Bellingshausen Sea region (Clem et al., 2022). Sea ice acts as a barrier to exchange of heat and moisture from the sea into the atmosphere, and low sea ice extent has been shown to negatively influence snow accumulation in the western Antarctic Peninsula region (Porter et al., 2016; Thomas et al., 2017). Sea ice in the Bellingshausen Sea has been in decline over the past century (Porter et al., 2016; Turner et al., 2022). Should this trend continue, this may lead to less snow cover and fewer low-lying snow patch habitats persisting through the summer.
Our model indicated that habitable snow could expand southwards in range with climatic warming and indeed the zero-degree isotherm is predicted to increase in latitude over the next 80 years (González-Herrero et al., 2024). Summer temperatures in the west and north-east of the Antarctic Peninsula also experience significant non-seasonal climate variability and positively correlate with the phase of the Southern Annular Mode (SAM) (Clem et al., 2016). The SAM was in a positive phase during the 2021 summer, where strengthening and a poleward shift of westerly winds lead to warmer temperatures and contribute to anomalously high melt during the summer (Clem et al., 2016). Climate reconstructions suggest an increasing positive trend in summer SAM phase throughout the last century (Fogt and Marshall, 2020). Though there is significant uncertainty as to how this trend will continue to affect the Antarctic climate (Fogt and Marshall, 2020), it does seem to be forced by anthropogenic climate change (King et al., 2023). Our modelling work, with supporting evidence from remote-sensed observations from Robert and Nelson Island ice caps, as well as King George Island (Chen et al., 2023), indicates that extreme weather events such as in 2021 and 2023 enabled widespread blooms to form at higher elevations on snow-covered glaciers, and indeed we saw a preference for RSA forming on snow covered glacier/permanent snow surfaces. Research in the Arctic, particularly in Greenland, has shown that algal growth on snow and ice can contribute significantly to the darkening and enhanced melt of glaciers and ice sheets (Cook et al., 2020; Halbach et al., 2022, Williamson et al., 2019). More heatwaves on the Antarctic Peninsula, coupled with recent observations of ice algal species in Antarctica (Thomson et al., 2025), may, therefore, point to future increases in biological darkening and enhanced melt of glaciers and ice caps in the region.
Precipitation patterns across the Antarctica Peninsula are predicted to change significantly with warming in the next century, with summer rainfall and extreme snowfall events becoming increasingly common across the region (Turner et al., 2019; Vignon et al., 2021). The effect on habitable range and snow algal bloom formation is uncertain. However, seasonal field measurements of bloom development have shown strong correlation between summer snowfall events and the retardation of bloom formation (Onuma et al., 2022). In addition, anecdotal field observations have reported fewer blooms and the wash-out of existing blooms following rain events in Antarctica and elsewhere (Stibal et al., 2017). Such weather events may introduce new selection pressures - for instance favoring opportunist species - and destabilize bloom formation processes, with unknown consequences for longer-term bloom re-occurrence (Soto et al., 2023). Such feedback mechanisms and uncertain trends represent unknown factors in the future habitable range for snow algae and remain difficult processes to integrate into forecasting models.
4.4 Model advantages, limitations, and future considerations
This model aimed to capture the conditions that allow the formation of snow algal blooms on the Antarctic Peninsula by parameterizing variables relating to water availability, sunlight, and nutrient supply. The use of high spatial resolution data enabled us to capture habitat suitability in landscape features where snow persists throughout the summer, such as hollows, valleys and below cliffs, potential refugia for snow algae on low-lying islands. This was evident in Figure 3, where river valleys in the low-lying southern reaches of the Coppermine Peninsula and Harmony Point had a greater probability of occurrence than the surrounding area and were indeed filled with snow and GSA/RSA in the WorldView images. The improvement comes from the use of a sun view factor to normalize the net solar radiation component of the snow melt model, producing longer melt periods but with less snow melt over shaded landforms. This fine scale was not captured within the 100 m posterior analysis, however, as the influence of smaller topographic features upon melt was averaged over the coarser model resolution.
Our simplified snow melt modelling approach was limited by the omission of feedbacks between snow algal presence and albedo. Snow algal cells absorb solar radiation (Chevrollier et al., 2022; Halbach et al., 2022), meaning that melt would be greater than our model predictions where algal blooms were present. Since the net solar radiation dataset we used was based upon a fixed albedo over the study region, this is a systematic uncertainty and does not affect the spatial interpretation presented here. However, algal presence may decrease the time taken for a snowpack to melt completely or increase the area and magnitude of melt by increasing the amount of solar energy absorbed by the snow (Cook et al., 2020; Halbach et al., 2022). A second limitation derived from the simplification of our model runs, which omitted snow accumulation and depth information as well as longwave radiation. Moreover, terrestrial snow patches will experience greater heat transfer from surrounding or underlying rock versus snow on glacial surfaces, causing enhanced melt that was not characterized within our melt model. Biases resulting from these limitations were partially addressed within the scope of the BART model by the inclusion of specific GSA and RSA absence training data, within areas that experienced high modelled melt. Ultimately, future work should aim to improve melt model accuracy, incorporating regional climate data, locally defined lapse rate and photon transport models to estimate short and longwave radiation distribution. Over smaller areas where baseline snow depth information is present, this would greatly improve the spatial precision of habitable snow estimation by the BART model.
The use of remotely sensed data for model training allowed us to capture a large sample size that encompassed a wide range of geographic and climatic conditions, and it enabled the use of observed absences rather than generated pseudo-absences. However, this approach also introduces detection limitations that may influence model output. GSA can bloom beneath fresh snow or be overlain by red RAS, obscuring GSA from satellite view (Gray et al., 2020). Because most of our training scenes were late-season, to allow seasonal snow to melt and expose the underlying blooms (Gray et al., 2020), our training dataset likely underrepresents early-season and sub-surface GSA and is biased toward lower snowpack margins. Although random selection of training points and one early-season training image helped to mitigate this detection bias, it likely persists, causing posterior estimates to underestimate the elevation and extent of GSA habitat suitability, especially for predictions over shorter time intervals. Mechanistically, this bias (i) underestimates early-season and sub-surface GSA, and (ii) biases low-elevation/coastal patches downward. This issue is less pronounced for RSA, which typically blooms at the snow surface (Hoham and Remias, 2020; Gray et al., 2021; Onuma et al., 2022), though transient burial by summer snowfall may have reduced the observable RSA extent in some training scenes. Finally, although we attempted to include data from multiple points in the growth season, remaining gaps may contribute to multimodality in some responses. For example, in Figure 7 the 2100 map shows GSA not extending to sea level, and at low elevations the “days of snow melt” predictor is ~50, coinciding with a trough in its partial response. These uncertainties could be reduced by expanding the training set to earlier-season scenes and adding drone or in situ time series.
A key assumption of the model is that the absence of a detectable bloom infers non-habitable conditions. In reality, the occurrence of blooms is thought to be determined by stochastic processes of dispersal and seeding success, as well as the availability of a suitable environment (Soto et al., 2023; Onuma et al., 2022). Absence data can be the result of dispersal or settlement barriers in otherwise habitable snow. The inclusion of these points in training the model can lead to the underestimation of habitable range, and lower confidence in predictors (summarized in Table 3). However, the stochastic nature of these absences means the effects on the model output are small. One area of exception is the reduced probability of dispersal inland and to higher elevations as animal-vector and aeolian input become less likely (Bokhorst et al., 2019). This may create a systematic bias and underestimation of habitable snow inland and at higher elevations. The model design can also lead to the conflation of factors determining the absence of blooms (Table 3). The conflation of physical and snow chemistry factors in determining snow algae absence highlights the need for integrated snow chemistry and biology sampling in the development of such models, though achieving comparable scales of sampling to remote sensing approaches remains a challenge in extreme environments.
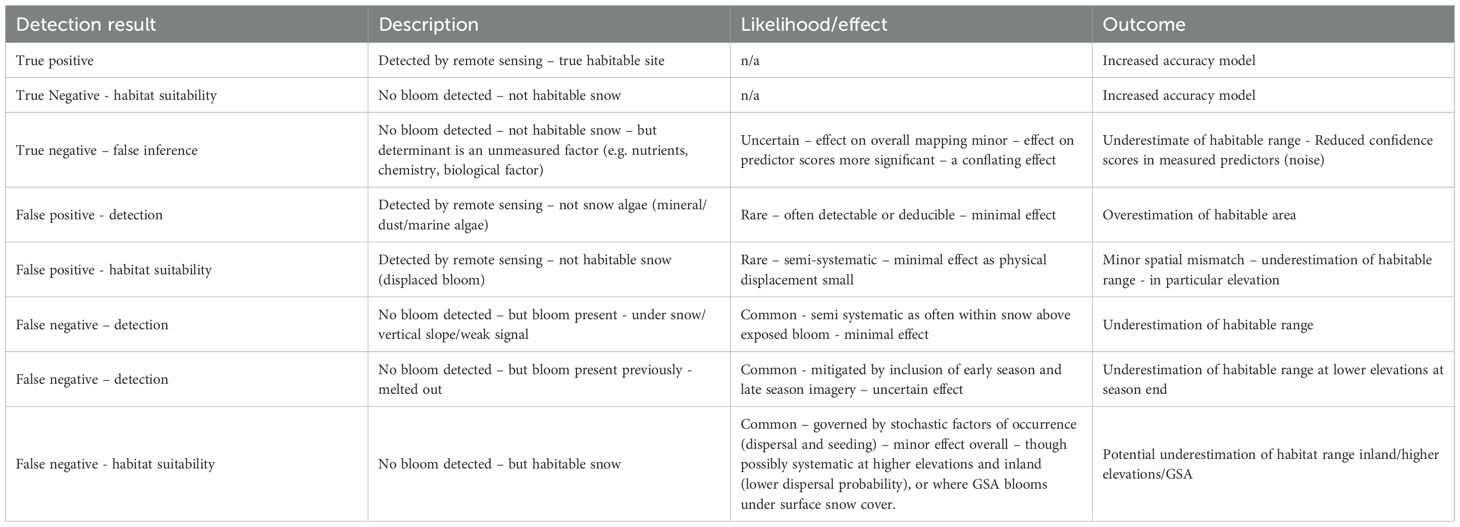
Table 3. Mechanisms, effects, and outcomes of different forms of true and false detection from remote sensing observation in the model.
Incorporating nutrients within the model proved difficult due to a lack of direct nutrient observations that could be mapped at scale. Distances to animal colonies or the coastline were used as proxies for nutrient availability within the model, as isotope analysis has previously shown snow algae to utilize guano as a nutrient source (Gray et al., 2020; Bokhorst et al., 2019). The modelled relationship between occurrence probability and distance to animal colonies or the coast (shown in Figure 4) suggested that blooms within the training dataset were close to both potential nutrient sources, though both variables were assigned low importance. Proximity alone failed to account for actual nutrient concentrations within snow melt and we acknowledge that there are gaps within animal colony records. Moreover, mineral dust within the snow or nitrogen fixation by cyanobacteria may also provide nutrients, unrelated to marine or animal inputs (McCutcheon et al., 2021; Murakami et al., 2022; Phillips-Lander et al., 2020).
Using the model to predict future habitable areas was predominantly based upon predicted air temperature for the region, which in turn fed into the snow melt model for 2100. Improvements could therefore be made by including more complex temporal feedback effects into the model, such as changes to the wider ecosystem and precipitation patterns in the region. Shifting animal colonies and the increase in vegetation in the Antarctic Peninsula, for example, may influence vectors of dispersal, re-seeding processes from soils, and nutrient dynamics for snow algae (Archer et al., 2019; Newsham et al., 2016; Robinson, 2022). In return, the predicted increase in habitable range for snow algae may result in increased organic input to Antarctic habitats, with the potential to drive successional processes in newly exposed soils and ice surfaces (Garrido-Benavent et al., 2020).
Crucially, this model aims to map the prevalence of physical conditions that allow snow algal blooms to form, rather than predicting occurrence. Likewise, it does not aim to model seasonal growth, though aspects of seasonal bloom development are captured in the frequency of bloom detection and the probability of presence across the season in the model output. Rather, this model is a tool that expands our previous work mapping snow algal blooms in Antarctica, upscaling RSA bloom extent estimates, exploring bloom niche requirements, and providing a method to explore seasonal, interannual, and long-term patterns in distribution.
5 Conclusions
We utilized a Bayesian additive regression tree model to explore large-scale distribution controls on snow algal blooms across the Antarctic Peninsula. This modelling approach provides a means to gap-fill the discontinuous observations made by field surveys, satellites or drones as well as enabling future distribution changes to be explored. Modelling indicated that the primary controls on distribution were the number of days of snow melt and aspect, with most habitable snow being north of 66° S, the relatively warmer conditions there providing larger patches of habitable area, and patches at higher elevations that were suitable for bloom formation. Future work should refine the model, using smaller areas for training with better-defined snow accumulation information, adding albedo feedback mechanisms into the snow melt model component and incorporating occurrence information weighted by remotely estimated cell density. Moreover, running the model over the continental Antarctic coastline, much of which exists close to 66° S, or specific ice bodies, would provide greater insight into the extent of Antarctica’s cryospheric biology.
The impacts of long-term climate change on bloom distribution were obscured by the anomalous extreme summer temperatures and melt rates experienced during the beginning of the 2021 summer, which exceeded predicted 2100 temperatures in the north and east of the Antarctic Peninsula. However, we determined that there was an increase in the number, size and elevation of habitable areas in regions that had experienced warming, though we also observed significant losses of habitable areas on smaller islands where summer snow is unlikely to persist through the summer under warmer conditions. The higher elevation areas in which our model detected habitable snow were predominantly glaciers or island icecaps and indicate the potential for Arctic-style glacial blooms to become established on the Antarctica Peninsula, changing the landscape of snow algae on the continent and increasing glacial melt rates.
Data availability statement
The datasets presented in this study can be found in online repositories. The names of the repository/repositories and accession number(s) can be found below: NERC EDS UK Polar Data Centre, https://doi.org/10.5285/3c636579-0389-4ba1-bf3d-d53f32892079.
Author contributions
AG: Conceptualization, Data curation, Formal Analysis, Funding acquisition, Investigation, Methodology, Project administration, Resources, Software, Validation, Visualization, Writing – original draft, Writing – review & editing. AT: Conceptualization, Data curation, Formal Analysis, Investigation, Project administration, Writing – original draft, Writing – review & editing. CC: Funding acquisition, Project administration, Resources, Writing – original draft, Writing – review & editing. PC: Conceptualization, Funding acquisition, Project administration, Resources, Writing – original draft, Writing – review & editing. PF: Funding acquisition, Writing – original draft, Writing – review & editing. AS: Writing – original draft, Writing – review & editing. LP: Writing – original draft, Writing – review & editing, Funding acquisition, Resources. MD: Conceptualization, Funding acquisition, Investigation, Methodology, Project administration, Resources, Writing – original draft, Writing – review & editing.
Funding
The author(s) declare financial support was received for the research and/or publication of this article. This research was funded under the UKRI NERC grants NE/V000764/1 and NE/V000896/1. Work was also carried out under Norwegian Romsenter grant 74CO2406 (AG). These grants funded the salary, fieldwork, equipment data and laboratory analysis.
Acknowledgments
For the purpose of open access, the author has applied a Creative Commons Attribution (CC BY) license to any Author Accepted Manuscript version arising from this submission. This research was funded under the UKRI NERC grants NE/V000764/1 and NE/V000896/1 awarded to A.G., A.I.T., P.F., P.C., C.C., A.G.S., L.S.P. and M.P.D. We are especially grateful for the logistical support of the Chilean Antarctic Institute INACH for the Robert Island fieldwork in 2023, in particular Rene Quinan, Diego Haeger, Ignatio Reyes, Bruno Escare, Juan Bravo and Andrés López Lara. Charlotte Walshaw helped support fieldwork and Hannah Moulton was our British Antarctic Survey (BAS) field guide on Robert Island. We also thank the staff at the BAS Rothera Research Station, Antarctica, and the crew of RRS Sir David Attenborough, staff at the King George Island Escudero Station (INACH), all the logistics and support staff at BAS, and Naomi Thomas (SAMS) and Lorraine Archer (UCam) for wider scientific support. Thanks to BAS for supplying some of the WorldView images used for analysis.
Conflict of interest
The authors declare that the research was conducted in the absence of any commercial or financial relationships that could be construed as a potential conflict of interest.
The author(s) declared that they were an editorial board member of Frontiers, at the time of submission. This had no impact on the peer review process and the final decision.
Generative AI statement
The author(s) declare that no Generative AI was used in the creation of this manuscript.
Any alternative text (alt text) provided alongside figures in this article has been generated by Frontiers with the support of artificial intelligence and reasonable efforts have been made to ensure accuracy, including review by the authors wherever possible. If you identify any issues, please contact us.
Publisher’s note
All claims expressed in this article are solely those of the authors and do not necessarily represent those of their affiliated organizations, or those of the publisher, the editors and the reviewers. Any product that may be evaluated in this article, or claim that may be made by its manufacturer, is not guaranteed or endorsed by the publisher.
Supplementary material
The Supplementary Material for this article can be found online at: https://www.frontiersin.org/articles/10.3389/fevo.2025.1474446/full#supplementary-material
References
Ahmadi K., Mahmoodi S., Pal S. C., Saha A., Chowdhuri I., Kolyaie S., et al. (2023). Modeling tree species richness patterns and their environmental drivers across Hyrcanian mountain forests. Ecol. Inf. 77, 102226. doi: 10.1016/j.ecoinf.2023.102226
Allouche O., Tsoar A., and Kadmon R. (2006). Assessing the accuracy of species distribution models: prevalence, kappa and the true skill statistic (TSS). J. Appl. Ecol. 43, 1223–1232. doi: 10.1111/j.1365-2664.2006.01214.x
Archer S. D. J., Lee K. C., Caruso T., Maki T., Lee C. K., Cary S. C., et al. (2019). Airborne microbial transport limitation to isolated Antarctic soil habitats. Nat. Microbiol. 4, 925–932. doi: 10.1038/s41564-019-0370-4, PMID: 30833723
Benning L. G., Anesio A. M., Lutz S., and Tranter M. (2014). Biological impact on Greenland’s albedo. Nat. Geosci. 7, 691–691. doi: 10.1038/ngeo2260
Bokhorst S., Convey P., and Aerts R. (2019). Nitrogen inputs by marine vertebrates drive abundance and richness in antarctic terrestrial ecosystems. Curr. Biol. 29, 1721–1727.e3. doi: 10.1016/j.cub.2019.04.038, PMID: 31080085
Bunting P. and Clewley D. (2022). Atmospheric and Radiometric Correction of Satellite Imagery (ARCSI). Available at: http://remotesensing.info/arcsi/ (Accessed August 2022).
Burton-Johnson A., Black M., Fretwell P. T., and Kaluza-Gilbert J. (2016). An automated methodology for differentiating rock from snow, clouds and sea in Antarctica from Landsat 8 imagery: a new rock outcrop map and area estimation for the entire Antarctic continent. Cryosphere 10, 1665–1677. doi: 10.5194/tc-10-1665-2016
Carlson C. J. (2020). embarcadero: Species distribution modelling with Bayesian additive regression trees in r. Methods Ecol. Evol. 11, 850–858. doi: 10.1111/2041-210X.13389
Chen X.-Y., Li S.-L., Zhang C., and Liu D.-Y. (2023). Snow algal blooms in Antarctic King George Island in 2017–2022 and their future trend based on CMIP6 projection. Adv. Climate Change Res. 14, 732–745. doi: 10.1016/j.accre.2023.09.013
Chevrollier L.-A., Cook J. M., Halbach L., Jakobsen H., Benning L. G., Anesio A. M., et al. (2022). Light absorption and albedo reduction by pigmented microalgae on snow and ice. J. Glaciology, 69 (274), 333–341. doi: 10.1017/jog.2022.64
Chipman H. A., George E. I., and McCulloch R. E. (2010). BART: Bayesian additive regression trees. Ann. Appl. Stat 4, 266–298. doi: 10.1214/09-AOAS285
Chown S. L. and Convey P. (2016). Antarctic entomology. Annu. Rev. Entomology 61, 119–137. doi: 10.1146/annurev-ento-010715-023537, PMID: 26982437
Clem K. R., Raphael M. N., Adusumilli S., Baiman R., Banwell A. F., Barreira S., et al. (2022). State of the climate in 2021 Antarctica and the Southern ocean. Bull. Am. Meteorological Soc. 103 (Suppl. 1), S307–S340. doi: 10.1175/BAMS-D-22-0078.1
Clem K. R., Renwick J. A., McGregor J., and Fogt R. L. (2016). The relative influence of ENSO and SAM on Antarctic Peninsula climate. J. Geophysical Research: Atmospheres 121, 9324–9341. doi: 10.1002/2016JD025305
Colesie C., Walshaw C. V., Sancho L. G., Davey M. P., and Gray A. (2023). Antarctica’s vegetation in a changing climate. WIREs Climate Change 14, e810. doi: 10.1002/wcc.810
Cook J. M., Tedstone A. J., Williamson C., McCutcheon J., Hodson A. J., Dayal A., et al. (2020). Glacier algae accelerate melt rates on the south-western Greenland Ice Sheet. The Cryosphere. 14 (1), 309–330. doi: 10.5194/tc-14-309-2020
Davey M. P., Norman L., Sterk P., Huete-Ortega M., Bunbury F., Loh B. K. W., et al. (2019). Snow algae communities in Antarctica: metabolic and taxonomic composition. New Phytol. 222, 1242–1255. doi: 10.1111/nph.15701, PMID: 30667072
de Menezes G. C. A., Amorim S. S., Gonçalves V. N., Godinho V. M., Simões J. C., Rosa C. A., et al. (2019). Diversity, distribution, and ecology of fungi in the seasonal snow of Antarctica. Microorganisms 7, 445. doi: 10.3390/microorganisms7100445, PMID: 31614720
Dial R. J., Ganey G. Q., and Skiles S. M. (2018). “What color should glacier algae be? An ecological role for red carbon in the cryosphere,” in FEMS Microbiology Ecology, vol. 94. (Oxford, United Kingdom: Oxford University Press (OUP). doi: 10.1093/femsec/fiy007, PMID: 29346532
Dong Y., Zhao J., Li C., and Liao M. (2022). Gapless-REMA100: A gapless 100-m reference elevation model of Antarctica with voids filled by multi-source DEMs. ISPRS J. Photogrammetry Remote Sens. 186, 70–82. doi: 10.1016/j.isprsjprs.2022.01.024
Engstrom C. B., Williamson S. N., Gamon J. A., and Quarmby L. M. (2022). Seasonal development and radiative forcing of red snow algal blooms on two glaciers in British Columbia, Canada, summer 2020. Remote Sens. Environ. 280, 113164. doi: 10.1016/j.rse.2022.113164
Fogt R. L. and Marshall G. J. (2020). The Southern Annular Mode: Variability, trends, and climate impacts across the Southern Hemisphere. WIREs Climate Change 11, e652. doi: 10.1002/wcc.652
Fretwell P. T. and Trathan P. N. (2021). Discovery of new colonies by Sentinel-2 reveals good and bad news for emperor penguins. Remote Sens Ecol. Conserv. 7 (1), 139–153. doi: 10.1002/rse2.176
Garrido-Benavent I., Pérez-Ortega S., Durán J., Ascaso C., Pointing S. B., Rodríguez-Cielos R., et al. (2020). Differential colonization and succession of microbial communities in rock and soil substrates on a maritime antarctic glacier forefield. Front. Microbiol. 11. doi: 10.3389/fmicb.2020.00126, PMID: 32117148
Gerrish L., Fretwell P., and Cooper P. (2020). High resolution vector polygons of the Antarctic coastline - VERSION 7.2 (Cambridge, United Kingdom: UK Polar Data Centre, Natural Environment Research Council, UK Research & Innovation). doi: 10.5285/065b9abc-1b5a-4fc6-aa57-9052428aa6ca
González-Herrero S., Navarro F., Pertierra L. R., Oliva M., Dadic R., Peck L., et al. (2024). Southward migration of the zero-degree isotherm latitude over the Southern Ocean and the Antarctic Peninsula: Cryospheric, biotic and societal implications. Sci Total Environ. 912, 168473. doi: 10.1016/j.scitotenv.2023.168473, PMID: 38007123
Gray A., Krolikowski M., Fretwell P., Convey P., Peck L. S., Mendelova M., et al. (2020). Remote sensing reveals Antarctic green snow algae as important terrestrial carbon sink. Nat. Commun. 11, 1–9. doi: 10.1038/s41467-020-16018-w, PMID: 32433543
Gray A., Krolikowski M., Fretwell P., Convey P., Peck L. S., Mendelova M., et al. (2021). Remote sensing phenology of antarctic green and red snow algae using worldView satellites. Front. Plant Sci 12. doi: 10.3389/FPLS.2021.671981/BIBTEX, PMID: 34226827
Groos A., Mayer C., Smiraglia C., Diolaiuti G., and Lambrecht A. (2017). A first attempt to model region-wide glacier surface mass balances in the Karakoram: Findings and future challenges. Geografia Fisica e Dinamica Quaternaria 40 (2), 137–159. doi: 10.4461/GFDQ2017.40.10
Gupta P. (2021). First report on diversity of Cyanoprokaryotes and Algae on Feather of Snow Petrel (Pagodroma nivea Forster) in Broknes Peninsula of Larsemann Hills, East Antarctica. Int. J. Biol. Innov. 03, 373–381. doi: 10.46505/IJBI.2021.3219
Halbach L., Chevrollier L.-A., Doting E. L., Cook J. M., Jensen M. B., Benning L. G., et al. (2022). Pigment signatures of algal communities and their implications for glacier surface darkening. Sci. Rep. 12, 17643. doi: 10.1038/s41598-022-22271-4, PMID: 36271236
Harris C. M., Lorenz K., Fishpool L. D. C., Lascelles B., Cooper J., Coria N. R., et al. (2015). Important Bird Areas in Antarctica 2015. Cambridge: BirdLife International and Environmental Research & Assessment Ltd. doi: 10.13140/RG.2.1.1554.2884
Hashim M., Misbari S., Reba N. M., Abdul-Wahab M. F., Pour A. B., Said M. F. M., et al. (2016). “Mapping snow-algae in Antarctic Peninsula with multi-temporal satellite remote sensing data,” in International Geoscience and Remote Sensing Symposium (New York, USA: IGARSS), 5221–5224. doi: 10.1109/IGARSS.2016.7730360
Hersbach H., Bell B., Berrisford P., Hirahara S., Horányi A., Muñoz-Sabater J., et al. (2020). The ERA5 global reanalysis. Q.J.R. Meteorol. Soc 146, 1999–2049. doi: 10.1002/qj.3803
Hodson A. J., Anesio A. M., Tranter M., Fountain A. G., Osborn M., Priscu J. C., et al. (2008). Glacial ecosystems. Ecol. Monogr. 78, 41–67. doi: 10.1890/07-0187.1
Hoham R. W. and Remias D. (2020). Snow and glacial algae: A review1. J. Phycology 56, 264–282. doi: 10.1111/jpy.12952, PMID: 31825096
Howat I. M., Porter C., Smith B. E., Noh M.-J., and Morin P. (2019). The reference elevation model of Antarctica. Cryosphere 13, 665–674. doi: 10.5194/tc-13-665-2019
Humphries G. R. W., Naveen R., Schwaller M., Che-Castaldo C., McDowall P., Schrimpf M., et al. (2017). Mapping Application for Penguin Populations and Projected Dynamics (MAPPPD): Data and tools for dynamic management and decision support. Polar Rec 53, 160–166. doi: 10.1017/S0032247417000055
Huovinen P., Ramírez J., and Gómez I. (2018). Remote sensing of albedo-reducing snow algae and impurities in the Maritime Antarctica. ISPRS J. Photogrammetry Remote Sens. 146, 507–517. doi: 10.1016/j.isprsjprs.2018.10.015
Jawak S. D., Luis A. J., Fretwell P. T., Convey P., and Durairajan U. A. (2019). Semiautomated detection and mapping of vegetation distribution in the Antarctic environment using spatial-spectral characteristics of WorldView-2 imagery. Remote Sens. 11, 1909. doi: 10.3390/rs11161909
Khan A. L., Dierssen H. M., Scambos T. A., Höfer J., and Cordero R. R. (2021). Spectral characterization, radiative forcing and pigment content of coastal Antarctic snow algae: Approaches to spectrally discriminate red and green communities and their impact on snowmelt. Cryosphere 15, 133–148. doi: 10.5194/tc-15-133-2021
King J., Anchukaitis K. J., Allen K., Vance T., and Hessl A. (2023). Trends and variability in the Southern Annular Mode over the Common Era. Nat. Commun. 14, 2324. doi: 10.1038/s41467-023-37643-1, PMID: 37087516
Kol E. (1972). Snow algae from signy island (South orkney islands,Antarctica). Annales Historico-Naturales Musei Nationalis Hungarici 64, 63–70.
LaRue M., Salas L., Nur N., Ainley D., Stammerjohn S., Pennycook J., et al. (2021). Insights from the first global population estimate of Weddell seals in Antarctica. Sci Adv. 7, eabh3674. doi: 10.1126/sciadv.abh3674, PMID: 34559555
Lavoie D., Denman K., and Michel C. (2005). Modeling ice algal growth and decline in a seasonally ice-covered region of the Arctic (Resolute Passage, Canadian Archipelago). J. Geophysical Res. 110, C11009. doi: 10.1029/2005JC002922
Lee J. R., Raymond B., Bracegirdle T. J., Chadès I., Fuller R. A., Shaw J. D., et al. (2017). Climate change drives expansion of Antarctic ice-free habitat. Nature 547, 49–54. doi: 10.1038/nature22996, PMID: 28658207
Ling H. U. and Seppelt R. D. (1993). Snow algae of the Windmill Islands, continental Antarctica. 2. Chloromonas rubroleosa sp. nov. (Volvocales, Chlorophyta), an alga of red snow. Eur. J. Phycology 28, 77–84. doi: 10.1080/09670269300650131
Lopez A. (2016). CMIP5 daily data on single levels. Reading, United Kingdom: Copernicus Climate Change Service (C3S) through the Climate Data Store (CDS), ECMWF. doi: 10.24381/CDS.D3513DBF
Luo W., Ding H., Li H., Ji Z., Huang K., Zhao W., et al. (2020). Molecular diversity of the microbial community in coloured snow from the Fildes Peninsula (King George Island, Maritime Antarctica). Polar Biol. 43, 1391–1405. doi: 10.1007/s00300-020-02716-0
Marshall W. A. and Chalmers M. O. (1997). Airborne dispersal of Antarctic terrestrial algae and cyanobacteria. Ecography 20, 585–594. doi: 10.1111/j.1600-0587.1997.tb00427.x
Martin P. J. and Peel D. A. (1978). The spatial distribution of 10 m temperatures in the antarctic peninsula. J. Glaciology 20, 311–317. doi: 10.3189/S0022143000013861
Matsuoka K., Skoglund A., Roth G., De Pomereu J., Griffiths H., Headland R., et al. (2018). QuAntarctica. Tromsø, Norway: Norwegian Polar Institute. doi: 10.21334/NPOLAR.2018.8516E961
McCutcheon J., Lutz S., Williamson C., Cook J. M., Tedstone A. J., Vanderstraeten A., et al. (2021). Mineral phosphorus drives glacier algal blooms on the Greenland Ice Sheet. Nat. Commun. 12, 570. doi: 10.1038/s41467-020-20627-w, PMID: 33495440
Murakami T., Takeuchi N., Mori H., Hirose Y., Edwards A., Irvine-Fynn T., et al. (2022). Metagenomics reveals global-scale contrasts in nitrogen cycling and cyanobacterial light-harvesting mechanisms in glacier cryoconite. Microbiome 10, 50. doi: 10.1186/s40168-022-01238-7, PMID: 35317857
Newsham K. K., Hopkins D. W., Carvalhais L. C., Fretwell P. T., Rushton S. P., O’Donnell A. G., et al. (2016). Relationship between soil fungal diversity and temperature in the maritime Antarctic. Nat. Climate Change 6, 182–186. doi: 10.1038/nclimate2806
Onuma Y., Yoshimura K., and Takeuchi N. (2022). Global simulation of snow algal blooming by coupling a land surface and newly developed snow algae models. J. Geophysical Res. 127, e2021JG006339. doi: 10.1029/2021JG006339
Phillips-Lander C. M., Harrold Z., Hausrath E. M., Lanzirotti A., Newville M., Adcock C. T., et al. (2020). Snow algae preferentially grow on fe-containing minerals and contribute to the formation of fe phases. Geomicrobiology J. 37, 572–581. doi: 10.1080/01490451.2020.1739176
Porter S. E., Parkinson C. L., and Mosley-Thompson E. (2016). Bellingshausen Sea ice extent recorded in an Antarctic Peninsula ice core. J. Geophysical Res. 121, 13,886–13,900. doi: 10.1002/2016JD025626
Poursanidis D., Kougioumoutzis K., Minasidis V., Chartosia N., Kletou D., and Kalogirou S. (2022). Uncertainty in marine species distribution modelling: trying to locate invasion hotspots for pterois miles in the Eastern mediterranean sea. J. Mar. Sci Eng. 10, 729. doi: 10.3390/jmse10060729
Procházková L., Leya T., Křížková H., and Nedbalová L. (2019). Sanguina nivaloides and Sanguina aurantia gen. et spp. nov. (Chlorophyta): the taxonomy, phylogeny, biogeography and ecology of two newly recognised algae causing red and orange snow. FEMS Microbiol. Ecol. 95, fiz064. doi: 10.1093/femsec/fiz064, PMID: 31074825
Procházková L., Remias D., Bilger W., Křížková H., Řezanka T., and Nedbalová L. (2020). Cysts of the snow alga chloromonas krienitzii (Chlorophyceae) show increased tolerance to ultraviolet radiation and elevated visible light. Front. Plant Sci. 11. doi: 10.3389/fpls.2020.617250, PMID: 33391329
Pugh P. J. A. and Convey P. (2008). Surviving out in the cold: Antarctic endemic invertebrates and their refugia. J. Biogeography 35, 2176–2186. doi: 10.1111/j.1365-2699.2008.01953.x
Remias D., Jost S., Boenigk J., Wastian J., and Lütz C. (2013). Hydrurus-related golden algae (Chrysophyceae) cause yellow snow in polar summer snowfields. Phycological Res. 61, 277–285. doi: 10.1111/pre.12025
Remias D., Pichrtová M., Pangratz M., Lütz C., and Holzinger A. (2016). Ecophysiology, secondary pigments and ultrastructure of Chlainomonas sp. (Chlorophyta) from the European Alps compared with Chlamydomonas nivalis forming red snow. FEMS Microbiol. Ecol. 92, fiw030. doi: 10.1093/femsec/fiw030, PMID: 26884467
Robinson S. A. (2022). Climate change and extreme events are changing the biology of Polar Regions. Global Change Biol. 28, 5861–5864. doi: 10.1111/gcb.16309, PMID: 35821589
Robledano A., Picard G., Arnaud L., Larue F., and Ollivier I. (2022). “Modelling surface temperature and radiation budget of snow-covered complex terrain,” in The Cryosphere, vol. 16. (Göttingen, Germany: Copernicus GmbH), 559–579. doi: 10.5194/tc-16-559-2022
Roussel L., Dumont M., Gascoin S., Monteiro D., Bavay M., Nabat P., et al. (2024). Snowmelt duration controls red algal blooms in the snow of the European Alps. Proc. Natl. Acad. Sci. United States America 121 41, e2400362121. doi: 10.1073/pnas.2400362121, PMID: 39312681
Schwaller M. R., Lynch H. J., Tarroux A., and Prehn B. (2018). A continent-wide search for Antarctic petrel breeding sites with satellite remote sensing. Remote Sens. Environ. 210, 444–451. doi: 10.1016/j.rse.2018.02.071
Siegert M. J., Bentley M. J., Atkinson A., Bracegirdle T. J., Convey P., Davies B., et al. (2023). Antarctic extreme events. Front. Environ. Sci 11. doi: 10.3389/fenvs.2023.1229283
Soto D. F., Fuentes R., Huovinen P., and Gómez I. (2020). Microbial composition and photosynthesis in Antarctic snow algae communities: Integrating metabarcoding and pulse amplitude modulation fluorometry. Algal Res. 45, 101738. doi: 10.1016/j.algal.2019.101738
Soto D. F., Gómez I., and Huovinen P. (2023). Antarctic snow algae: unraveling the processes underlying microbial community assembly during blooms formation. Microbiome 11, 200. doi: 10.1186/s40168-023-01643-6, PMID: 37667346
Stibal M., Box J. E., Cameron K. A., Langen P. L., Yallop M. L., Mottram R. H., et al. (2017). Algae drive enhanced darkening of bare ice on the Greenland ice sheet. Geophysical Res. Lett. 44, 11,463–11,471. doi: 10.1002/2017GL075958
Sun X., Wu W., Li X., Xu X., and Li J. (2021). Vegetation abundance and health mapping over Southwestern Antarctica based on worldView-2 data and a modified spectral mixture analysis. Remote Sens. 13 Page 166 13, 166–166. doi: 10.3390/RS13020166
Tesson S. V. M. and Šantl-Temkiv T. (2018). Ice nucleation activity and aeolian dispersal success in airborne and aquatic microalgae. Front. Microbiol. 9. doi: 10.3389/fmicb.2018.02681, PMID: 30483227
Thomas E. R., van Wessem J. M., Roberts J., Isaksson E., Schlosser E., Fudge T. J., et al. (2017). Regional Antarctic snow accumulation over the past 1000 years. Climate Past 13, 1491–1513. doi: 10.5194/cp-13-1491-2017
Thomson A. I., Gray A., Colesie C., Thomas N., Moulton H., Convey P., et al. (2025). Surface darkening by abundant and diverse algae on an Antarctic ice cap. Nat. Commun. 16, 2647. doi: 10.1038/s41467-025-57725-6, PMID: 40102384
Turner J., Holmes C., Caton Harrison T., Phillips T., Jena B., Reeves-Francois T., et al. (2022). Record low Antarctic sea ice cover in February 2022. Geophysical Res. Lett. 49, e2022GL098904. doi: 10.1029/2022GL098904
Turner J., Phillips T., Thamban M., Rahaman W., Marshall G. J., Wille J. D., et al. (2019). The dominant role of extreme precipitation events in antarctic snowfall variability. Geophysical Res. Lett. 46, 3502–3511. doi: 10.1029/2018GL081517
van Hees D., Hanneman C., Paradis S., Camara A. G., Matsumoto M., Hamilton T., et al. (2023). Patchy and Pink: Dynamics of a Chlainomonas sp. (Chlamydomonadales, chlorophyta) algal bloom on Bagley Lake, North Cascades, WA. FEMS Microbiol. Ecol. 99, fiad106. doi: 10.1093/femsec/fiad106, PMID: 37675994
Vignon É., Roussel M.-L., Gorodetskaya I. V., Genthon C., and Berne A. (2021). Present and future of rainfall in Antarctica. Geophysical Res. Lett. 48, e2020GL092281. doi: 10.1029/2020GL092281
Vimercati L., Solon A. J., Krinsky A., Arán P., Porazinska D. L., Darcy J. L., et al. (2019). Nieves penitentes are a new habitat for snow algae in one of the most extreme high-elevation environments on Earth. Arctic Antarctic Alpine Res. 51, 190–200. doi: 10.1080/15230430.2019.1618115
Vyverman W., Verleyen E., Wilmotte A., Hodgson D. A., Willems A., Peeters K., et al. (2010). Evidence for widespread endemism among Antarctic micro-organisms. Polar Sci 4, 103–113. doi: 10.1016/j.polar.2010.03.006
Walshaw C. V., Gray A., Fretwell P. T., Convey P., Davey M. P., Johnson J. S., et al. (2024). A satellite-derived baseline of photosynthetic life across Antarctica. Nat. Geosci. 17, 755–762. doi: 10.1038/s41561-024-01492-4
Keywords: snow algae, remote sensing, species distribution model, extreme weather events, Antarctica, climate change
Citation: Gray AM, Thomson AI, Colesie C, Convey P, Fretwell P, Smith AG, Peck LS and Davey MP (2025) Modelling snow algal habitat suitability and ecology under extreme weather events on the Antarctic Peninsula. Front. Ecol. Evol. 13:1474446. doi: 10.3389/fevo.2025.1474446
Received: 01 August 2024; Accepted: 03 September 2025;
Published: 23 September 2025.
Edited by:
Dennis Murray, Trent University, CanadaReviewed by:
Nicolas Diaz-Kloch, Trent University, CanadaTakumi Suzuki, Japan Aerospace Exploration Agency (JAXA), Japan
Copyright © 2025 Gray, Thomson, Colesie, Convey, Fretwell, Smith, Peck and Davey. This is an open-access article distributed under the terms of the Creative Commons Attribution License (CC BY). The use, distribution or reproduction in other forums is permitted, provided the original author(s) and the copyright owner(s) are credited and that the original publication in this journal is cited, in accordance with accepted academic practice. No use, distribution or reproduction is permitted which does not comply with these terms.
*Correspondence: Andrew Møller Gray, YW5kcmV3LmdyYXlAbmluYS5ubw==