 Victoria Hanley1
 Kevin Ryer
 Md Saydur Rahman
 John H. Young Jr.
 Richard J. Kline
- 1School of Integrative Biological and Chemical Sciences, University of Texas Rio Grande Valley, Brownsville, TX, United States
- 2School of Earth, Environmental and Marine Sciences, University of Texas Rio Grande Valley, Brownsville, TX, United States
- 3Department of Environmental Affairs, Texas Department of Transportation, Austin, TX, United States
Endangered species are increasingly used as the target species in implementing and constructing new wildlife crossing structures (WCS). Highways in South Texas fragment the landscape and result in high road mortality for endangered species such as ocelots (Leopardus pardalis, a medium-sized spotted wild cat). In response, the Texas Department of Transportation constructed nine WCS on Farm-to-Market 106 (FM 106), a road which bisects Laguna Atascosa National Wildlife Refuge in Cameron County, Texas. With ocelots being rare and elusive, bobcats (Lynx rufus) are often used as a surrogate species to study felid behavior at road mitigation structures in South Texas. Bobcats have unique markings which allow them to be individually identified. Three methods of individual identification of bobcats using camera trap photos were compared: visual identification, HotSpotter, and a spatio-temporal strategy, with manual visual identification being the most effective. Using this method, 78 bobcats were identified across the 23 sites along FM 106 including: 17 residents, 52 transients, and 9 juveniles. Their interactions at road mitigation structures were further analyzed to determine the effectiveness of facilitating bobcat movement safely beneath the road. The number of bobcat individuals at a WCS per month was a significant predictor of the number of bobcat interactions (p < 0.001). Canopy cover was a significant predictor of bobcat crossings, with more crossings occurring in dense canopy cover than in mixed or open areas (p < 0.001). For marking behaviors at WCS, bobcat sex was not a significant factor (p = 0.749). However, residency status significantly affected marking behavior, with resident bobcats marking more frequently than transients (p < 0.001). The number of days between interactions at WCS decreased as the number of interactions since initial contact with a WCS increased, indicating that bobcats interacted more frequently with WCS over time. However, the rate of successful crossings did not increase. One male ocelot was observed at two WCS with dense vegetation, these were also the two crossings with the greatest frequency of bobcat activity and marking behaviors.
1 Introduction
Roads and highways can impede existing wildlife migration routes and home ranges of wildlife by creating barriers for movement or causing mortalities, and roadkill has now surpassed hunting as the leading cause of terrestrial wildlife mortality in the United States (Forman and Alexander, 1998; Coffin, 2007). Many threatened carnivore species have large spatial requirements and are therefore more vulnerable to the negative effects of high-speed roads (Noss et al., 1996; Ng et al., 2004). Highways can create an impermeable boundary for predatory species and can lead to severe habitat fragmentation and fragmented populations (Clevenger and Huijser, 2011; Lombardi et al., 2020). Populations that become fragmented may no longer interbreed, decreasing gene flow and eventually causing the population to decline (Hardy et al., 2003).
South Texas is home to two species of native medium-sized felids, bobcat (Lynx rufus, an extant species) and ocelot (Leopardus pardalis, an endangered species), that often occupy overlapping niches within the landscape (Horne et al., 2009). This is the only region in the United States where these species’ ranges overlap, making it a unique area to study their movement and behavior. Bobcats and ocelots share a similar ecology (Horne et al., 2009; Lombardi et al., 2020). Both animals are comparable in body size (ocelot 11–16 kg, bobcat 4.1–18 kg), are primarily crepuscular and nocturnal, and feed on small mammals and birds (Horne et al., 2009). However, bobcats may be less particular when it comes to the habitat structure that they frequent compared to the ocelot. Ocelots are habitat specialists and notoriously elusive. They are commonly found in dense (>95% canopy coverage) Tamaulipan thornscrub habitat, a shrublands ecoregion in Southern Texas and Northeastern Mexico, with dense canopy cover to evade detection by potential predators and prey (Harveson et al., 2004; Horne et al., 2009). Conversely, bobcats are habitat generalists, occupying a range of habitat structures from dense thornscrub with mixed canopy cover, to open grassland with no cover (Horne et al., 2009).
Highways in South Texas are associated with high wildlife mortality rates since they run through prime habitat, which is why vehicle collision is one of the leading causes of mortality for the U.S. ocelot (Lombardi et al., 2020). According to the report by Laguna Atascosa National Wildlife Refuge (LANWR, 2016) there were seven ocelot road mortalities documented between June 2015 and April 2016 in South Texas. As of now, the current U.S. population of ocelots is made up of fewer than 100 individuals that reside in Cameron, Willacy, and Kenedy Counties in South Texas (Horne et al., 2009, USFWS, 2016). With evidence from telemetry and genetic analyses, these remaining fragmented populations are restricted by a virtually impenetrable anthropogenic barrier (Haines et al., 2005a, b, 2006; Janecka et al., 2008, 2011; Laack et al., 2005; Laack, 1991). Wildlife crossing structures provide a new means of bridging territories transected by highways, creating corridors between fragmented habitats.
Wildlife Crossing Structures (WCS) were first documented in the Ocala National Forest in Florida for black bear use in 1950 (Cramer and Bissonette, 2005). After numerous reports of their success in allowing wildlife to safely traverse from one side of the road to the other without ever encountering the road itself, more wildlife crossings were installed throughout the 1970s (Cramer and Bissonette, 2005). There are an estimated 450 terrestrial wildlife crossings in North America (Evink, 1996; Cramer and Bissonette, 2005). However, monitoring periods for these crossing structures post-construction are typically short (Clevenger and Huijser, 2011) and aren’t always adequate for meeting the potentially lengthy adaptation periods that wildlife need to become habituated to WCS, which may take several years depending on the species (Reed et al., 1975; Waters, 1988; Bunyan, 1990; Land and Lotz, 1996; Clevenger and Waltho, 2000, 2003; Clevenger et al., 2002; Clevenger and Huijser, 2011).
In South Texas, Farm-to-Market 106 (FM 106) road bisects ocelot habitat within LANWR. Beginning in 2017, the Texas Department of Transportation has constructed or modified nine WCS with adjacent, non-continuous exclusion fencing along high-risk segments of FM 106 (Schmidt et al., 2020a) to help mitigate roadway ocelot mortalities (Figure 1A). Due to the high priority for the conservation of the species and the lack of data collected on ocelots in South Texas over the last 35 years, both within the landscape and along FM 106 road corridor, the possibility of using bobcats as a surrogate species for mortality risks has been proposed (Cain et al., 2003; Schmidt et al., 2020a). Risk models for both species, with appropriate filters in place, reveal that bobcats can be valuable research surrogates for assessing the threat of road mortality within the local ocelot population (Schmidt et al., 2020b).

Figure 1. Map of mitigation structures and monitoring sites along Farm to Market 106 (FM 106) road in Cameron County, Texas (A). There were nine wildlife crossing structures (WCS; blue square), WCS adjacent mitigation fencing, and ROW sites (red circle). Representative photographs showing WCS and along FM 106 (B–E).
Many road mitigation monitoring projects cannot identify their target species to individuals and therefore are limited to studies of occupancy, but because bobcats have completely unique coat patterns, it is possible to identify these felids to the individual level (Camarena-Ibarrola et al., 2019; Heilbrun et al., 2003). Individual identification can in turn provide insight into otherwise unanswerable questions such as the number of individuals utilizing WCS and whether or not that number increases with time post-construction. Collaring methods to identify or count individuals can be invasive and expensive (Heilbrun et al., 2003; Nietfeld, 1994). The use of camera traps to monitor wildlife at WCS has become increasingly popular due to its low cost and reliability (Trolle and Kéry, 2005; Kays et al., 2010; Cramer, 2012; Burton et al., 2015). However, for wildlife studies using camera trap photos to identify individuals, issues arise in analyzing such large datasets and using rigorous methods for identification (Choo et al., 2020). Manual identification can be tedious and error-prone, often leading to biased results (Choo et al., 2020; Nipko et al., 2020). However, the emerging technology of pattern recognition software to assist in this process is now being increasingly utilized by researchers (Nipko et al., 2020). Two such programs that have been widely used in zebra and jaguar studies are Wild-ID and HotSpotter. A comparison of these two programs was conducted by Nipko et al. (2020), using camera trap images of ocelots and jaguars. Results showed that HotSpotter had the greatest positive matching rate (71-82%), compared to Wild-ID (58-73%), and could effectively be used to identify individuals using large camera trapping datasets. However, current pattern recognition software is not fully automated, and the human eye is still necessary to confirm matches suggested by these programs (Nipko et al., 2020). While HotSpotter has been used to successfully identify ocelots to individuals (Nipko et al., 2020), the software has yet to be applied to bobcats.
The overall goal of this study was to analyze bobcat behavior along the FM 106 road corridor, and more specifically at WCS. The aim of this study was two-fold. 1) Evaluate automated identification (HotSpotter), manual visual identification, and a spatio-temporal strategy for identifying bobcats to the individual level to determine the number of bobcats occurring along the FM 106 road corridor. We expected Hotspotter to have a greater positive matching rate than manual visual identification in bobcat identification. 2) Determine the number, frequency, and residency of bobcats using the FM 106 road corridor. We expected many bobcat individuals (>25) were present in the area, and that bobcat individuals would utilize multiple mitigation structure types but would utilize WCS most frequently. We also expected to observe more resident bobcats at WCS than transient bobcats and due to territoriality, males would be observed marking the habitat more.
2 Materials and methods
2.1 Study area
This study was conducted along a select portion of Farm-to-Market 106 (FM 106), a 97 km/h road that bisects ocelot and bobcat habitat within LANWR in South Texas (Figure 1A). FM 106 is a two-lane highway, running from Rio Hondo to Bayview and Laguna Vista in Cameron County, Texas. The road was surrounded by grassland, mesquite, and coastal prairie habitat. It was comprised of 18 km of mitigated road with nine wildlife crossing structures (WCS) with adjacent, non-continuous 2 m high chain-link fencing of varying lengths. Percent canopy cover was measured at camera height (approximately 50 cm from the ground) at the center of each site and at 5 m in each cardinal direction using GRS Densitometer (Geographic Resource Solutions, Arcata, CA). Photos from each point were used to document canopy cover. Vegetation at each site was classified into three categories of Open = 0-30%, Mixed = 31-69%, and Dense = 70-100%.
2.2 Camera trap array
Ongoing monitoring of mitigation structures at FM 106 consisted of 36 motion-activated camera traps at the WCS Figures 1B-E. Each crossing structure had four Reconyx Hyperfire 2 camera traps, one passive infra-red (PIR) camera, and one active infra-red (AIR) camera, for a total of 6 cameras on each side of the structure, which were installed facing either end of the WCS opening at an angle that maximized the view of the opening. Each PIR and AIR camera was set to take three photos of the initial detection of an animal, with one-second intervals between photos. AIR cameras were connected to a solar panel and battery that powered an external infrared trip located at the entrance of the WCS that was used to detect wildlife that entered. PIR cameras were powered by internal batteries. Ten PIR right-of-way (ROW) camera traps were installed in pairs on either side of the road, approximately 5 m from the ROW, facing existing game trails. Thirty-two PIR camera traps were installed at all but two fence ends (FEs) adjoining WCS to monitor wildlife circumnavigation of fencing. The FEs that were not fitted with cameras and could not be included in monitoring were those adjacent to the Port Isabel Detention Center. The entire FM 106 project incorporated 92 cameras during this study. All cameras were protected by metal lock boxes mounted on metal poles approximately 30 cm above the ground. Cameras on FM 106 were serviced every two weeks, which included changing batteries when necessary, switching SanDisk (SD) memory cards, verifying dates and times, checking trip functionality, and removing any vegetation within a 2.5 m arc that may have caused false triggers. Each camera was programmed so that photos displayed a label of date, time, and location. Camera trap data from FM 106 were collected at WCS over 18 months from December 2019 to May 2021. ROW camera data were collected for eight months from September 2020 to May 2021, and FE data were collected for seven months from October 2020 to May 2021.
2.3 Photo capture and processing
All photos captured on cameras were off-loaded to hard drives and renamed using ReNamer or Special ReNamer according to date and time (https://www.advancedrenamer.com/). Once photos were renamed, they were organized by camera and sorted by species. Photographs of bobcats were reviewed to determine the number of individuals present in each photo. A file structure was simultaneously created to assess an individual’s “interactions” at each site (Interactions were classifications of bobcat activities including: crossing, entry, approach, and parallel movement to structure, with a sub classification of scent marking, that occurred at the road mitigation structures). After all individuals were accounted for, DataOrganizer Ver. 4.5 was used to create a text file that included the location, date, and time (Sanderson and Harris, 2013). Once it was ensured that all photos were correctly labeled and filed, an Excel file with the metadata from the images was created using R (v4.5.0; R Core Team, 2025). Each line within the Excel file represented each photo in the dataset and included the camera name, location, date, time, species, and number of individuals within that photo. Photos were reviewed and sorted according to bobcat interaction classifications of: crossing, entry, approach, parallel, and a sub classification of scent marking. Four additional columns were added to the Excel file by reviewers: (1) class of interaction, (2) marking, (3) directionality, and (4) reviewer initials. Each interaction was classified as a 30-min period of independence (O’Brien et al., 2003). This was later confirmed by individual identification. The final photo in the series of interaction was given a class, marking, direction, and initials. Although felids may use a variety of scent marking behaviors, such as urine spraying, scraping, defecating, body rubbing, and claw marking (Kleiman and Eisenberg, 1973; Bailey, 1974; Mellen, 1993; Smith et al., 1989; McBride and Sensor, 2012; Allen et al., 2014a, b), only urine spraying and deposition of feces were considered for this study since these marking behaviors could be consistently and accurately captured using camera traps.
2.4 Identifying interactions with individuals
A dataset of 48 distinct interactions was randomly selected from FM 106, with three interaction events at each of the three site types (WCS, FE, and ROW) for each month when cameras were active at each site type. The photos from each interaction were reviewed, and the images with the best quality and angle to see distinguished “points of interest” were used for manual visual identification of the felid(s) in that interaction. “Points of interest” were deemed locations on the individual that were more easily identifiable due to the contrast of black-spotted or striped markings against the lighter color of the body. However, some of the most consistent points of interest were the features of the inner and outer leg markings, tail, and potential patterns on the side of the body depending on the definition of an individual’s spots (Figure 2; Heilbrun et al., 2003; Sequin, 2001). Matches of individuals from different interaction events were made by comparing and confirming at least three of the same features on the body, or by one feature and a radio collar as suggested by Sequin (2001). Two reviewers viewed photos of bobcats independently. To resolve any inter-observer discrepancies, additional confirmed photos of the individual(s) were used as a reference and observers either agreed on identification, or the interaction was labeled as unidentifiable (UNID). The detection of at least one inconsistent spot pattern between the photos was considered enough to declare the bobcats as two distinct individuals. The individuals identified in this process served as the “true matches” to compare the accuracy and efficiency of the HotSpotter program (Nipko et al., 2020).
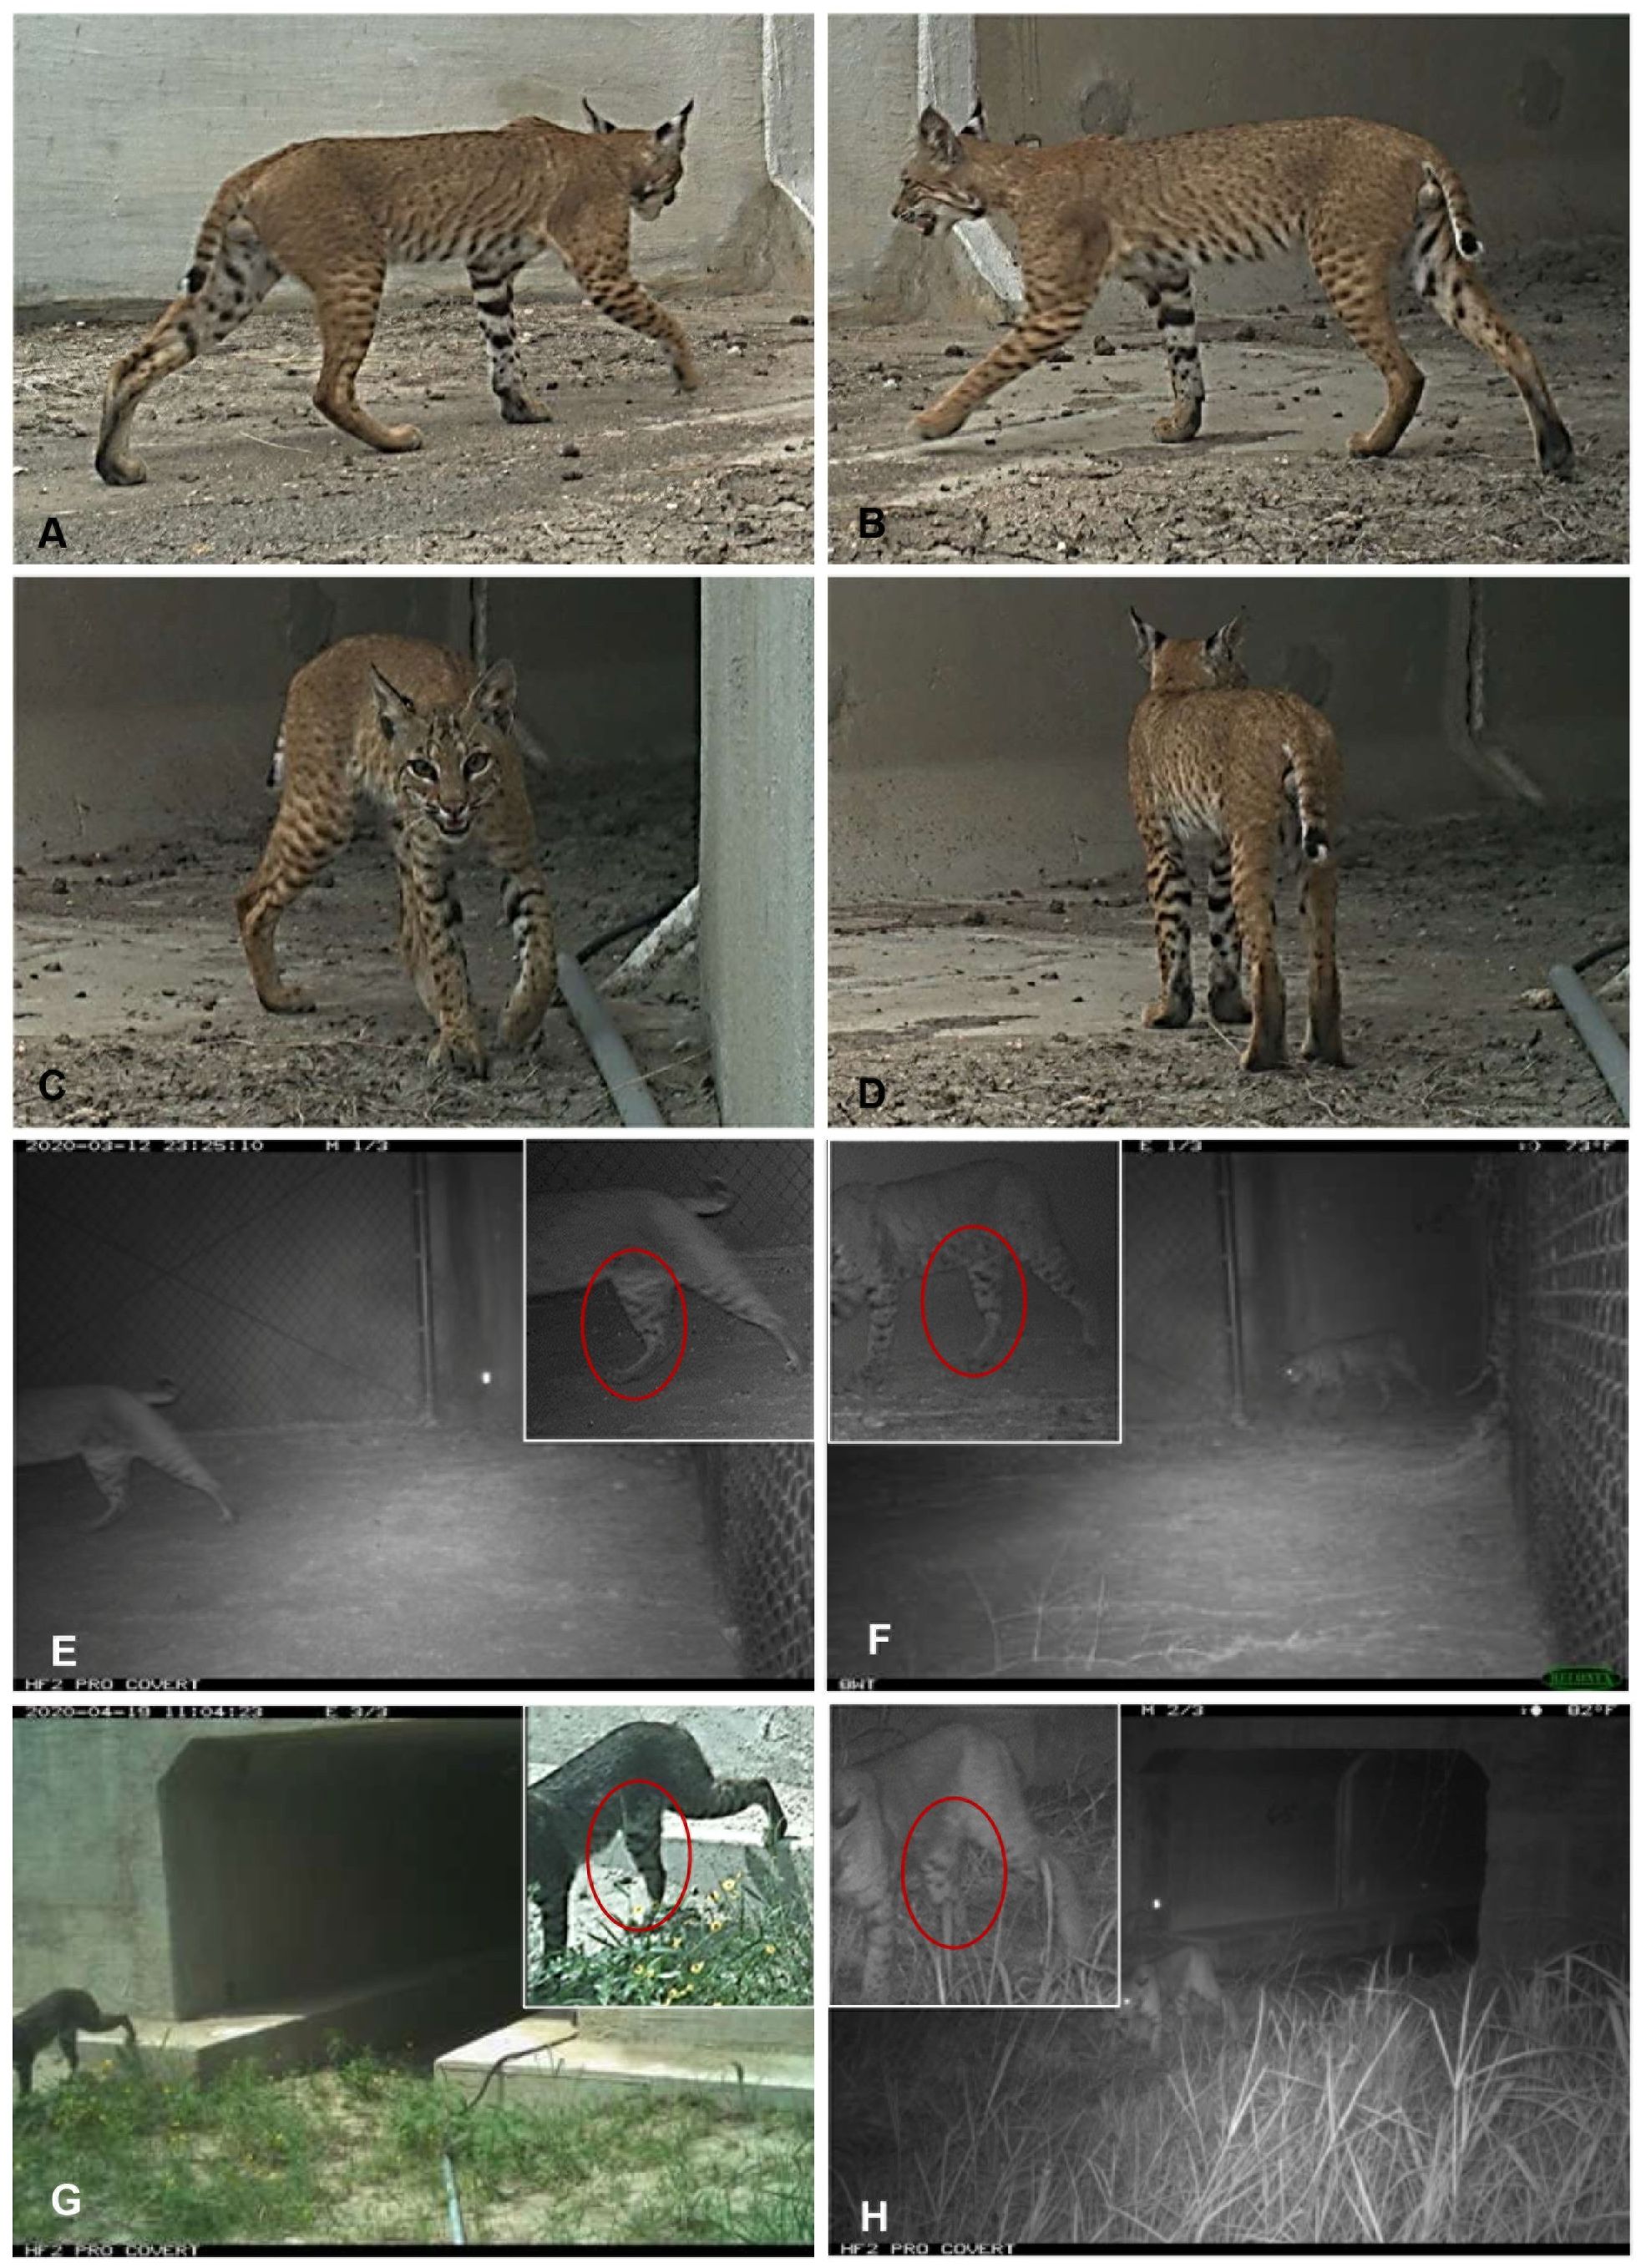
Figure 2. Images of a bobcat captured by camera traps at a wildlife crossing structure along FM 106 in Cameron County, Texas. (A–D) Images of various angles of the same bobcat individual. (E–H) Images of same bobcat individual at the same angle captures at multiple sites for identification.
Images with individuals in the best positioning of the major points of interest were selected from the previous collection of photos of the 48 interaction events used for visual ID. These select images were then uploaded to HotSpotter. One or more image “chips” were created using rectangular selections around points of interest in each photo. Queries were run on each chip to allow the program to search for similarities in patterns. Each query ended in a results window that consisted of the top six matches with a rank and a score that ranges from zero to well above the tens of thousands depending on the strength of the match. True matches show the side-by-side comparison of the selected chip and the chip that HotSpotter matched based on pattern recognition. An array of red, orange, and yellow lines drawn between chips identified proposed matching points among patterns. A “no match” result indicated that no other chip within the library contained patterns that matched the chip being run. This was depicted by a red “X” through the potential matching chip. The results of HotSpotter matches were then compared to those of visual ID to evaluate the program’s success.
The final method tested was a spatio-temporal strategy, used particularly for FE and ROW sites with lower camera coverage. Due to the disproportionate number of camera traps at WCS, FE, and ROW sites (8:1:1), there were much greater odds of capturing multiple identifiable photographs of bobcat “points of interest” at WCS than at FE and ROW. Therefore, when an unidentifiable interaction event occurred at a FE or ROW, the identification of that bobcat was determined based on when and where other interaction events occurred and including bobcat traveling speeds (0.4 ± 0.40 km/h; Elizalde-Arellano et al., 2012; O’Brien et al., 2003) into the interaction interval.
Since each WCS had two camera traps installed on either side, facing the opening of the structure, images of individual bobcats interacting with the WCS were captured at multiple angles to create a complete, or nearly complete composite of the individual to build an identification database. Interactions at WCS were all identified to individual first, to ensure the greatest possibility of capturing the maximum number of photos for each individual observed. Interactions, where only a small portion of an individual was captured in an image, were able to be compared to these large photo databases. Interactions at sites with fewer cameras and therefore less coverage were identified to an individual last after a large identification database of individual bobcats was already established. Interactions with poor photo quality or only photographs of partial body parts that could not be matched with certainty to an existing individual with an established photo database were considered unidentifiable (UNID).
2.5 Calculating crossing and refusal rates
Kintsch et al. (2017) categorized wildlife interactions into three categories (crossing, repel, and parallel) and calculated three rates (Crossing Rate, Repel Rate, and Parallel Rate). We modified these into four categories and calculated crossing and refusal rates. Bobcat interactions at WCS were categorized as:
A = crossing completely from one side of the road to the other
B = entry and exit on the same side of the road
C = approach without entry into WCS
D = merely present/walking parallel to the WCS
Crossing rate = A/(A+B+C)
Refusal rate = (B+C)/(A+B+C)
Those interactions categorized as D were not included in the numerator of the crossing or refusal rate because the individual did not directly interact with the WCS.
2.6 Bobcat usage of site types
The study period used to determine bobcat usage at multiple site types (WCS, FE, and ROW), was defined as the seven-month period in which all site types were being monitored; November 2020 to May 2021. All FE had one camera at each end and on either side of the road. Due to the great distance apart from each other (range 119 m – 1,115 m), each FE camera was treated as a monitoring site. All ROW sites had one camera located on either side of the road within the right-of-way. Each camera at ROW sites was also treated as its monitoring site. All WCS had four cameras monitoring the entire site, with two cameras on either side of the structure that faced the opening of the crossing. Since both cameras on either side of a WCS faced the same direction and had an overlap of coverage, each side of the WCS with two cameras served as one sampling unit.
2.7 Classification of resident and transient individuals
Bobcat individuals were classified as residents or transients based on three criteria: 1) the number of interactions, 2) the ratio of months detected/total months in study period (Schmidt et al., 2020b), and 3) the total period detected in months (Blankenship et al., 2006). Frequency distributions of all three criteria were formed using the data from all bobcat individuals and cut-off points were created based on those distributions. To be considered a resident bobcat, at least two of the following criteria were met: 1) 50 or more interactions, 2) a ratio of 2.66 or greater for months detected/total months in study period, or 3) a span of five or more consecutive months detected. Transients were defined by meeting one or none of these criteria. Juvenile individuals were not included in the analysis, as their movement and behavior at WCS were largely dependent on their mother until their dispersal at around 9 months of age (Hansen, 2007; Reid, 2006).
2.8 Statistical analyses
To determine if there were any differences in bobcat movements between either side of the road at WCS a generalized linear mixed model (GLMM) with a Poisson distribution and fixed factors of canopy cover and direction and a random effect of identified individual was used. The study area included a bend in the road, with traffic coming from FM 510 flowing north and south, and then curving to east and west towards Los Fresnos as all crossings were labelled “east” and “west” (Figure 1). Only successful “A” crossings of WCS were used in this analysis.
To determine the effect of the number of bobcat individuals present on bobcat interactions at WCS, a generalized linear model (GLM) with a Poisson distribution with canopy cover and number of identified individuals as a factor was used.
An ANOVA with canopy cover as a factor was used to determine if resident or transient bobcats were observed at WCS more often. To determine if sex or residency status affects marking events a GLM with a negative binomial distribution was used with factors of sex and residency status (resident or transient).
Since the construction of some WCS on FM106 were completed before other WCS were started, some bobcats likely habituated to WCS before our camera monitoring began. To account for this, bobcats observed in the first 25 days of camera monitoring were excluded from the dataset. This resulted in a dataset of 31 individuals that were observed at a WCS for the first time and nine individuals that interacted with two consecutive WCS for the first time. An additional consideration was made for a difference in the total number of interactions for individuals included in this study. For each additional interaction after the initial encounter at a WCS, crossing and refusal rates were summed for all individuals, and a percentage ratio was calculated for up to 100 interactions.
To determine if the number of crossings at WCS by individual bobcats increased with time since their first interaction, a linear regression was used. Linear regression was also used to determine if bobcats interacted with WCS more often as they became habituated to the structure. A maximum of the first 100 interactions were considered for individuals (mean = 25.73 ± 4.81), and the number of days between each interaction was averaged for the individuals. A Welch’s t-test was used to compare the number of interactions required for an individual to successfully cross at the first WCS they encountered vs the second WCS they encountered.
For ANOVAs and linear regressions, assumptions were tested with Q-Q plots and histograms and transformations were applied to the data where necessary (Anderson and Burnham, 2004). For significant factors in ANOVAs, pairwise comparisons were conducted with Tukey’s post-hoc test. ANOVAs and linear regressions were conducted in IBM SPSS version 28.0. GLMs and GLMMs were conducted using package “lme4” in R (v4.5.0; R Core Team, 2025). Appropriate models were selected by comparison of residuals and AICc values. A significance level of p ≤ 0.05 was used across all statistical tests to determine significance. Data are presented as mean ± SD unless otherwise noted.
3 Results
3.1 Identification of individual bobcats
3.1.1 Manual visual identification of bobcats
Bobcat interactions occurred at all three site types (WCS, FE, ROW) with 48 interactions selected for analysis. Of the 48 interactions selected across all three site types, 20 distinct bobcats were visually identified in 41 of the interactions. The individuals in seven of the interactions were not identified due to poor photo quality, insufficient number of photos, and/or poor angles for looking at points of interest. This equated to an 85% identification success rate.
3.1.2 HotSpotter algorithm of bobcat identification
A total of 710 chips were created from the 316 photos uploaded to HotSpotter; 71 chips did not provide a suitable image to run a query and had to be deleted. Three hundred forty-seven chips were declared by HotSpotter as matches and 292 chips resulted in no match. These initial chip query outcomes resulted in 41% no matches, 49% matches, and 10% of chips that needed to be deleted. After further analysis of these results by cross-referencing HotSpotter matches to those made using visual identification, many misidentifications were noted. HotSpotter determined 286 chips had no matches. However, these matches were confirmed with visual identification. Of the 347 chips that HotSpotter declared as matches, 253 or 73% of total matched were those made with the ground within the photo (either from the individual bobcat to the ground or from the ground to the ground), 44 or 13% of total matches were mismatches (a match made between differing body parts of individuals; for example: a line drawn as a match between an outer hind limb and inner forelimb), and 37 or 11% of total matches were those that could not be confirmed by visual identification, and therefore, deemed a false match (Figure 3A). Of the 49% of matches that HotSpotter identified as successful, only 2% were correct matches confirmed by visual identification, with an additional 1% of chips that correctly resulted in no match when cross referenced with visual identification, resulting in a 3% total success rate and a failure rate of 97% (Figure 3B).
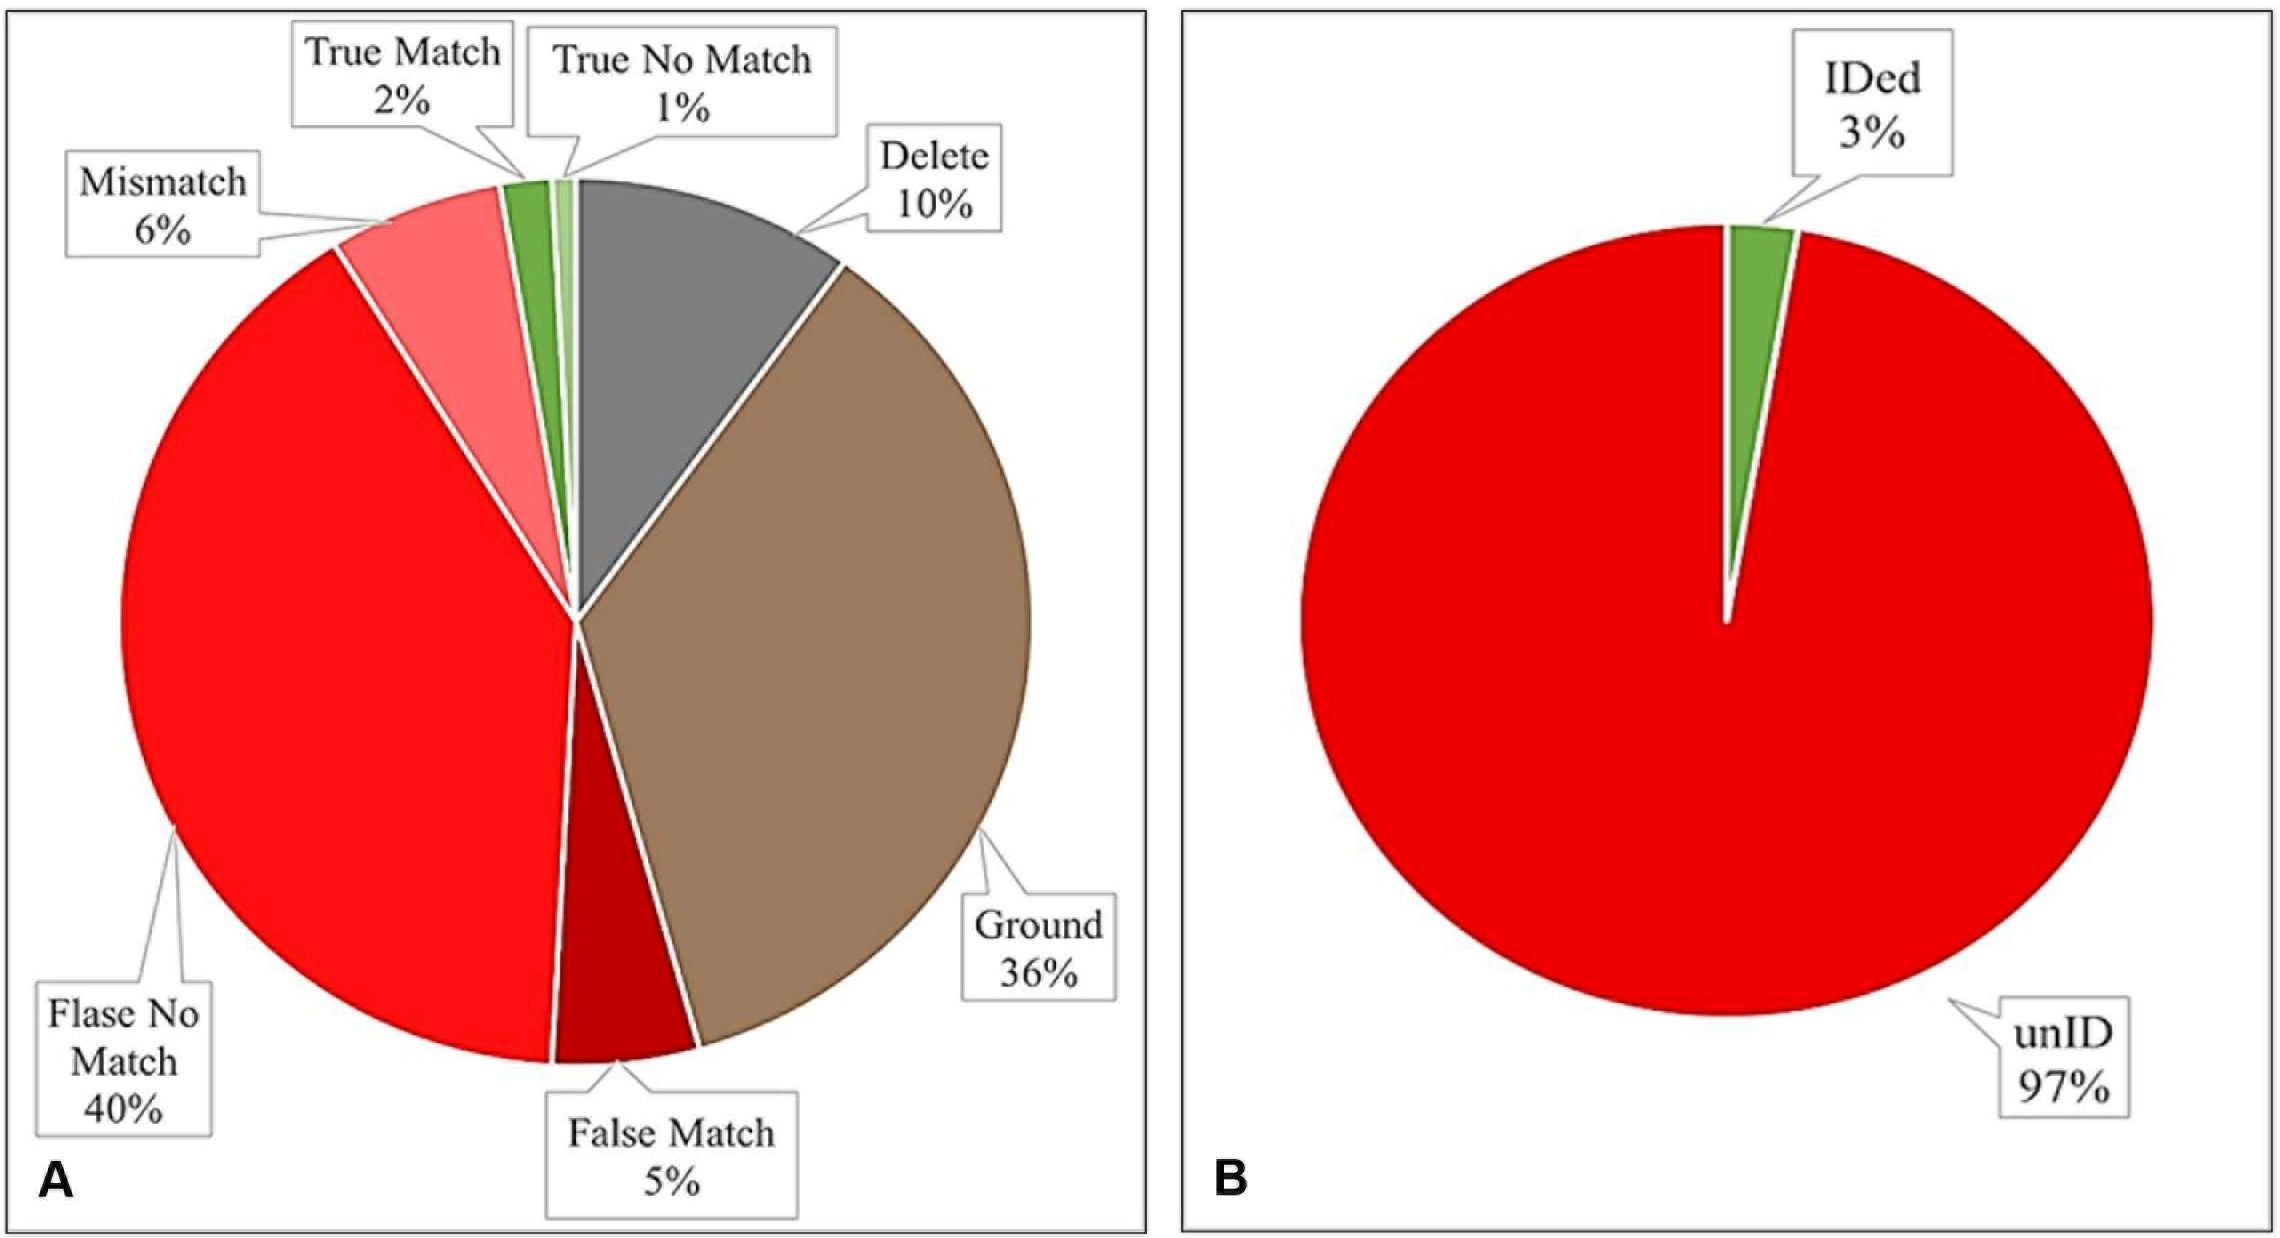
Figure 3. Results of the pattern recognition software, HotSpotter, tested to identify bobcats to individual using camera trap images captured at road mitigation sites along FM 106 in Cameron, County, Texas. (A) Defined as true (green), false (red), and unusable results (gray and brown). (B) HotSpotter had a 3% success rate in identifying bobcats to individuals.
3.1.3 Spatio-temporal strategy of bobcat identification
ROW sites were not able to be analyzed, as there were not enough consecutive interactions within an appropriate distance and time to infer an individual’s identity based on the previous site it was observed. The spatio-temporal strategy of identification was used for 79 bobcat interactions at FEs that fit within the estimated time interval of an individual bobcat also being observed at the nearest WCS. Seventy-eight of these interactions at FEs had sufficient image quality and number to successfully compare and confirm their identities via manual visual identification to those observed at the nearest WCS within a period based on predicted traveling speeds. In 90% of FE interactions where the spatio-temporal strategy for identification was used, identities were confirmed as the individual that were observed at the nearest WCS. If only the spatio-temporal strategy had been used to identify FE interactions, without the additional confirmation from the manual visual identification methods, 9% of these FE interactions would have resulted in incorrect identities. Only one interaction of the total 79 interactions did not have sufficient image quality or quantity to confirm the individual’s identity via manual visual identification.
3.2 Abundance and direction of bobcat movement at WCS
During the 18-month study period, 42,297 photos of bobcats and 2,338 interactions were captured across the entire study. At WCS, 39,722 bobcat photos and 2,000 unique interactions were captured. FE and ROW sites monitored during the last seven months of the study captured 2,552 bobcat photos and 338 interactions. This resulted in a 96% success rate for identifying the individuals conducting an interaction across all sites along FM 106. Only 4% of the total interactions (93 interactions) captured were unable to be identified as individuals due to poor photo quality, inadequate angles for capturing unique markings, an insufficient number of photos to confirm an identity, or a combination of these. Seventy-eight individual bobcats were identified across the 23 sites along FM 106 including:17 residents, 52 transients, and 9 juveniles (not included in the analysis) (Figure 4A). At WCS, 76.4% of the 72 bobcat individuals had a higher crossing rate than refusal rate (Figure 4B). More bobcat individuals (44 out of 72) had a crossing rate of 75% or greater (Figure 4C).
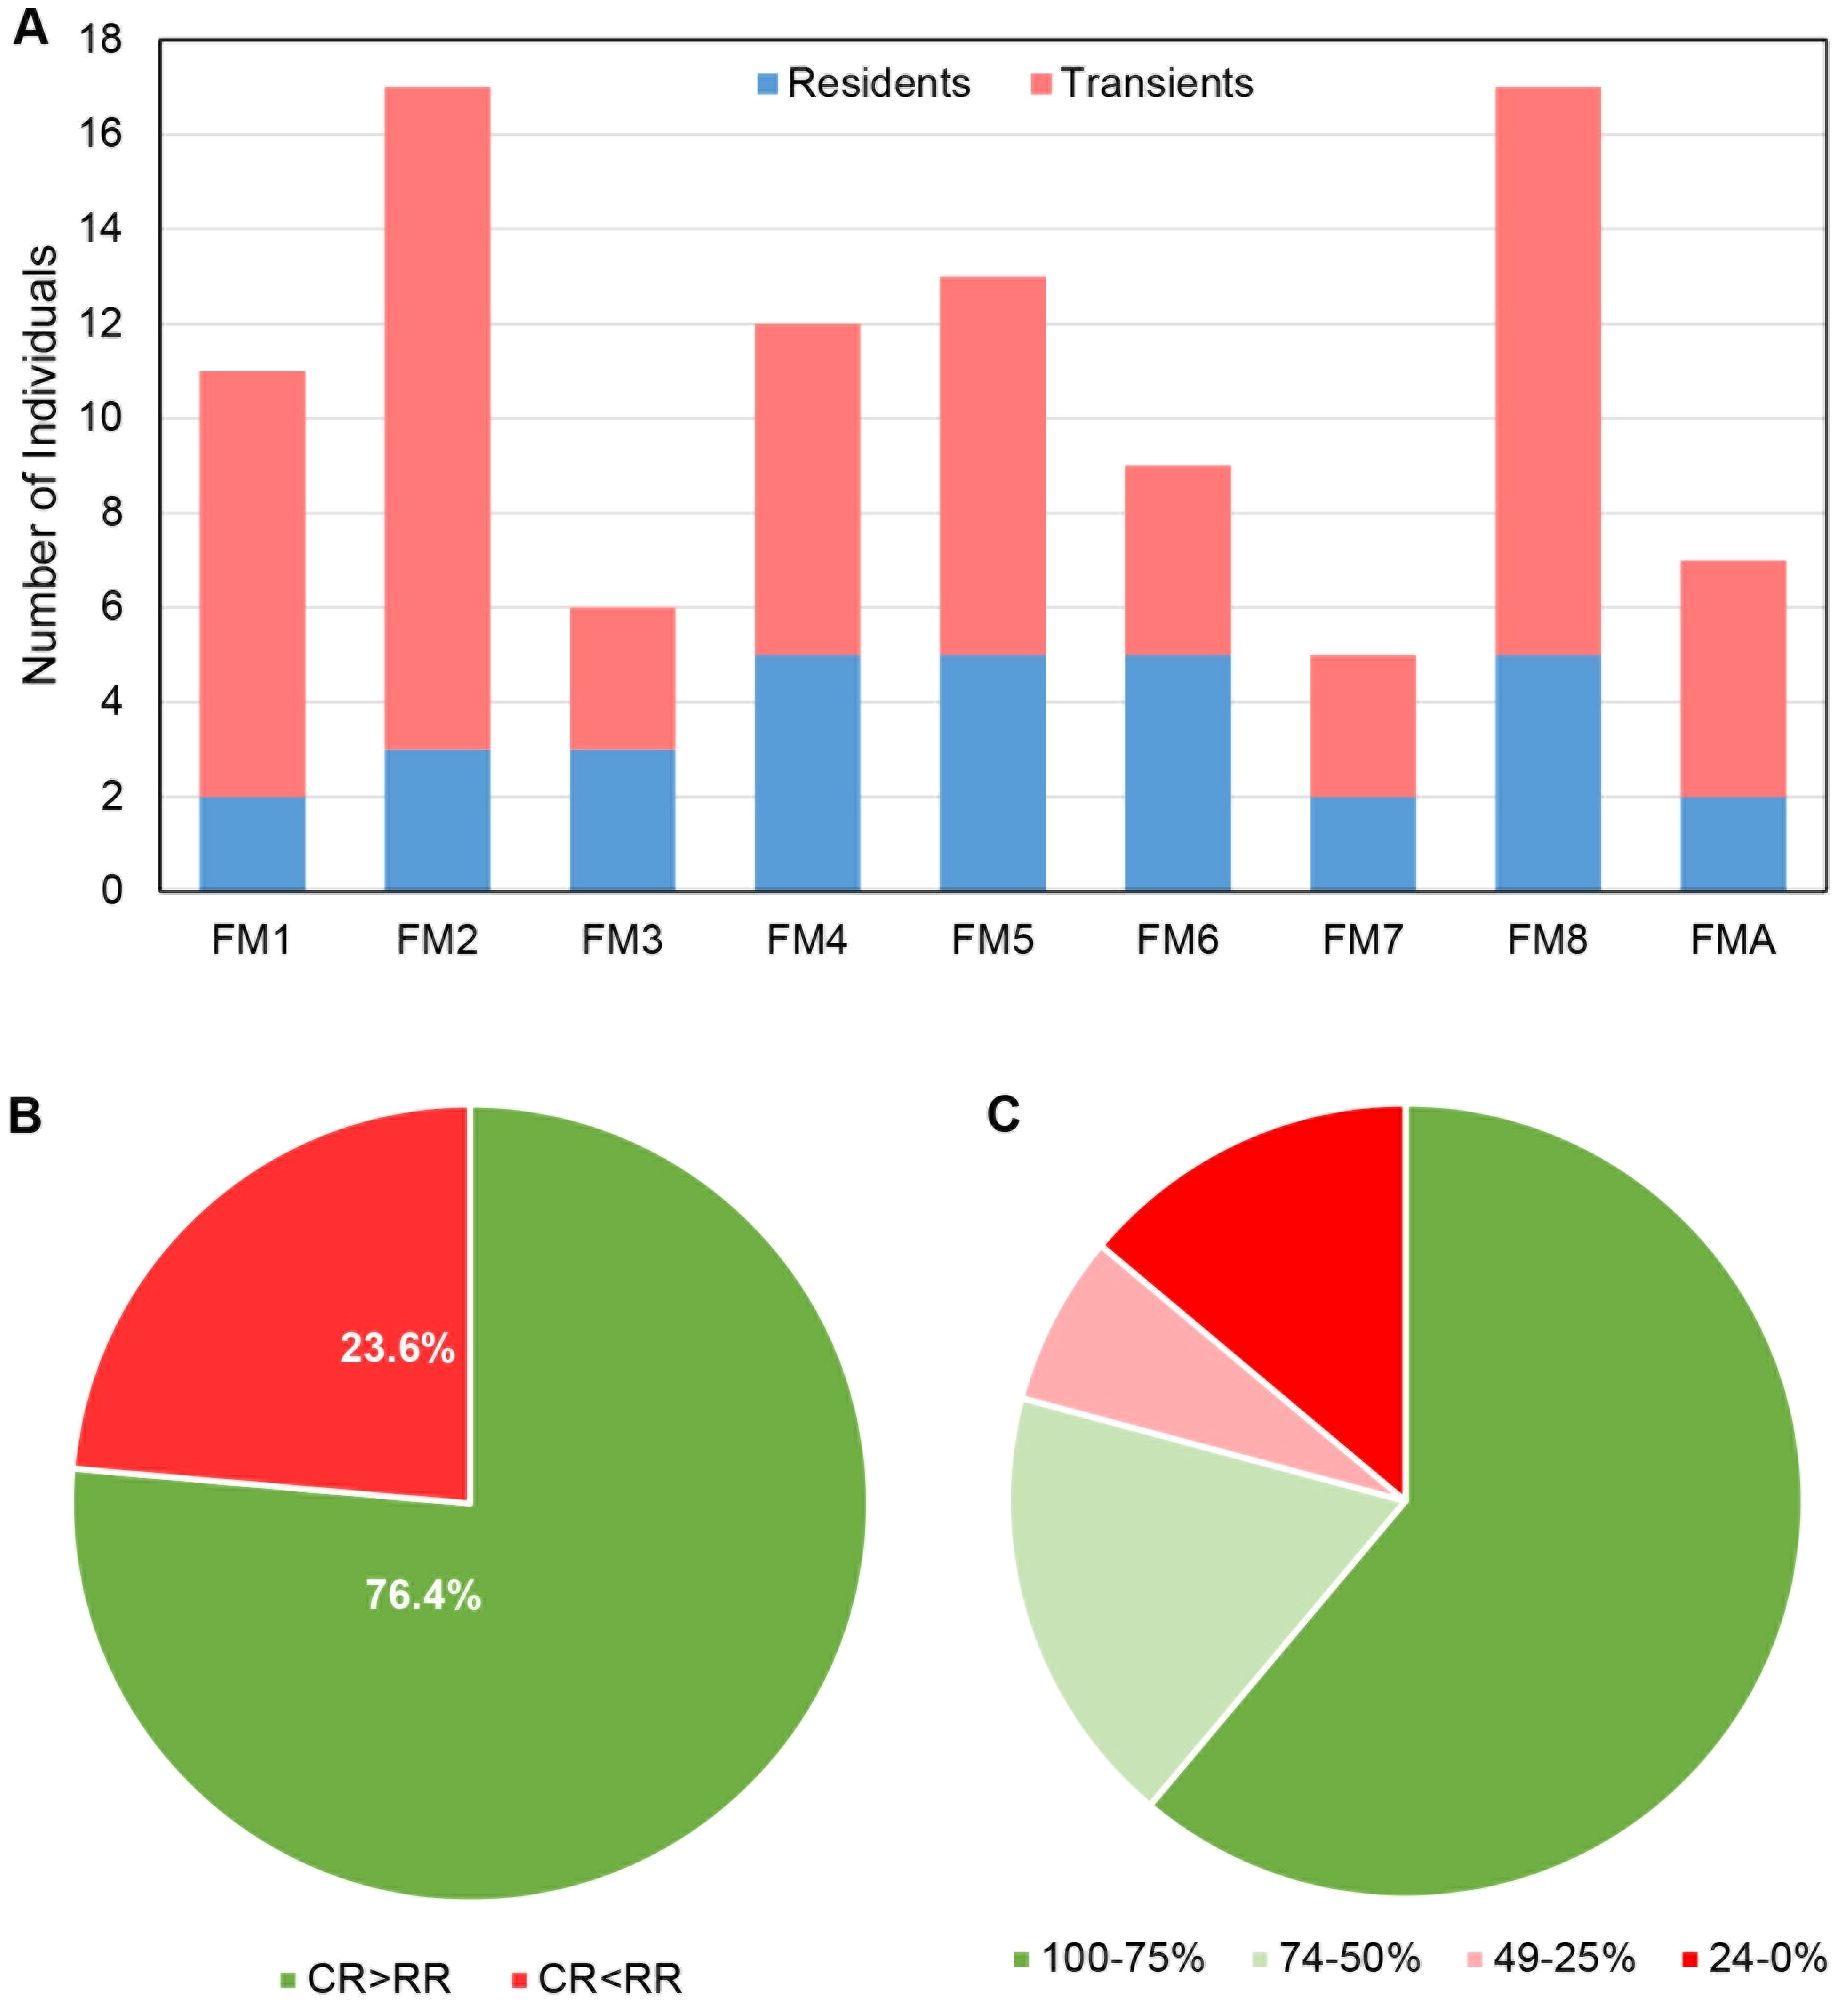
Figure 4. Comparison of individual bobcat movement along FM 106 in Cameron County, Texas. (A) Comparison of the number resident vs transient bobcat individuals at wildlife crossing structures (WCS). (B) Comparison of the percentage of individual bobcats that had a greater crossing rate (CR) at WCS along FM 106 to those that had a greater refusal rate (RR) at WCS during interaction events. 55 individuals had a higher crossing rate, and 17 individuals had a higher refusal rate. (C) Comparison of the crossing rates of individual bobcats at WCS along FM 106. Most individuals had a 75% or higher crossing rate (44 individuals).
Canopy cover was a significant predictor of bobcat crossings, with more crossings occurring in dense canopy cover than in mixed or open areas (GLM: χ²(2) = 192.44, p < 0.001). However, bobcat direction of travel (east–west or west–east) was not significant (χ²(1) = 0.09, p = 0.768), nor was the interaction between canopy cover and direction of movement (χ²(2) = 2.63, p = 0.269; Figure 5).
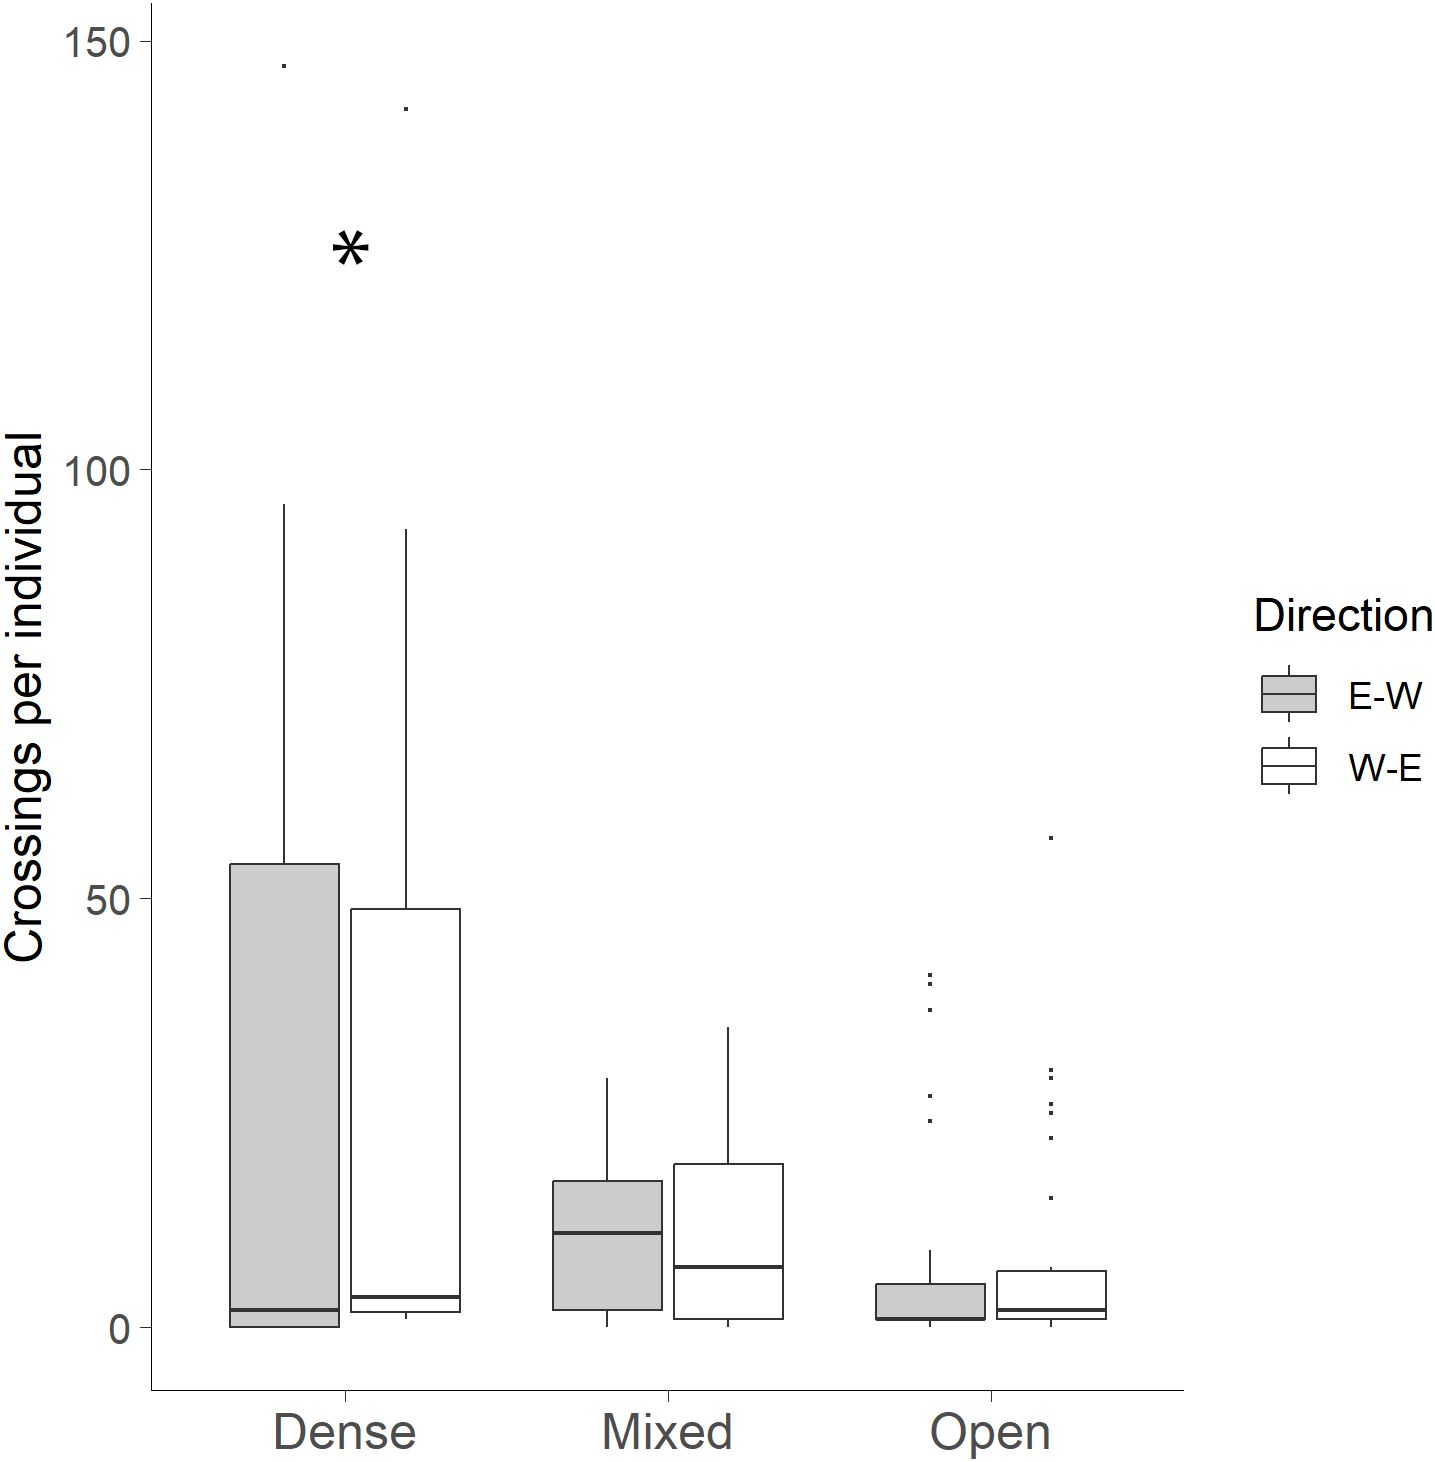
Figure 5. Comparison of the direction of bobcat movement utilizing wildlife crossing structures to travel to the east or west side of FM 106 in Cameron County, Texas. Only interactions where a full crossing occurred were used to determine directional movement towards either side of the road per individual bobcat with vegetation categories: dense (70-100%), mixed (31-69%) and open (0-30%). Canopy cover was a significant predictor of bobcat crossings (*p < 0.001). Bobcat direction of travel (east–west or west–east) was not significant (p = 0.768), nor was the interaction between canopy cover and direction of movement (p = 0.269).
The number of bobcat individuals at a WCS per month was a significant predictor of the number of bobcat interactions (GLM: β = 0.19, SE = 0.04, χ²(1) = 95.90, p < 0.001). More bobcat interactions occurred at WCS per month under dense canopy cover than at mixed or open canopy cover (GLM: χ²(2) = 190.50, p < 0.001; Figure 6).
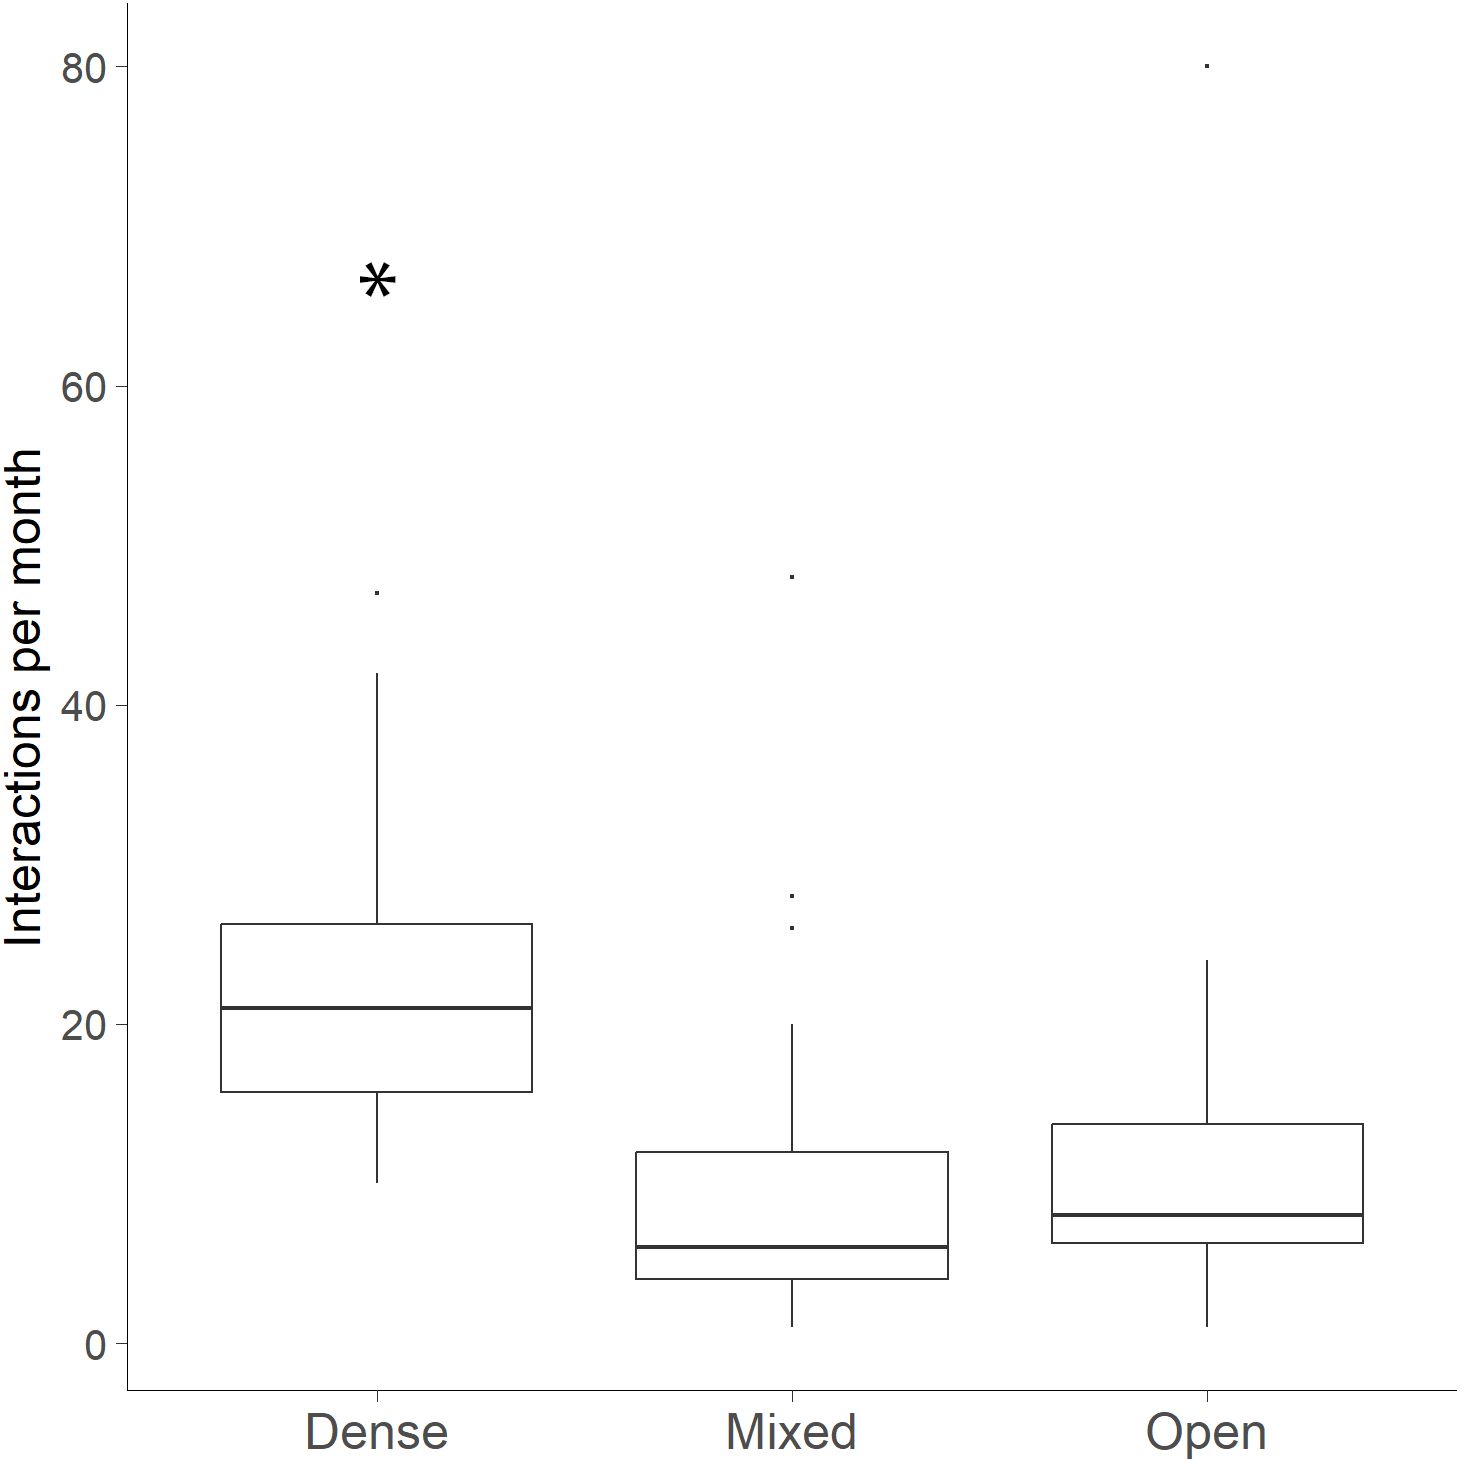
Figure 6. Number of bobcat interactions per month at wildlife crossing structures at three vegetation categories: dense (70-100%), mixed (31-69%) and open (0-30%) along FM 106. More bobcat interactions occurred at WCS per month under dense canopy cover than at mixed or open canopy cover (*p < 0.001).
A total of 40 bobcat individuals accounted for 1,071 combined interactions at WCS, FE, and ROW sites. Of these, 28 bobcats used WCS, seven used FE, and four used ROW. Site type was a significant predictor of the number of interactions per individual (GLM: χ²(2) = 46.91, p < 0.001), with higher interaction rates at WCS (20.10 ± 32.82) compared to FE (4.95 ± 7.43) and ROW (1.72 ± 4.39; Figure 7).
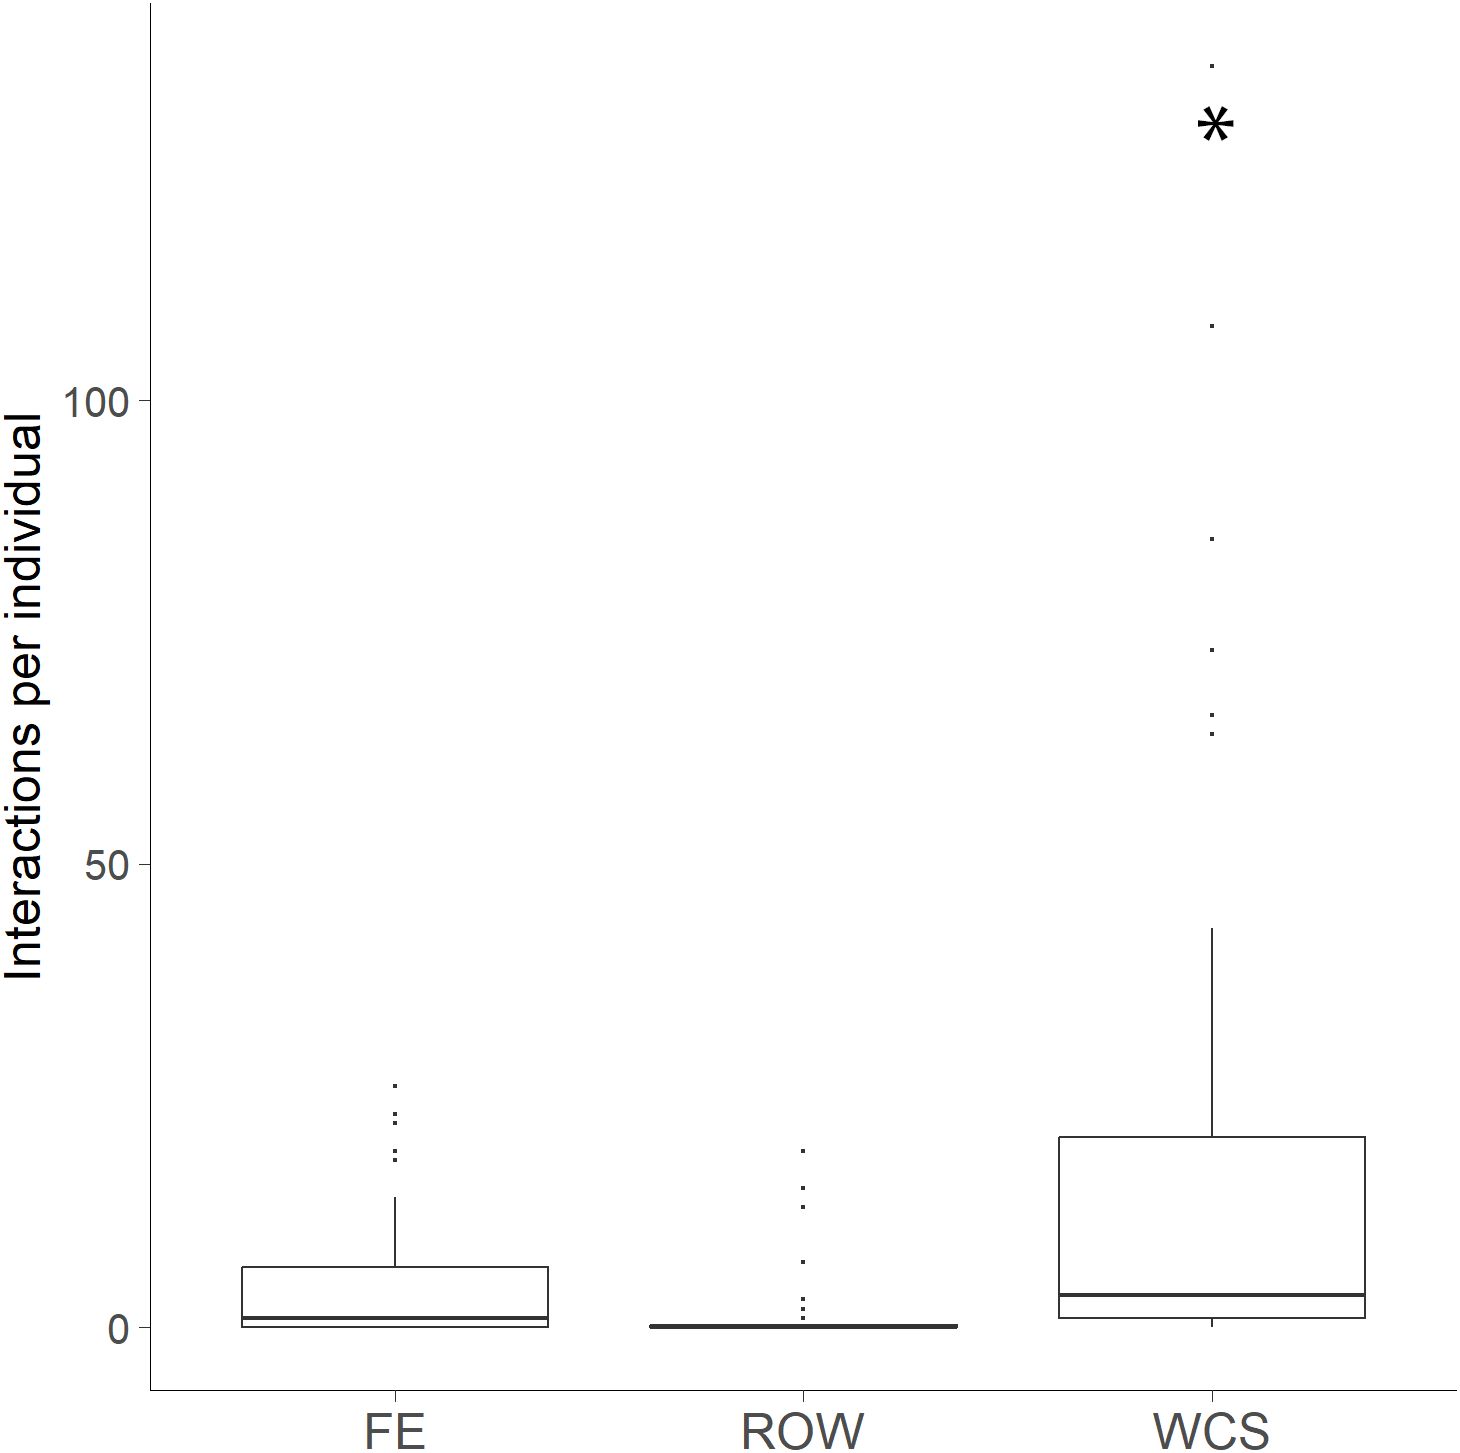
Figure 7. Individual bobcat interactions at each site type: fence end (FE), right-of-way (ROW) and wildlife crossing structures (WCS) along FM 106 in Cameron County, Texas. Individual bobcats interact with WCS significantly more than FE and ROWs. Site type was a significant predictor of the number of interactions per individual (*p < 0.001) with higher interaction rates at WCS compared to FE and ROW sites.
There was a significant effect of residency status on the number of interactions (ANOVA: F(1, 86) = 167.71, p < 0.001), with resident individuals (26.93 ± 15.69) showing more interactions at WCS than transients (5.61 ± 6.39) per canopy cover class and month. The interaction between canopy cover class and residency status was also significant (F(2, 86) = 47.88, p < 0.001). Tukey post hoc comparisons revealed significantly more resident interactions at dense sites than at mixed and open canopy sites (Figure 8).
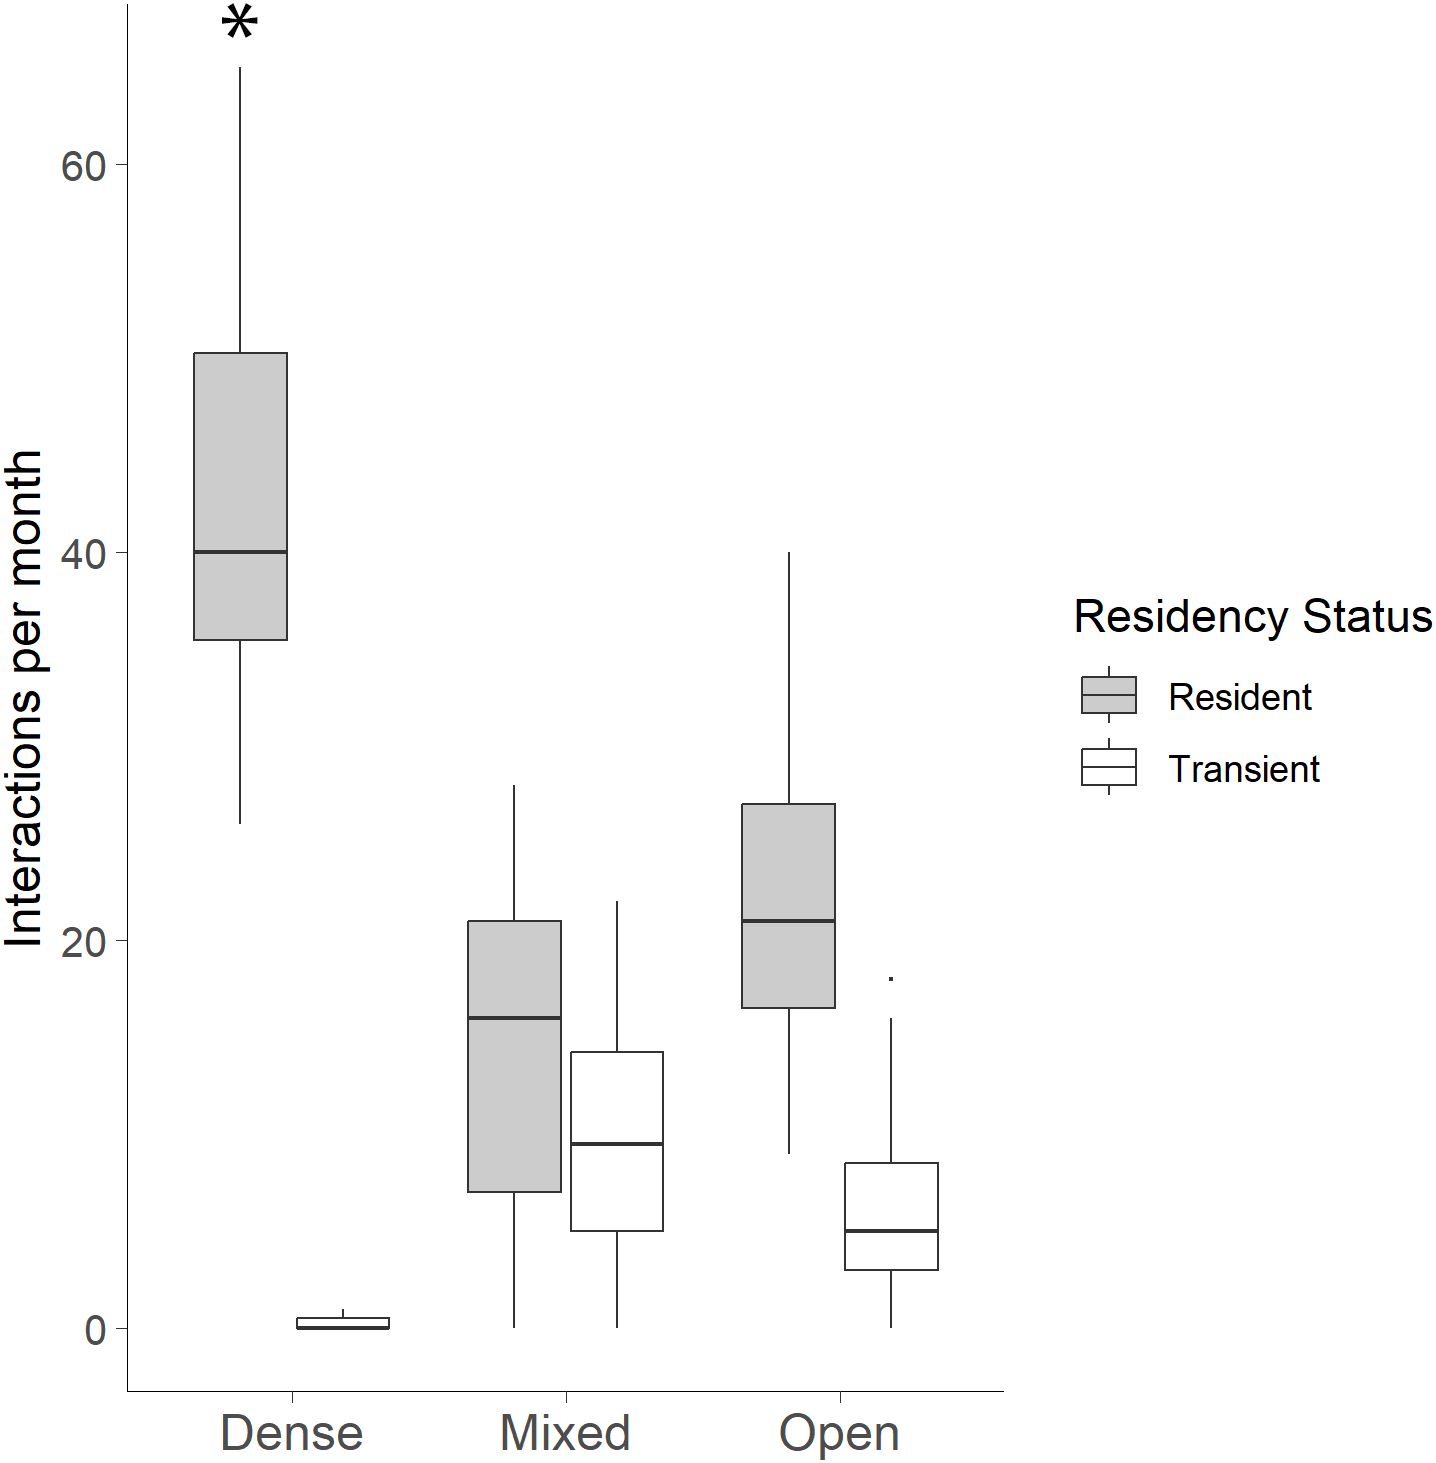
Figure 8. Bobcat interactions per month by residency status and vegetation type. Resident bobcats interacted with dense sites significantly more than at mixed and open sites (*p < 0.001) while transient bobcats interacted significantly more at mixed and open sites than at dense sites.
For marking behaviors at WCS, bobcat sex was not a significant factor (χ²(1) = 0.10, p = 0.749; Figure 9), with neither males (19.88 ± 35.54) nor females (13.56 ± 23.30) marking significantly more per site. However, residency status significantly affected marking behavior, with residents (30.13 ± 37.74) marking more frequently than transients (3.31 ± 4.36; χ²(1) = 18.56, p < 0.001; Figure 9). Additionally, the number of bobcat marking events per month was a significant predictor of the number of interactions at each WCS per month (R² = 0.368, p < 0.001; Figure 10).
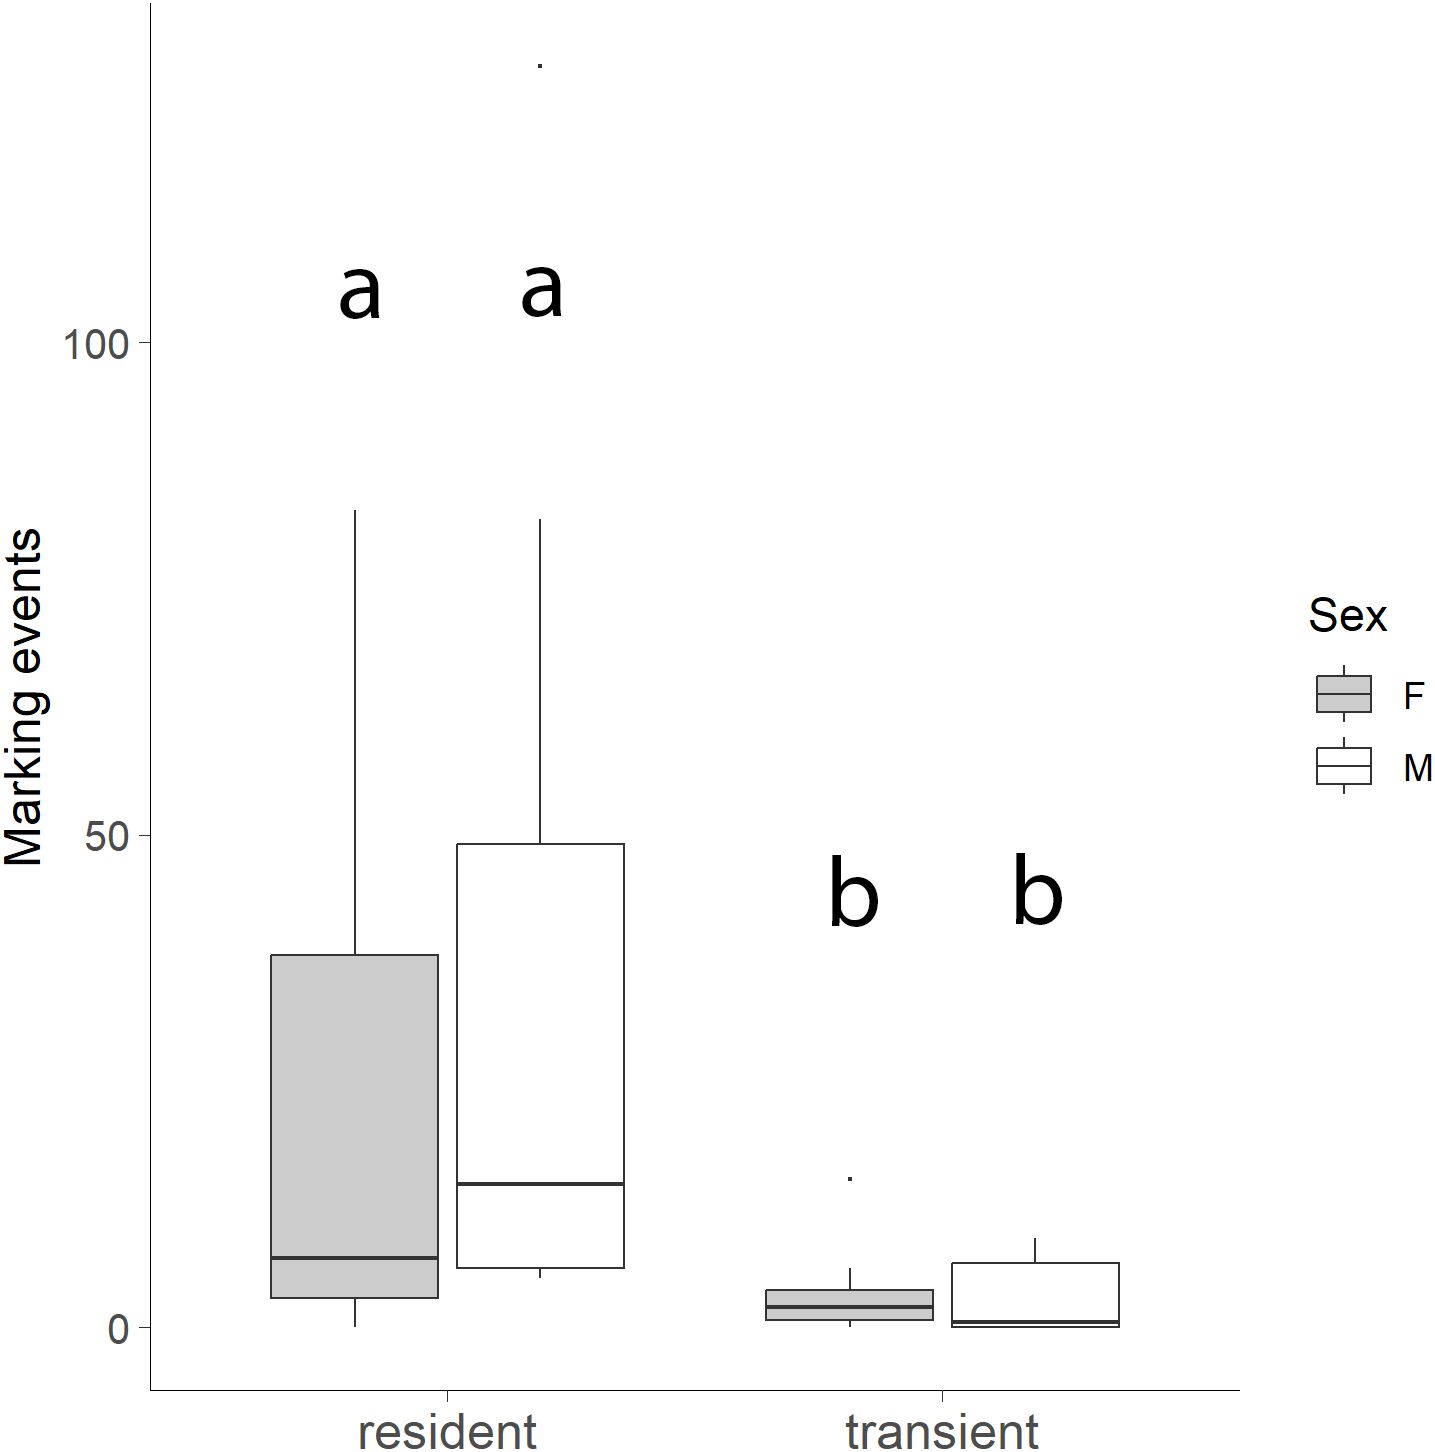
Figure 9. Number of marking events at wildlife crossing structures (WCS) by resident vs transient individuals and by sex. Resident bobcats marked WCS significantly more than transient bobcats (p < 0.001). Bobcat sex was not a significant factor with neither males nor females marking more per site (p = 0.749).
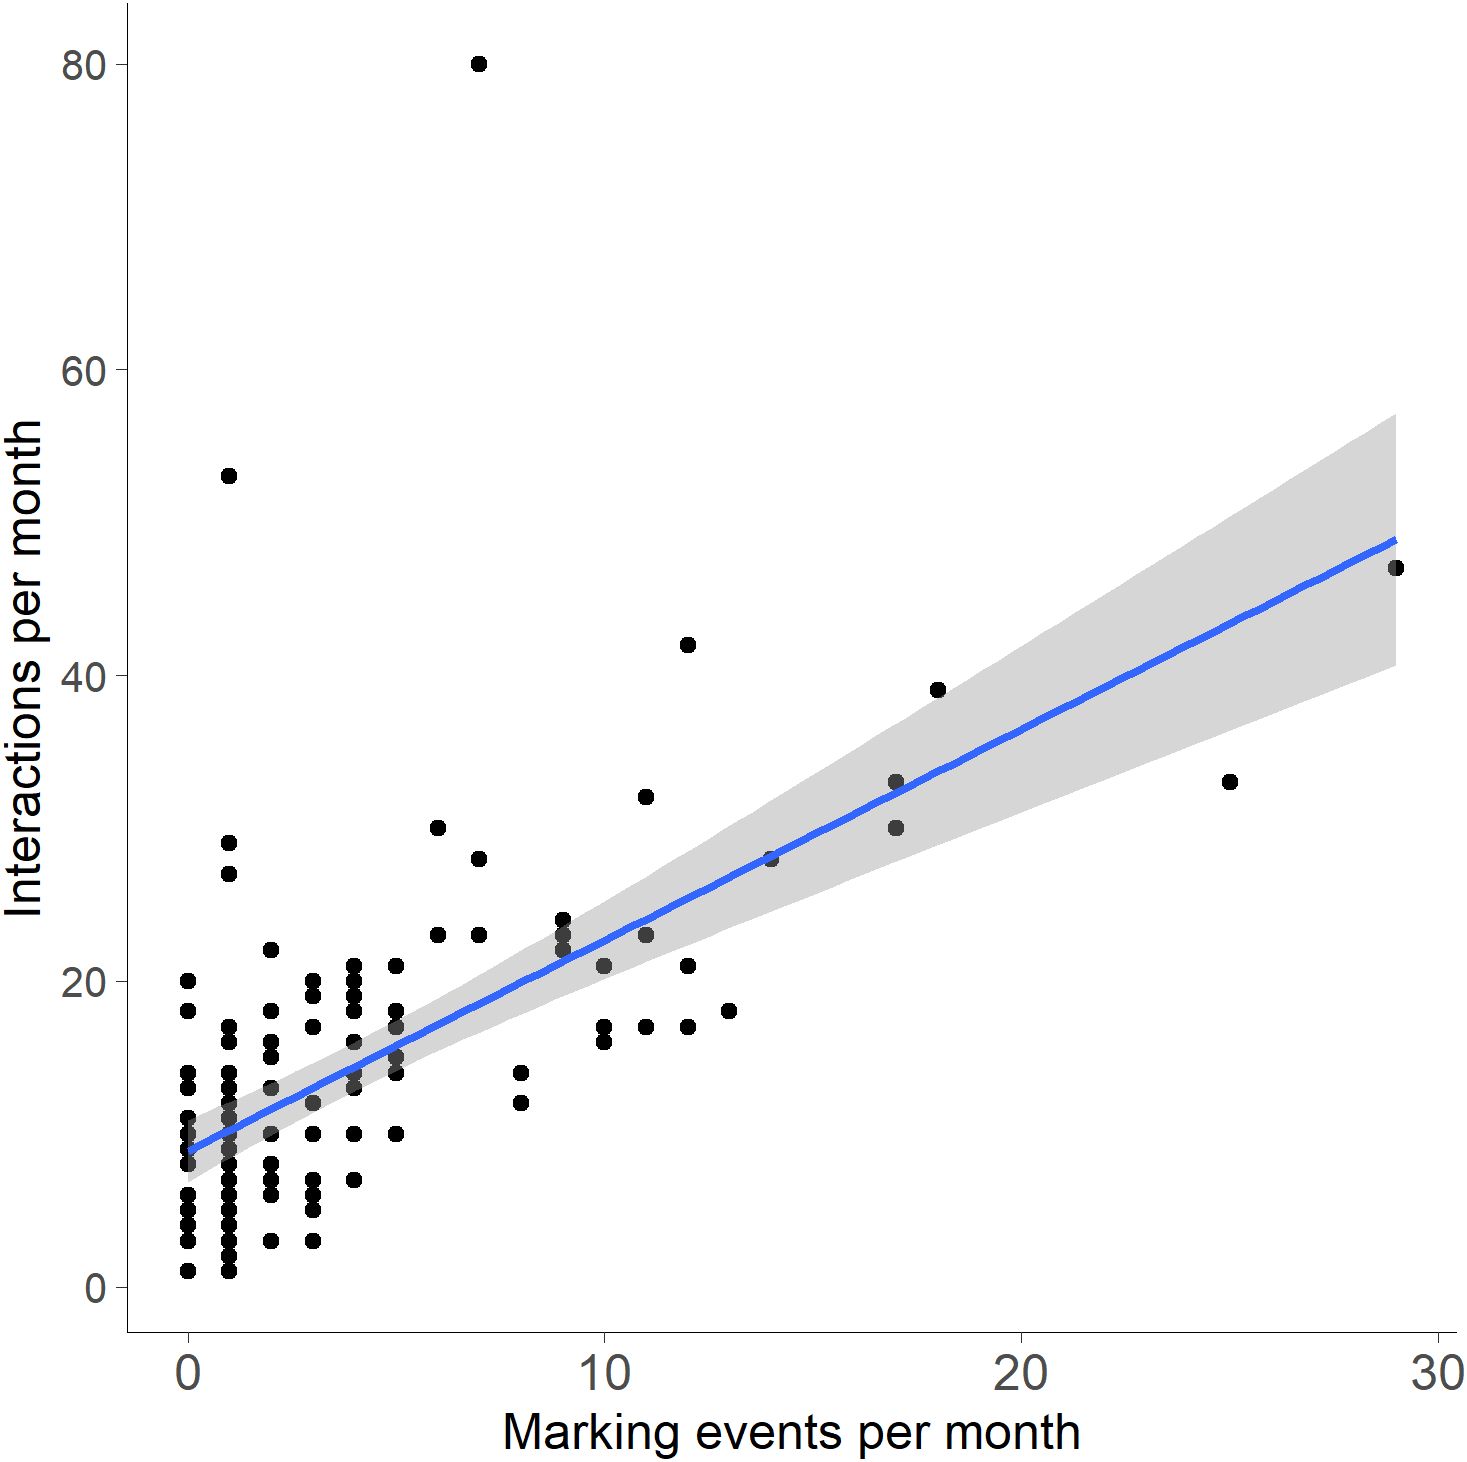
Figure 10. Bobcat interactions per month by marking events per month at wildlife crossing structures (WCS) along FM 106. Linear regression results showed the number of bobcat marking events at WCS was a significant predictor of the number of bobcat interactions at WCS (R² = 0.368, p < 0.001).
3.3 Bobcat behavior at WCS
The number of interactions before a successful crossing at the first wildlife crossing structure (WCS) an individual encountered (1.6 ± 0.24) compared to the second WCS encountered by the same individual (1.1 ± 0.11) indicated that the habituation periods were not significantly different (t(8) = 2.306, p = 0.104). The number of crossings at WCS vs. time since first interaction was also not significant (R²=0.00006, p=0.941; Figure 11). However, the number of days between interactions decreased as the number of interactions since initial contact with a WCS increased, indicating that bobcats interacted more frequently with the structure over time (R² = 0.346, p < 0.001; Figure 12).
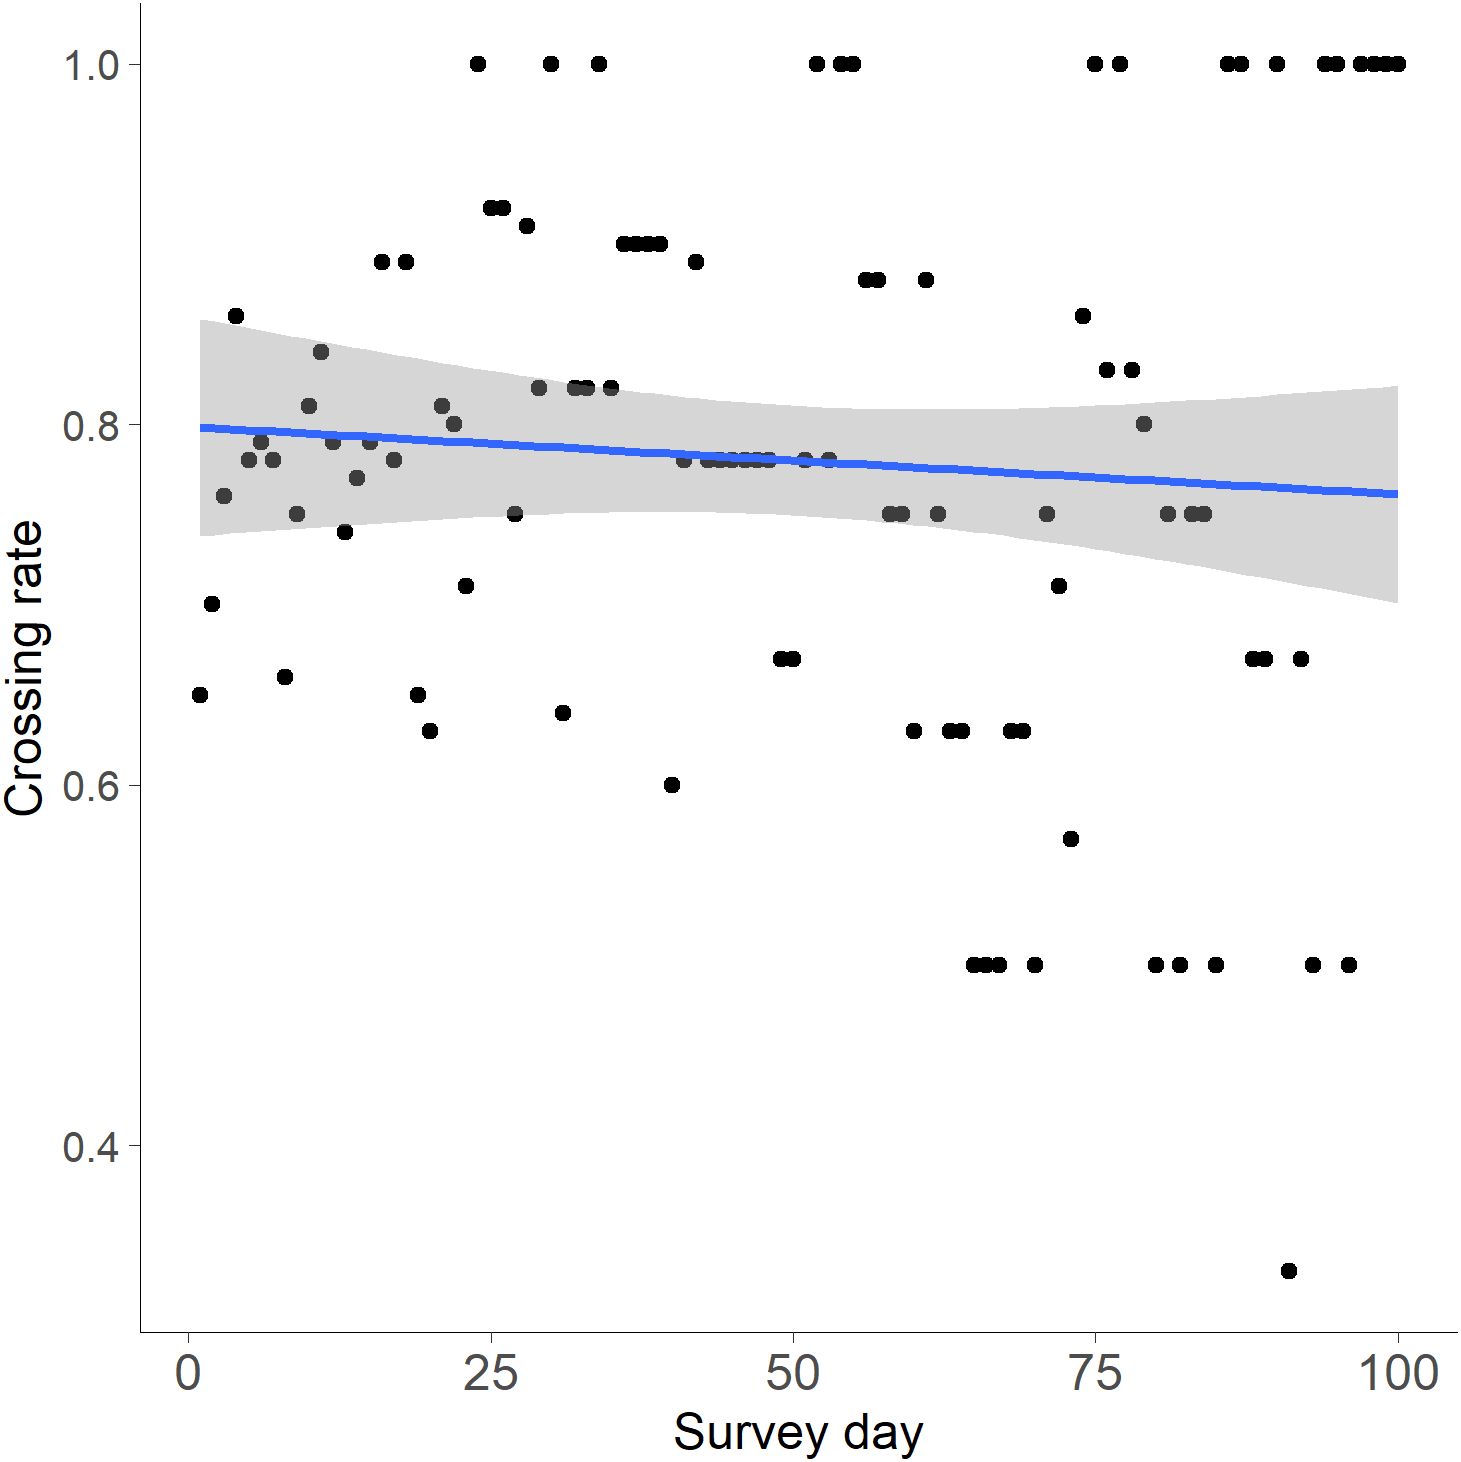
Figure 11. Linear regression of the number of days from an individual’s first interaction at a wildlife crossing structure (WCS) to the crossing rate at WCS along FM 106 in Cameron County, Texas. The number of crossings at WCS vs. time since first interaction was also not significant (R²=0.00006, p=0.941).
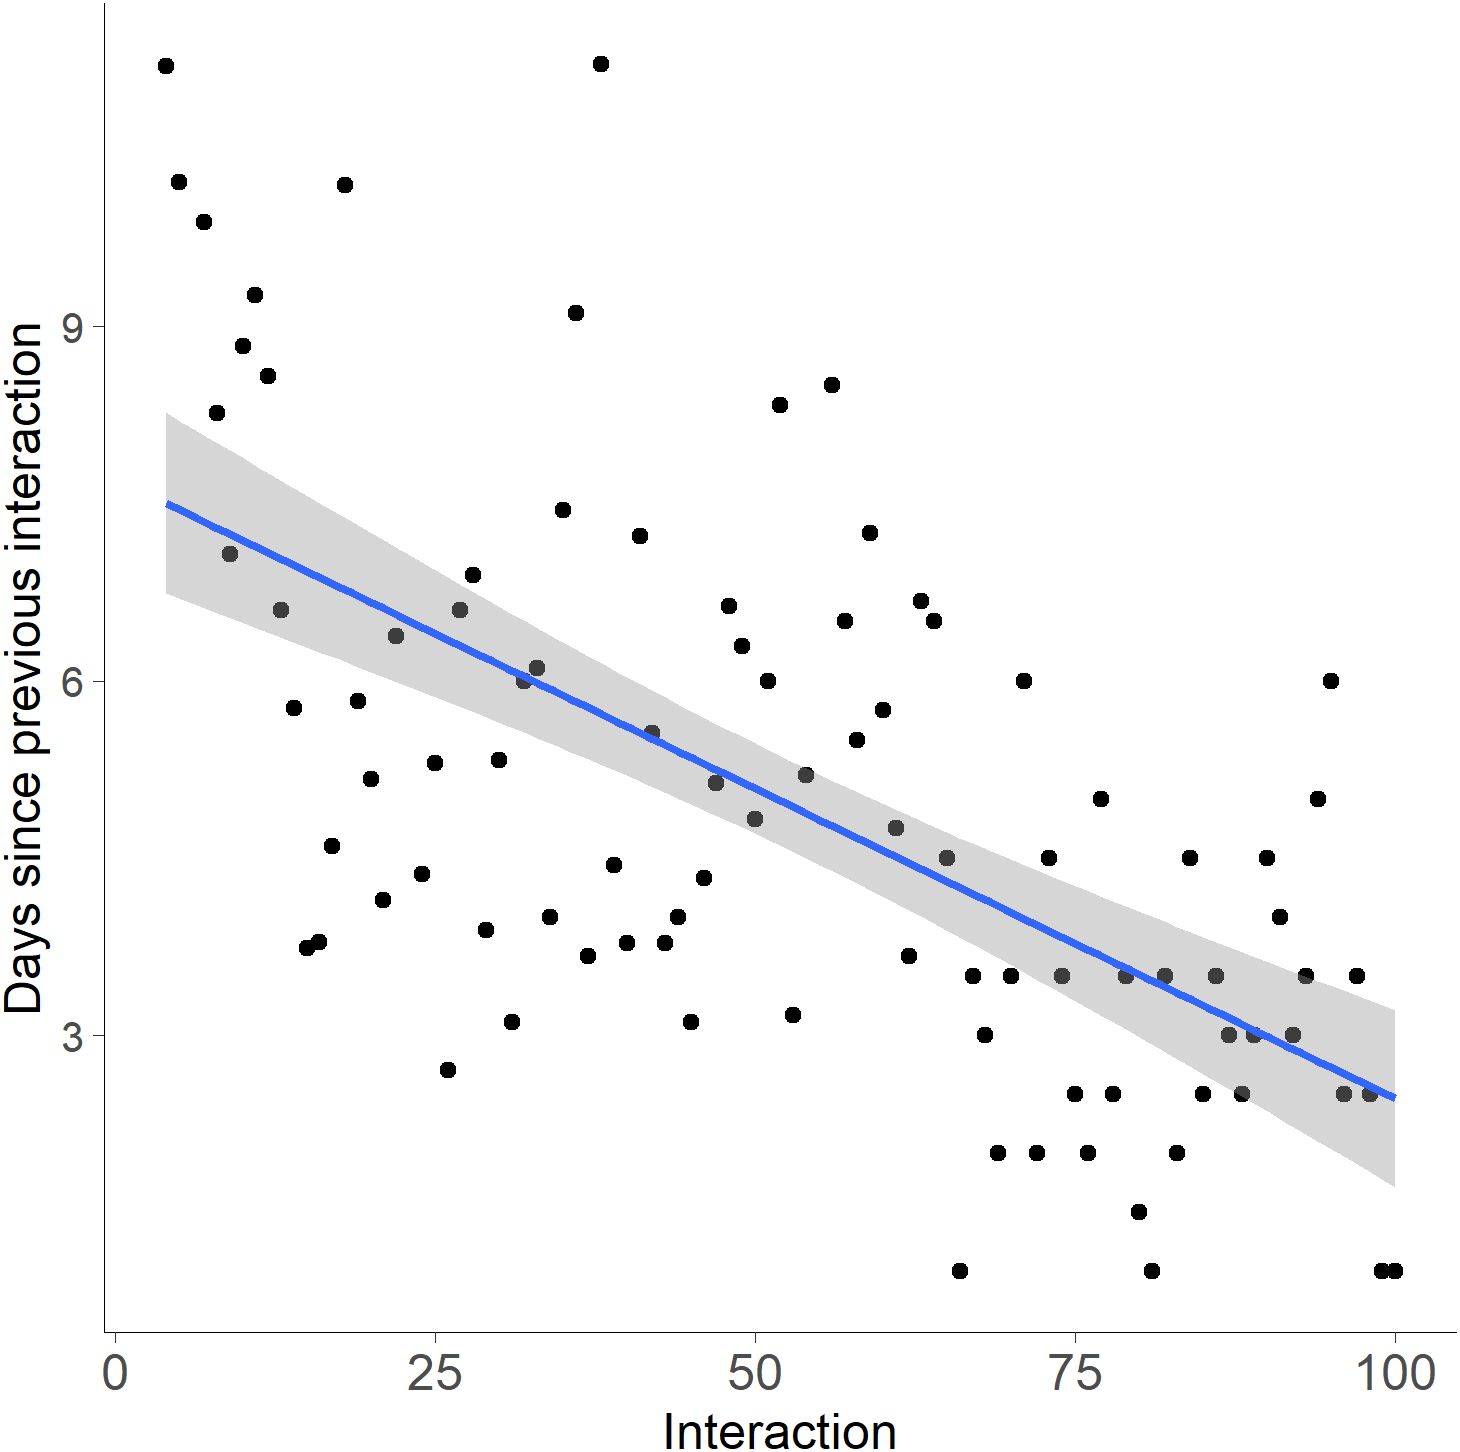
Figure 12. Linear regression of the number of interactions vs. the number of days between bobcat individual interaction events at wildlife crossing structures (WCS). The average days in between interactions were counted starting from the first interaction with a WCS. There was a significant reduction in days between interactions as the number of interactions with WCS increased, indicating that bobcats interacted more frequently with the structure over time (R² = 0.346, p < 0.001).
4 Discussion
4.1 Identification of bobcats
Based on the large differences in success rates between the two methods tested for identifying bobcats to individuals via camera trap photos, the expectation that HotSpotter would outperform visual ID was not supported. Nipko et al. (2020) demonstrated that HotSpotter outperformed Wild-ID in the proportion of matches for jaguar and ocelot images in Belize. However, in our study, HotSpotter only had a 3% identification success for bobcats. There are several potential reasons why it was unsuccessful. Though jaguars, ocelots, and bobcats have individually distinct natural markings (Nipko et al., 2020), jaguars and ocelots are consistently darker blotches than bobcats and their markings have a greater contrast to the lighter color of their main coat, creating distinct spots and blotches, making it easy to distinguish between individuals. The coat patterns of bobcats in South Texas can vary from dark black spots that highly contrast with their main coat (similar to a jaguar or ocelot), to a total lack of spots on their coat. Therefore, the contrasting inner leg markings are more commonly used when identifying bobcats as individuals (Heilbrun et al., 2003). However, the inner legs have fewer total markings and surface area and, therefore, fewer opportunities to make comparisons between individuals as opposed to the entire side coat pattern of an ocelot or jaguar. Another contributing factor as to why HotSpotter was unsuccessful in creating true matches compared to that of Nipko et al.’s (2020) study could be the diversity of body parts we used in identification, which contributed to 6% of chips being mismatched. Nipko et al. (2020) used strict images capturing the entire left or ride side of the felid to identify individual jaguars. These side profile images are ideal for creating rectangular chips in HotSpotter, as they leave very little background in the selection. The side coat pattern of bobcats is not always prevalent or useful in identification. Therefore, we used chips of inner leg markings, along with tail, outer leg markings, and side coat markings when present. These irregularly shaped body parts leave a greater area of background when creating a rectangular chip selection in HotSpotter. This caused issues when queries were run to discover potential matches, as HotSpotter repeatedly distinguished matches using the background/ground within a chip, whether between an outer leg spot in one chip and the ground of another chip or between the ground in both chips. Additionally, interactions at WCS do not always photograph the bobcat at precisely the same angle each time. Images of extremities are sometimes all that were captured from an interaction.
Due to the variable quantity of light, distance to the subject, and pace of the subject moving past the camera, images captured from camera traps in most studies will vary in quality. Unlike Nipko et al. (2020) we distinguish photos by image quality (1 blurred, low-quality images, 2 medium-quality images, and 3 crisp, high-quality images) because the goal of using HotSpotter was to positively identify bobcats to individuals for as many interactions events as it could, including photos that may have ranked as a 1 on Nipko et al.’s (2020) image quality scale.
Manual visual identification was highly successful in identifying 85% of bobcat images to individuals using distinct patterns along the extremities. This percentage is comparable to similar studies using camera trap photographs to visually distinguish between bobcat individuals in Texas. Schmidt et al. (2020b) were able to visually identify 65% of 4,090 detections of bobcats along FM 106 in a 6.5-year-long monitoring study. And Heilbrun et al. (2003) were able to visually identify bobcats in 86% of the 65 photographs captured from a 12-month study in Central Texas. Because bobcat spot patterns are asymmetrical on the left and right sides, a key component in successful identification is being able to link the two profiles (Karanth, 1995). This can be an issue in camera trap studies due to mutual interference between camera flashes (Karanth, 1995). However, the angled setup of camera traps installed at FM 106 (Figure 2) optimized the opportunity to capture both flanks without nighttime flash interference enabling the capture of images of both the left and right sides of individual bobcats. Our camera setup also optimized captures of the inner leg markings, which, like Heilbrun et al. (2003), we found was a useful aid when identifying individual bobcats due to the stark contrast of black markings against the white fur of their ventral side.
The final identification method tested, a spatio-temporal strategy used to infer the identity of bobcats at FE sites with lower sampling efforts, proved successful. This strategy was efficient in saving time during the identification process by suggesting an ID with 90% accuracy based on when and where interactions at the closest WCS occur, and the identification of the individual performing that interaction. Although this method was intended to be confirmed by visual identification, the accuracy was high enough that it could potentially be used to determine the identity of individuals for interactions at FE who do not have sufficient photographs to use visual ID.
4.2 Bobcat interactions at WCS
Individual bobcats that directly interacted with WCS along FM 106 had a greater crossing rate (75%) than refusal rate, providing an indication that ocelots would be expected to have similar crossing rates if they were not rare and endangered. While we demonstrated that bobcats successfully used the WCS, the 25% refusal rate appears high until put into context. Bobcats have complex movement patterns and exhibit a variety of behaviors (Horne et al., 2009). Because successful use of WCS has become defined as an animal passing from one side of the road to the other (Clevenger and Waltho, 2005), uses other than completely passing through are incorrectly categorized as refusals. We classified 100 refusals by bobcat that included other behaviors: 44 instances included smelling behavior either in or around the structure and 56 instances of day-bedding in the culvert. Bobcats were observed day-bedding from 0.75 to 10 h per day between March and October, the hottest months of the year in South Texas. All but one of these 100 interactions were conducted by resident individuals who were arguably familiar with the WCS. While most of these interactions resulted in the individual crossing to the other side of the WCS, 12 of them did not.
There was a positive relationship between bobcat interactions at WCS and the number of identified bobcats present. Canopy cover had a significant interaction with number of identified individuals indicating canopy cover may influence the number of bobcats interacting at a WCS. Based on these results, WCS should be evaluated separately when evaluating the “success” of a WCS based on the number of interactions that occur at individual WCS, as there are factors such as canopy cover that may influence trends. One other factor is residency status, with resident individuals observed for longer periods of time compared to transient individuals (Janecka et al., 2008; Litvaitis et al., 1987). In a previous study of bobcats along FM 106, individual interactions at WCS ranged from 1 to 172 (Schmidt et al., 2020b), with resident individuals observed most frequently and over a greater time period. During this 18-month study, individual interactions of bobcats had a similar range of 1 to 192 at a single WCS.
Exclusionary fencing is designed to funnel wildlife towards WCS for safe passage from one side of the road to the other (Clevenger et al., 2001). However, how far from a crossing to extend guiding fencing is not well studied. The fencing associated with the WCS on FM 106 was not continuous along the entire roadway and was limited at each crossing to the end of adjacent habitat, the nearest driveway or road intersection, or limited to 1000 feet. Highway crossings by bobcats on FM 106 were more frequent at WCS (under the road) than at FE and ROW (on the road). This demonstrates that the fencing associated with WCS is effective in funneling bobcats toward WCS and likely decreases the risk of bobcats entering the roadway via direct access from the habitat. While fencing has been shown to reduce wildlife-vehicle collisions, it needs to be maintained permanently, may increase mortality at fence ends, and act as a barrier to wildlife movement (van der Ree et al., 2015).
More resident individuals were observed at WCS than transient individuals. Canopy cover also influenced the number of resident and transient interactions, with significantly more resident interactions occurring at dense sites. Bobcats are territorial and use scent marking for communication: scraping, urine‐spraying, claw‐marking for communication (Allen et al., 2014a) and scent marking is thought to be primarily used by adult bobcats (Bailey, 1974). The results of the present study indicate that most marking events were conducted by resident bobcats. Allen et al. (2014a) did not collect sex data for the bobcats they observed and stated that data on sex would be important in future studies. Surprisingly, sex was not found to be a significant factor in the number of marking events at WCS in the present study.
4.3 Bobcat behavior at road mitigation structures
Bobcats increased their visits to WCS after their initial interaction. However, the rate at which individuals successfully crossed the structure did not increase. This could be due to several factors; an individual may have no intention of reaching the other side of the road, merely interacting with the WCS to inspect the longevity of scent marks, drink water that often pools at some sites, or seek refuge in the shade of the structure. This would result in a “refusal” of the WCS and could be interpreted as a failure. However, these behaviors could also be interpreted as habituation themselves, as individual bobcats incorporate the WCS into their habitat obtaining resources, sheltering, and successfully crossing the road.
Bobcats could also be habituating to WCS. These individuals may be increasingly incorporating WCS into their activity patterns (Elizalde-Arellano et al., 2012), and therefore, more frequently utilizing WCS. The variation in the data could be accounted for by the unknown home ranges of individual bobcats. Those who have WCS in the middle of their home range may interact with structures more frequently than those with WCS on the fringes of their home range.
5 Conclusion
Although numerous studies with large datasets of photographs have used computer-automated systems to individually identify species such as 10,000 photographs of Serengeti cheetahs (Acinonyx jubatus) and 24,000 images of humpback whales (Megaptera novaeangliae), these attempts are still limited by camera angle and picture quality (Mendoza et al., 2011). Computer-automated systems still rely on the human eye to confirm matches. Though the pattern recognition software, HotSpotter, did not prove to be effective in identifying bobcat individuals for this study, with over 42,000 camera-trap images manually reviewed, the use of a successful computer program could have saved hundreds of hours and substantially increased the efficiency of the identification process. Thus far, the technology to complete such tasks is lacking, but it is possible to manually identify large datasets without the assistance of specialized program software. However, manual visual identification of individuals can lead to bias and is often error-prone. Adopting the minimum standards within the Individual Identification Reporting Checklist (IIRC) will enhance the credibility of identifications being reported and enable findings to be used by future researchers. This checklist aided in forming a reliable and efficient method for identifying bobcats to individuals using tens of thousands of camera-trap images. Moreover, a seemingly valuable tool in measuring the effectiveness of a WCS is calculating the crossing and refusal rates of wildlife that encounter the structure. However, an important function of WCS that often gets overlooked is the functionality of the structure for enabling normal life history and activity patterns. While it was important to determine that most individual bobcats had a higher crossing rate than refusal rate at WCS, it is important to discuss the other purposes WCS serves for local bobcats. Not only do they allow safe passage across FM 106, preventing potential road mortalities, but they often provide a water source, shelter, and a territorial marker. It appears that all the WCS along FM 106 play a key role in the safe movement and daily activity patterns of the population of bobcats. However, even on the most effectively mitigated roadways, animal-vehicle collisions are inevitable: not all individuals will utilize WCS, and mitigation fencing is not an absolute barrier for species who can easily jump or climb it. While emphasis has been placed on monitoring WCS, FE should also be effectively monitored. Finally, bobcats and ocelots share a similar ecology in South Texas, however, it has been previously suggested that bobcat presence may be displacing ocelots. Although there were not enough occurrences to analyze or to even draw preliminary conclusions, it is important to note that of the four ocelots that were observed during the 18-month study period, the most prevalent individual was a male (OM283) that had 25 interactions over one year. This ocelot predominantly utilizing the monitored area in and around dense vegetation sites. While it is not entirely surprising that an ocelot, a habitat specialist, was observed at the two WCS with dense vegetation, these were also the two crossings with the greatest frequency of bobcat marking behavior.
Data availability statement
The original contributions presented in the study are included in the article/supplementary material. Further inquiries can be directed to the corresponding author.
Author contributions
VH: Conceptualization, Data curation, Formal Analysis, Investigation, Methodology, Resources, Validation, Visualization, Writing – original draft, Writing – review & editing. KR: Data curation, Formal analysis, Writing – review & editing. MR: Conceptualization, Software, Writing – original draft, Writing – review & editing. JY: Conceptualization, Funding acquisition, Supervision, Writing – review & editing. RK: Conceptualization, Data curation, Formal Analysis, Funding acquisition, Investigation, Methodology, Project administration, Resources, Software, Supervision, Validation, Visualization, Writing – original draft, Writing – review & editing.
Funding
The author(s) declare financial support was received for the research and/or publication of this article. This study was supported by funding from the Texas Department of Transportation to Dr. Richard Kline (grant number 57-3XXIA002).
Acknowledgments
We thank the many who have contributed to this research including T. Miles Hopkins, Thomas Yamashita, Trinity Livingston, Tiffany Cogan, Zarina Sheikh, Catheline Froehlich, Victoria Rodriguez, Ivonne Cano, Jennifer Baez, Julia Botello, Christopher Gabler, and Kristen Kline. We also thank the U.S. Fish and Wildlife Service for land access.
Conflict of interest
The authors declare that the research was conducted in the absence of any commercial or financial relationships that could be construed as a potential conflict of interest.
Publisher’s note
All claims expressed in this article are solely those of the authors and do not necessarily represent those of their affiliated organizations, or those of the publisher, the editors and the reviewers. Any product that may be evaluated in this article, or claim that may be made by its manufacturer, is not guaranteed or endorsed by the publisher.
Abbreviations
AIR, active infra-red; FM, Farm-to-Market; FE, fence ends; IIRC, individual identification reporting checklist; NAIP, National Agriculture Imagery Program; PIR, passive infra-red; ROW, right-of-way; SD, SanDisk; UNID, unidentifiable; WCS, wildlife crossing structures.
References
Allen M. L., Wallace C. F., and Wilmers C. C. (2014a). Patterns in bobcat (Lynx rufus) scent marking and communication behaviors. J. Ethol. 33, 9–14. doi: 10.1007/s10164-014-0418-0
Allen M. L., Wittmer H. U., and Wilmers C. C. (2014b). Puma communication behaviours: understanding functional use and variation among sex and age classes. Behaviour 151, 819–840. doi: 10.1163/1568539X-00003173
Anderson D. and Burnham K. (2004). Model selection and multi-model inference. Second. Springer-Verlag, New York, USA.
Bailey T. N. (1974). Social organization in a bobcat population. J. Wildlife Manage. 38, 435–446. doi: 10.2307/3800874
Blankenship T. L., Haines A. M., Tewes M. E., and Silvy N. J. (2006). Comparing survival and cause-specific mortality between resident and transient bobcats Lynx rufus. Wildlife Biol. 12, 297–303. doi: 10.2981/0909-6396(2006)12[297:CSACMB]2.0.CO;2
Bunyan R. (1990). Monitoring program of wildlife mitigation measures. Trans-Canada Highway twinning: phase II. Final report (Alberta, Canada: Parks Canada, Banff National Park).
Burton A. C., Neilson E., Moreira D., Ladle A., Steenweg R., Fisher J. T., et al. (2015). Wildlife camera trapping: a review and recommendations for linking surveys to ecological processes. J. Appl. Ecol. 52, 675–685. doi: 10.1111/1365-2664.12432
Cain A. T., Tuovila V. R., Hewitt D. G., and M.E. Tewes M. E. (2003). Effects of a highway and mitigation projects on bobcats in Southern Texas. Biol. Conserv. 114, 189–197. doi: 10.1016/S0006-3207(03)00023-5
Camarena-Ibarrola A., Figueroa K., Tejeda H., and Valero L. (2019). Ocelot identification through spots. Multimedia Tools Appl. 78, 26239–26262. doi: 10.1007/s11042-019-07837-1
Choo Y. R., Kudavidanage E. P., Amarasinghe T. R., Nimalrathna T., Chua M. A. H., and Webb E. L. (2020). Best practices for reporting individual identification using camera trap photographs. Global Ecol. Conserv. 24, e01294. doi: 10.1016/j.gecco.2020.e01294
Clevenger A. P., Chruszcz B., and Gunson K. (2001). Highway mitigation fencing reduces wildlife–vehicle collisions. Wildlife Soc. Bull. 29, 646–653.
Clevenger A. P., Chruszcz B., Gunson K., and Wierzchowski J. (2002). Roads and wildlife in the Canadian rocky mountain parks-movements, mortality and mitigation. Final Report to Parks Canada (Alberta, Canada: Banff).
Clevenger A. P. and Waltho N. (2003). Long-term, year-round monitoring of wildlife crossing structures and the importance of temporal and spatial variability in performance studies. Road Ecology Center.
Clevenger A. P. and Huijser M. (2011). Wildlife Crossing Structure Handbook Design and Evaluation in North America (Bozeman, MT: FHWA-CFL/TD-11-003, Federal Highway Administration Planning, Environment, and Reality).
Clevenger A. P. and Waltho N. (2000). Factors influencing the effectiveness of wildlife underpasses in Banff National Park, Alberta, Canada. Conserv. Biol. 14, 47–56. doi: 10.1046/j.1523-1739.2000.00099-085.x
Clevenger A. P. and Waltho N. (2005). Performance indices to identify attributes of highway crossing structures facilitating movement of large mammals. Biol. Conserv. 121, 453–464. doi: 10.1016/j.biocon.2004.04.025
Coffin A. W. (2007). From roadkill to road ecology: A review of the ecological effects of roads. J. Transport Geogr. 15, 396–406. doi: 10.1016/j.jtrangeo.2006.11.006
Cramer P. (2012). Determining wildlife use of wildlife crossing structures under different scenarios (USA: UT-12.07, Utah Department of Transportation).
Cramer P. and Bissonette J. A. (2005). “Wildlife crossings in North America: the state of the science and practice,” in Proceedings of the International Conference on Ecology and Transportation, San Diego, California. 42–447.
Elizalde-Arellano C., López-Vidal J. C., Hernández L., Laundré J. W., Cervantes F. A., and Alonso-Spilsbury M. (2012). Home range size and activity patterns of bobcats (Lynx rufus) in the Southern part of their range in the Chihuahuan Desert, Mexico. Am. Midland Nat. 168, 247–264. doi: 10.1674/0003-0031-168.2.247
Evink G. (1996). “Florida Department of Transportation Initiatives related to wildlife mortality,” in Trends in Addressing Transportation Related Wildlife Mortality, Proceedings of the Transportation Related Mortality Seminar (Tallahassee, Florida: Florida Department of Transportation).
Forman R. T. T. and Alexander L. E. (1998). Roads and their major ecological effects. Annu. Rev. Ecol. Syst. 29, 207–231. doi: 10.1146/annurev.ecolsys.29.1.207
Haines A. M., Tewes M. E., and Laack L. L. (2005a). Survival and sources of mortality in ocelots. J. Wildlife Manage. 69, 255–263. doi: 10.2193/0022-541X(2005)069<0255:SASOMI>2.0.CO;2
Haines A. M., Tewes M. E., Laack. L. L., Grant W. E., and Young J. H. (2005b). Evaluating recovery strategies for an ocelot (Leopardus pardalis) population in the United States. Biol. Conserv. 126, 512–522. doi: 10.1016/j.biocon.2005.06.032
Haines A. M., Tewes M. E., Laack. L. L., Horne J. S., and Young J. H. (2006). A habitat-based population viability analysis for ocelots (Leopardus pardalis) in the United States. Biol. Conserv. 132, 424–436. doi: 10.1016/j.biocon.2006.04.035
Hardy A., Clevenger A., Huijser M., and Neale G. (2003). “An overview of methods and approaches for evaluating the effectiveness of wildlife crossing structures: emphasizing the science in applied science,” in Proceedings of the 2003 International Conference on Ecology and Transportatio, eds Irwin C. L., Garrett P., and McDermott K. P. Center for Transportation and the Environment, North Carolina State University, Raleigh, NC. 319–330.
Harveson P. M., Tewes M. E., Anderson G. L., and Laack L. L. (2004). Habitat use by ocelots in south Texas: implications for restoration. Wildlife Soc. Bull. 32, 948–954. doi: 10.2193/0091-7648(2004)032[0948:HUBOIS]2.0.CO;2
Heilbrun R. D., Silvy N. J., Tewes M. E., and Peterson M. J. (2003). Using automatically triggered cameras to individually identify bobcats. Wildlife Soc. Bull. 31, 748–755.
Horne J. S., Haines A. M., Tewes M. E., and Laack L. L. (2009). Habitat partitioning by Sympatric Ocelots and Bobcats: Implications for recovery of ocelots in Southern Texas. Southwestern Nat. 54, 119–126. doi: 10.1894/PS-49.1
Janecka J. E., Tewes M. E., Laack L. L., Caso A., Grassman J. L. I., Haines A. M., et al. (2011). Reduced genetic diversity and isolation of remnant ocelot populations occupying a severely fragmented landscape in southern Texas. Anim. Conserv. 14, 608–619. doi: 10.1111/j.1469-1795.2011.00475.x
Janecka J. E., Tewes M. E., Laack L. L., Grassman L. I., Haines A. M., and Honeycutt R. L. (2008). Small effective population sizes of two remnant ocelot populations (Leopardus pardalis albescens) in the United States. Conserv. Genet. 9, 869–878. doi: 10.1007/s10592-007-9412-1
Karanth K. U. (1995). Esimating tiger Panthera tigris populations from camera-trap data using capture-recapture models. Biol. Conserv. 71, 333–338. doi: 10.1016/0006-3207(94)00057-W
Kays R., Tilak S., Kranstauber B., Jansen P. A., Carbone C., Rowcliffe M. J., et al. (2010). Monitoring wild animal communities with arrays of motion sensitive camera traps. Int. J. Res. Rev. Wireless Sensor Networks 1, 19–29. doi: 10.48550/arXiv.1009.5718
Kintsch J., Cramer P., Singer P., and ECO-resolutions, L.L.C (2017). State Highway 9 wildlife crossings monitoring–annual report year 1 (No. CDOT-2017-04) (Denver, USA: Colorado Department of Transportation. Research Branch).
Kleiman D. G. and Eisenberg J. F. (1973). Comparisons of canid and felid social systems from an evolutionary perspective. Anim. Behav. 21, 637–659. doi: 10.1016/S0003-3472(73)80088-0
Laack L. L., Tewes M. E., Haines A. M., and Rappole J. H. (2005). Reproductive life history of ocelots Leopardus pardalis in southern Texas. Acta Theriologica 50, 505–514.
Laack L. L. (1991). Ecology of the ocelot (Felis pardalis) in South Texas. Texas A&M University at Kingsville, Texas.
Laguna Atascosa National Wildlife Refuge (LANWR) (2016). Ocelot Mortalities: Reported from June 2, 2015 to April 22, 2016.
Land D. and Lotz M. (1996). Wildlife crossing designs and use by Florida panthers and other wildlife in southwest Florida. Trends in Addressing Transportation Related Wildlife Mortality. 323.
Litvaitis J. A., Major J. T., and Sherburne J. A. (1987). Influence of season and human-induced mortality on spatial organization of bobcats (Felis rufus) in Maine. J. Mammal. 68, 100–106. doi: 10.2307/1381051
Lombardi J. V., MacKenzie D. I., Tewes M. E., Perotto-Baldivieso H. L., Mata J. M., and Campbell T. A. (2020). Co-Occurrence of bobcats, coyotes, and ocelots in Texas. Ecol. Evol. 10, 4903–4917. doi: 10.1002/ece3.6242
McBride R. and Sensor R. (2012). Photographic evidence of wild Florida panthers scent–marking with facial glands. Southeastern Nat. 11, 349–354. doi: 10.1656/058.011.0216
Mellen J. D. (1993). A comparative analysis of scent-marking, social and reproductive behavior in 20 species of small cats. Am. Zoologist 33, 151–166. doi: 10.1093/icb/33.2.151
Mendoza E., Martineau P. R., Brenner E., and Dirzo R. (2011). A novel method to improve individual animal identification based on camera-trapping data. J. Wildlife Manage. 75, 973–979. doi: 10.1002/jwmg.120
Ng S. J., Dole J. W., Sauvajot R. M., Riley S. P., and Valone T. J. (2004). Use of highway undercrossings by wildlife in southern California. Biol. Conserv. 115, 499–507. doi: 10.1016/S0006-3207(03)00166-6
Nietfeld T. M. (1994). “Wildlife marking techniques,” in Research and management techniques for wildlife and habitats, 140–168.
Nipko R. B., Holcombe B. E., and Kelly M. J. (2020). Identifying individual jaguars and ocelots via pattern-recognition software: Comparing HotSpotter and Wild-ID. Wildlife Soc. Bull. 44, 424–433. doi: 10.1002/wsb.1086
Noss R. F., Quigley H. B., Hornocker M. G., Merrill T., and Paquet P. C. (1996). Conservation biology and carnivore conservation in the Rocky Mountains. Conserv. Biol. 10, 949–963. doi: 10.1046/j.1523-1739.1996.10040949.x
O’Brien T. G., Kinnaird M. F., and Wibisono H. T. (2003). Crouching tigers, hidden prey:Sumatran tiger and prey populations in a tropical forest landscape. Anim. Conserv. 6, 131–139. doi: 10.1017/S1367943003003172
R Core Team (2025). R: A language and environment for statistical computing. R Foundation for Statistical Computing, Vienna, Austria. https://www.R-project.org/.
Reed D. F., Woodard T. N., and Pojar T. M. (1975). Behavioral response of mule deer to a highway underpass. J. Wildlife Manage. 39 (2), 361–367. doi: 10.2307/3799915
Reid F. A. (2006). A field guide to mammals of North America. 4th ed. (New York, New York, USA: Houghton Mifflin Co.).
Sanderson J. and Harris G. (2013). Automatic data organization, storage, and analysis of camera trap pictures. Journal of Indonesian Natural History 1 (1), 11–19.
Schmidt G. M., Lewison R. L., and Swarts H. M. (2020a). Identifying landscape predictors of ocelot road mortality. Landscape Ecol. 35, 1651–1666. doi: 10.1007/s10980-020-01042-4
Schmidt G. M., Lewison R. L., and Swarts H. M. (2020b). Pairing long-term population monitoring and wildlife crossing structure interaction data to evaluate road mitigation effectiveness. Biol. Conserv. 257, 109085. doi: 10.1016/j.biocon.2021.109085
Sequin E. S. (2001). Influence of social status on coyote vulnerability to photo-capture. University of Nevada-Reno, Reno, USA.
Smith J. L. D., McDougal C., and Miquelle D. (1989). Scent marking in free ranging tigers, Panthera tigris. Anim. Behav. 37, 1–10. doi: 10.1016/0003-3472(89)90001-8
Trolle M. and Kéry M. (2005). Camera-trap study of ocelot and other secretive mammals in the northern Pantanal. Mammalia 69, 405–412. doi: 10.1515/mamm.2005.032
United States Fish and Wildlife Service (USFWS) (2016). Recovery Plan for the Ocelot (Leopardus pardalis) (Southwest Region, Albuquerque, New Mexico, USA: U.S. Fish and Wildlife Service).
Van der Ree R., Gagnon J. W., and Smith D. J. (2015). “Fencing: a valuable tool for reducing willife vehicle collisions and funneling fauna to crossing structures. Chapter 20,” in Handbook of Road Ecology. Oxford: John Wiley & Sons. 159–171.
Keywords: wildlife crossing structures, surrogate species, HotSpotter, spatio-temporal strategy, camera trap
Citation: Hanley V, Ryer K, Rahman MS, Young JH Jr. and Kline RJ (2025) Identification, abundance, and behavior of North American bobcat (Lynx rufus) along road mitigation structures designed for endangered species in South Texas. Front. Ecol. Evol. 13:1487295. doi: 10.3389/fevo.2025.1487295
Received: 27 August 2024; Accepted: 27 July 2025;
Published: 26 August 2025.
Edited by:
Anindita Bhadra, Indian Institute of Science Education and Research Kolkata, IndiaReviewed by:
Inger Suzanne Prange, Appalachian Wildlife Research Institute, United StatesLaura E D’Acunto, United States Geological Survey, Wetland and Aquatic Research Center, United States
Copyright © 2025 Hanley, Ryer, Rahman, Young and Kline. This is an open-access article distributed under the terms of the Creative Commons Attribution License (CC BY). The use, distribution or reproduction in other forums is permitted, provided the original author(s) and the copyright owner(s) are credited and that the original publication in this journal is cited, in accordance with accepted academic practice. No use, distribution or reproduction is permitted which does not comply with these terms.
*Correspondence: Richard J. Kline, cmljaGFyZC5rbGluZUB1dHJndi5lZHU=