 Frank Juma Ong’ondo
 Rosie Trevelyan3
 Anthony Kuria
 Peter Njoroge
- 1Department of Geosciences, Mississippi State University, Mississippi State, MS, United States
- 2Department of Ornithology, National Museums of Kenya, Nairobi, Kenya
- 3Tropical Biology Association, Cambridge, United Kingdom
- 4Tropical Biology Association, National Museums of Kenya, Nairobi, Kenya
- 5Kenya Bird Map, National Museums of Kenya, Nairobi, Kenya
- 6A Rocha Kenya, Watamu, Kenya
Citizen science has the potential to advance scientific knowledge by producing large datasets from diverse landscapes. The Kenya Bird Map (KBM) has collected a large data set on Kenyan birds, yet it is largely untapped for scientific research. This study utilized data from KBM records (hereafter KBM data) to address specific questions regarding the distribution and abundance of grassland specialist birds (bustards) and grassland opportunist species (storks and harriers) within Laikipia County, Nairobi National Park and Masai Mara, Kenya. Our objectives were to predict these grassland bird species’ spatial distribution and abundance using KBM data and identify key landscape elements influencing their occurrence. Bird data were extracted from the KBM portal from 2013 - 2023, using only full protocol card records. Data on bustards, harriers, harrier-hawks, and storks were filtered, focusing on pentads with over four card submissions. We applied Sentinel-2B median imagery for December 2023, accessible through Google Earth Engine, alongside geographic information systems and remote sensing techniques to classify and characterize land cover types as explanatory variables. A linear mixed-effect model was used to predict grassland birds’ response. Our regression result showed that bustards responded positively to patch density but negatively to shrubland and woodland. Storks showed positive responses to grassland and woodland, while harriers showed negative responses to woodland. Storks had the highest number of records, while harriers had the least. Masai Mara had the highest number of records of the 16 species reported across the three regions, while Nairobi National Park had the least. For the first time, our study has recognized the importance of ongoing efforts to incorporate KBM data with complementary ecological datasets to deepen our understanding of bird communities and their responses to environmental changes. Our findings suggest that KBM data has substantial potential for identifying species distribution and monitoring temporal changes.
1 Introduction
Successful species conservation and management require a comprehensive understanding of species distribution, abundance, habitat preferences, and movement across wider geographic areas, and over long periods (Wernham et al., 1998; Askins et al., 2007; Greenwood, 2007; Bonney et al., 2009; Craigie et al., 2010; Hochachka et al., 2012). However, classical field surveys to collect this information, while effective (Ong’ondo et al., 2022), can be costly and challenging to conduct, especially over large scales (Bland et al., 2015; McKinley et al., 2017). Furthermore, there is often a lack of long-term data collection in many regions – partly due to financial constraints, recurring permits and licenses, and the need to maintain personnel (Bland et al., 2015; McKinley et al., 2017).
Recent studies have highlighted the values of citizen science across multiple fields such as environmental monitoring, emergency response, and the development of management strategies (Savan et al., 2003; Helsloot and Ruitenberg, 2004; Gouveia and Fonseca, 2008; Bonney et al., 2009; McKinley et al., 2017). In addition, studies have investigated the scalability of these initiatives, from local to global levels (Danielsen et al., 2010; Devictor et al., 2010; Hochachka et al., 2012; De Sherbinin et al., 2021). In Africa, there is a growing interest in using citizen science for research and environmental management, as well as an understanding of barriers, benefits, and challenges (Pocock et al., 2019). While the potential of citizen science remains largely untapped in many taxonomies, there is a growing mass collection of citizen science data on African birds (Underhill et al., 2017; Brooks et al., 2022; Lee et al., 2022; Tende et al., 2024). However, with the exception of South Africa, a large proportion of these data have not been fully utilized. This can primarily be attributed to a lack of expertise in Africa in analyzing the often-unstructured nature of citizen science data, and secondly, because different methodologies have been used - namely pentad methods for generic data collection and point-based approaches for a breeding bird survey (Bystrak, 1981). These methodological differences complicate data analysis and require specialized capacity. Furthermore, there is often a failure to frame research questions that can be answered by the available data.
The Kenya Bird Map (KBM), an example of a citizen science initiative, has been instrumental in providing reliable data on bird distribution and relative abundance across Kenya (https://kenya.birdmap.africa). Established in 2013, and based at the National Museums of Kenya (NMK), KBM follows the South African citizen science protocol (Underhill et al., 2017; Brooks et al., 2022). Through the diverse expertise and perspectives of participants, KBM engages volunteers from diverse backgrounds, including experienced and inexperienced birdwatchers, photographers, and wildlife guides, to gather data. Despite its success in recruiting volunteers and accumulating a large dataset for over a decade, KBM has yet to produce comprehensive scientific results. Its data has yet to be analyzed or published, demonstrating a unique and potential area for advancement.
For the first time, this study has utilized the KBM data to predict the abundance and distribution of bustards, storks, and harriers across Laikipia County, Nairobi National Park, and Masai Mara, Kenya. These species primarily depend on open grassland ecosystems, making them particularly vulnerable to habitat changes. The global decline of grassland birds is a compelling concern, largely attributed to changes in land use/land cover (Muchai et al., 2001, 2002, Zhao et al., 2020; Bardgett et al., 2021; Douglas et al., 2023). The three target regions vary in their management levels. Nairobi National Park is a fully protected area under Kenya’s national government, Masai Mara is partially protected (as a large national reserve under the local government) and surrounded by large privately owned land, and Laikipia is managed privately by landowners (Personal communication). These varying management regimes impact how grassland ecosystems are maintained, providing an opportunity for studying ecological dynamics to guide conservation strategies.
Our study was centered on using the KBM data to predict spatial distribution patterns and abundance of grassland specialist birds (bustards) and grassland opportunistic bird species (storks and harriers). We predicted that the extensive spatial coverage and long-term data collection of KBM would make it a valuable resource for understanding the distribution patterns of these grassland birds across Kenya. Specifically, we anticipated identifying key landscape features that influence the occurrence and distribution of bustards, storks, and harriers.
2 Study area
This study covered three regions within Kenya, Africa: Laikipia County, Nairobi National Park, and Masai Mara (Figure 1). Laikipia County, located approximately 200 km north of Nairobi city hosts many conservancies, wildlife reserves, and ranches dedicated to wildlife, livestock production, sustainable land management, and community development (Bersaglio and Enns, 2024). The Laikipia ecosystem comprises several land cover types that support a higher diversity of wildlife species, including threatened and endangered species (Muriithi, 2016). Human activities in Laikipia include traditional pastoralism, agriculture, conservation, and tourism. The recent doubling of private ranches and conservancies has shaped wildlife conservation and land management practices. Additionally, innovative approaches such as community-led conservation initiatives and sustainable land-use practices have been adopted to balance the needs of wildlife and local communities (Bersaglio and Enns, 2024).
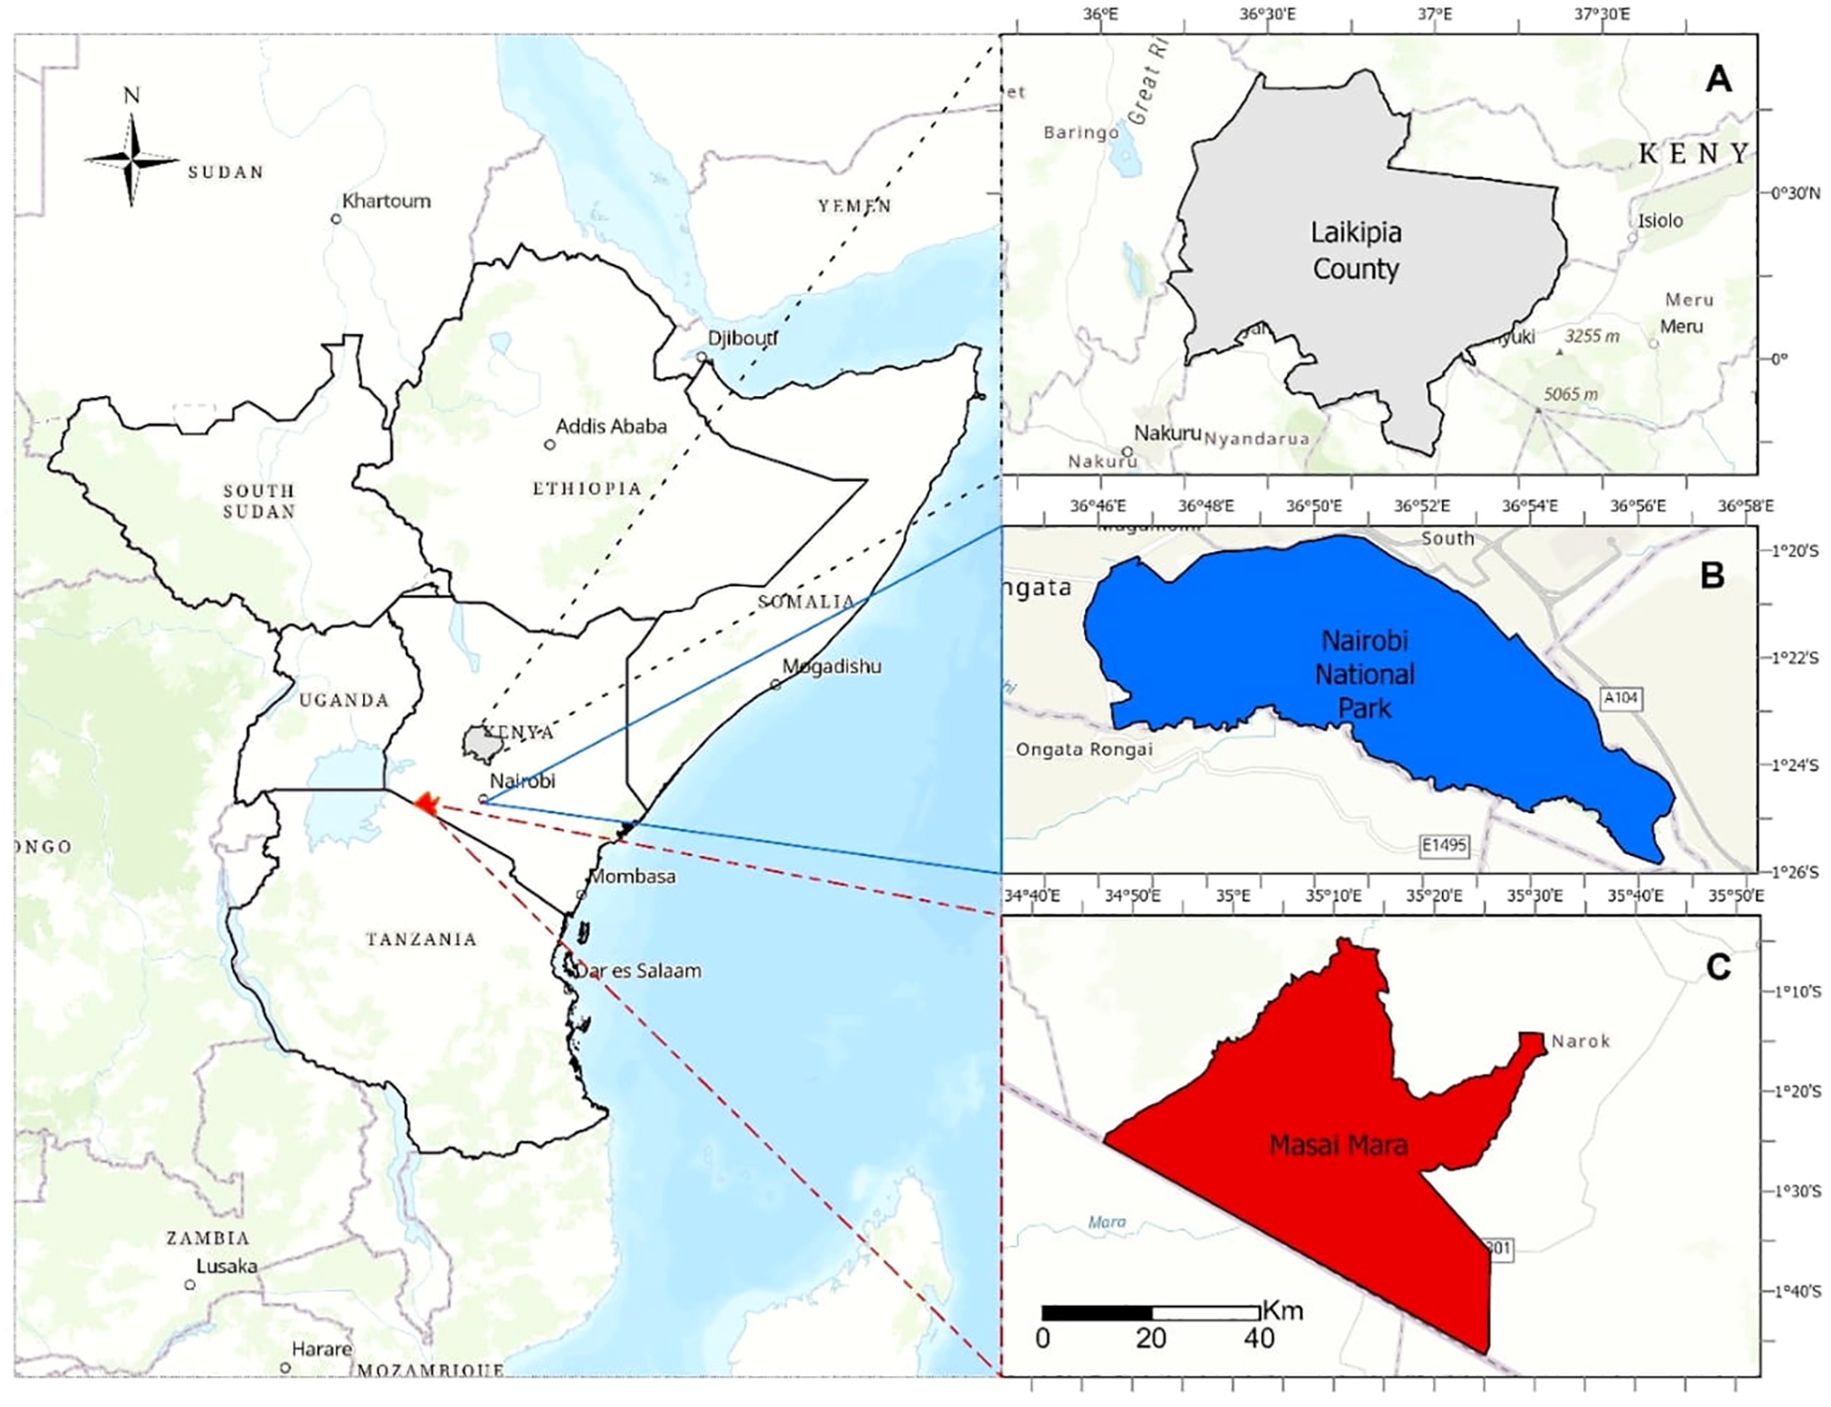
Figure 1. Study area map of three regions, Laikipia County (A), Nairobi National Park (B) and Masai Mara National Reserve (C), Kenya where Kenya bird map data was collected, 2013-2023.
Nairobi National Park (NNP), established in 1946 as Kenya’s first national park, covers approximately 118 km² and is located about 7 km southwest of Nairobi’s central business district (Ong’ondo et al., 2025). The park experiences a semi-arid climate with distinct wet and dry seasons, which supports a diverse range of wildlife, including several bird species (Ogutu et al., 2013; Mwangi et al., 2022). Its land cover includes open grasslands, acacia woodlands, shrubland patches, forests, and riverine habitats, although invasive species like Lantana camara and prickly pear cactus threaten native vegetation (Ong’ondo et al., 2025).
Urbanization has encroached particularly from the north and west, while rural areas to the south and east are dominated by grasslands and settlements. These landscape dynamics contribute to habitat fragmentation and pose challenges to wildlife movement. For a more detailed description of Nairobi National Park’s ecosystem, see Ong’ondo et al. (2025).
Maasai Mara, located approximately 300 km southwestern of Nairobi city, comprises Masai Mara National Reserve and several conservancies. The Masai Mara ecosystem is characterized by a diverse landscape that provides habitat to a lot of wildlife species including numerous bird species. Despite its ecological importance, the Masai Mara ecosystem faces challenges attributed primarily to agricultural expansion and settlements outside the reserve (Thompson et al., 2002; Kariuki et al., 2021). Human activities within the Maasai Mara intersect with traditional pastoralism and conservation, which are practiced by the indigenous Maasai community.
3 Materials and methods
3.1 Response variables
We extracted bird data from the KBM portal for the years 2013 to 2023, using only full protocol card records (https://kenya.birdmap.africa). KBM is a citizen science initiative where bird observation lists (cards) are submitted by individual contributors (Njoroge and Brooks, 2019; Ong’ondo et al., 2025). These records undergo vetting by KBM representatives before being averaged and uploaded as official records. The submitted cards can be categorized as full protocol or ad hoc. Full protocol cards involve detailed surveys lasting a minimum of two hours over a 5-day period and cover a range of land cover types, whereas ad hoc cards involve shorter, opportunistic surveys of less than two hours (Njoroge and Brooks, 2019; Ong’ondo et al., 2025). For our analysis, we filtered data on bustard, harrier, harrier-hawk, and stork, specifically selecting pentads with more than four card submissions from each of the three study regions (Figure 1). The proportion of cards reporting each species within a pentad (reporting rate) was used as a relative index of abundance in the analysis.
3.2 Explanatory variables
We built upon the methodology developed by Ong’ondo et al. (2025) and applied geographic information systems (GIS) and remote sensing (RS) techniques, utilizing Sentinel-2B imagery and Google Earth Engine (GEE) to map, analyze, and predict the spatial distribution of key land cover types across the three study regions (Figure 1). Sentinel-2B (COPERNICUS/S2) images for December 2023 were obtained from the Copernicus Open Access Hub (https://scihub.copernicus.eu/), and only those with less than 0.5 percent cloud cover were retained to ensure high quality data. The imagery was processed by applying a median value compositing technique for each pixel, followed by clipping the images to the study areas (Figure 1) to focus the analysis on the regions of interest (ROI).
The boundaries of these study areas were defined using boundary shapefiles, which were incorporated into GEE to delineate the ROI for subsequent image classification. Training samples for classification were gathered within the ROI, consisting of polygons delineating known land cover types (forest, grassland, bare soil/barren, shrubland, and woodland). These training samples were organized as a Feature Collection within GEE, with each feature assigned a specific class label.
To classify the images, all available spectral bands from the Sentinel-2B data were used. A Classification and Regression Tree (CART) algorithm was selected due to its efficiency in handling complex spectral data and its ability to produce accurate land cover classifications. The classifier was trained using a dataset split into 70% for training and 30% for testing. After training, the classifier was applied to the entire Sentinel-2B image dataset within the ROI, classifying each pixel into one of the predefined land cover classes based on its spectral properties. Classification accuracy was evaluated by using independent validation data or ground truth points, which were not part of the training set. The classification performance was assessed using overall accuracy and kappa statistics.
Finally, the classified land cover layers were downloaded into R software, where the landscape metrics package (Hesselbarth et al., 2019) was used to calculate the composition and configuration of land cover types across the study regions.
3.3 Statistical analysis
To evaluate landscape metrics across the study regions, we calculated variables representing both land cover composition and landscape configuration. Land cover composition was characterized by the presence and extent of distinct land cover types, while landscape configuration was quantified using metrics such as edge density and patch density. These metrics were selected for their ecological relevance to habitat fragmentation and their potential influence on grassland bird abundance (Fletcher and Koford, 2002; Winter et al., 2006). Together, they offer an understanding of the structural attributes of the landscape that may shape bird populations.
To ensure the reliability and interpretability of our model, we assessed multicollinearity among explanatory variables. Variance Inflation Factors (VIF) were calculated to quantify the extent to which each predictor variable was linearly related to others. While the literature suggests varying thresholds for acceptable VIF values, ranging from 10 (Hair et al., 1998) to 2 (Kock and Lynn, 2012), we conservatively adopted a threshold of 7 to balance statistical rigor and ecological relevance. Variables with the highest VIF values were iteratively excluded following a stepwise procedure (Dormann et al., 2012). This process resulted in the removal of forest, bare soil, water, and edge density, leaving grassland, woodland, and shrubland as representative composition metrics and patch density as a configuration metric. The robustness of these retained variables was further verified through Pearson correlation matrices, which verified the absence of strong inter-variable correlations (|Pearson’s r| < 0.4).
While edge density is a widely used metric for assessing habitat fragmentation (Howell et al., 2021), we excluded it in favor of patch density. Patch density offers a more direct and ecologically meaningful measure of habitat structure, particularly for grassland birds (Winter et al., 2006). This decision reflects a careful evaluation of the ecological significance of landscape configuration and its implications for bird species (Dunning et al., 1992; Pulliam et al., 1992).
To address spatial and temporal variations in bird abundance across the study regions, we employed a standardized weighting approach. Total bird counts for each group were calculated and proportionally distributed to reflect their ecological significance in the dataset. This method ensured that the analysis accurately represented the contributions of each group to overall abundance patterns.
Building on the methodology established in our previous study (Ong’ondo et al., 2025), we used a linear mixed-effects model to predict the distribution and abundance of bustards, storks, and harriers across the three regions. In earlier work, logistic regression was employed to analyze the relationship between land cover types and bird abundance in Nairobi National Park (NNP). Here, we extended that analysis to include additional regions and applied the linear mixed-effects model, which offers a more robust approach for prediction.
We followed a series of preprocessing steps to ensure the accuracy and reliability of our statistical analysis. First, we handled zero values by adding a small constant (0.0001) to all dataset columns, allowing for mathematical manipulation while maintaining the data’s integrity. Second, we centered and scaled the data to have a mean of zero and a standard deviation of one, which helped to eliminate any inherent biases and enabled meaningful comparisons across regions.
The following regression model was fitted to examine the relationship between land cover types and bird responses across the three study areas. Land cover types were considered significant predictors if the p-value was less than 0.05.
Where Abundance represents the observed bird response in the study area. The intercept (β0) represents the baseline abundance when all predictors are at their mean values (centered and scaled). Specifically, for each bird group, this means that the abundance in a study area is predicted based on the average values of the land cover types (grassland, woodland, shrubland, patch density, respectively) in the model. A positive intercept indicates that, under average habitat conditions, bird abundance is expected to be higher, while a negative intercept suggests lower expected abundance under those same conditions.
The coefficients (β1, β2, β3, β4) represent the fixed effects of land cover types (grassland, woodland, shrubland, and patch density, respectively) on bird abundance. A positive coefficient indicates that an increase in a given land cover type is associated with higher bird abundance (positive response), while a negative coefficient suggests that greater coverage of a particular land cover type leads to reduced bird abundance (negative response). Finally, the term ϵ captures any unexplained variability in the model.
4 Results
We extracted a total of 50,717 records for 16 species reported across the three study regions from 2013 - 2023; these records spread across the three focus groups were: bustards (~20,497 records), harriers (~7,427 records), and storks (~ 22,792 records) (Table 1). Comparing regions, Masai Mara had the highest number of records of all total species (~ 25,799 records), and Nairobi National Park had the least (~ 5,308 records) (Table 1). The three regions had a cumulative 16 species, and 15 species each. The distribution of species varied across the regions, with some being unique to specific regions. For example, the buff-crested bustard (Lophotis gindiana) was only recorded in Laikipia County. The woolly-necked stork (Ciconia episcopus) was recorded in both Nairobi National Park and Masai Mara, but not in Laikipia County (Table 1).
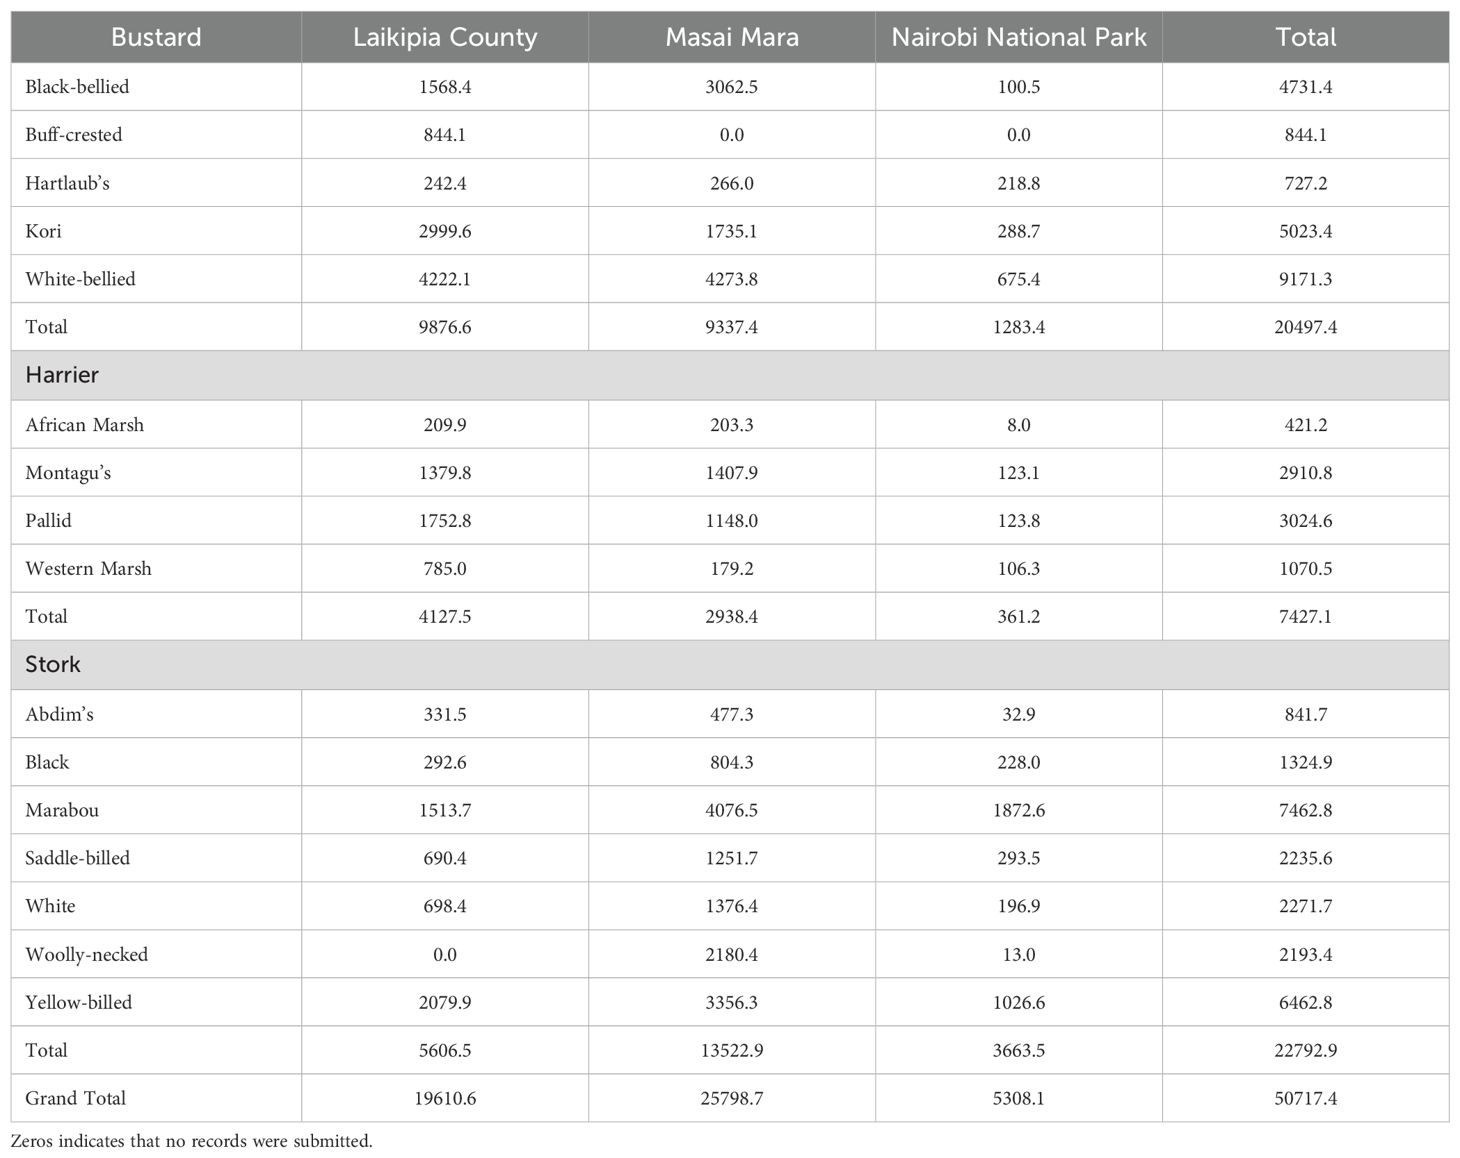
Table 1. The number of KBM records (2013-2023) for grassland bird species (and groups) for the three study regions, Laikipia County, Masai Mara and Nairobi National Park.
The highest single species records by region included white-bellied bustard (Eupodotis senegalensis) and Kori bustard (Ardeotis kori) (~ 4,222 and 3,000 records, respectively) in Laikipia County; white-bellied bustard (Eupodotis senegalensis) and marabou stork (Leptoptilos crumenifer) (~ 4,274 and 4,077 records, respectively) in Masai Mara; and Marabou stork (Leptoptilos crumenifer) and yellow-billed stork (Mycteria ibis) (~1,873 and 1,027 records, respectively) in Nairobi National Park (Table 1).
The species with the least record by region were African marsh harrier (Circus ranivorus) and Hartlaub’s bustard (Lissotis hartlaubii) (~ 210 and 242 records, respectively) in Laikipia County; western marsh harrier (Circus aeruginosus) and African marsh harrier (Circus ranivorus) (~ 179 and 203 records, respectively) in Masai Mara; African marsh harrier (Circus ranivorus) and Woolly-necked stork (Ciconia episcopus) (~8 and 13 records, respectively) in Nairobi National Park (Table 1). The three regions had different numbers of pentads; Laikipia County had 20 pentads; Masai Mara, 19 Pentads; and Nairobi National Park 3 Pentads (Table 2). In addition, the classification results from Google Earth Engine (Figure 2) illustrate the distribution of land cover types across the three regions and highlight the spatial variation within each study area.
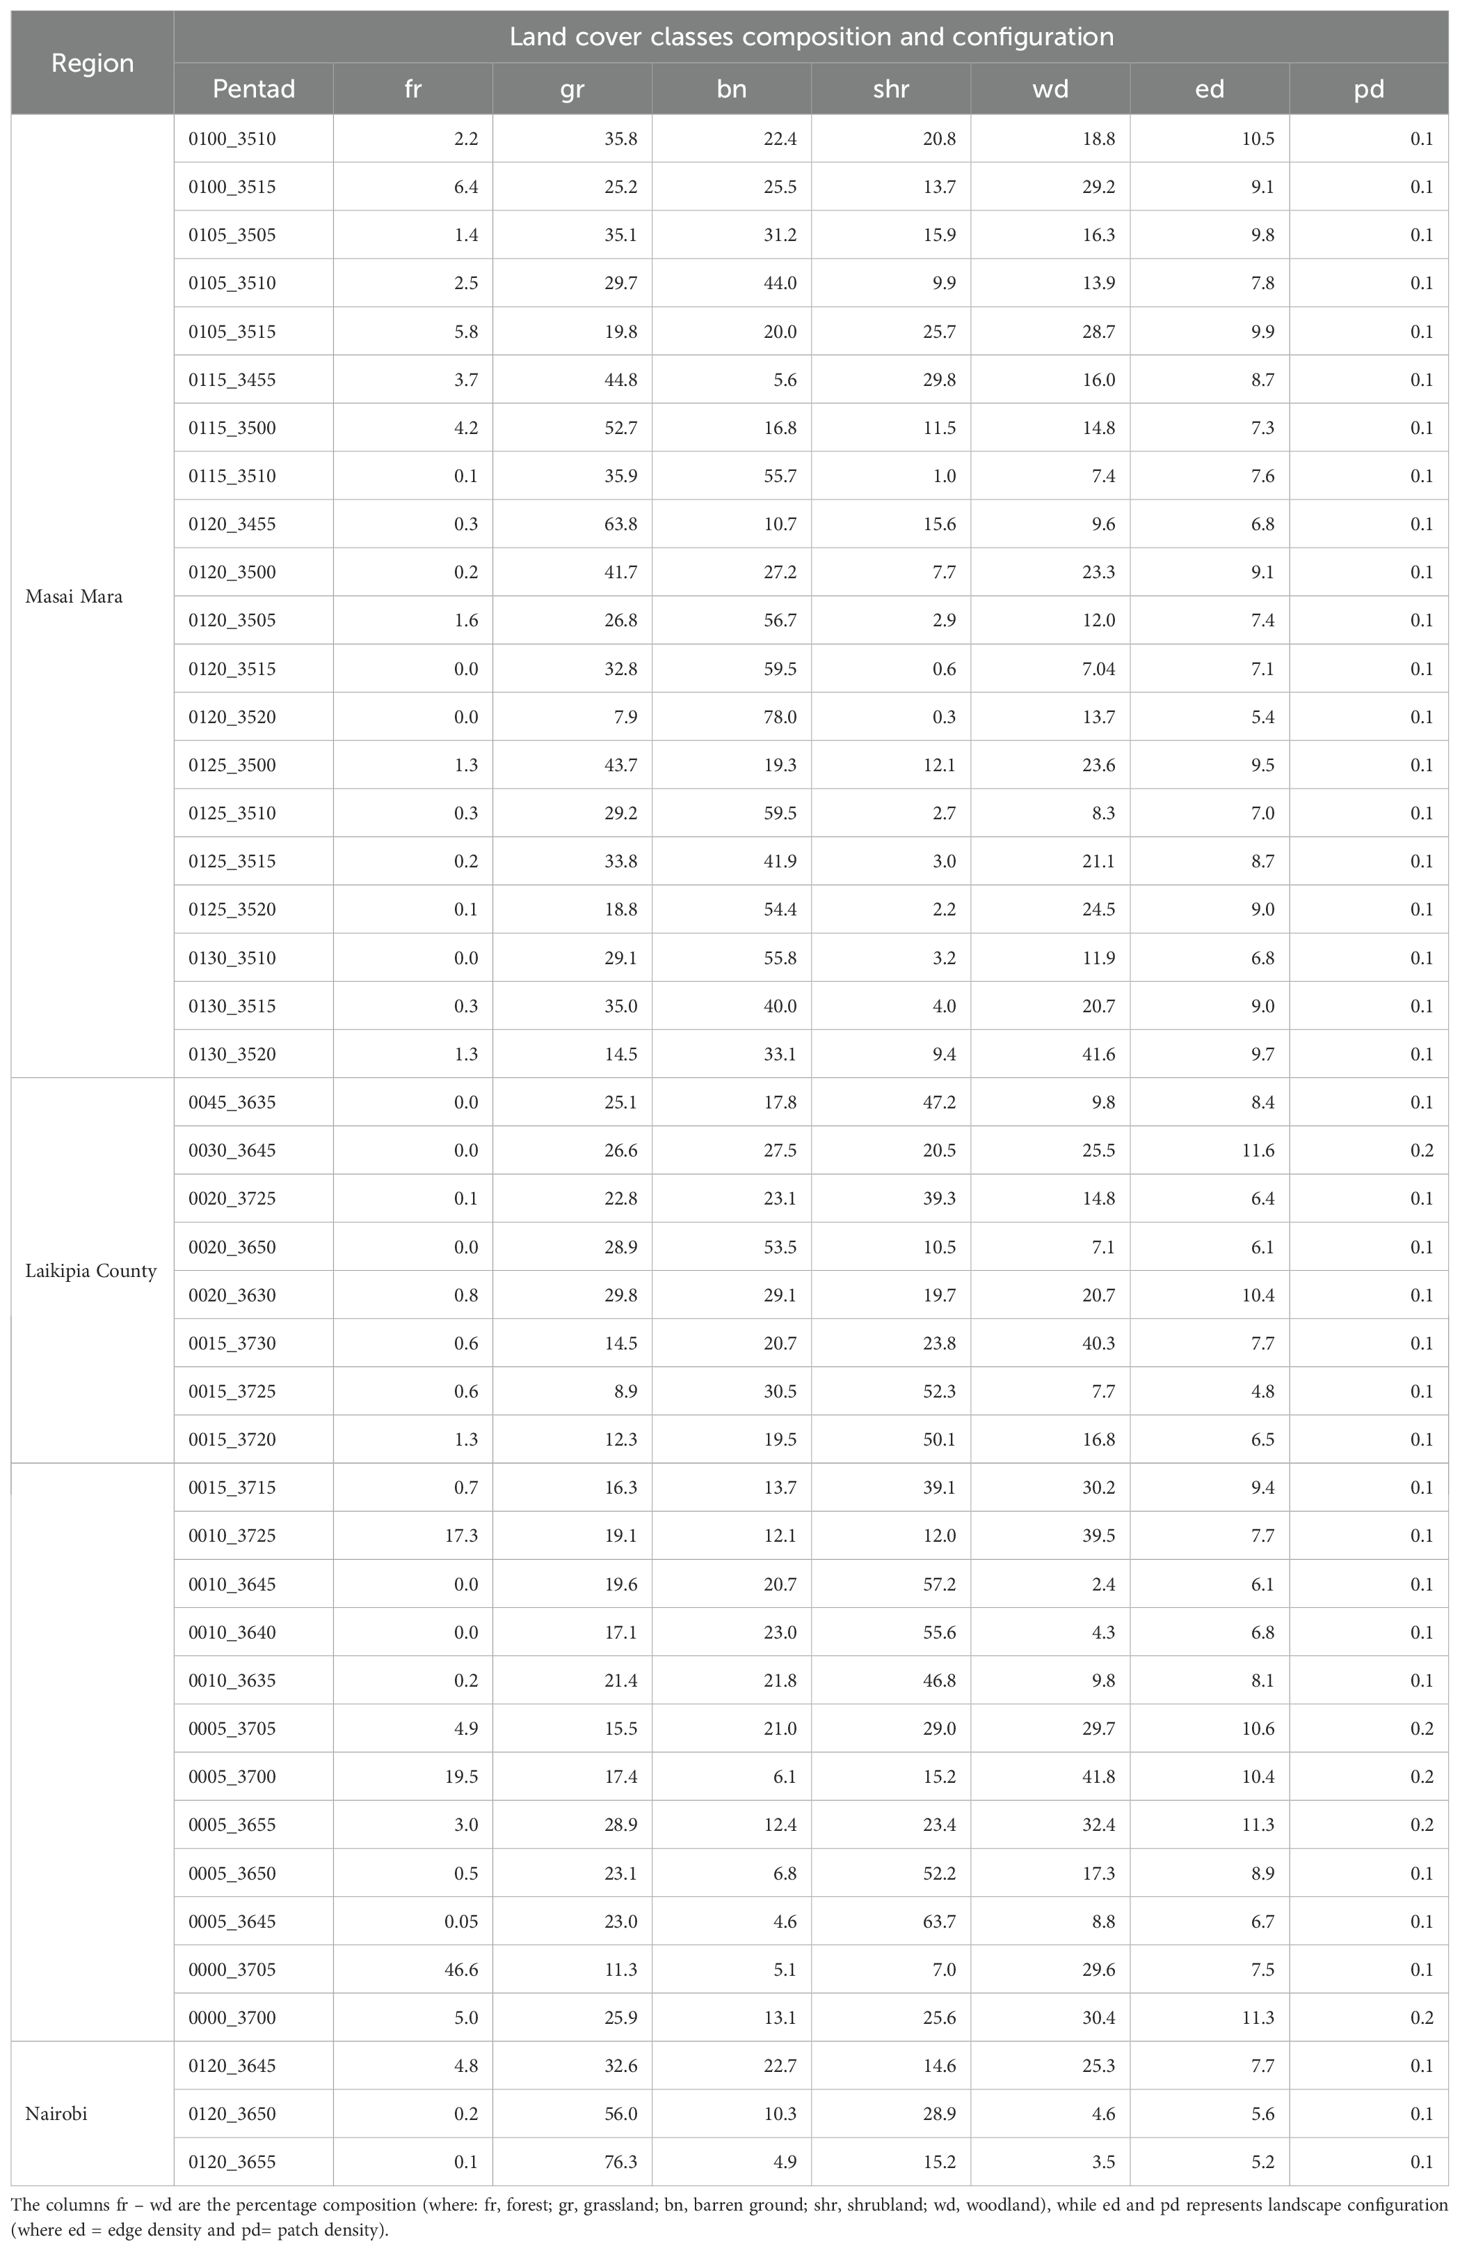
Table 2. Land cover composition across pentads in Masai Mara, Laikipia County and Nairobi National Park, Kenya.
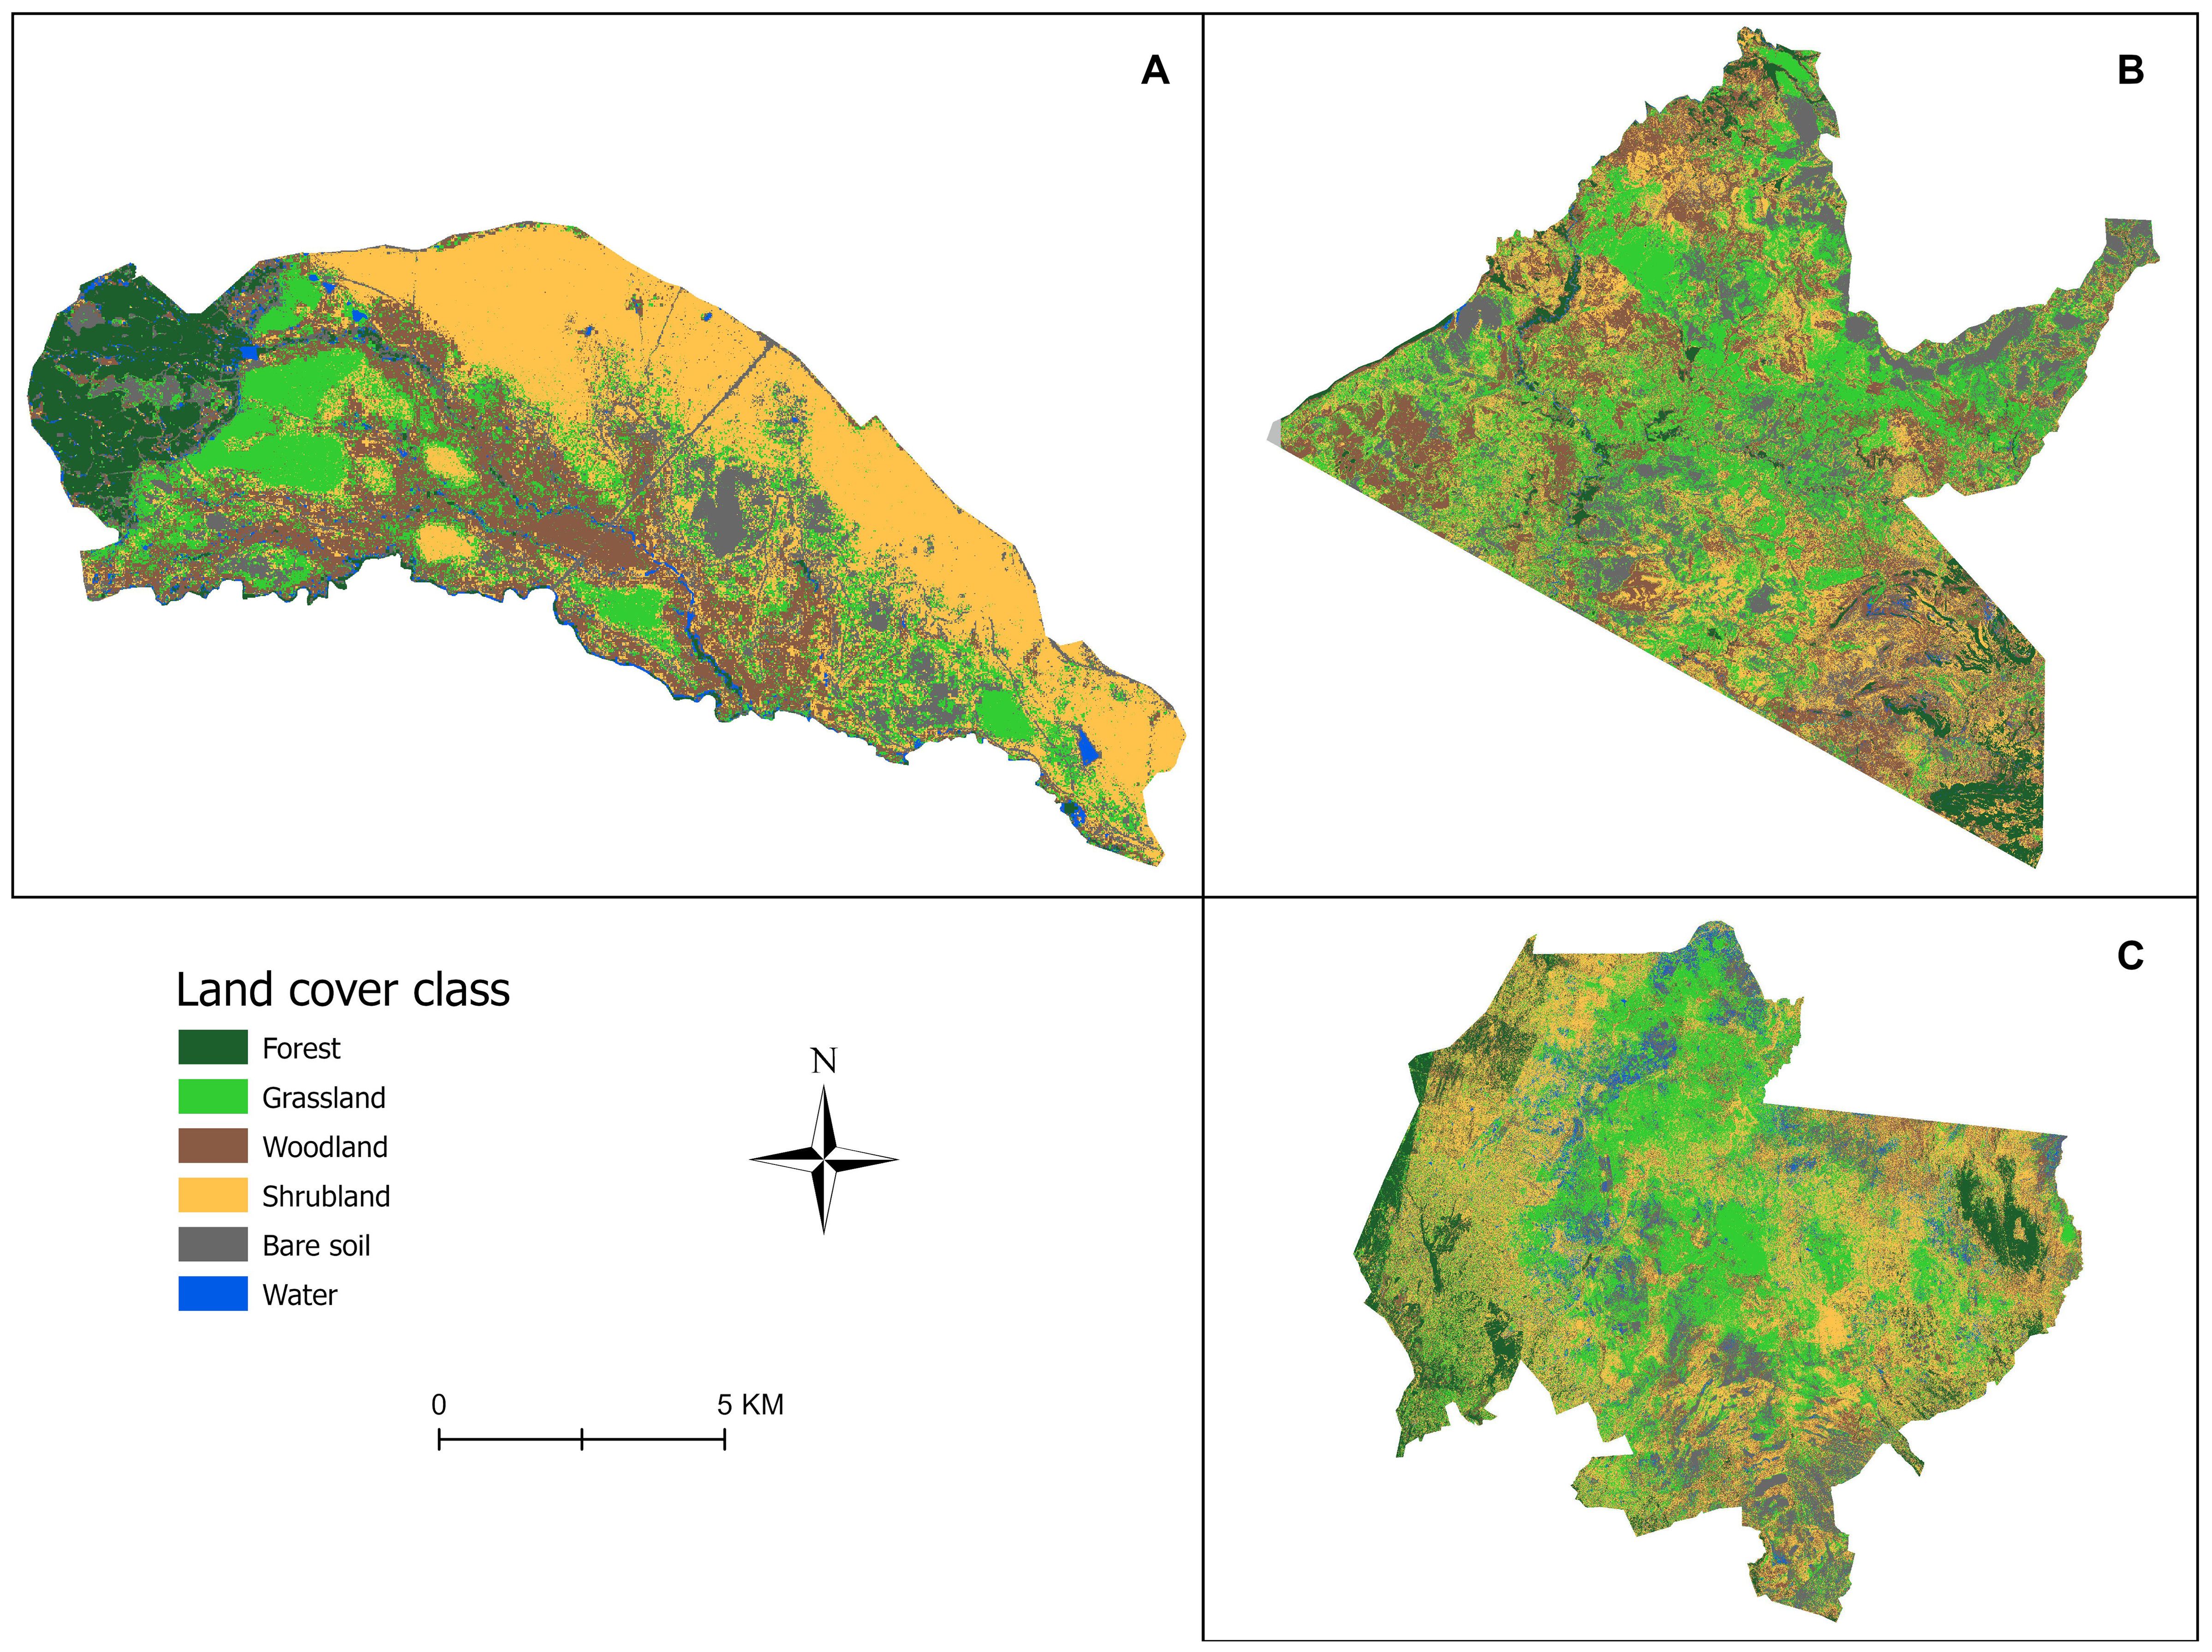
Figure 2. Land cover classification map showing the spatial distribution of land cover types across the three study regions: Nairobi National Park (A), Masai Mara National Reserve (B) and Laikipia County (C), Kenya where Kenya bird map data was collected, 2013-2023.
Our regression results indicated that bustards responded positively to patch density, with a mean estimate of 26.3 (SE = 11.7, P < 0.05), and negatively to woodland and shrubland, with mean estimates of -16.1 (SE = 4.7, P < 0.05) and -4.6 (SE = 1.7, P < 0.05), respectively (Table 3; Figure 3). However, there was less evidence of grassland having a negative effect on bustards, as indicated by a mean estimate of -8.8 (SE = 4.5, P = 0.05, Table 3; Figure 3). Storks indicated positive responses to grassland and woodland with mean estimates of 13.6 (SE = 3.8, P < 0.05) and 12.1 (SE = 4.4, P < 0.05) respectively (Table 3; Figure 4). However, there was less evidence of patch density having a negative effect on storks, as indicated by a mean estimate of -24.8 (SE = 12.6, P = 0.05, Table 3; Figure 4). Harriers indicated a negative response to woodland, with mean estimates of -8.8 (SE = 4.1, P < 0.05, Table 3; Figure 5).
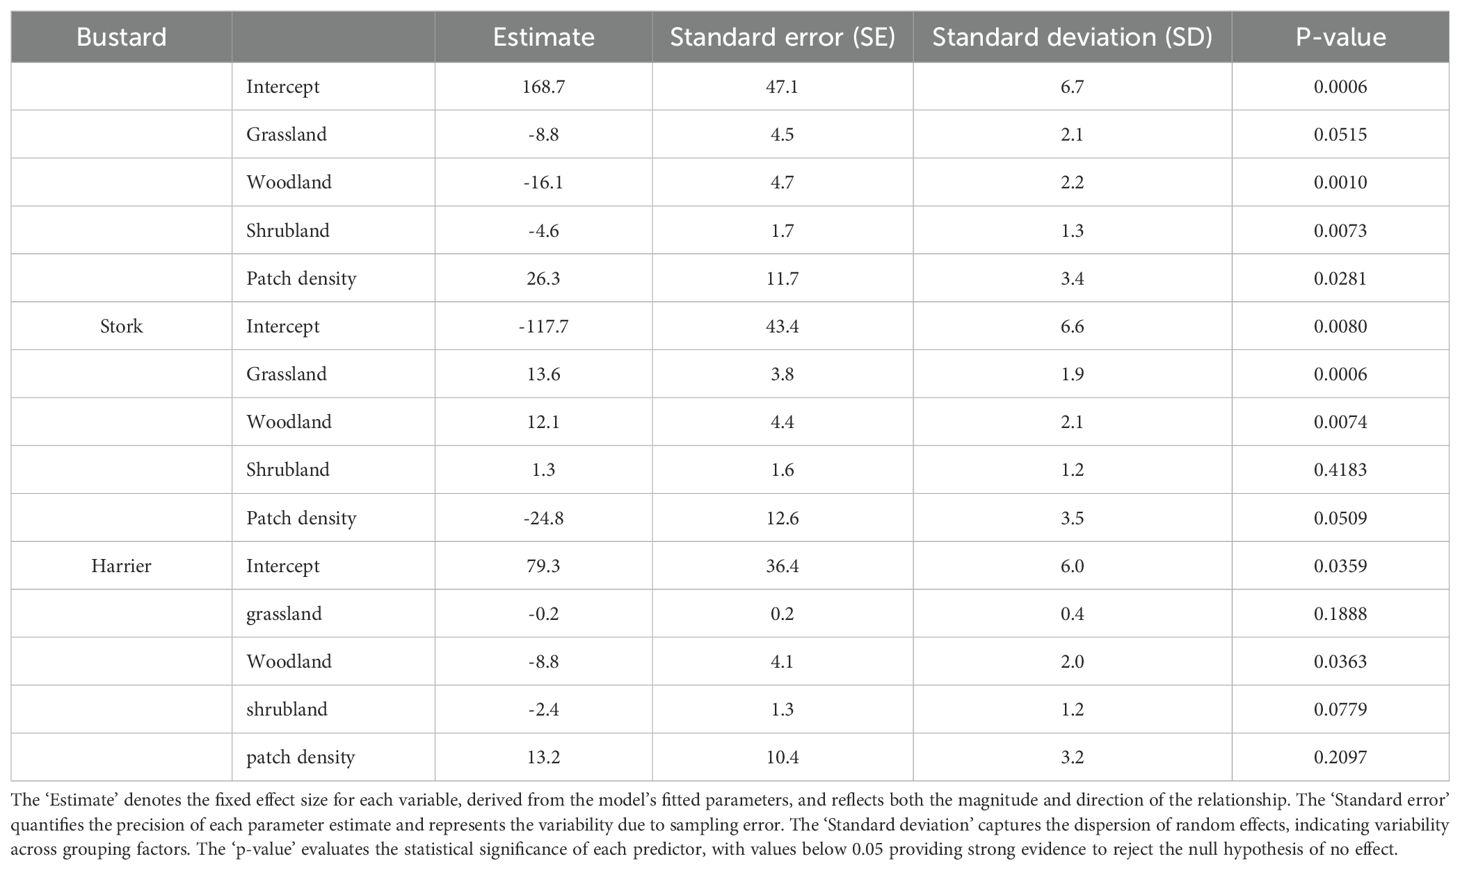
Table 3. The relationship between bird abundance and predictor variables, estimated by the linear mixed-effects model, was analyzed for bustards, storks, and harriers in Laikipia County, Nairobi National Park, and Masai Mara, Kenya.
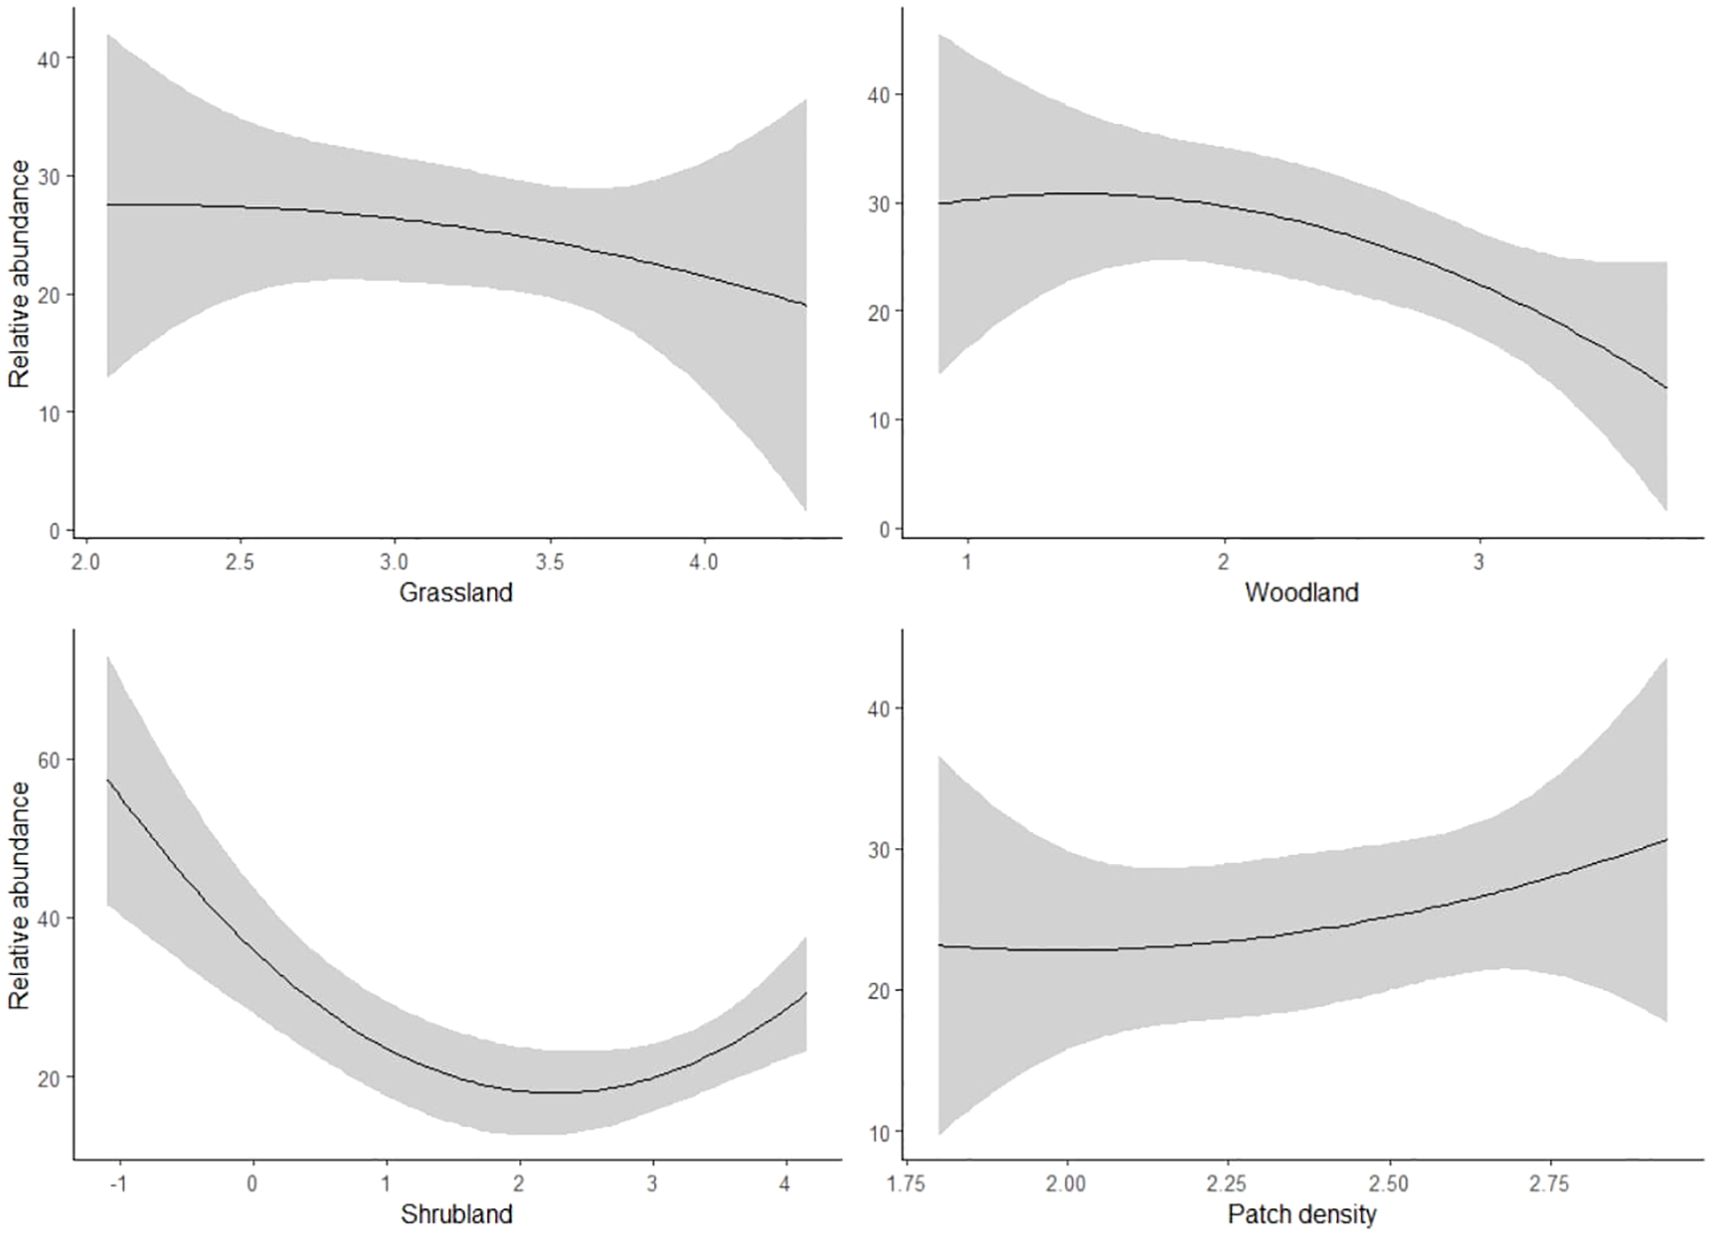
Figure 3. Predicted response of bustard bird species to land cover composition and configuration (X-axis) in three study areas: Laikipia County, Nairobi National Park, and Masai Mara, Kenya, using bird observation records from the KBM (2013-2023).
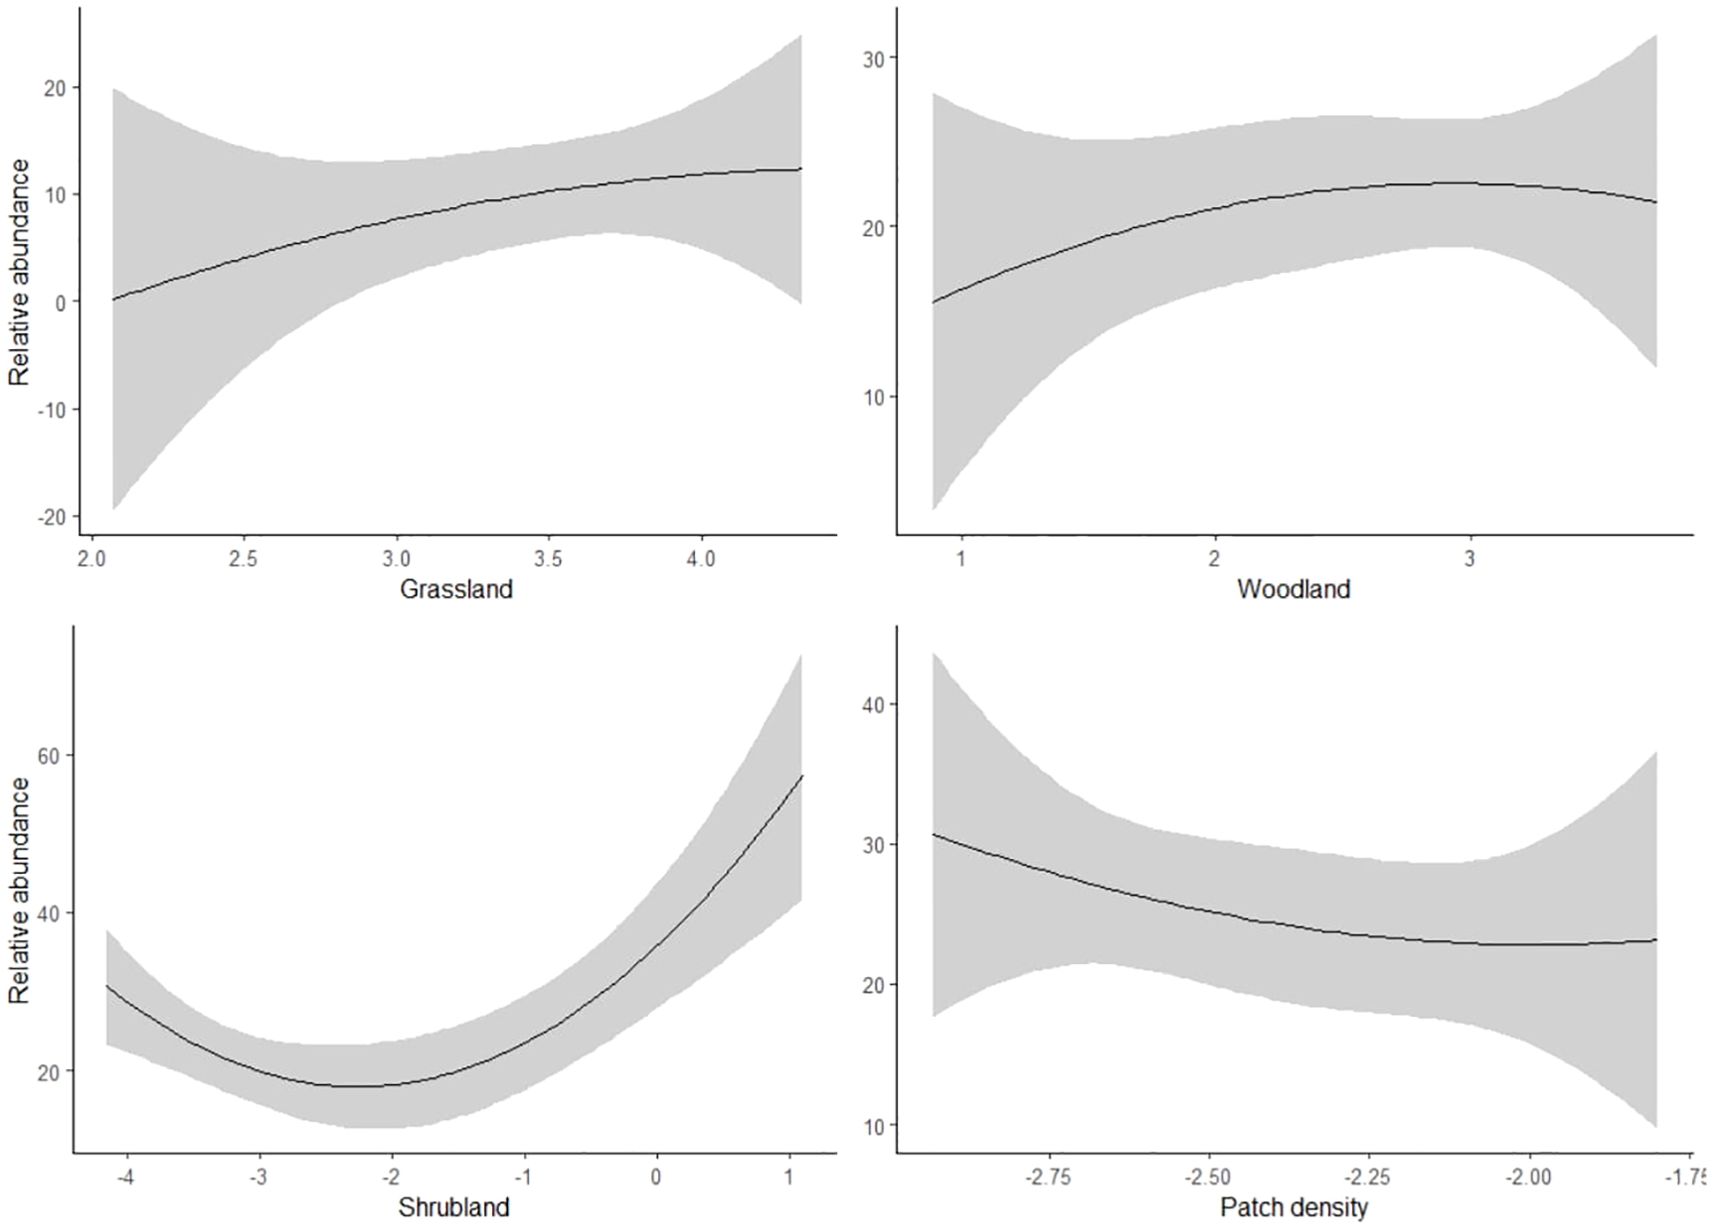
Figure 4. Predicted response of stork bird species to land cover composition and configuration (X-axis) in three study areas: Laikipia County, Nairobi National Park, and Masai Mara, Kenya, using bird observation records from the KBM (2013-2023).
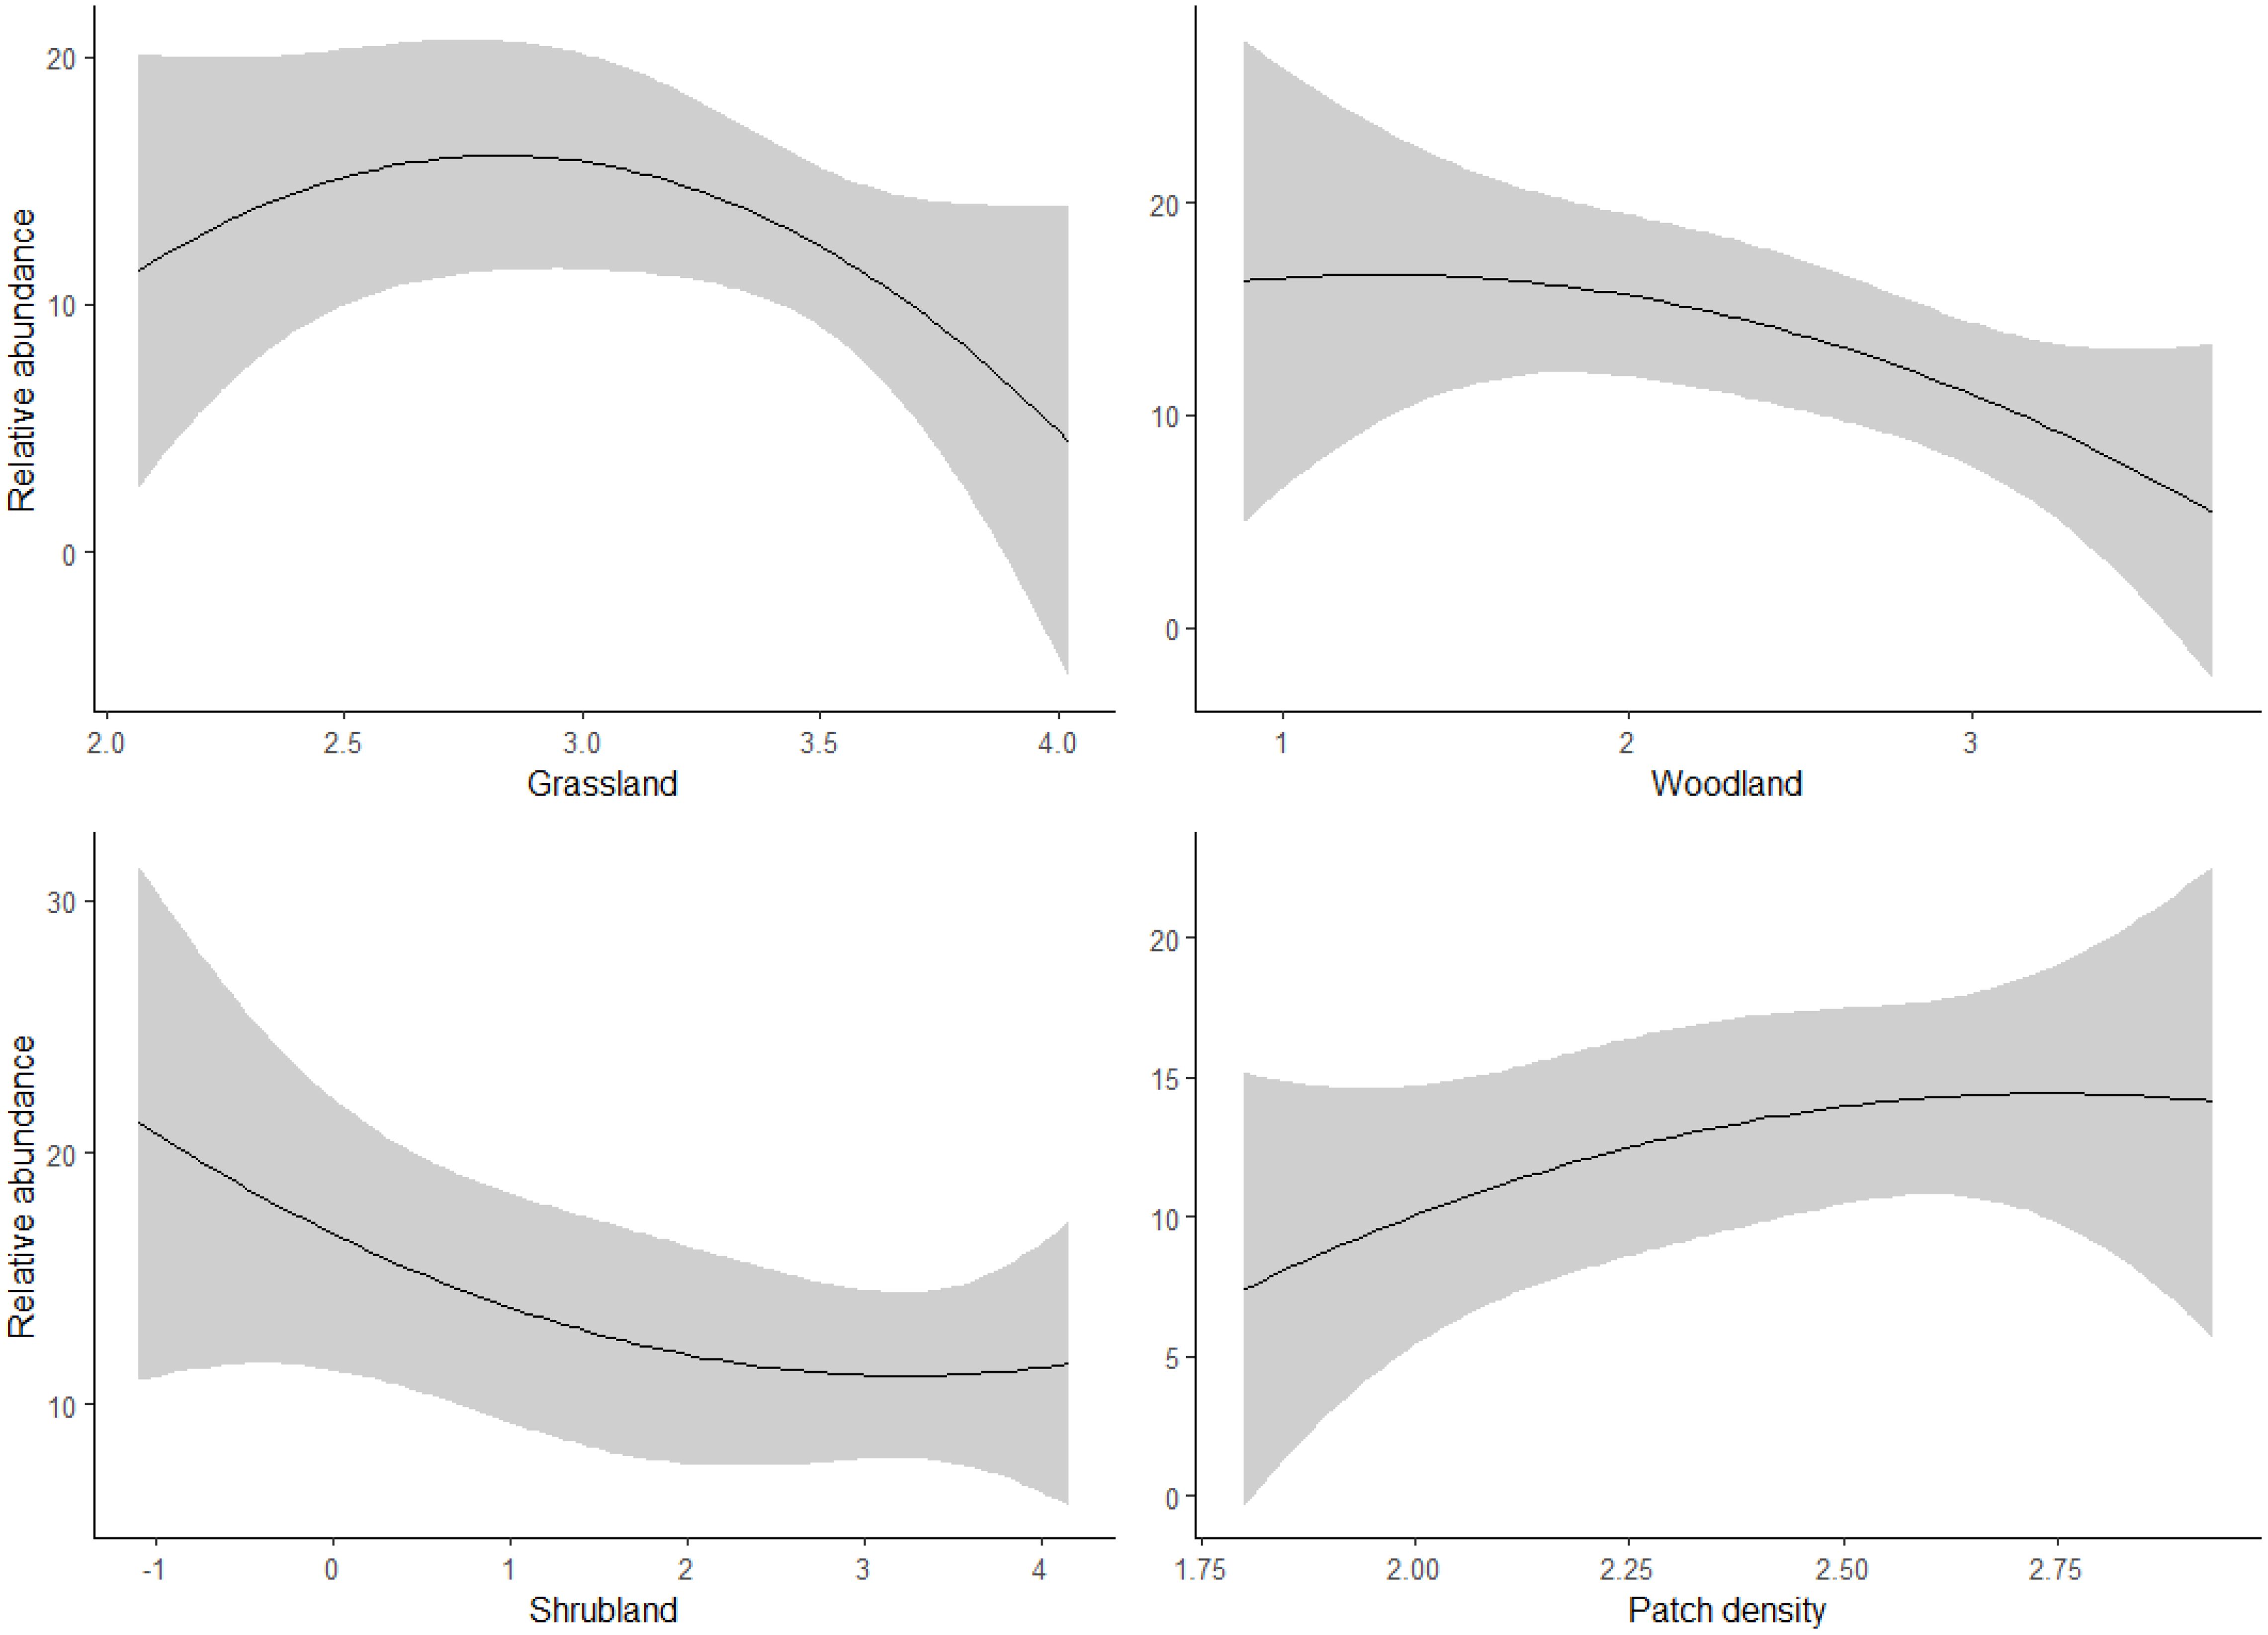
Figure 5. Predicted response of harrier bird species to land cover composition and configuration (X-axis) in three study areas: Laikipia County, Nairobi National Park, and Masai Mara, Kenya, using bird observation records from the KBM (2013-2023).
5 Discussion
We used KBM data to analyze the spatial and temporal patterns of bustards, storks, and harriers’ abundance and distribution across Kenya’s landscape. Our analysis demonstrated the value of KBM data in predicting species distribution and provided essential knowledge of how specific land cover types affect these species. The research identified key ecological zones supporting bustards, storks, and harriers and quantified the impact of land cover composition (e.g., woodland, grassland) and configuration (e.g., patch density) on their abundance and spatial distribution.
The unique presence of buff-crested bustard (Lophotis gindiana) only in Laikipia County and woolly-necked stork (Ciconia episcopus) in both Nairobi National Park and Masai Mara suggest distinct ecological variation and differences in species distribution across these regions. Kennedy (2014) and Lewis and Pomeroy (2017) described the buff-crested bustard (Lophotis gindiana) as an inhabitant of arid to semiarid climates with stony land cover types. Laikipia County, with its expansive semi-arid landscapes and rocky outcrops, provides these specific habitat conditions preferred by this species, which likely account for the species’ absence from the more humid and densely vegetated regions such as Nairobi National Park and Masai Mara. In contrast, the woolly-necked stork (Ciconia episcopus), was only observed in Nairobi National Park and Masai Mara, both of which offer critical habitat components such as wetlands and open spaces needed for the species’ survival. The absence of such resources in Laikipia County likely restricts the stork’s occurrence in this region. Studies have shown that storks prefer working landscape with wetlands and open spaces as opposed to natural landscape (Johst et al., 2001; Kamiński et al., 2020; Kittur and Sundar, 2020).
The landscape complementation hypothesis (Turner, 1989; Dunning et al., 1992) suggests that species response is favored in landscapes defined by juxtaposition and interspersion, where diverse land cover types containing key resources are closely associated. We argue that the observed positive response of bustards is influenced by both the composition and configuration of the landscape, particularly the proximity and arrangement of grassland, woodland, and shrubland patches, along with patch density. These features likely provide essential ecological resources such as food, shelter, and suitable nesting sites. However, the effect of land cover composition and configuration varied when examined independently, emphasizing that both the types of land cover and their spatial arrangement contribute to the observed species distributions.
García et al. (2007) found that diverse, mosaic land cover benefits fragmented little bustard populations. Our analysis is consistent with this, demonstrating a positive response of bustards to patch density, which underscores the role of spatial arrangement in facilitating suitable habitat conditions (Turner, 1989; Dunning et al., 1992). Higher patch density reflects a mosaic of land cover types with varied spatial arrangements, which offer diverse foraging and nesting opportunities for bustards. The interspersed and juxtaposed land cover types in these landscapes provide both the ecological resources and spatial structure essential for the species’ survival. Woodland and shrubland exhibited significant negative responses on bustard distribution and abundance, highlighting low-quality covers for bustard requirements. These results are consistent with previous studies emphasizing the preference of bustard species for open, less vegetated landscapes (Wolff et al., 2002; Kennedy, 2014; Mmassy et al., 2019), further highlighting the critical importance of habitat configuration in determining species distributions.
The negative, though not significant, effect of grassland on bustard response suggests that grasslands, while less detrimental than woodlands or shrublands, still influence the species’ habitat use. Extensive grassland management practices, particularly those aimed at maximizing livestock feed production in Laikipia County and Masai Mara, may significantly alter the structural composition, disturbance regimes, and spatial arrangement of grassland ecosystems. Bernath-Plaisted et al. (2023) emphasized that grassland bird declines are driven by persistent threats throughout their annual cycle, including habitat loss, agricultural intensification, woody encroachment, and grazing regimes. Our findings align with this perspective, suggesting that these livestock-driven changes disrupt the availability of essential resources for bustards. For instance, intensive grazing and the conversion of grasslands into pastures may reduce suitable nesting sites, limit access to foraging areas, and diminish protective vegetation cover. Moreover, previous studies indicate that bustards show a marked preference for natural, undisturbed grasslands and tend to avoid managed pastures due to frequent disturbances, including livestock grazing and associated human activities (Johnsgard, 1991; Dutta et al., 2010).
The variability in stork responses to different land cover types highlights the suboptimal conditions of current landscapes for supporting stork populations. Our findings suggest that grasslands and woodlands provide critical resources for storks, including foraging areas, water sources, and nesting sites essential for their survival and reproduction. Storks favor open habitats, which facilitate access to prey such as small fish, amphibians, and insects, resources that are more visible and accessible in these environments (Herremans and Herremans-Tonnoeyr, 1993; Gerkmann et al., 2008; Kronenberg et al., 2017; Orłowski et al., 2019). Open spaces also enhance flight efficiency, a crucial factor for storks that forage and migrate over large distances (Gerkmann et al., 2008).
In contrast, dense shrublands limit visibility and mobility and impedes the storks’ ability to detect and capture prey, which may explain the weak positive association observed with this land cover type. Moreover, the negative relationship between patch density and stork response indicates that fragmented landscapes disrupt foraging efficiency by scattering prey too thinly across the habitat, making it more challenging for storks to locate sufficient food. These findings underscore the importance of preserving critical land cover types and ensuring landscape connectivity to maintain functional habitats for storks.
The negative response of harriers to woodland habitats is likely due to changes in both land cover composition and configuration, which reduce the availability of key prey species such as rats, moles, and voles. Changes in vegetation structure, such as excessive tree thinning or dense shrub growth, reduce prey visibility and movement (Morán-López et al., 2015; Zhang et al., 2016). Additionally, fragmentation of woodland habitats, driven by development and land use changes, disrupts prey populations and limits habitat connectivity. These factors, influenced by both composition and configuration, ultimately reduce the habitat’s suitability for harriers. Bersaglio and Enns (2024) argued that the “violent ecological transformation” in Laikipia has led to a simplified and less heterogeneous landscape. This trend has also been documented in other regions (Ndegwa Mundia and Murayama, 2009; Ogutu et al., 2009; Khalid Kija et al., 2020).
6 Conclusion
For the first time, our study has recognized the importance of ongoing efforts to incorporate KBM data with complementary ecological datasets to enhance our understanding of bird communities and their responses to environmental changes. Utilizing KBM data’s extensive spatial coverage and long-term monitoring capabilities, researchers can elucidate complex ecological relationships and identify critical conservation priorities across various landscapes. This integration between KBM data and environmental variables signifies immense potential for advancing evidence-based conservation initiatives and safeguarding avian biodiversity locally and globally. Moving forward, continued collaboration between researchers, conservation practitioners, and data custodians is essential to utilize the full capacity of KBM in addressing pressing ecological challenges and promoting sustainable conservation and management of natural resources.
Data availability statement
The raw data supporting the conclusions of this article will be made available by the authors, without undue reservation.
Ethics statement
The manuscript presents research on animals that do not require ethical approval for their study.
Author contributions
FO: Conceptualization, Data curation, Formal analysis, Funding acquisition, Investigation, Methodology, Project administration, Resources, Software, Supervision, Validation, Visualization, Writing – original draft, Writing – review & editing. RT: Funding acquisition, Project administration, Supervision, Visualization, Writing – review & editing. AK: Conceptualization, Funding acquisition, Project administration, Supervision, Visualization, Writing – review & editing. PN: Validation, Visualization, Writing – review & editing. SG: Data curation, Writing – review & editing. CJ: Visualization, Writing – review & editing.
Funding
The author(s) declare that financial support was received for the research and/or publication of this article. The author(s) that the financial support was received from the UK government through the Darwin Initiative grant DARCC020 (to the Tropical Biology Association), which facilitated a training workshop in Kenya on using citizen science bird data. We sincerely thank the Tropical Biology Association for their generous support, which contributed to the success of this study.
Acknowledgments
We extend our sincere gratitude to the Tropical Biology Association (TBA) for their generous financial support, which was serviceable in facilitating this study. This support was provided by the UK government through the Darwin Initiative grant DARCC020 (to TBA), which funded a training workshop in Kenya on the use of citizen science bird data, further strengthening the framework of our study. We are also thankful to KBM and the Ornithology Section of the National Museums of Kenya for generously providing the data used in this study and for their thoughtful suggestions, which significantly improved the quality of the research. Finally, we are grateful to the four anonymous reviewers and the editors for their constructive feedback, which greatly enhanced this manuscript.
Conflict of interest
The authors declare that the research was conducted in the absence of any commercial or financial relationships that could be construed as a potential conflict of interest.
Publisher’s note
All claims expressed in this article are solely those of the authors and do not necessarily represent those of their affiliated organizations, or those of the publisher, the editors and the reviewers. Any product that may be evaluated in this article, or claim that may be made by its manufacturer, is not guaranteed or endorsed by the publisher.
References
Askins R. A., Chávez-Ramírez F., Dale B. C., Haas C. A., Herkert J. R., Knopf F. L., et al. (2007). Conservation of grassland birds in North America: understanding ecological processes in different regions: “Report of the AOU Committee on Conservation. Ornithological Monogr. 64, 1–46. doi: 10.2307/40166905
Bardgett R. D., Bullock J. M., Lavorel S., Manning P., Schaffner U., Ostle N., et al. (2021). Combating global grassland degradation. Nat. Rev. Earth Environ. 2, 720–735. doi: 10.1038/s43017-021-00207-2
Bernath-Plaisted J. S., Correll M. D., Somershoe S. G., Dwyer A. M., Bankert A., Beh A., et al. (2023). Review of conservation challenges and possible solutions for grassland birds of the North American Great Plains. Rangeland Ecol. Manage. 90, 165–185. doi: 10.1016/j.rama.2023.07.002
Bersaglio B., Enns C. (2024). Settler ecologies and the future of biodiversity: insights from Laikipia, Kenya. Conserv. Soc. 22 (1), 1–13. doi: 10.4103/cs.cs_25_23
Bland L. M., Collen B., David. L. Orme C., Bielby J. (2015). Predicting the conservation status of data-deficientspecies. Conserv. Biol. 29, 250–259. doi: 10.1111/cobi.12850
Bonney R., Cooper C. B., Dickinson J., Kelling S., Phillips T., Rosenberg K. V., et al. (2009). Citizen science: a developing tool for expanding science knowledge and scientific literacy. BioScience 59, 977–984. doi: 10.1525/bio.2009.59.11.9
Brooks M., Rose S., Altwegg R., Lee A. T., Nel H., Ottosson U., et al. (2022). The african bird atlas project: a description of the project and birdmap data-collection protocol. Ostrich 93, 223–232. doi: 10.2989/00306525.2022.2125097
Craigie I. D., Baillie J. E. M., Balmford A., Carbone C., Collen B., Green R. E., et al. (2010). Large mammal population declines in Africa’s protected areas. Biol. Conserv. 143, 2221–2228. doi: 10.1016/j.biocon.2010.06.007
Danielsen F., Burgess N. D., Jensen P. M., Pirhofer-Walzl K. (2010). Environmental monitoring: the scale and speed of implementation varies according to the degree of peoples involvement. J. Appl. Ecol. 47, 1166–1168. doi: 10.1111/j.1365-2664.2010.01874.x
De Sherbinin A., Bowser A., Chuang T.-R., Cooper C., Danielsen F., Edmunds R., et al. (2021). The critical importance of citizen science data. Front. Climate 3, 1–7. doi: 10.3389/fclim.2021.650760
Devictor V., Whittaker R. J., Beltrame C. (2010). Beyond scarcity: citizen science programmes as useful tools for conservation biogeography. Diversity Distributions 16, 354–362. doi: 10.1111/j.1472-4642.2009.00615.x
Dormann C. F., Schymanski S. J., Cabral J., Chuine I., Graham C., Hartig F., et al. (2012). Correlation and process in species distribution models: bridging a dichotomy. J. Biogeography 39, 2119–2131. doi: 10.1111/j.1365-2699.2011.02659.x
Douglas D. J. T., Waldinger J., Buckmire Z., Gibb K., Medina J. P., Sutcliffe L., et al. (2023). A global review identifies agriculture as the main threat to declining grassland birds. Ibis 165, 1107–1128. doi: 10.1111/ibi.v165.4
Dunning J. B., Danielson B. J., Pulliam H. R. (1992). Ecological processes that affect populations in complex landscapes. Oikos 65, 169–175. doi: 10.2307/3544901
Dutta S., Rahmani A., Jhala Y. (2010). Running out of time? The great Indian bustard Ardeotis nigriceps—status, viability, and conservation strategies. Eur. J. Wildlife Res. 57, 615–625. doi: 10.1007/s10344-010-0472-z
Fletcher R. J., Koford R. R. (2002). Habitat and landscape associations of breeding birds in native and restored grasslands. J. Wildlife Manage. 66, 1011–1022. doi: 10.2307/3802933
García J., Suárez-Seoane S., Miguélez D., Osborne P. E., Zumalacárregui C. (2007). Spatial analysis of habitat quality in a fragmented population of little bustard (Tetrax tetrax): Implications for conservation. Biol. Conserv. 137, 45–56. doi: 10.1016/j.biocon.2007.01.013
Gerkmann B., Kaatz M., Riede K., van den Elzen R. (2008). The Luangwa Valley, Zambia: flyway and stopover site for White Storks Ciconia ciconia. Ostrich 79, 171–176. doi: 10.2989/OSTRICH.2008.79.2.6.580
Gouveia C., Fonseca A. (2008). New approaches to environmental monitoring: the use of ICT to explore volunteered geographic information. GeoJournal 72, 185–197. doi: 10.1007/s10708-008-9183-3
Greenwood J. J. D. (2007). Citizens, science and bird conservation. J. Ornithology 148, 77–124. doi: 10.1007/s10336-007-0239-9
Hair J. F., Black W. C., Babin B. J., Anderson R. E., Tatham R. L. (1998). Multivariate data analysis (Upper Saddle River, NJ: Prentice Hall), 207–219.
Helsloot I., Ruitenberg A. (2004). Citizen response to disasters: a survey of literature and some practical implications. J. Contingencies Crisis Manage. 12, 98–111. doi: 10.1111/j.0966-0879.2004.00440.x
Herremans M., Herremans-Tonnoeyr D. (1993). White Storks Ciconia ciconia, Abdim’s Storks Ciconia abdimii and Kites Milvus migrans feeding on mopane worms. Babbler 25, 40.
Hesselbarth M. H. K., Sciaini M., With K. A., Wiegand K., Nowosad J. (2019). landscapemetrics: an open-source R tool to calculate landscape metrics. Ecography 42, 1648–1657. doi: 10.1111/ecog.2019.v42.i10
Hochachka W. M., Fink D., Hutchinson R. A., Sheldon D., Wong W.-K., Kelling S. (2012). Data-intensive science applied to broad-scale citizen science. Trends Ecol. Evol. 27, 130–137. doi: 10.1016/j.tree.2011.11.006
Howell P. E., Terhune T. M., Martin J. A. (2021). Edge density affects demography of an exploited grassland bird. Ecosphere 12, 1–14. doi: 10.1002/ecs2.v12.5
Johnsgard P. (1991). Bustards hemipodes and sandgrouse. Birds of dry places (New York: Oxford University Press).
Johst K., Brandl R., Pfeifer R. (2001). Foraging in a patchy and dynamic landscape: human land use and the white stork. Ecol. Appl. 11, 60–69. doi: 10.1890/1051-0761(2001)011[0060:FIAPAD]2.0.CO;2
Kamiński P., Jerzak L., Kasprzak M., Kartanas E., Bocheński M., Hromada M., et al. (2020). Do agricultural environments increase the reproductive success of White Stork Ciconia ciconia populations in South-Western Poland? Sci. Total Environ. 702, 1–9. doi: 10.1016/j.scitotenv.2019.134503
Kariuki R. W., Western D., Willcock S., Marchant R. (2021). Assessing interactions between agriculture, livestock grazing and wildlife conservation land uses: a historical example from East Africa. Land 10, 1–19. doi: 10.3390/land10010046
Kennedy A. S. (2014). Birds of the Serengeti: And Ngorongoro Conservation Area Vol. 47 (Princeton, NJ: Princeton University Press).
Khalid Kija H., Ochieng Ogutu J., Johana Mangewa L., Bukombe J., Verones F., Jessen Graae B., et al. (2020). Land use and land cover change within and around the Greater Serengeti Ecosystem, Tanzania. Am. J. Remote Sens. 8, 1–19. doi: 10.11648/j.ajrs.20200801.11
Kittur S., Sundar K. S. G. (2020). Density, flock size and habitat preference of woolly-necked storks Ciconia episcopus in agricultural landscapes of south Asia. SIS Conserv. 2, 71–79.
Kock N., Lynn G. (2012). Lateral collinearity and misleading results in variance-based SEM: an illustration and recommendations. J. Assoc. Inf. Syst. 13, 546–580. doi: 10.17705/1jais.00302
Kronenberg J., Andersson E., Tryjanowski P. (2017). Connecting the social and the ecological in the focal species concept: case study of White Stork. Nat. Conserv. 22, 79–105. doi: 10.3897/natureconservation.22.12055
Lee A. T. K., Brooks M., Underhill L. G. (2022). The SABAP2 legacy: A review of the history and use of data generated by a long-running citizen science project. South Afr. J. Sci. 118, 1–4. doi: 10.17159/sajs.2022/12030
McKinley D. C., Miller-Rushing A. J., Ballard H. L., Bonney R., Brown H., Cook-Patton S. C., et al. (2017). Citizen science can improve conservation science, natural resource management, and environmental protection. Biol. Conserv. 208, 15–28. doi: 10.1016/j.biocon.2016.05.015
Mmassy E. C., May R., Jackson C., Kleven O., Nygård T., Bevanger K., et al. (2019). Resource utilization by the Kori bustard in the Serengeti ecosystem. PLoS One 14, 1–15. doi: 10.1371/journal.pone.0221035
Morán-López T., Fernández M., Alonso C. L., Flores-Rentería D., Valladares F., Díaz M. (2015). Effects of forest fragmentation on the oak–rodent mutualism. Oikos 124, 1482–1491. doi: 10.1111/oik.02061
Muchai M., Bennun L., Lens L., Rayment M., Pisano G. (2001). Land-use and the conservation of Sharpe’s Longclaw Macronyx sharpei in centralKenya. Bird Conserv. Int. 12, 107–121. doi: 10.1017/S0959270902002071
Muchai M., Lens L., Bennun L. (2002). Habitat selection and conservation of Sharpe’s longclaw (Macronyx sharpei), a threatened Kenyan grassland endemic. Biol. Conserv. 105, 271–277. doi: 10.1016/S0006-3207(01)00118-5
Muriithi F. K. (2016). Land use and land cover (LULC) changes in semi-arid sub-watersheds of Laikipia and Athi River basins, Kenya, as influenced by expanding intensive commercial horticulture. Remote Sens. Applications: Soc. Environ. 3, 73–88. doi: 10.1016/j.rsase.2016.01.002
Mwangi F., Zhang Q., Wang H. (2022). Development challenges and management strategies on the Kenyan National Park System: A case of Nairobi National Park. Int. J. Geoheritage Parks 10, 16–26. doi: 10.1016/j.ijgeop.2022.02.003
Ndegwa Mundia C., Murayama Y. (2009). Analysis of land use/cover changes and animal population dynamics in a wildlife sanctuary in East Africa. Remote Sens. 1, 952–970. doi: 10.3390/rs1040952
Njoroge P., Brooks M. (2019). Kenya bird map (full protocol and adhoc records) (FitzPatrick Institute of African Ornithology). doi: 10.15468/2lrl79
Ogutu J. O., Piepho H. P., Dublin H. T., Bhola N., Reid R. (2009). Dynamics of Mara–Serengeti ungulates in relation to land use changes. J. Zoology 278, 1–14. doi: 10.1111/j.1469-7998.2008.00536.x
Ogutu J. O., Smith N. O., Piepho H.-P., Said M. Y., Kifugo S. C., Reid R. S., et al. (2013). Changing wildlife populations in Nairobi National Park and adjoining Athi-Kaputiei Plains: Collapse of the migratory wildebeest. Open Conserv. Biol. J. 7, 11–26. doi: 10.2174/1874839201307010011
Ong’ondo F. J., Ambinakudige S., Malaki P. A., Njoroge P., Ahmad H. (2025). Using geographic information systems and remote sensing technique to classify land cover types and predict grassland bird abundance and distribution in Nairobi National Park, Kenya. Int. J. Geoheritage Parks 2, 1–27. doi: 10.1016/j.ijgeop.2025.02.003
Ong’ondo F. J., Fogarty F. A., Njoroge P., Johnson M. D. (2022). Bird abundance and diversity in shade coffee and natural forest Kenya. Global Ecol. Conserv. 39, 1–13.
Orłowski G., Karg J., Jerzak L., Bocheński M., Profus P., Książkiewicz-Parulska Z., et al. (2019). Linking land cover satellite data with dietary variation and reproductive output in an opportunistic forager: Arable land use can boost an ontogenetic trophic bottleneck in the White Stork. Sci. Total Environ. 646, 491–502. doi: 10.1016/j.scitotenv.2018.07.297
Pocock M. J. O., Roy H. E., August T., Kuria A., Barasa F., Bett J., et al. (2019). Developing the global potential of citizen science: assessing opportunities that benefit people, society and the environment in East Africa. A. McKenzie editor. J. Appl. Ecol. 56, 274–281. doi: 10.1111/jpe.2019.56.issue-2
Pulliam H. R., Dunning J. B., Liu J. (1992). Population dynamics in complex landscapes: a case study. Ecol. Appl. 2, 165–177. doi: 10.2307/1941773
Savan B., Morgan A. J., Gore C. (2003). Volunteer environmental monitoring and the role of the universities: the case of citizens’ environment watch. Environ. Manage. 31, 561–568. doi: 10.1007/s00267-002-2897-y
Tende T., Iniunam I. A., Ivande S. T., Awoyemi A. G., Danmallam B. A., Ringim A. S., et al. (2024). Citizen science mitigates the lack of distributional data on Nigerian birds. Ecol. Evol. 14, 1–10. doi: 10.1002/ece3.11280
Thompson D. M., Serneels S., Lambin E. F. (2002). “Land use strategies in the Mara Ecosystem: a spatial analysis linking socio-economic data with landscape variables,” in Linking People, Place, and Policy. Eds. Walsh S. J., Crews-Meyer K. A. (Springer US, Boston, MA), 39–68.
Turner M. G. (1989). Landscape ecology: the effect of pattern on process. Annu. Rev. Ecology Evolution Systematics 20, 171–197. doi: 10.1146/annurev.es.20.110189.001131
Underhill L. G., Brooks M., Loftie-Eaton M. (2017). The Second Southern African Bird Atlas Project: protocol, process, product. Vogelwelt 137, 64–70.
Wernham C. V., Baillie S. R., Clark J. A., Crick H. Q. P., Siriwardena G. M. (1998). The BTO integrated population monitoring programme: the contributions of ringing. Acta Zoologica Lituanica 8, 93–105. doi: 10.1080/13921657.1998.10541488
Winter M., Johnson D. H., Shaffer J. A., Donovan T. M., Svedarsky W. D. (2006). Patch size and landscape effects on density and nesting success of grassland birds. J. Wildlife Manage. 70, 158–172. doi: 10.2193/0022-541X(2006)70[158:PSALEO]2.0.CO;2
Wolff A., Dieuleveut T., Martin J.-L., Bretagnolle V. (2002). Landscape context and little bustard abundance in a fragmented steppe: implications for reserve management in mosaic landscapes. Biol. Conserv. 107, 211–220. doi: 10.1016/S0006-3207(02)00087-3
Zhang Y., Yu J., Sichilima A. M., Wang W., Lu J. (2016). Effects of thinning on scatter-hoarding by rodents in temperate forest. Integr. Zoology 11, 182–190. doi: 10.1111/inz2.2016.11.issue-3
Keywords: citizen science, Kenya bird map, Africa, Kenya, predict, bustard, stork, harrier
Citation: Ong’ondo FJ, Trevelyan R, Kuria A, Njoroge P, Guchu S and Jackson C (2025) Predicting the distribution and abundance of bustards, storks, and harriers in Kenya using citizen science data. Front. Ecol. Evol. 13:1489795. doi: 10.3389/fevo.2025.1489795
Received: 02 September 2024; Accepted: 21 March 2025;
Published: 14 April 2025.
Edited by:
Peter Convey, British Antarctic Survey (BAS), United KingdomReviewed by:
Jake L. Snaddon, University of Belize, BelizeMuhammad Kabir, The University of Haripur, Pakistan
Copyright © 2025 Ong’ondo, Trevelyan, Kuria, Njoroge, Guchu and Jackson. This is an open-access article distributed under the terms of the Creative Commons Attribution License (CC BY). The use, distribution or reproduction in other forums is permitted, provided the original author(s) and the copyright owner(s) are credited and that the original publication in this journal is cited, in accordance with accepted academic practice. No use, distribution or reproduction is permitted which does not comply with these terms.
*Correspondence: Frank Juma Ong’ondo, ZmpvMTJAbXNzdGF0ZS5lZHU=