 Katherine G.W. Hill1*
 Steven Delean1
 Susan A. Robinson2Tony Hall3
 Jonathan J. Tyler4Oliver C. Stringham1,5,6
 Phillip Cassey1
- 1Department of Ecology and Evolutionary Biology, University of Adelaide, Adelaide, SA, Australia
- 2Invasive Species Branch, Biosecurity Tasmania, Hobart, TAS, Australia
- 3Mawson Analytical Spectrometry Services (M.A.S.S.), Engineering and Technology, University of Adelaide, Adelaide, SA, Australia
- 4School of Physics, Chemistry and Earth Sciences and Sprigg Geobiology Centre, University of Adelaide, Adelaide, SA, Australia
- 5School of Mathematical Sciences, University of Adelaide, Adelaide, SA, Australia
- 6Rutgers Climate and Energy Institute, Rutgers, The State University of New Jersey, New Brunswick, NJ, United States
Introduction: Rainbow Lorikeets (Trichoglossus moluccanus) are a highly desirable bird in Australian pet trade and consequently have established invasive populations outside their native range. These birds are aggressive, outcompete native species, and cause significant damage to agriculture. Invasive populations have not been impacted by existing management practices, and it is unclear if their persistence is due to their high reproductive success in the wild, or from regular escapes from captivity.
Methods: We tested the ability of stable isotope analysis to identify recently escaped captive Rainbow Lorikeets in wild populations within Australia. We compared the stable carbon (δ13C) and nitrogen (δ15N) isotopes of captive birds to three wild populations at different stages of the pet-release pathway: (i) birds within their native distribution; (ii) a newly established population; and (iii) a large invasive population.
Results: We found evidence of two escaped captive birds in the newly established population due to the higher and more variable δ13C, which is likely driven by the consumption of nectar supplements. The invasive population had a similar isotopic niche area to the native population; potentially indicating the invasive birds have adapted to the environment and learnt to consume a large variety of local food sources, therefore reducing the effectiveness of detecting recent escapees.
Discussion: Therefore, for contained wild populations with small isotopic niches, stable isotope analysis can be a useful tool to identify captive escapees and can inform management of invasive species incursions.
Introduction
The exotic pet trade facilitates a novel introduction pathway for new invasive alien populations to establish, which can lead to significant damage to environments and economies (Hulme, 2015; Lockwood et al., 2019; Bradshaw et al., 2021). Once an exotic pet is transported and sold outside its native range, it can be intentionally or unintentionally released from captivity, where they may survive and establish a wild population and spread (Cassey and Hogg, 2015; Vall-llosera and Cassey, 2017b; Toomes et al., 2022). Prevention and early management of potentially invasive species lowers the environmental and economic damages, while also increasing the likelihood of success and cost-effectiveness of eradication (Keller et al., 2007; Henderson et al., 2011).
The Rainbow Lorikeet (Trichoglossus moluccanus) is a highly charismatic Australian parrot species native to the east and south-eastern coast of mainland Australia (Figure 1). Rainbow Lorikeets are also one of the most popular pet bird species (Vall-llosera and Cassey, 2017a; Chan et al., 2021; Hill et al., 2023), and as a consequence, have been introduced outside their native range in within Australia and internationally. These birds are intentionally or accidentally released from captivity and have species characteristics correlated with higher probabilities of escape, as well as being abundant in captivity and affordable in trade (Vall-llosera and Cassey, 2017a; Chan et al., 2021; Hill et al., 2023). Escaped birds are particularly prevalent in urban areas, where a higher density of pet birds are kept (Shukuroglou and McCarthy, 2006; Vall-llosera and Cassey, 2017b; Stanley et al., 2023). Rainbow Lorikeets can readily adapt to new urban environments due to their nectivorous diet and can exploit the high proportion of nectar-rich plants (Davis et al., 2012). In addition to nectar, Rainbow Lorikeets have adapted to consume a wide variety of food sources, such as insects, seeds, flowers and fruits; however, their complete diet is relatively unknown (Cabana and Lee, 2019). Consequently, international pet trade has resulted in introduced populations in New Zealand (Polkanov and Greene, 2000) and Singapore (Neo, 2012). Domestic Australian trade has introduced populations outside their native range (Toomes et al., 2025) in Tasmania (Robinson et al., 2020), and are considered invasive in Western Australia (Chapman, 2005) where they compete with local species for hollows and food (Ambrose et al., 1990; Hingston, 2019a), hybridize with other native lorikeet species (Hingston, 2019b), and cause significant damage to agriculture, particularly to fruit crops (Bomford and Sinclair, 2002).
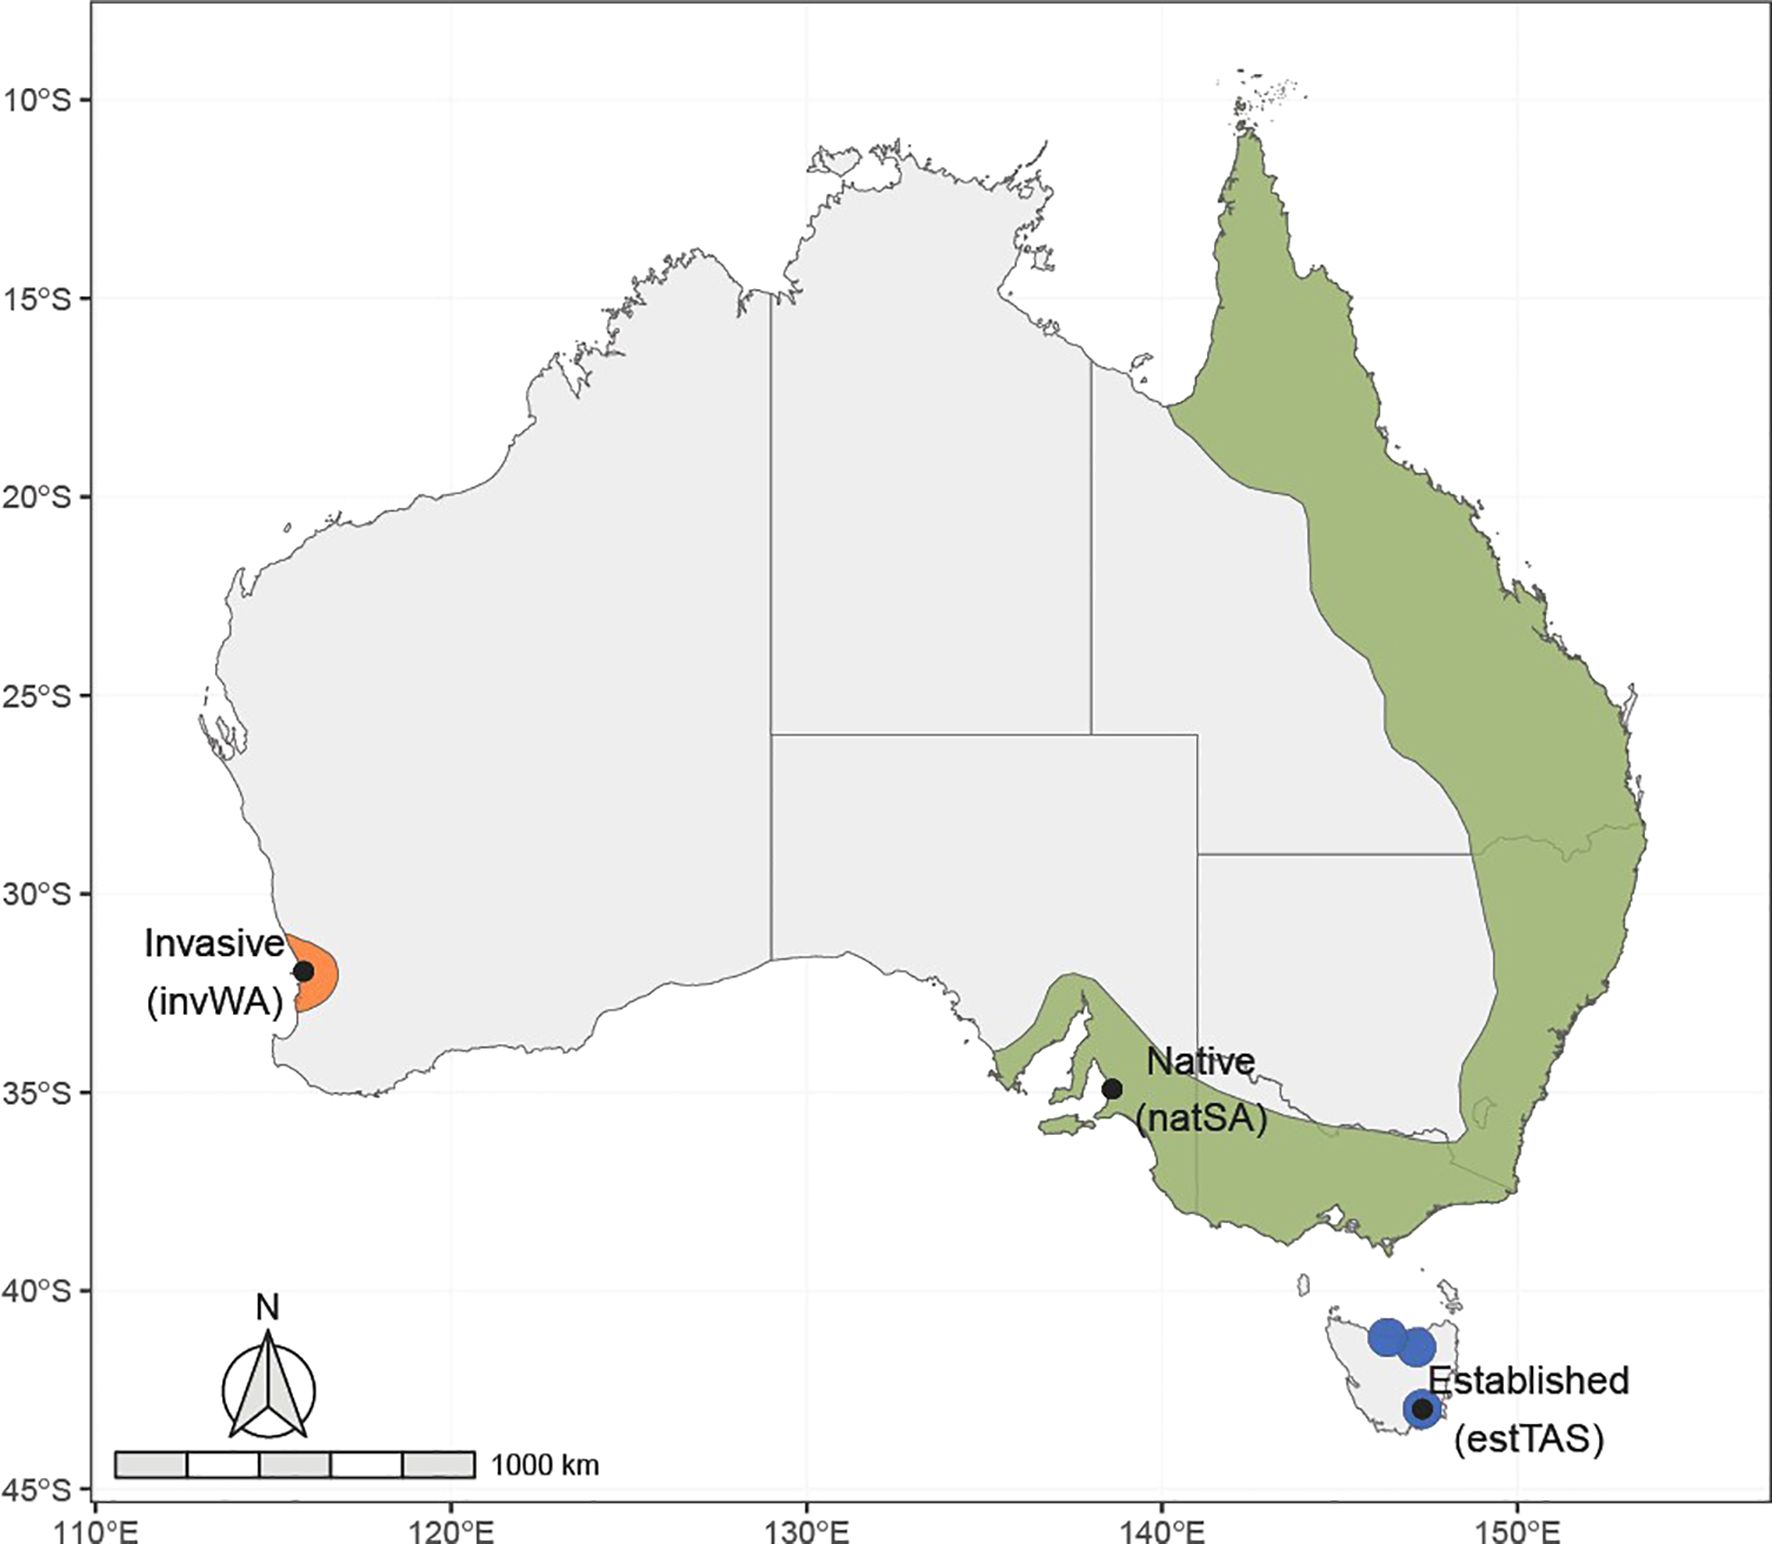
Figure 1. native (green), invasive (orange), and the three newly established (blue) populations of the Rainbow Lorikeet in Australia, and the three sampling locations for the three wild populations: South Australia (natSA, n = 33); Tasmania (estTAS, n = 47); and Western Australia (invWA, n = 40).
Tasmanian and Western Australian Rainbow Lorikeets represent two populations at different stages of the pet-release invasion pathway. In the recently established population in Tasmania, the first breeding pair outside of captivity was observed in 2007 (Robinson et al., 2020). Import of the species was banned in 2011; however, pet-keeping is still allowed for captive individuals imported before these restrictions (Wildlife Management Branch, 2017). Despite early and ongoing management efforts (i.e., culling), there are now three self-sustaining populations, each with an estimated maximum population size of approximately 500 individuals (Robinson et al., 2020). The invasive Western Australian population likely originated from a small number of captive releases around Perth in the 1960s (Long and Tingay, 1981; Coyle, 1988). This population rapidly expanded in size and range and is now the most observed bird in the State (Birdlife Australia, 2022) with an estimated 40,000 birds in 2018 (Pickering, 2018). While being a declared pest, they may still be kept as pets, providing opportunity for recent captive escapees to continue and contribute to their population growth (Wildlife Management Branch, 2017).
Despite the high risks of Rainbow Lorikeets to environments and economies, Rainbow Lorikeets are still legally traded in Australia in large numbers (Hill et al., 2023). Permits are required for keeping Rainbow Lorikeets in Western Australia and Tasmania (Wildlife Management Branch, 2017), which may reduce the number of birds sold (Toomes et al., 2022). However, these regulations do not prevent captive birds from escaping to potentially create, or contribute to existing, invasive populations. For example, the removal of individuals from invasive Tasmanian populations has been ineffective in controlling their population size (Cobden et al., 2021). For this Tasmanian population of Rainbow Lorikeets, it is unclear if recovery from management is due to their high fecundity, or from regular immigration from captivity.
Biosecurity efforts currently lack the technology to identify recent captive escapees rapidly and cost-effectively from a ‘true’ wild animal, which can assist with detecting invasive incursions in invasive populations. Here, we consider a “true wild animal” as either an individual that was born in the wild, or an individual that escaped from captivity and has survived and reproduced in the wild for some time, regardless of whether it is within its native range. Detection and monitoring of established populations often rely on surveys, which, without other early detection methods, may not identify an established population until it has grown to an unmanageable size (e.g., Robey et al., 2011; Tingley et al., 2015). Furthermore, understanding the proportion of captive escapees in an already established population can inform where management can be most effective to minimizing future risks. Specifically, if population growth is being aided by captive escapees, management efforts can focus on limiting pet ownership through stricter permit systems (Toomes et al., 2022) or through public education campaigns (e.g., the Habitattitude program; Reaser and Meyers 2007). While DNA methods such as pedigree testing may identify if an animal was bred in captivity (e.g., Frankham et al., 2015), this method can be resource-heavy, and does not apply for invasive populations which are recently descendant from captive escapees, such as Rainbow Lorikeets.
Stable isotope analysis (SIA) is an emerging tool in wildlife trade monitoring to determine captive and wild origins of wildlife (Prigge et al., 2025; Natusch et al., 2017; Ziegler et al., 2018; Andersson et al., 2021). However, its use in invasive species management is relatively unexplored (Brasileiro et al., 2023; Hill et al., 2020). As the stable isotope ratios in an animal’s tissue are strongly related to its diet, SIA can provide a snapshot of an animal’s dietary history, and thus its environmental origin (Kelly, 2000); especially considering that the diet of a wild and captive bird can vary dramatically. Stable carbon isotope ratios (13C/12C, reported as δ13C) vary significantly in relation to the plant material an animal consumes (Hobson and Clark, 1992), such as the proportion of C3 and C4 plants, plant water stress, marine and freshwater origins, and horticultural fertilizers (Hoefs, 2021). Nitrogen isotope ratios (15N/14N, δ15N) are partly influenced by an animal’s trophic position (Post, 2002). δ15N varies due to a variety of processes related to nitrogen cycling between the atmosphere, soils, and water, and the subsequent assimilation by plants. These are likely to differ markedly between natural and agricultural plants, as well as between different plant types; notably N-fixing legumes and those that rely on the assimilation of nitrate. For captive Rainbow Lorikeets, δ13C and δ15N is likely further influenced by consumption of unique food sources not available to wild birds, such as nectar supplements (Cabana and Lee, 2019). SIA of a feather reflects the δ13C and δ15N composition of the bird’s diet over the course of its growth and remains inert until molt, which for Rainbow Lorikeets is one year (Ambrose et al., 1990; Hobson and Wassenaar, 2018).
While the use of SIA to determine captive or wild origins has shown promise in parrot species (Alexander et al., 2019; Andersson et al., 2021), its efficacy is potentially reduced in species with generalist diets and large range sizes (Hill et al., 2025). Generalist species, and species with large range sizes, occupy larger isotopic niches (i.e., the range of stable isotope ratios within a population) (Bearhop et al., 2004), which may overlap with the diet of captive animals. This overlap in isotopic niche could be most pronounced when wild birds become urban adaptors and have access to food presumed to be only accessible to captive birds, such as household gardens, crops, or foraging in human food waste (Klump et al., 2021). Additionally, an invasive population is likely to increase its isotopic niche over time, as the birds adapt to their new environment and learn to access a wider range of food sources (Sol and Lefebvre, 2000). Nonetheless, the analysis of stable carbon and nitrogen isotopes on well-adapted, large invasive populations has yet to be explored and may assist in the management of relatively new invasive populations in restricted areas.
Here, we investigate the use of δ13C and δ15N analyses to detect recently escaped birds within three wild populations of Rainbow Lorikeets in Australia. We test the precision of this approach by measuring repeatability within an individual and compare the isotopic niche areas of captive Rainbow Lorikeets with three wild populations (i) within its native range, (ii) a newly established population, and (iii) a large invasive population. Finally, we apply these methods to estimate the proportion of potential captive escapees in each of the wild populations.
Methods
Sample collection
We collected feathers from Rainbow Lorikeets from four distinct populations in Australia: (i) birds kept in captivity (CAP); (ii) a native population in South Australia (natSA); (iii) a recently established and actively managed population in Tasmania (estTAS); and (iv) a widespread invasive population in Western Australia (invWA) (Figure 1).
For the CAP and natSA populations, we created a citizen science project to ensure we had feathers from a wide variety of locations and different aviaries and captive environments. We asked owners of captive parrots, aviaries, pet stores and zoos to collect naturally dropped feathers from their birds. Owners also provided the approximate age of their birds, to ensure we only included adults, as well as samples of nectar supplements often fed to their birds. Similarly, we asked participants to collect lorikeet feathers found in backyards from wild birds. These feathers were sent via post, labelled with the collection date and location, precise to postcode, and species was verified once received. As Rainbow Lorikeets molt over summer, feathers were collected over two summers from December 2020 to March 2022. All data on participants was collected according to established ethical standards for deidentifying personal data, and we received ethics approval from the University of Adelaide (HREC no. H-2020-184). See Hill et al. (2025) for more information on the citizen science project.
We received feathers from 18 captive individuals, predominantly from South Australia (n = 16), with additional samples from New South Wales (n = 1) and Queensland (n = 1). We hypothesized all captive birds to have similar diets and a smaller isotopic niche due to the similar commercial food products provided to captive birds. We also measured three brands of nectar supplements provided by owners (3 replicates per brand).
Furthermore, we selected a total of 33 natSA feathers collected through this program for analysis, by randomly selecting body feathers from each postcode to represent as wide a geographical area as possible within South Australia. When selecting feathers from similar locations, we used feathers collected from different times to minimize the chance of sampling the same individual. As we were unable to collect multiple feathers from the same wild individual, we also obtained feathers from two additional wild origin birds from the South Australian Museum collection to measure individual variation. As Rainbow Lorikeets within their native distribution are very well adapted to urban environments and can exploit a wide range of food sources (Veerman, 1991; Shukuroglou and McCarthy, 2006), we hypothesized their isotopic niche would be the largest of the wild populations.
For the estTAS population, we measured feathers from 47 birds euthanized in management efforts collected from Kingston Beach, the southern-most established population, in June 2021. We hypothesized that this population, due to its relatively small geographic range and likely limited adaption to local food sources, would have a smaller isotopic niche in comparison to the widespread native and invasive populations.
For the invWA population, we measured feathers from 40 birds found in metropolitan Perth, which were sent to Native Animal Rescue and humanely euthanized according to the Animal Welfare Act 2002 as pest animals, between January and August 2022. Due to how widespread this population is and the adaptability of Rainbow Lorikeets in urban environments, we hypothesized this population would have a highly varied diet and show a similarly large isotopic niche to the native population.
Stable isotope analyses
Feathers were cleaned by washing with scientific-grade detergent (Decon® 90) and water to remove surface contamination, and then repeatedly submerged in baths of 2:1 diethyl ether:methanol to remove lipids, following Bontempo et al. (2014). Feather vanes were separated from the rachis with sterile dissecting scissors and cut into small sections.
Random samples of each feather’s vane were weighed accurately into tin capsules and sealed for analysis, using approximately 0.35 to 0.45mg to optimize readings. The samples were analyzed for 13C/12C and 15N/14N using a continuous flow isotope ratio mass spectrometer (Nu Horizon, Wrexham, UK) equipped with an elemental analyzer (EA3000, EuroVector, Pavia, Italy). Stable isotope ratios are expressed in δ notation as deviations from a standard in parts per mil (δX‰):
Where Rsample is the atomic ratio of 13C/12C or 15N/14N in the sample, and Rstandard is this ratio in the standard. δ13C was reported relative to the standard Vienna Pee Dee Belemnite (VPDB) and δ15N was reported relative to atmospheric N2 (AIR). All samples were corrected for instrument drift and normalized according to reference values using in-house standards (n =19); δ13C = glycine -31.2‰, glutamic acid -16.72‰, and triphenylamine (TPA) -29.2‰; and δ15N = glycine 1.32‰, glutamic acid -6.18‰, and triphenylamine (TPA) -0.54‰. The in-house standards were calibrated against USGS and IAEA certified reference materials (USGS40, USGS 41, IAEA-2).
Investigating sources of variation
As we included captive birds from a variety of locations, including different Australian States, we ensured the location of the feather did not significantly influence stable isotope ratios. We tested for spatial autocorrelation within body feathers from the CAP population using Moran’s I (Legendre and Legendre, 2012).
It is common in wildlife management to only have access to body feathers, as is the case here for the invWA and estTAS populations. Therefore, we aimed to investigate if the choice of feather influenced the stable isotope ratios, and if repeat sampling was necessary to obtain accurate measures for individual birds. Here, we had four levels of sampling that could introduce variation: (i) between individuals (individual); (ii) between feather types (feather type); (iii) between feathers of the same type (feather replicate); and (iv) between replicates from the same feather (replicate). While this has been investigated in some depth in other birds (e.g., Grecian et al., 2015; Greer et al., 2015; Symes et al., 2017), Rainbow Lorikeets have highly variable diets and are locally nomadic, which may influence stable isotope ratios (Cannon, 1984; Ambrose et al., 1990; Klump et al., 2021). To investigate the variation within each level of sampling, we created a pilot dataset of five individual birds (three CAP and two natSA). From each bird, we measured δ13C and δ15N at three sampling levels: three feather types (body, primary wing, and tail); three feathers per feather type; and two replicates per feather.
To investigate differences between feather types, we used linear mixed effects models with and without feather type as a term, with the other levels of sampling (individual and feather replicate) as random effects. We compared these models with likelihood ratio tests and identified specific differences between feather types using Holm-Bonferroni corrected contrasts (Lenth, 2022; Bates et al., 2015). We then identified which level of sampling introduced the greatest proportion of variation by investigating the components of variation in these linear mixed effects models. To investigate the relative variability within each level of sampling, we calculated repeatability estimates (R), which determines the chance of obtaining the true stable isotope ratio of the population if only one sample of that level was taken (Choudhary and Nagaraja, 2017). Using the pilot dataset, we calculated R for each level using parametric bootstrapping, where linear model ignored the other levels of sampling to see how the relative variation changed (Stoffel et al., 2017). Estimates closer to 1 indicate higher repeatability, or low variation at that level.
Finally, we compared mean stable isotope values of all four populations (one captive and three wild) using separate linear mixed effects models for each of δ13C and δ15N, with individual and feather replicate as random intercepts and identified specific differences with Tukey HSD. We included the δ13C and δ15N means and standard deviations of the three captive nectar supplements to inspect the potential influence of different brands on the captive bird values visually.
Comparing isotopic niches
To investigate variability in diets between the four populations, we quantified the area of isotopic niches: the range of values each population occupies in bivariate space (i.e., δ13C and δ15N) using ellipses (estimated with the SIBER package in R; Jackson et al., 2011). To account for the potential variation introduced by multiple hierarchical levels of sampling, we aggregated the data to the mean stable isotope ratio per bird (i.e., mean of 2 feather replicates per individual bird; see Supplementary Information 3 for non-aggregated results and dataset).
The calculation of the isotopic niche area with the Standard Ellipse Area (SEA) using the SIBER model assumes that the relationship between δ13C and δ15N is described by a multivariate normal distribution (Jackson et al., 2011). To evaluate this assumption, we examined if the data conformed to a multivariate normal distribution with tests of Mardia’s multivariate skewness and kurtosis coefficients (Mardia, 1970). Where there was evidence that the assumption was not met, we modified the SIBER model to assume a multivariate Student’s t-distribution for the δ13C-δ15N variance-covariance relationship, which allows wider tails to the multivariate distribution thereby providing robust posterior estimates of the model parameters (Plummer, 2017). We again used Mardia’s kurtosis coefficient and quantile-quantile plots against a theoretical multivariate t-distribution to assess conformation to the assumption (Kotz and Nadarajah, 2004; Supplementary Information 2). The SIBER analysis results presented were drawn from the model fitted using the multivariate variance distribution appropriate for the data.
To quantify isotopic niches, we used SIBER to fit multiple Bayesian standard ellipses for each population that allow between-population comparisons in the presence of uncertainty (Jackson et al., 2011). Posterior distributions of the isotope mean values and the covariance matrix parameters were calculated using Markov chain Monte Carlo (MCMC) by fitting a multivariate normal distribution to each of the populations independently with JAGS via the R package “rjags” (Plummer, 2022). Uninformative priors were used for the means of each isotope ratio (µ = 0 and σ2 = 106) and a Wishart prior was used for the covariance matrix (ρ = 2; 2x2 scale matrix V with value two on the diagonal and zero on the off-diagonal) (Gelman et al., 2013). Where a multivariate t-distribution was required we generated robust estimates of the model parameters for each population by constructing the t-distribution from underlying normal and Gamma random variables (Plummer, 2017). To achieve this, we used the same uninformative priors as for the multivariate normal distribution described above with an additional prior for the degrees of freedom parameter of the t-distribution sampled from an exponential distribution with mean approximately equal to 30 (i.e., with degrees of freedom of 30 or greater the multivariate t converges to multivariate normal). The sampled degree of freedom value was used to specify the shape and rate parameters of the Gamma distribution (which in turn draws from the multivariate normal to produce a distribution with wider tails commensurate with lower degrees of freedom). Isotope values were z-score transformed prior to the analysis. We ran two MCMC chains for 40000 iterations each, discarded the first 1000 draws as burn-in, and thinned the resulting chains to retain every 10th iteration to remove autocorrelation (Jackson et al., 2011; Supplementary Information 2).
To compare sizes of isotopic niches, we calculated SEA corrected for small sample sizes (SEAC), which contains approximately 40% of the data, and identified the proportion of posterior distributions of one population which were larger than the other (Jackson et al., 2011). The resulting metrics are the permille square area (‰2), and pairwise comparisons of the number of ellipses of one population which are larger than the other. We investigated the overlap in isotopic niches, to test if SIA can potentially identify captive escapees, by calculating means and standard deviations of Bayesian estimates for ellipse overlaps over 1000 draws.
In addition to examining the isotope niche area to measure overlap between captive and wild populations, we examined whether the populations could be classified in bivariate space using kernel discriminant analysis (Simonoff, 2012). This nonparametric classification method does not require the underlying distributions to be multivariate normal and allows for nonlinear classification contours (Mika et al., 1999). We performed the kernel discriminant analysis with R package ks (version 1.13.5; Duong, 2022), using multivariate kernel density estimation, and the plug-in estimator to calculate the optimal bandwidth matrix. The misclassification rate (overall and within populations) was used to summarize model performance.
All analyses were conducted in the R 4.2.2 software environment for statistical and graphical computing (R Core Team, 2022). We calculated repeatability with “rptR” (version 0.9.22; Stoffel et al., 2017), linear mixed effects models with “lme4” (version 1.1-31; Bates et al., 2015), Moran’s I with “ape” (version 5.8; Paradis and Schliep, 2019), model coefficients with “emmeans” (version 1.8.2; Lenth, 2022), isotopic niche ellipses with “SIBER” (version 2.1.6; Jackson et al., 2011), variance components with “mixedup” (version 0.4.0; Clark, 2023), Mardia’s multivariate skewness and kurtosis coefficients with “MVT” (version 0.3-8; Osorio, 2023), and kernel discriminant analysis with “ks” (version 1.13.5; Duong, 2022).
Results
Investigating sources of variation
We found no evidence of the location of captive birds affecting δ13C (Moran’s I = 0.19, P = 0.08) or δ15N (Moran’s I = 0.20, P = 0.06).
In the subset of five individual birds (3 CAP and 2 natSA), there were clear differences in δ13C between feather types (χ22 = 15.2, p< 0.01; Supplementary Information 1). Specifically, tail feathers had lower δ13C than body feathers (t28.4 = 3.6, p< 0.01), and wing feathers (t27.7 = 3.9, p< 0.01). There was no difference in δ15N between feathers (χ22 = 5.5, p = 0.06). As inclusion of tail feathers may increase individual variation, we excluded them from further analyses.
Once tail feathers were excluded from analysis, within-individual repeatability was very high for δ13C (R = 0.94, p< 0.01), but low for δ15N (R = 0.75, p< 0.01). Feather type (δ13C: R = 0.95, p< 0.05; δ15N: R = 0.83, p< 0.01) and feather replicate (δ13C: R = 0.96, p< 0.01; δ15N: R = 0.90, p< 0.01) repeatability were similarly high. Most of this variation was explained by between-individual differences (94% total variation in δ13C, 74% in δ15N), followed by between-feather differences (δ13C: 3% and δ15N: 17%). Therefore, we determined that repeated sampling within each feather was not necessary, and body and primary wing feathers could be combined for analysis. However, for the estTAS and invWA populations, only body feathers were available, so the remaining analysis for these populations includes two body feathers per bird (i.e., two measures of each δ13C and δ15N per bird). Due to the nature of the citizen science collection of the CAP and natSA populations, most birds only had single feathers available, so only include one feather per bird.
Comparing isotopic niches
The CAP population’s body and wing feathers exhibited significantly higher δ13C values (mean ± SD: -21.8 ± 2.1‰) than all three wild populations: natSA (-23.2 ± 1.6‰; t133 = 9.2, p< 0.01), estTAS (-23.5 ± 1.3‰; t124 = 11.6, p< 0.01), and invWA (-22.5 ± 1.4‰; t125 = 4.7, p< 0.01; Figure 2). While the CAP population also exhibited higher δ15N values (7.5 ± 5.8‰) than invWA (5.6 ± 3.9‰; t131 = 11.6, p< 0.01), the values were similar to the natSA (8.3 ± 4.4‰; t131 = -1.8, p = 0.3) and estTAS populations (7.3 ± 3.6‰; t131 = 0.4, p = 1). The three nectar supplements showed large variability between brands, where two brands showed high δ13C in comparison to all lorikeet population means (-17.8 ± 0.6‰ and -20.6 ± 0.5‰), while one brand was very low (-24.6 ± 0.2‰). δ15N values were similarly varied between brands (5.2 ± 0.7‰, 1.5 ± 0.3‰ and 3.2 ± 0.4‰, respectively).
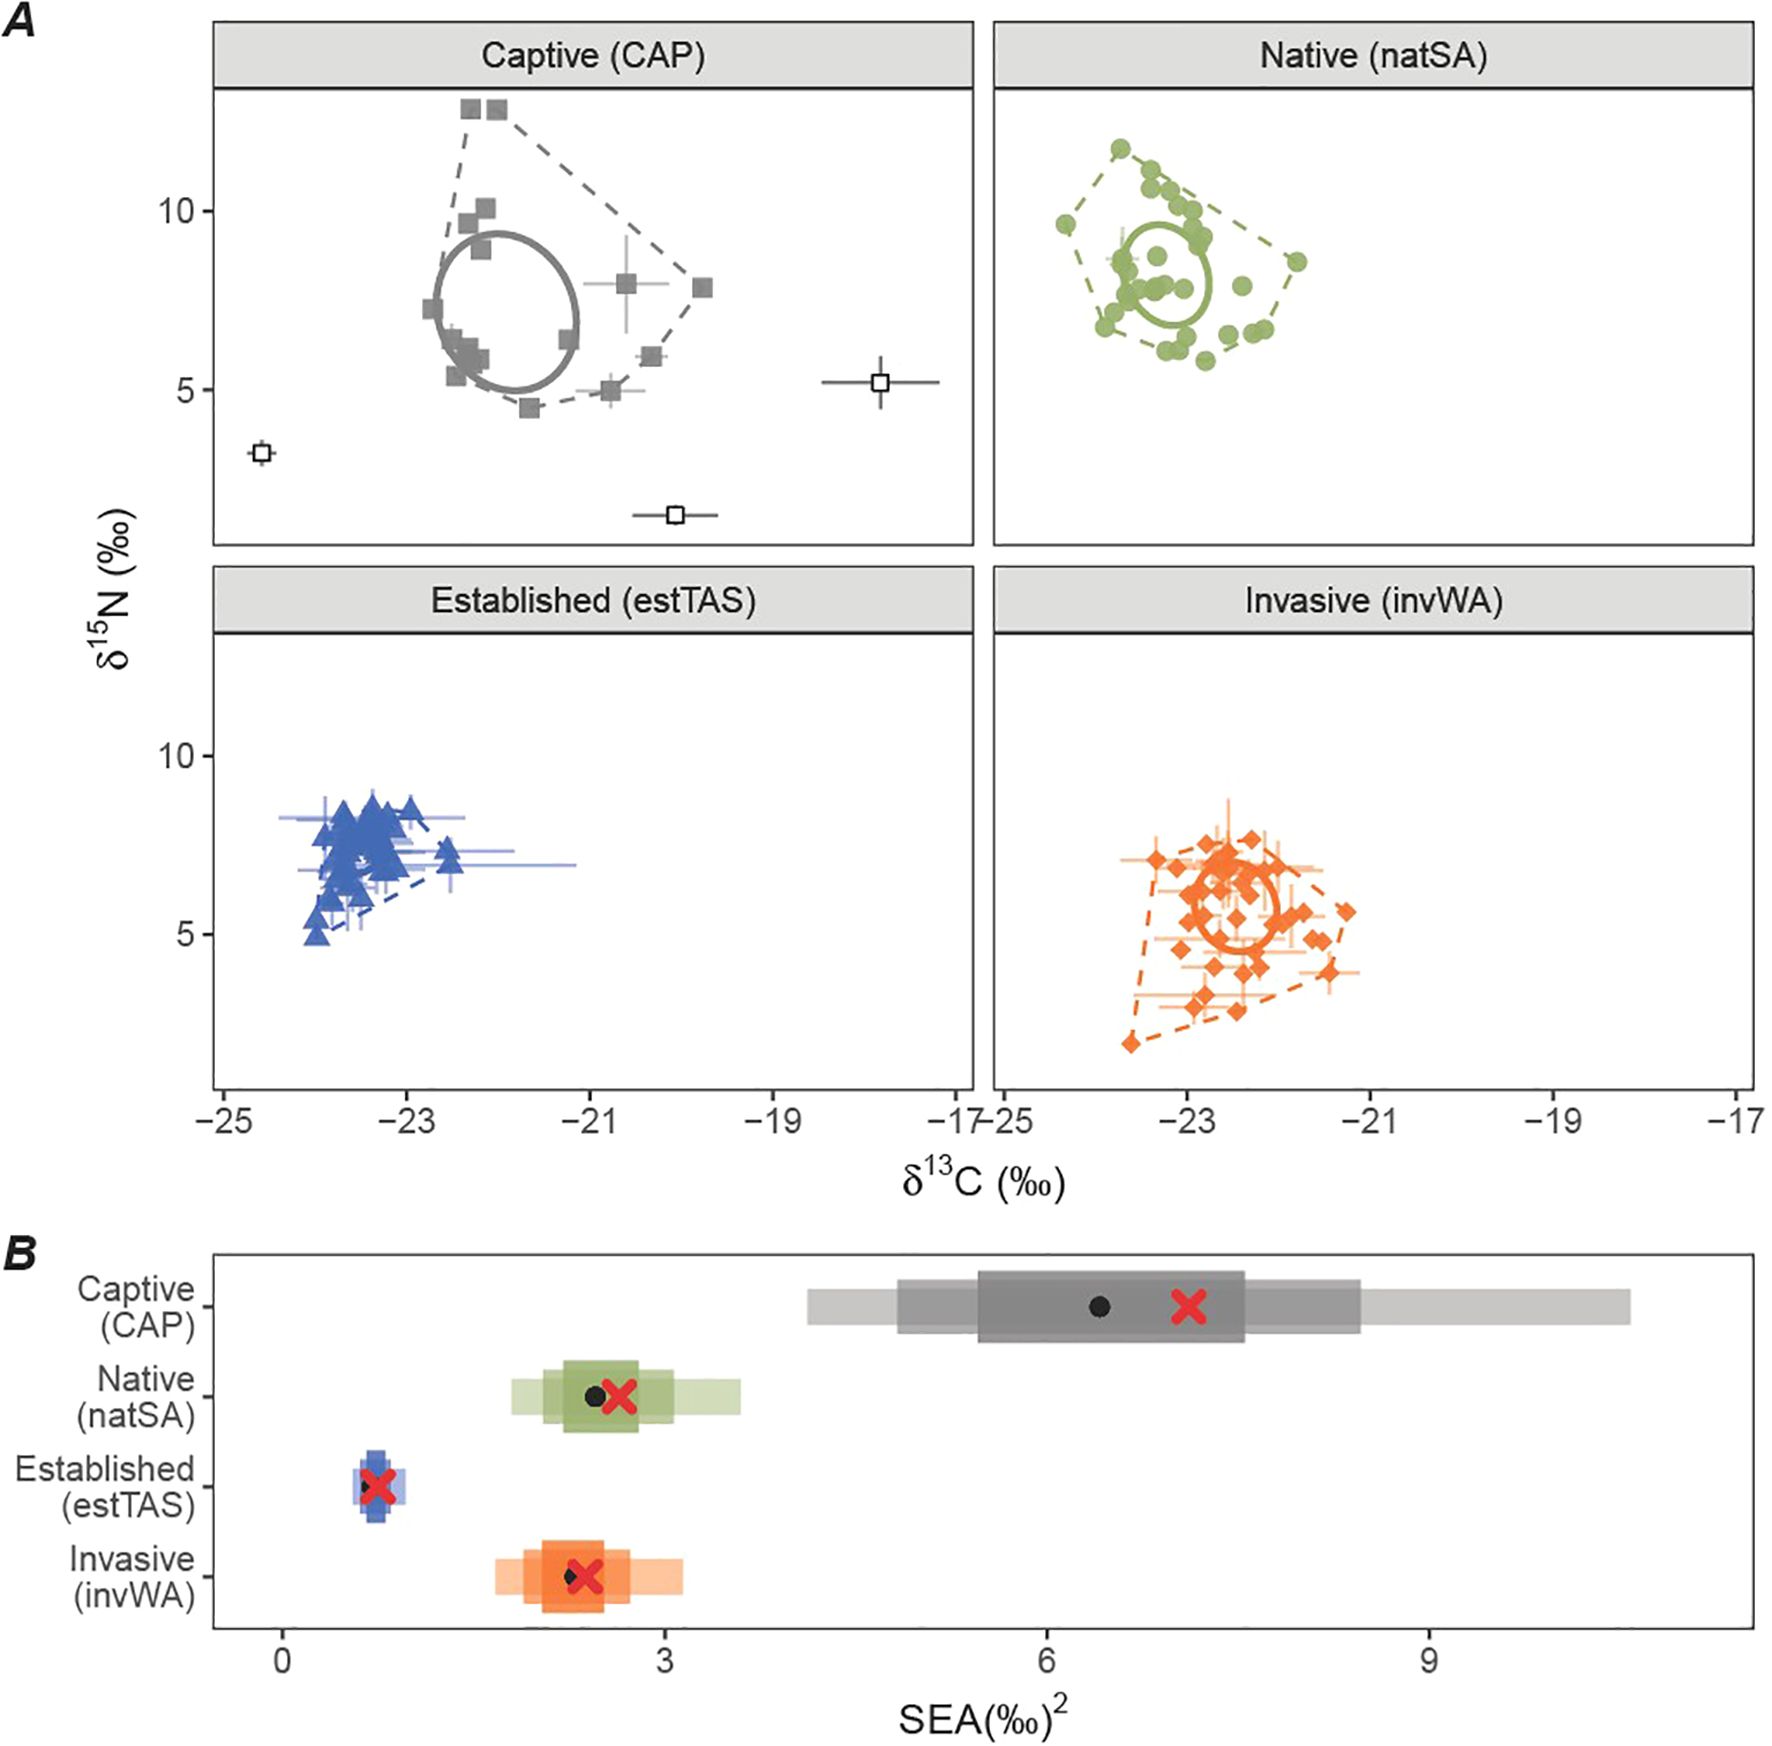
Figure 2. (A) individual means and standard deviations of stable isotope ratios of δ13C and δ15N of four populations of Rainbow Lorikeets, and the means and standard deviations of three brands of nectar supplements for captive birds (open black squares). Dotted lines indicate convex hull areas, and solid lines are standard ellipse areas. (B) Boxplot of calculated Standard Ellipse Area (SEA) for each population with maximum likelihood of the posterior mode (black point) and SEAC (red cross), and 55, 75, and 95% confidence intervals.
The CAP population had the largest isotopic niche (SEAC = 7.1‰2) of all populations, where 100% of posterior distributions were larger than those for the three wild populations. The natSA and invWA populations had similar isotopic niche sizes (SEAC = 2.6‰2 and 2.3‰2 respectively, where 66% of natSA posterior distributions were larger than invWA), and estTAS population was significantly smaller than all other populations (SEAC = 0.7‰2, 0%). The captive population’s isotopic niche overlapped with the natSA (mean ± standard deviation = 11.0 ± 17.8% of the area of the natSA mean posterior ellipse area overlapped with the CAP area), and invWA populations (31.3 ± 22.6%). There was minimal overlap with the estTAS population (1.6 ± 8.3%).
We found that the kernel discriminant analysis showed high discriminant accuracy for estTAS (98% classified correctly, Table 1) and natSA (96%). While the overall classification accuracy for invWA was relatively high (84%), only 50% of the captive individuals were classified correctly, with a large overlap with the contours between the invWA and CAP populations (Figure 3).
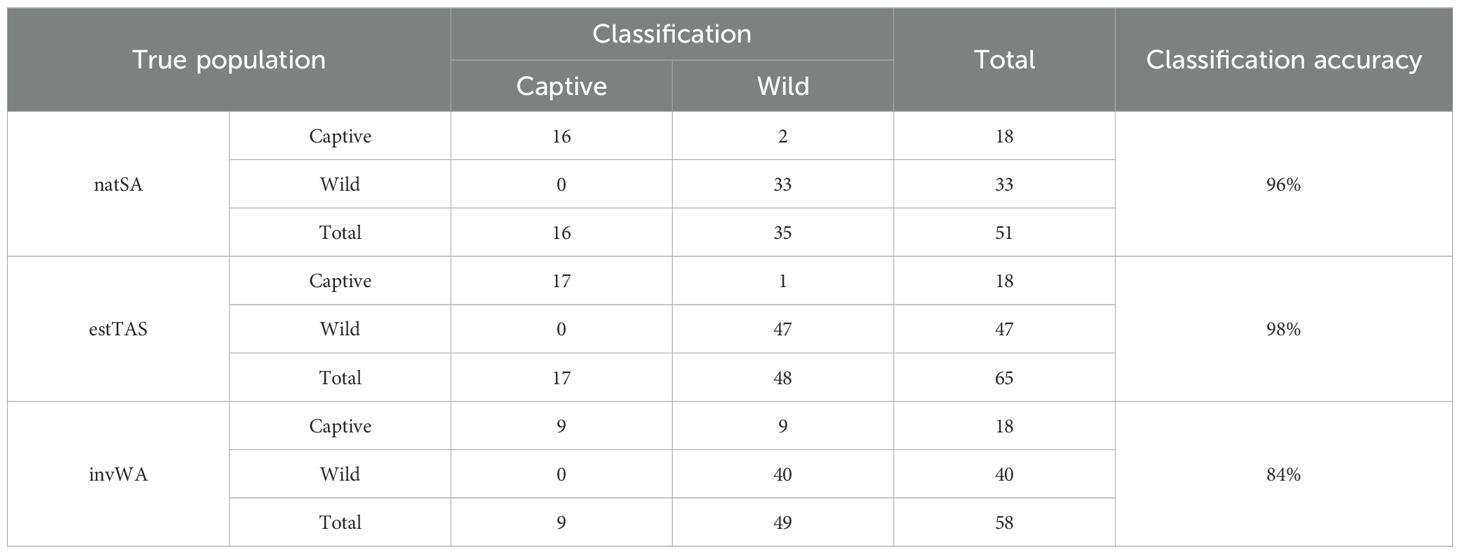
Table 1. Classification accuracy of the kernel discriminant analyses (Figure 3), using δ13C and δ15N to classify individual birds to their respective populations.
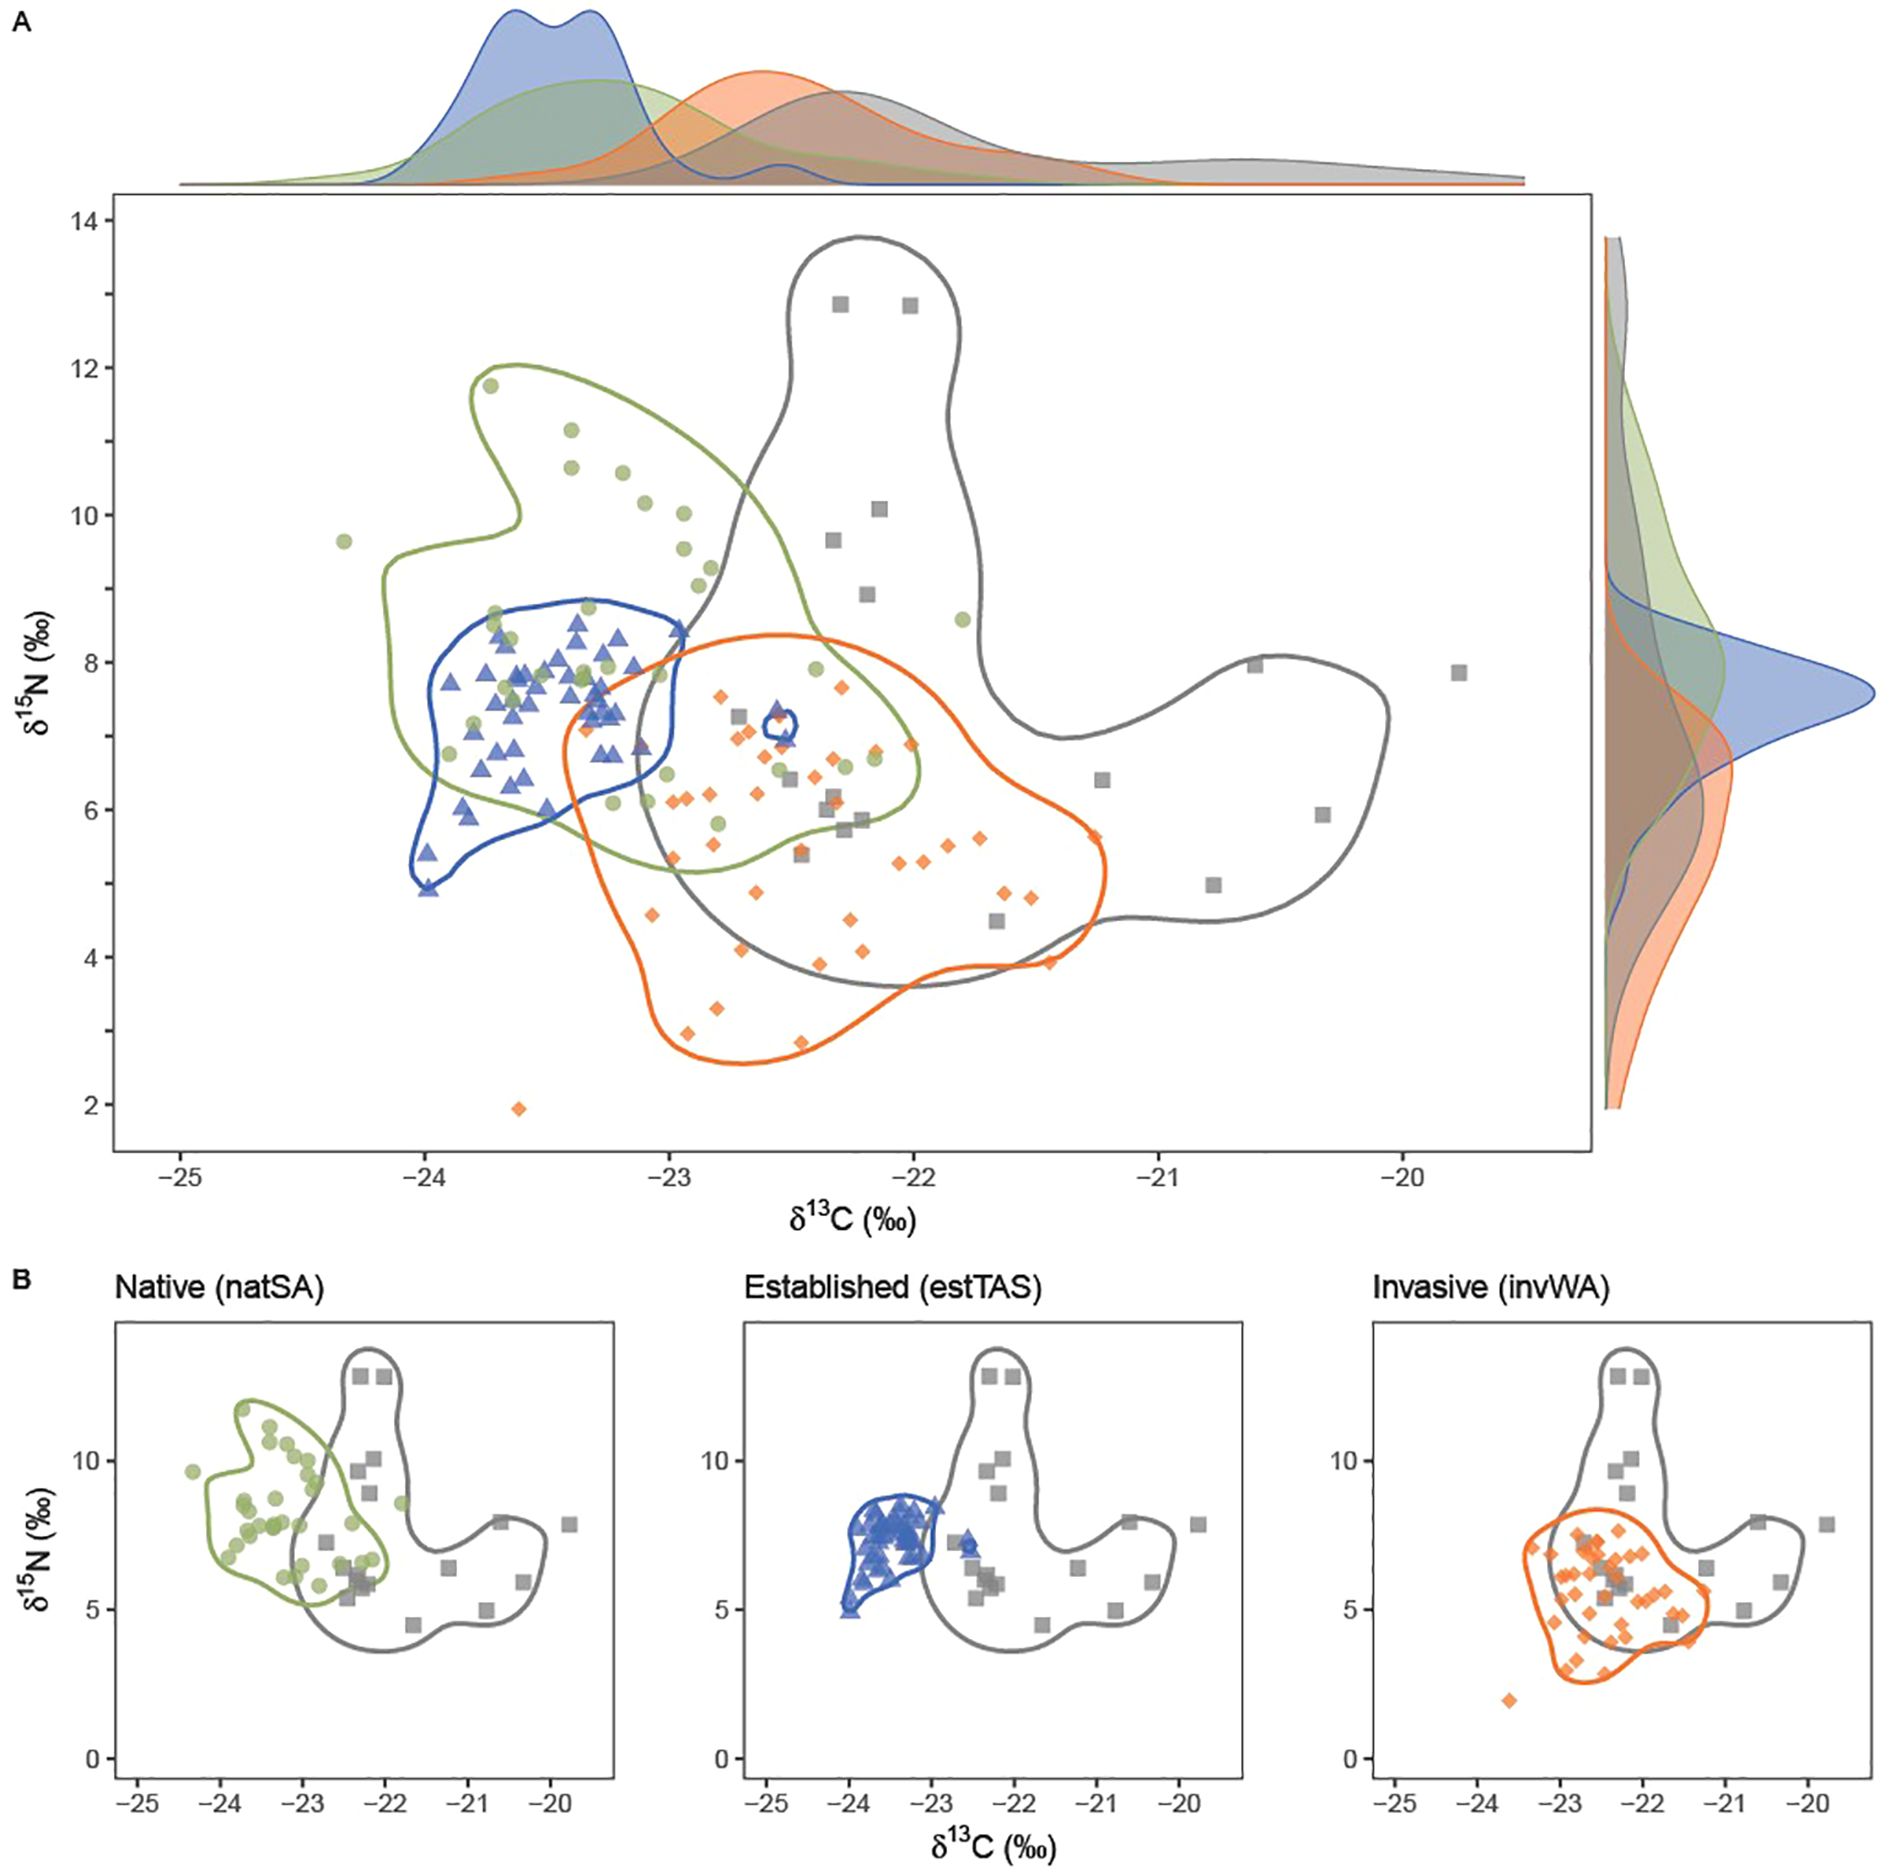
Figure 3. (A) Kernel discriminant analyses contours between the captive (CAP) population and the three wild populations: South Australia (green; natSA), Western Australia (orange; invWA), and Tasmania (blue; estTAS). Points indicate individual means of stable isotope ratios of δ13C and δ15N of four populations of Rainbow Lorikeets. Solid lines show contours of the kernel discriminant analysis to classify individuals to their respective populations. Axes show density plots for each isotope and population to visualize the distribution of δ13C and δ15N for each population and are not a part of the kernel discriminant analysis. (B) Kernel discriminant analysis plots between the captive population and each of the three wild populations.
While the kernel discriminant analysis contours for natSA, CAP, and invWA partitioned the populations into single groups, two individuals in the estTAS group had significantly higher δ13C values compared to the remaining population. While they were correctly classified as estTAS (Table 1), they were separated into a separate cluster contained within the CAP contours (Figure 3). Additionally, these two individuals have high within-individual variation in comparison to other estTAS individuals (Figure 2). Therefore, with this evidence combined, we conclude that these two individuals are likely recent captive escapees.
Discussion
Stable isotope analysis is a potential tool for managing invasive populations that have originated from the pet trade; however, our results suggest their use is limited to relatively new introduced populations, potentially due to smaller population size, geographic range size, or more restricted diet. Due to the large isotopic niche of the captive Rainbow Lorikeet population, it is likely not possible to create a reference database of “wild” and “captive” populations; however, it may be possible to use δ13C to classify outliers in small, recently established populations such as in Tasmania.
In the Tasmanian population, which is still relatively well managed and contained, analysis of stable carbon and nitrogen isotopes in the body and primary wing feathers may still be an effective tool to identify captive escapees. Here we found that two of the 47 birds from the Tasmanian population were classified into a separate cluster due to their significantly higher δ13C values, and also sit within the captive isotopic niche. The small Tasmanian isotopic niche is very restricted in comparison to the other two wild populations, and such dramatic differences in δ13C suggest these birds consume a significantly different diet and are potential captive escapees. These two birds also have some of the highest individual variation, which emphasizes the importance of repeat sampling per individual to capture recent captive escapees. As the birds in the pilot analysis showed little variation between feathers of the same body type, this variation may be due to a large change in diet between the growth of the two feathers, such as a spatial change or a recent immigration from captivity into the wild. The population we sampled is the newest of the three populations and has minimal migration from the other wild populations (Cobden et al., 2021). Therefore, these outliers are more likely to be captive escapees. We therefore have relatively high confidence that two of the 47 Tasmanian birds we sampled are recent escapees from captivity.
The captive birds exhibited a large range of δ13C values, which may be influenced by access to a variety of different nectar sources. Here we assumed the variation in captive diets was primarily driven by different feeding regimes, such as the proportions of nectar supplements, seed, and fruits and vegetables, rather than the geographic location of the captive birds within Australia. Wild lorikeets rely on nectar and pollen from flowering plants, particularly C3 eucalypts and cultivated non-native plants, which can contribute up to 95% of a bird’s total diet (Waterhouse, 1997; Smith and Lill, 2008). Nectar and pollen are a key source of protein and carbohydrates in Rainbow Lorikeet diets (Frankel and Avram, 2001). However, such high volumes of nectar are difficult to provide in captive environments, so commercial nectar supplements are commonly used. While wild birds may have access to nectar supplements in bird feeders, they are likely uncommon as they are expensive in comparison to alternatives such as bird seed. Here, we found that two of the three brands of nectar supplements had comparatively high δ13C. The main ingredients in these brands are sugars sourced from refined sugar, sugar cane, a C4 plant, which would result in higher δ13C in bird tissue compared to other C3 nectar sources (Padovan et al., 2003). One of the measured nectar supplements had low δ13C, as the main ingredients were C3 plants including wheat and oats. As these nectar supplements could be used to bait wild Rainbow Lorikeets for trapping efforts (Pest and Disease Information Service, 2021), we recommend further testing of supplements, and any feed tables used in baiting should use a C3-based supplement low in δ13C values to avoid masking the effect of nectar supplements on recent escapees.
Due to the invasive Western Australian population possessing a similar isotopic niche size area to the native population, large overlap with the captive population, and high misclassification of captive individuals in the discriminant analysis, our results suggest that stable carbon and nitrogen isotope analysis alone is not an effective tool to identify captive escapees in widespread invasive populations of Rainbow Lorikeets. The isotopic niche for the widespread and relatively unmanaged invasive population in Western Australia has a similar niche size to the native population in South Australia. This may be in part due to the geographic range of the three wild populations: the Tasmanian population is from a relatively restricted area (Robinson et al., 2020), compared to the South Australian and Western Australian populations which are spread across a large cities and into rural areas (Veerman, 1991; Pickering, 2018). Additionally, as evidenced by the large isotopic niche and overlap with the captive isotopic niche, the Western Australian population may have learnt to access food sources which are usually only available to captive birds, such as commercial bird food in bird feeders or backyard vegetable gardens, or from the presence of nitrogen-based fertilizers in agricultural crops available to both captive and wild birds (Moller et al., 2018).
To further improve the confidence of using stable isotope analysis to identify captive escapees in invasive populations, including potentially broadening the application to well-established populations with large isotopic niches, captive feeding trials may be useful to identify the sources of variability. For example, the assimilation of δ13C from nectar supplements and other captive food into the tissues may assist in explaining the large variation seen in the captive isotopic niche (Symes et al., 2017), or quantifying any potential differences introduced by different feeding behaviors between juveniles and adults (Alexander et al., 2019). In this research, we focused on sampling feathers as they can be non-invasively sampled from live birds without causing stress to the animal, which is an important if this tool is to be used on legally-owned pet birds. However, feathers reveal up to one year of the animal’s history; therefore, the assimilation of carbon isotopes into tissues with longer time frames, such as bone or claws, could be calculated to provide longer snapshots of the animals’ captive or wild origin (Hobson and Clark, 1992; Kays and Feranec, 2011). Furthermore, while research on captive and wild origins has focused on carbon and nitrogen, the addition of other stable isotopes, such as hydrogen, oxygen, or sulphur, may improve classification accuracy between origins (Prigge et al., 2025).
Our results indicate that stable carbon and nitrogen isotopes in bird feathers can potentially be an effective tool in the management of Rainbow Lorikeets, and potentially other taxa, in newly established wild populations with limited range sizes or restricted diets. Rainbow Lorikeets are a highly adaptable species where their behavior in the wild, including their isotopic niches, can closely reflect diets in captivity. Our results confirm this and show that δ13C and δ15N do not discriminate recent captive escapees within native and invasive populations due to a large overlap in their isotopic niches. To improve the confidence of classification, a captive feeding trial could identify reasons for the high variability in captive individuals and quantify the influence of nectar supplements on δ13C in bird feathers to assist in the ongoing management of these highly invasive species.
Data availability statement
The original contributions presented in the study are included in the article/Supplementary Material. Further inquiries can be directed to the corresponding author/s.
Ethics statement
The studies involving humans were approved by University of Adelaide Human Research Ethics. The studies were conducted in accordance with the local legislation and institutional requirements. The participants provided their written informed consent to participate in this study. The requirement of ethical approval was waived by University of Adelaide Animal Ethics Committee for the studies involving animals because Used scavenged material (i.e. naturally dropped feathers), and euthanized animals from invasive species management programs. The studies were conducted in accordance with the local legislation and institutional requirements. Written informed consent was obtained from the owners for the participation of their animals in this study.
Author contributions
KH: Conceptualization, Data curation, Formal analysis, Funding acquisition, Investigation, Methodology, Project administration, Visualization, Writing – original draft, Writing – review & editing. SD: Formal analysis, Methodology, Software, Visualization, Writing – original draft, Writing – review & editing. SR: Conceptualization, Data curation, Resources, Writing – original draft, Writing – review & editing. TH: Data curation, Resources, Writing – original draft, Writing – review & editing. JT: Resources, Supervision, Writing – original draft, Writing – review & editing. OS: Resources, Supervision, Writing – original draft, Writing – review & editing. PC: Resources, Supervision, Writing – original draft, Writing – review & editing.
Funding
The author(s) declare that financial support was received for the research and/or publication of this article. This project was supported by The Holsworth Wildlife Research Endowment & The Ecological Society of Australia. KH was supported by The Centre for Invasive Species Solutions, by an Australian Government Research Training Program (RTP) Scholarship and Urrbrae War Memorial Scholarships.
Acknowledgments
Thank you to all participants in the Feather Forensics citizen science program. This research is possible due to the submissions and specialist knowledge of more than 80 participants and organizations. Thank you to Kelli Ellemor and the team at Native Animal Rescue for providing feathers for the Western Australian population. Thank you to Dr Thomas Nelson for assistance with feather collection, identification, and database curation; to Charlotte Lassaline, Stephanie Moncayo, and Lisa Wood for assistance identifying and weighing samples, and to Maya Penck of South Australian Museum for providing museum specimens. The authors acknowledge the Kaurna people of the Adelaide Plains, the Indigenous Traditional Owners of the land on which this research was conducted.
Conflict of interest
The authors declare that the research was conducted in the absence of any commercial or financial relationships that could be construed as a potential conflict of interest.
Generative AI statement
The author(s) declare that no Generative AI was used in the creation of this manuscript.
Publisher’s note
All claims expressed in this article are solely those of the authors and do not necessarily represent those of their affiliated organizations, or those of the publisher, the editors and the reviewers. Any product that may be evaluated in this article, or claim that may be made by its manufacturer, is not guaranteed or endorsed by the publisher.
Supplementary material
The Supplementary Material for this article can be found online at: https://www.frontiersin.org/articles/10.3389/fevo.2025.1517867/full#supplementary-material
References
Alexander J., Downs C., Butler M., Woodborne S., and Symes C. (2019). Stable isotope analyses as a forensic tool to monitor illegally traded African grey parrots. Anim. Conserv. 22, 134–143. doi: 10.1111/acv.2019.22.issue-2
Ambrose S. J., Marchant S., and Higgins P. J. (1990). Handbook of Australian, New Zealand & Antarctic birds: parrots to dollarbird (Melbourne: Oxford University Press).
Andersson A. A., Gibson L., Baker D. M., Cybulski J. D., Wang S., Leung B., et al. (2021). Stable isotope analysis as a tool to detect illegal trade in critically endangered cockatoos. Anim. Conserv. 24, 1021–1031. doi: 10.1111/acv.12705
Bates D., Mächler M., Bolker B., and Walker S. (2015). Fitting linear mixed-effects models using lme4. J. Stat. Software 67, 1–48. doi: 10.18637/jss.v067.i01
Bearhop S., Adams C. E., Waldron S., Fuller R. A., and Macleod H. (2004). Determining trophic niche width: a novel approach using stable isotope analysis. J. Anim. Ecol. 73, 1007–1012. doi: 10.1111/j.0021-8790.2004.00861.x
Birdlife Australia. (2002). Aussie Bird Count: 2022 Results. https://aussiebirdcount.org.au/wp-content/uploads/2023/01/2022-Aussie-Bird-Count_Results-Infographic.pdf.
Bomford M. and Sinclair R. (2002). Australian research on bird pests: impact, management and future directions. Emu 102, 29–45. doi: 10.1071/MU01028
Bontempo L., Ceppa F., Ziller L., Pedrini P., Hobson K. A., Wassenaar L. I., et al. (2014). Comparison of methods for stable isotope ratio (δ13C, δ15N, δ2H, δ18O) measurements of feathers. Methods Ecol. Evol. 5, 363–371. doi: 10.1111/mee3.2014.5.issue-4
Bradshaw C. J. A., Hoskins A. J., Haubrock P. J., Cuthbert R. N., Diagne C., Leroy B., et al. (2021). Detailed assessment of the reported economic costs of invasive species in Australia. NeoBiota 67, 511–550. doi: 10.3897/neobiota.67.58834
Brasileiro L., Mayrink R. R., Pereira A. C., Costa F. J. V., and Nardoto G. B. (2023). Differentiating wild from captive animals: an isotopic approach. PeerJ 11, e16460. doi: 10.7717/peerj.16460
Cabana F. and Lee J. G. (2019). Feeding cluster preferences in four genera of Lories and Lorikeets (Loriinae) that should be considered in the diet of nectarivorous psittacine species in captivity. J. Anim. Physiol. Anim. Nutr. 103, 354–362. doi: 10.1111/jpn.2019.103.issue-1
Cannon C. (1984). Movements of Lorikeets with an artificially supplemented diet. Wildlife Res. 11, 173–179. doi: 10.1071/WR9840173
Cassey P. and Hogg C. J. (2015). Escaping captivity: The biological invasion risk from vertebrate species in zoos. Biol. Conserv. 181, 18–26. doi: 10.1016/j.biocon.2014.10.023
Chan D. T. C., Poon E. S. K., Wong A. T. C., and Sin S. Y. W. (2021). Global trade in parrots – Influential factors of trade and implications for conservation. Global Ecol. Conserv. 30, e01784. doi: 10.1016/j.gecco.2021.e01784
Chapman T. (2005). The status and impact of the rainbow lorikeet (Trichoglossus haematodus moluccanus) in South-West Western Australia (Western Australia, Perth: Department of Primary Industries and Regional Development).
Choudhary P. K. and Nagaraja H. N. (2017). Measuring agreement: Models, methods, and applications. 1st edition (Hoboken, NJ: Wiley).
Cobden M., Alves F., Robinson S., Heinsohn R., and Stojanovic D. (2021). Impact of removal on occupancy patterns of the invasive rainbow lorikeet (Trichoglossus moluccanus) in Tasmania. Austral Ecol. 46, 31–38. doi: 10.1111/aec.12954
Coyle P. (1988). Rainbow lorikeets (Trichoglossus haematodus) released on Rottnest Island in 1960. Western Aust. Nat. 17, 109–110. https://www.biodiversitylibrary.org/page/59184270#page/345/mode/1up.
Davis A., Taylor C. E., and Major R. E. (2012). Seasonal abundance and habitat use of Australian parrots in an urbanised landscape. Landscape Urban Planning. 106, 191–198. doi: 10.1016/j.landurbplan.2012.03.005
Duong T. (2022). ks: Kernel Smoothing. R package version 1.13.5. Available online at: https://CRAN.R-project.org/package=ks.
Frankel T. L. and Avram D. (2001). Protein requirements of rainbow lorikeets, Trichoglossus haematodus. Aust. J. Zoology 49, 425–443. doi: 10.1071/ZO01005
Frankham G. J., Hinds M. C., and Johnson R. N. (2015). Development of 16 forensically informative microsatellite loci to detect the illegal trade of broad headed snakes (Hoplocephalus bungaroides). Conserv. Genet. Resour. 7, 533–535. doi: 10.1007/s12686-014-0414-2
Gelman A., Carlin J. B., Stern H. S., Dunson D. B., Vehtari A., and Rubin D. B. (2013). Bayesian data analysis. 3rd ed (New York, United States: CRC Press).
Grecian W. J., McGill R. A. R., Phillips R. A., Ryan P. G., and Furness R. W. (2015). Quantifying variation in δ13C and δ15N isotopes within and between feathers and individuals: Is one sample enough? Mar. Biol. 162, 733–741. doi: 10.1007/s00227-015-2618-8
Greer A. L., Horton T. W., and Nelson X. J. (2015). Simple ways to calculate stable isotope discrimination factors and convert between tissue types. Methods Ecol. Evol. 6, 1341–1348. doi: 10.1111/mee3.2015.6.issue-11
Henderson W., Bomford M., and Cassey P. (2011). Managing the risk of exotic vertebrate incursions in Australia. Wildlife Res. 38, 501–508. doi: 10.1071/WR11089
Hill K. G. W., Delean S., Hall T., Tyler J. J., Stringham O. C., and Cassey P. (2025). Feather forensics: tracing the origins of parrots in wildlife trade with stable isotopes and citizen science (Animal Conservation), 1–10. doi: 10.1111/acv.13007
Hill K. G. W., Delean S., Stringham O. C., Moncayo S., Toomes A., Tyler J. J., et al. (2023). Who’s a pretty bird? Predicting the abundance of bird species in Australian online pet trade. Biol. Invasions 26, 975–988. doi: 10.1007/s10530-023-03221-1
Hill K. G. W., Nielson K. E., Tyler J. J., McInerney F. A., Doubleday Z. A., Frankham G. J., et al. (2020). Pet or pest? Stable isotope methods for determining the provenance of an invasive alien species. NeoBiota 59, 21–37. doi: 10.3897/neobiota.59.53671
Hingston A. B. (2019a). Documenting demise? Sixteen years observing the Swift Parrot ‘Lathamus discolor’ in suburban Hobart, Tasmania. Aust. Field Ornithology 36, 97–108. doi: 10.20938/afo36097108
Hingston A. B. (2019b). Partial replacement of Rainbow Lorikeets “Trichoglossus haematodus moluccanus” by hybrid lorikeets in Hobart, Tasmania. Aust. Field Ornithology 36, 64–70. doi: 10.2307/1368807
Hobson K. A. and Wassenaar L. I. (2018). Tracking animal migration with stable isotopes. 2nd edition (London: Academic Press).
Hulme P. E. (2015). Invasion pathways at a crossroad: policy and research challenges for managing alien species introductions. J. Appl. Ecol. 52, 1418–1424. doi: 10.1111/jpe.2015.52.issue-6
Jackson A. L., Inger R., Parnell A. C., and Bearhop S. (2011). Comparing isotopic niche widths among and within communities: SIBER–Stable Isotope Bayesian Ellipses in R. J. Anim. Ecol. 80, 595–602. doi: 10.1111/j.1365-2656.2011.01806.x
Kays R. and Feranec R. S. (2011). Using stable carbon isotopes to distinguish wild from captive wolves. Northeastern Nat. 18, 253–264. doi: 10.1656/045.018.0301
Keller R. P., Lodge D. M., and Finnoff D. C. (2007). Risk assessment for invasive species produces net bioeconomic benefits. Proc. Natl. Acad. Sci. 104, 203–207. doi: 10.1073/pnas.0605787104
Kelly J. F. (2000). Stable isotopes of carbon and nitrogen in the study of avian and mammalian trophic ecology. Can. J. Zoology 78, 1–27. doi: 10.1139/z99-165
Klump B. C., Martin J. M., Wild S., Horsch J. K., Major R. E., and Aplin L. M. (2021). Innovation and geographic spread of a complex foraging culture in an urban parrot. Science 373, 456–460. doi: 10.1126/science.abe7808
Kotz S. and Nadarajah S. (2004). Multivariate t-distributions and their applications (Cambridge, United Kingdom: Cambridge University Press).
Lenth R. V. (2022). emmeans: Estimated Marginal Means, aka Least‑Squares Means. R package version 1.8.0. (Vienna, Austria: R Foundation for Statistical Computing).
Lockwood J. L., Welbourne D. J., Romagosa C. M., Cassey P., Mandrak N. E., Strecker A., et al. (2019). When pets become pests: the role of the exotic pet trade in producing invasive vertebrate animals. Front. Ecol. Environ. 17, 323–330. doi: 10.1002/fee.2019.17.issue-6
Long J. L. and Tingay S. (1981). Introduced birds of the world: the worldwide history, distribution and influence of birds introduced to new environments (Terrey Hills, NSW: Reed).
Mardia K. V. (1970). Measures of multivariate skewness and kurtosis with applications. Biometrika 57, 519–530. doi: 10.1093/biomet/57.3.519
Mika S., Rätsch G., Weston J., Scholkopf B., and Müller K.-R. (1999). Fisher discriminant analysis with kernels. IEEE Workshop Neural Netw. Signal Process 9, 41–48. doi: 10.1109/NNSP.1999.788121
Moller A. P., Laursen K., and Hobson K. A. (2018). Retrospectively analysing condition in historical samples of birds. J. Zoology 305, 188–195. doi: 10.1111/jzo.2018.305.issue-3
Natusch D. J. D., Carter J. F., Aust P. W., Ngo V. T., Tinggi U., Mumpuni, et al. (2017). Serpent’s source: Determining the source and geographic origin of traded python skins using isotopic and elemental markers. Biol. Conserv. 209, 406–414. doi: 10.1016/j.biocon.2017.02.042
Osorio F. (2023). Estimation and testing for the multivariate t-distribution. R package 0.3-8. Available online at: http://mvt.mat.utfsm.cl.
Padovan G. J., De Jong D., Rodrigues L. P., and Marchini J. S. (2003). Detection of adulteration of commercial honey samples by the 13C/12C isotopic ratio. Food Chem. 82, 633–636. doi: 10.1016/S0308-8146(02)00504-6
Paradis E. and Schliep K. (2019). Ape 5.0: an environment for modern phylogenetics and evolutionary analyses in R. Bioinformativs 35, 526–528. doi: 10.1093/bioinformatics/bty633
Pest and Disease Information Service (2021). Rainbow lorikeet: management (Perth, Australia: Department of Primary Industries and Regional Development).
Pickering R. (2018). Operation Rainbow Roost: rainbow lorikeet, an urban pest (Perth, Australia: Birdlife Western Australia).
Plummer M. (2017). JAGS Version 4.3.0 user manual. Available online at: https://sourceforge.net/projects/mcmc-jags/files/Manuals/4.x/jags_user_manual.pdf.
Plummer M. (2022). rjags: Bayesian graphical models using MCMC. R package version 4-16. Available online at: https://CRAN.R-project.org/package=rjags.
Polkanov A. and Greene T. (2000). Pest Psittacenes: the rainbow lorikeet in New Zealand. Eclectus 9, 2–5.
Post D. M. (2002). Using stable isotopes to estimate trophic position: Models, methods, and assumptions. Ecology 83, 703–718. doi: 10.1890/0012-9658(2002)083[0703:USITET]2.0.CO;2
Prigge T. L., Andersson A. A., Hatten C. E. R., Leung E. Y. M., Baker D. M., Bonebrake T. C., et al. (2025). Wildlife trade investigations benefit from multivariate stable isotope analyses. Biol. Rev. 100 (3). doi: 10.1111/brv.v100.3
R Core Team. (2022). R: A Language and Environment for Statistical Computing. R Foundation for Statistical Computing, Vienna, Austria.
Robey J., Burgin S., Hitchen D. J., and Ross G. (2011). Status of an urban feral Red-Eared Slider (Trachemys scripta elegans) population in Sydney a decade on. Aust. Zoologist 35, 822–825. doi: 10.7882/AZ.2011.033
Robinson S. A., Baker G. B., and Barclay C. (2020). Controlling the rainbow lorikeet in Tasmania: is it too late? Emu – Austral Ornithology 120, 286–294. doi: 10.1080/01584197.2020.1852574
Shukuroglou P. and McCarthy M. A. (2006). Modelling the occurrence of rainbow lorikeets (Trichoglossus haematodus) in Melbourne. Austral Ecol. 31, 240–253. doi: 10.1111/j.1442-9993.2006.01588.x
Simonoff J. S. (2012). Smoothing methods in statistics (New York: Springer Science & Business Media).
Smith J. and Lill A. (2008). Importance of eucalypts in exploitation of urban parks by Rainbow and Musk Lorikeets. Emu – Austral Ornithology 108, 187–195. doi: 10.1071/MU07062
Sol D. and Lefebvre L. (2000). Behavioural flexibility predicts invasion success in birds introduced to New Zealand. Oikos 90, 599–605. doi: 10.1034/j.1600-0706.2000.900317.x
Stanley M. C., McNaughton E. J., Fewster R. M., and Galbraith J. A. (2023). Cumulative propagule pressure exerted by escaped pet parrots. J. Appl. Ecol. 60, 1–9. doi: 10.1111/1365-2664.14341
Stoffel M. A., Nakagawa S., and Schielzeth H. (2017). rptR: Repeatability estimation and variance decomposition by generalized linear mixed-effects models. Methods Ecol. Evol. 8, 1639–1644. doi: 10.1111/mee3.2017.8.issue-11
Symes C., Skhosana F., Butler M., Gardner B., and Woodborne S. (2017). Isotope (δC-13, δN-15, δH-2) diet-tissue discrimination in African grey parrot Psittacus erithacus: implications for forensic studies. Isotopes Environ. Health Stud. 53, 580–596. doi: 10.1080/10256016.2017.1319832
Tingley R., Weeks A. R., Smart A. S., van Rooyen A. R., Woolnough A. P., and McCarthy M. A. (2015). European newts establish in Australia, marking the arrival of a new amphibian order. Biol. invasions 17, 31–37. doi: 10.1007/s10530-014-0716-z
Toomes A., García-Díaz P., Stringham O. C., Ross J. V., Mitchell L., and Cassey P. (2022). Drivers of the Australian native pet trade: The role of species traits, socioeconomic attributes and regulatory systems. J. Appl. Ecol. 59, 1268–1278. doi: 10.1111/1365-2664.14138
Toomes A., Stringham O. C., Moncayo S., Hill K. G. W., Maher J., Watters F., et al. (2025). The pet trade of native species outside of their natural distributions within Australia is a biosecurity risk. Conserv. Sci. Pract. 7, e13298. doi: 10.1111/csp2.13298
Vall-llosera M. and Cassey P. (2017a). ‘Do you come from a land down under?’ Characteristics of the international trade in Australian endemic parrots. Biol. Conserv. 207, 38–46. doi: 10.1016/j.biocon.2017.01.015
Vall-llosera M. and Cassey P. (2017b). Leaky doors: Private captivity as a prominent source of bird introductions in Australia. PloS One 12, e0172851. doi: 10.1371/journal.pone.0172851
Veerman P. A. (1991). The changing status of the rainbow Lorikeet “Trichoglossus haematodus” in south-East Australia: The role of wild and escaped birds. Aust. Bird Watcher 14, 3–9. doi: 10.3316/informit.580361174405607
Waterhouse R. (1997). Some observations on the ecology of the Rainbow Lorikeet Trichoglossus haematodus in Oatley, South Sydney. Corella 21, 17–23.
Wildlife Management Branch. (2017). Requirements for importing and keeping wildlife in Tasmania under the Nature Conservation Act 2002. Version 0.1, Department of Primary Industries, Parks, Water and Environment, Tasmanian Government. https://nre.tas.gov.au/Documents/Requirements%20for%20importing%20and%20keeping%20wildlife%20in%20Tasmania.pdf.
Keywords: citizen science, Rainbow Lorikeets, pest management, pet birds, provenancing, SIBER, stable isotopes
Citation: Hill KGW, Delean S, Robinson SA, Hall T, Tyler JJ, Stringham OC and Cassey P (2025) Identifying recent captive escapees of Rainbow Lorikeets (Trichoglossus moluccanus) at different stages of the pet-release pathway. Front. Ecol. Evol. 13:1517867. doi: 10.3389/fevo.2025.1517867
Received: 27 October 2024; Accepted: 29 May 2025;
Published: 25 June 2025.
Edited by:
Chloe Hatten, The University of Hong Kong, Hong Kong SAR, ChinaReviewed by:
Leonard M. T. Pons, Korea Institute of Ocean Science and Technology (KIOST), Republic of KoreaPauline Dufour, The University of Hong Kong, Hong Kong SAR, China
Copyright © 2025 Hill, Delean, Robinson, Hall, Tyler, Stringham and Cassey. This is an open-access article distributed under the terms of the Creative Commons Attribution License (CC BY). The use, distribution or reproduction in other forums is permitted, provided the original author(s) and the copyright owner(s) are credited and that the original publication in this journal is cited, in accordance with accepted academic practice. No use, distribution or reproduction is permitted which does not comply with these terms.
*Correspondence: Katherine G.W. Hill, a2F0aGVyaW5lZ3doaWxsQGdtYWlsLmNvbQ==