 Zhanming Qiao
 Min Zheng
 Zheng Li
 Quanmin Dong
 Chunping Zhang1
 Quan Cao
- 1Qinghai University Academy of Animal Science and Veterinary Medicine/Qinghai Academy of Animal and Veterinary Science, Qinghai Provincial Key Laboratory of Adaptive Management on Alpine Grassland, Xi Ning, Qinghai, China
- 2Information Department, Qinghai Provincial Natural Resources Survey and Monitoring Institute, Xi Ning, Qinghai, China
- 3Research Laboratory for Natural Resources Investigation, Monitoring and Evaluation, Geomatics Technology and Application Key Laboratory of Qinghai Province, Xi Ning, Qinghai, China
- 4College of Agriculture and Animal Husbandry, Qinghai University, Xi Ning, Qinghai, China
Introduction: Mobile phone signaling data have become one of the main types of data used to carry out spatial mobility analysis, but no research has simulated herders’ grazing intensity by using this measure.
Methods: In this paper, based on herders’ mobile phone signaling data, herders’ network centrality and herders’ network connection intensity were established. The equal weight average method was employed to simulate herders’ grazing intensity, with empirical analyses conducted in the Henan Mongolian Autonomous County.
Results: The findings indicated that: 1) herders’ mobile phone signaling data can quantitatively represent grazing intensity, and when combined with the density and elevation distribution of settlements in Henan County, it reveals that the spatial distribution of grazing intensity aligns with the trajectory of herders’ summer grazing activities. 2) The spatial characteristics of the centrality of the herders’ mobility network exhibited a concentrated point-like ring structure, primarily centered on the townships of Duosong and Youganning, with a decreasing spread outward. 3) The spatial characteristics of the intensity of herders’ mobility ties showed a circular distribution for the overall degree of network ties, which was primarily characterized by low ties. The intensity of mobility links among townships was low, with higher intensity observed only at the junctions of townships, indicating limited mobility among herders in Henan County regarding their herding behavior. 4) The grazing intensity of herders in Henan County was primarily characterized by light grazing.
Discussion: Research shows that the spatialized simulation model based on big data provided in this paper can accurately portray the spatial distribution characteristics of grazing intensity in the study area, ,and effectively and conveniently serve grassland resource management.
1 Introduction
Grazing represents the primary mode of production and management for grassland herdsmen. Various production and management methods result in different grazing intensities. Grazing behavior is influenced by herdsmen, with the scope of livestock activities and grassland grazing intensity being shaped by human decisions. Grazing intensity refers to the number of livestock that can be grazed per unit area. Grazing activities directly affect the ecological conditions of grasslands and are the main factor in the formation of spatial heterogeneity in above-ground plant communities. The number of livestock per unit area can represent the grazing intensity of grasslands, and its distribution and changes have also become important components of grassland sustainability research in the Qinghai-Tibet Plateau region. Grazing intensity is related to factors such as plant communities, vegetation coverage, species richness, and spatial heterogeneity, which are related to the sustainable development of grasslands. Moreover, with different grazing intensities, the changes also differ. Moreover, with the informatization management of grasslands, scientifically and effectively grasping the grazing intensity of grasslands can better serve the management of smart animal husbandry.
Traditionally, grazing intensity has been categorized primarily via statistical data, which are often reported at the county level and fail to capture spatial changes in grazing intensity in detail. With advancements in remote sensing technology, an increasing number of researchers have estimated grazing intensity using individual factors such as the vegetation index and above-ground net primary productivity (Mingxuan et al., 2021; Xing et al., 2021a). Additionally, multiple factors, including population density and meteorological conditions, have been integrated into grazing intensity estimations (Hu et al., 2022; Li et al., 2023). For example, while multifactor estimation methods consider meteorological, human, and natural elements, their applicability is region-specific and requires further examination across different areas. (Du et al., 2019b) introduced a method for estimating grazing intensity through trajectory data; however, these data rely on the GPS positioning of livestock, which has not yet been fully realized in the management of livestock in pastoral regions, making large-scale positioning unfeasible. Investigations reveal that herdsmen consider various factors when implementing grazing behavior, including specific production and operational modes, the carrying capacity of the grassland, the actual situation of grazing restrictions, and livestock numbers. These factors influence the trajectory and frequency of grazing. A larger number of livestock necessitate wider movement by herdsmen to ensure their safety, reflecting livestock activity through human activities. The intensity of livestock activities directly affects grasslands, enabling a quantitative description of grazing intensity.
The advent of advanced information technology facilitates the analysis of spatial flows using big data. Notably, recent developments in mobile location services and cloud processing technology have enabled the efficient retrieval and processing of personal location information, presenting new opportunities for research (Liang et al., 2015). The study of network connections originated from Castells’ network society theory (Castells, 1996), the research perspective shifted to a new “flow space”, and the coexistence of local space and flow space under the effect of informatization promoted the regional space structure from hierarchical to networked (Goodspeed et al., 2018). As a novel geospatial phenomenon and research paradigm, the network connects cities through agents, organizing the flow, interaction, and production of elements within them, thereby offering new perspectives and explanatory power for urban studies (Zhao et al., 2017; Yongkai et al., 2015). Since 2010, the proliferation of smartphones has led to the gradual application of mobile phone bill data, signaling data, and various internet data in travel behavior analysis (Wang et al., 2015; Zhang, 2016; Cheng et al., 2021). This development enables the tracking of individuals’ behaviors and activities while providing a potential boundary for many uncertain inputs in traffic models. The large sample size of mobile phone signaling data can mitigate errors associated with the insufficient representativeness of sampling survey samples (Xing et al., 2021b). Additionally, mobile phone signaling data have advantages in the realms of human activities and spatial characteristics because of their extensive sample size, comprehensive coverage, and continuous spatiotemporal attributes. At present, many studies have focused on mobile phone signaling data in disaster impact assessment (Zhang et al., 2020b), urban commuting analysis (Hadachi et al., 2020; Zou et al., 2018; Lu et al., 2019; Huang et al., 2021), transportation and regional urban systems (Zhou et al., 2019; Niu et al., 2017b; Yue et al., 2021; Zhang et al., 2021; Setiadi and Uluwiyah, 2017), tourist behavior and preferences (Ahas et al., 2007; Xinyi et al., 2015), spatial structure (Niu et al., 2017a), job-housing balance (Liu et al., 2021), human activities (Yin et al., 2021; Chen et al., 2018; Zhong et al., 2017), and spatial dynamics (Jia et al., 2018; Zhong and Wang, 2018). However, research on herdsmen’s grazing behavior still has limitations, primarily due to the relative scarcity of signal base stations from each mobile phone operator. This deficiency hampers the ability to capture the grazing behavior of herdsmen, as mobile phone signaling data provide only human travel records near signal base stations, preventing a comprehensive understanding of herdsmen’s travel behavior. Although spatial interpolation can be employed to estimate models, it does not effectively describe the grazing behavior of herdsmen. However, with the enhancement of mobile phone tower encryption, grazing behavior can be effectively captured within the grazing areas of herdsmen. Spatial interpolation was utilized to estimate the signal loss areas, enabling the use of mobile phone signaling data to describe herders’ grazing behavior.
As technology has progressed, mobile phone signaling data have increasingly been applied to estimate human movement, allowing for the estimation of herders’ grazing intensity. This study reflects the grazing behavior of herders through their grazing intensity, utilizing mobile phone signaling data across various spatial grids. An estimation of herdsmen’s grazing intensity is constructed on the basis of the centrality of herders’ flow networks and the index of flow connection intensity. This approach aims to explore herders’ grazing intensity using big data, providing new insights for macro estimations of grazing intensity and effectively supporting grassland management (Leng et al., 2023; Hu, 2019).
2 Materials and methods
2.1 Overview of the study area
The study area is located in Henan Mongolia Autonomous County, Huangnan Tibetan Autonomous Prefecture, Qinghai Province (hereinafter referred to as Henan County). This area encompasses 1 town, 4 townships, 2 communities, 39 pastoral committees, and 135 pastoral cooperatives, covering an administrative area of 6,700 square kilometers. The topography generally trends from high in the northeast to low in the southwest, with the altitude of most regions exceeding 3,600 m. The landform type is classified as a typical shallow-cutting high mountain area in southern Qingnan, characterized by a plateau continental climate that falls in the plateau subarctic humid climate zone. The main type of grassland in this area is alpine meadow, and the grassland area accounts for nearly 92% of the county’s total area. On the Qinghai-Tibet Plateau, herders have developed traditional rotational grazing systems on the basis of factors such as grassland productivity, altitude, climate and temperature. The summer pastures are mostly located in higher-altitude areas, far from the herders’ settlements. With the development of information technology and the industrialization of animal husbandry, Henan County has become the largest organic animal husbandry production base in China. The grazing method has also shifted from extensive grazing to refined and scientific grazing, and animal husbandry is gradually transforming toward modernization and industrialization.
2.2 Data sources and processing
Mobile phone signaling data constitute a type of large-sample data that can record users’ spatiotemporal trajectories. This study utilizes local mobile phone signaling data (excluding personal information) from Henan County for three consecutive months: July, August, and September 2018. The preprocessing of mobile phone signaling data was conducted by China Unicom in accordance with the requirements of this study, primarily leveraging the mobile phone positioning function of herdsmen to obtain their visit trajectories. The data were divided into grids of 500 m * 500 m, and the number of visits made by herders to their pastures was counted. Ultimately, the data output for the research was divided into two categories. The first category comprises the intrastate start-end point vector data for the grids within the Huangnan Tibetan Autonomous Prefecture in 2018 and records the number of visits to the ending grid by month. This dataset includes information on the destination grid visited, along with details such as the departure grid, arrival grid, and local sample expansion. The second category consists of vector data representing the number of individuals returning to their starting grid in Huangnan Tibetan Autonomous Prefecture in 2018, recorded on a monthly basis. These data include the grid number and the local sample expansion count. On the basis of this information, the start-end point vector data for the grids in the Huangnan Tibetan Autonomous Prefecture are obtained. In ArcGIS software, the inverse distance weighting interpolation method is used, with the locally expanded sample population as the interpolation value range, to obtain the raster spatial distribution data of the study area in July, August, and September.
The local sample expansion mainly refers to the expansion of the operator’s data. According to the market share of China Unicom, an expansion algorithm is established and made public to ensure comprehensive coverage of the local population. This work was completed by Qinghai Unicom Company, and the resulting data were used as the basis for the research data.
The departure grid and the arrival grid are dynamic concepts. That is, a grid can be a departure grid or an arrival grid. Herders in pastoral areas are experiencing continuous movements. For example, herder 1 moves from grid A to grid B and then from grid B to grid C. Grid B is both the arrival grid of herder 1’s first leg of the journey and the departure grid of the second leg.
The survey data refer to the statistical data obtained through field visits to some towns and villages in Henan Mongolian Autonomous County, including the grassland area, number of livestock, etc. By comparing the total number of livestock with the total area of pastures, the measured grazing intensity within the survey area can be obtained.
The resident point data of Henan County are derived from the land change survey data of Henan County. The spatial location data of the resident areas are extracted from these data, and the density distribution map of the resident points in Henan County is obtained via the kernel density analysis method.
The elevation data are sourced from the geospatial data cloud and have a resolution of 30 m. The elevation data are classified at intervals of 500 m.
2.3 Research methodology
Studies have indicated that the GPS can effectively estimate grazing intensity; however, challenges remain regarding large-scale data acquisition. Currently, mobile phone signaling data can capture the movement trajectories of individuals and the number of visitors at specific locations through GPS positioning, making data collection more accessible. In this research, it is assumed that the movement trajectories of herders can qualitatively reflect the movement trajectories of livestock, thereby reflecting the grazing intensity. It is believed that herders with more cattle and sheep have more frequent grazing activities, whereas those with fewer cattle and sheep have relatively fewer grazing activities. This paper mainly studies the comprehensive grazing intensity in July, August, and September. From the perspective of big data on mobile phone signaling, grazing intensity is spatially reflected through the movement of herders. It is assumed that the grazing behavior of herders is directional. The study area is grid-divided, and the behaviors of herders when visiting grids include entering the grid (i.e., in-degree) and leaving the grid (i.e., out-degree). According to the different grazing behaviors, the behaviors of visiting grids are different; either both behaviors exist or only one behavior exists. Therefore, the number of visits to each grid can reflect, to a certain extent, the activity intensity of herders in this area. Similarly, when herders graze, there is also a certain connection between grids, and this connection further reflects the complete grazing behavior of herders. Therefore, in this paper, network centrality is employed to reveal the influence of herders in the grazing flow network, whereas network connection strength reflects the actual connectivity of herders to each grid space. An estimation method for herdsmen’s grazing intensity is established on the basis of mobile phone signaling data through a comprehensive evaluation of points and lines (Figure 1).
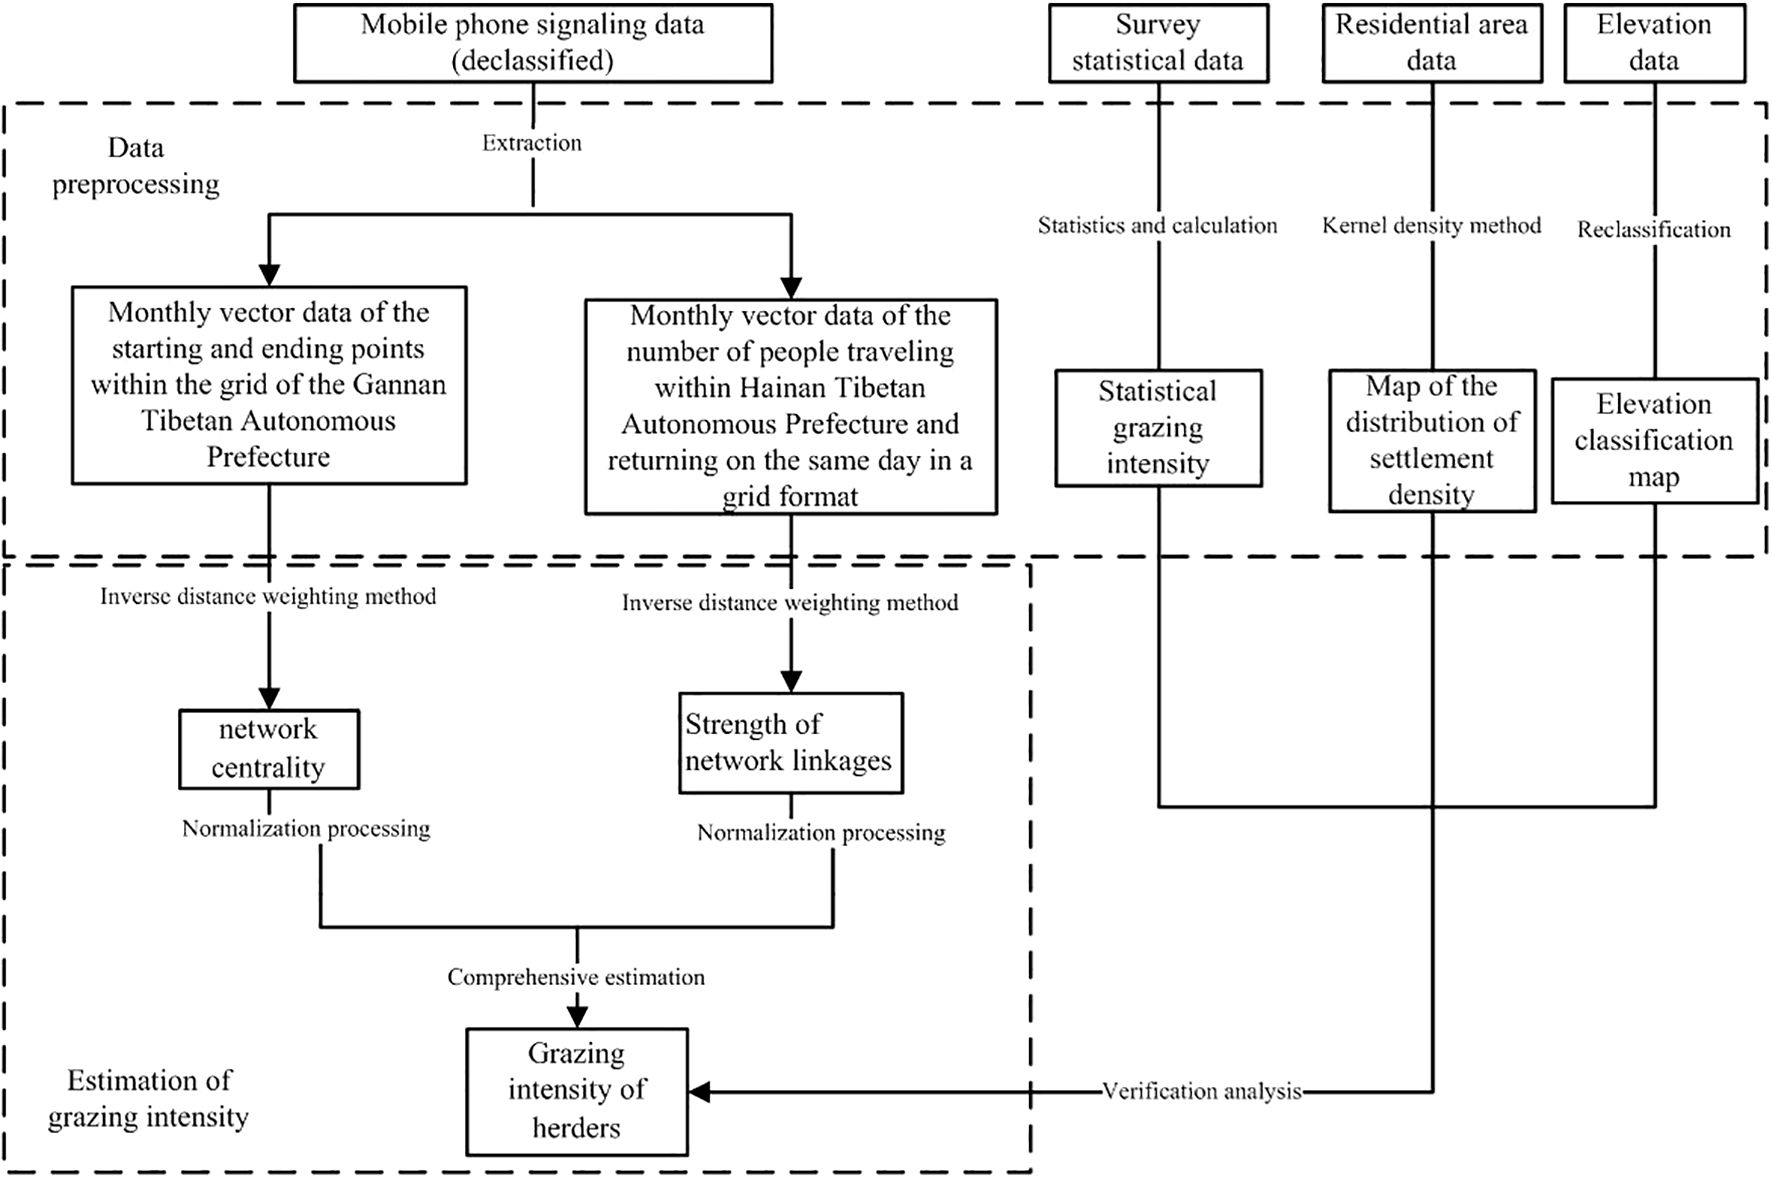
Figure 1. Estimation and analysis framework of grazing intensity.
2.3.1 Pastoralist network centrality
The study area presents a spatial network of herder movements between grids. Within this network structure, centrality (Li et al., 2021) serves as an indicator of herder mobility importance and grid control capability. The herder mobility network is characterized as directed, with grid centrality encompassing incoming and outgoing degrees. Specifically, in-degree measures connections from other grids to a given grid, whereas out-degree measures connections from a grid to other grids. The calculation formula is as follows:
where W represents the network centrality of the pastoralists in the grid
Riindicates the number of people who leave herders in the corresponding grid. In this study, the values of i are taken from 1 to 3 (in July, August and September of the corresponding year); that is, only the out-of-grid degree in the growing season of the grassland is calculated.
Cirepresents the number of herders in the corresponding grid, and the value of i used in this study was taken from 1 to 3 (in July, August and September of the corresponding year); that is, only the entry degree of the grid in the grassland growing season was calculated.
Standardize the centrality of pastoralist networks:
where is the centrality of the standardized herder network, and the value range is 0–1.
is the network centrality of each grid in the network.
is the minimum value of network centrality in the network.
is the maximum value of network centrality in the network.
2.3.2 Strength of pastoralist network linkages
In the herdsmen’s mobility network (Li et al., 2021), the daily round-trip frequency per grid serves as the connection intensity metric, and a mobility intensity index is developed. The calculation formula is as follows:
where L denotes the network connectivity of herders in the network.
indicates the network connection of herders in the corresponding grid in the current month. In this study, the values of i are taken from 1 to 3 (in July, August and September of the corresponding year); that is, only the degree of grid connection during the growing season of grassland is calculated.
Normalize the strength of pastoralist network linkages:
where is the normalized herder network connection strength, and the value range is 0–1.
2.3.3 Grazing intensity of herders
The characteristics of herders’ network centrality and connection intensity were analyzed at two levels: network centrality and contact intensity. These indicators were treated as independent and equally significant.
where is the grazing intensity of herders; is the centrality of the herders’ network; and is the strength of the pastoralist network.
The classification of grazing intensity is based on the levels of grazing intensity on the Qinghai-Tibet Plateau proposed by Zhang et al. (2020a), namely, light, moderate and heavy grazing. In this study, in combination with the grazing characteristics of Henan County and the classification results of grazing intensity on the Qinghai-Tibet Plateau by Zhang et al. (2020a), the natural break method was used to classify the grazing intensity in Henan County into light, moderate and heavy to better depict the grazing intensity in the study area.
2.3.4 Comparative verification
The results of the evaluation of herdsmen’s grazing intensity from the perspective of herdsmen’s flow were obtained through the above methods and further compared and analyzed with survey data, settlement data and elevation data in Henan County.
3 Results and analysis
3.1 Analysis of the estimation results of herders’ grazing intensity
3.1.1 Analysis of the centrality of pastoralist mobility networks
Network centrality is established on the basis of the flow of herdsmen’s population contact by using mobile phone signaling data within the territory of Henan County (the territory of Henan County; Equations 1 and 2). From the perspective of the overall characteristics of the network, the maximum centrality of each grid node is 1, the minimum value is 0.0003, the average value is 0.079, and the standard deviation is 0.062. From the spatial characteristics of Figure 2, the centrality of the herdsmen’s flow network is distributed in a concentrated point-like circle, which is centered mainly in Duosong Township and Youganning Town, and its outward diffusion decreases. The centrality of the herdsmen flow network in Youganning Town and Kesheng Township is relatively high, followed by that in Duosong Township, and it is relatively low in Ningmute Town and Saierlong Township.
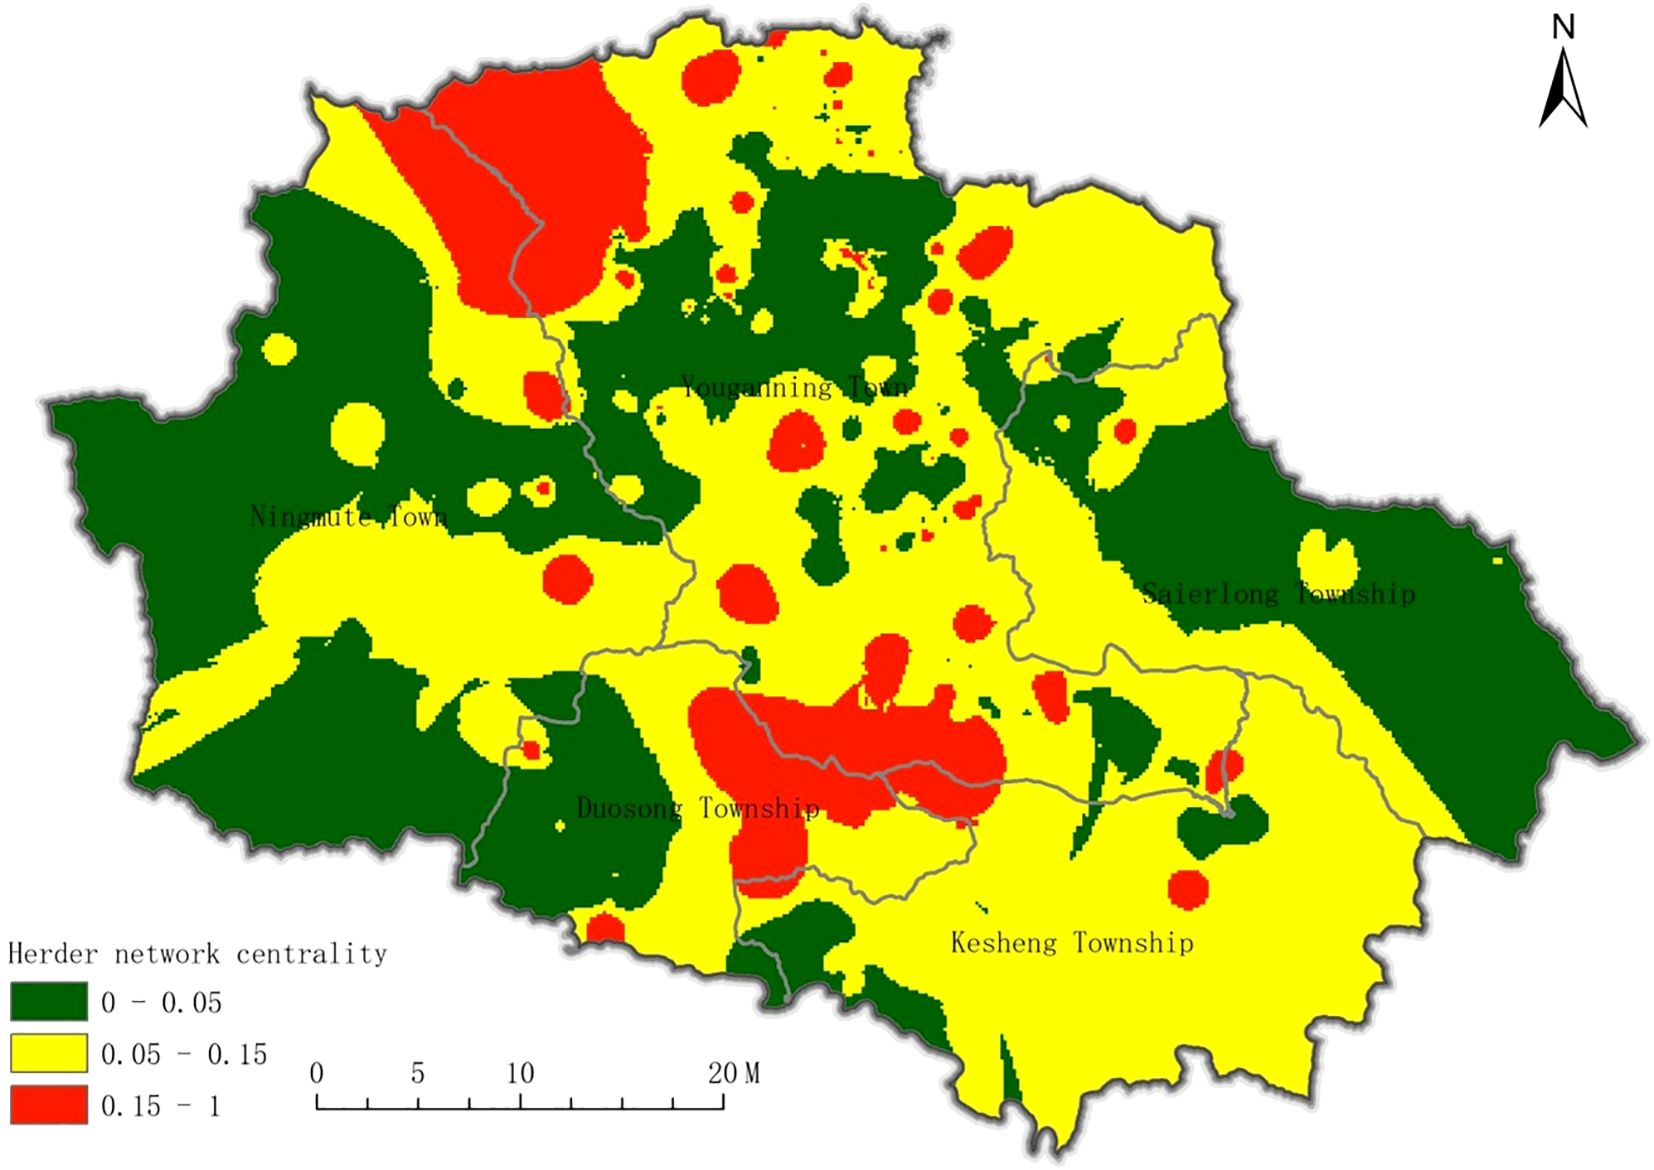
Figure 2. Centrality of the herders mobility network.
3.1.2 Analysis of the intensity of herders’ mobility linkages
Based on same-day round-trip grid data of mobile phone users in Henan County, a connection strength framework was established to analyze herdsmen’s mobility patterns (herdsmen's mobility patterns; Equations 3 and 4). The network connection intensity metrics revealed a maximum degree of 0.999, a minimum of 0.0002, an average of 0.034, and a standard deviation of 0.041.
From the spatial characteristics of Figure 3, the overall network connection degree exhibited a circular distribution, characterized predominantly by low contact intensity. High degrees of linkage were concentrated in specific areas: the northwest junction of Youganning Town and Ningmute Town, the junction of Youganning Town and southwestern Duosong Township, the southeastern junction of Duosong Township and Kesheng Township, and southern Youganning Town. Isolated high-degree connections were scattered throughout other regions.
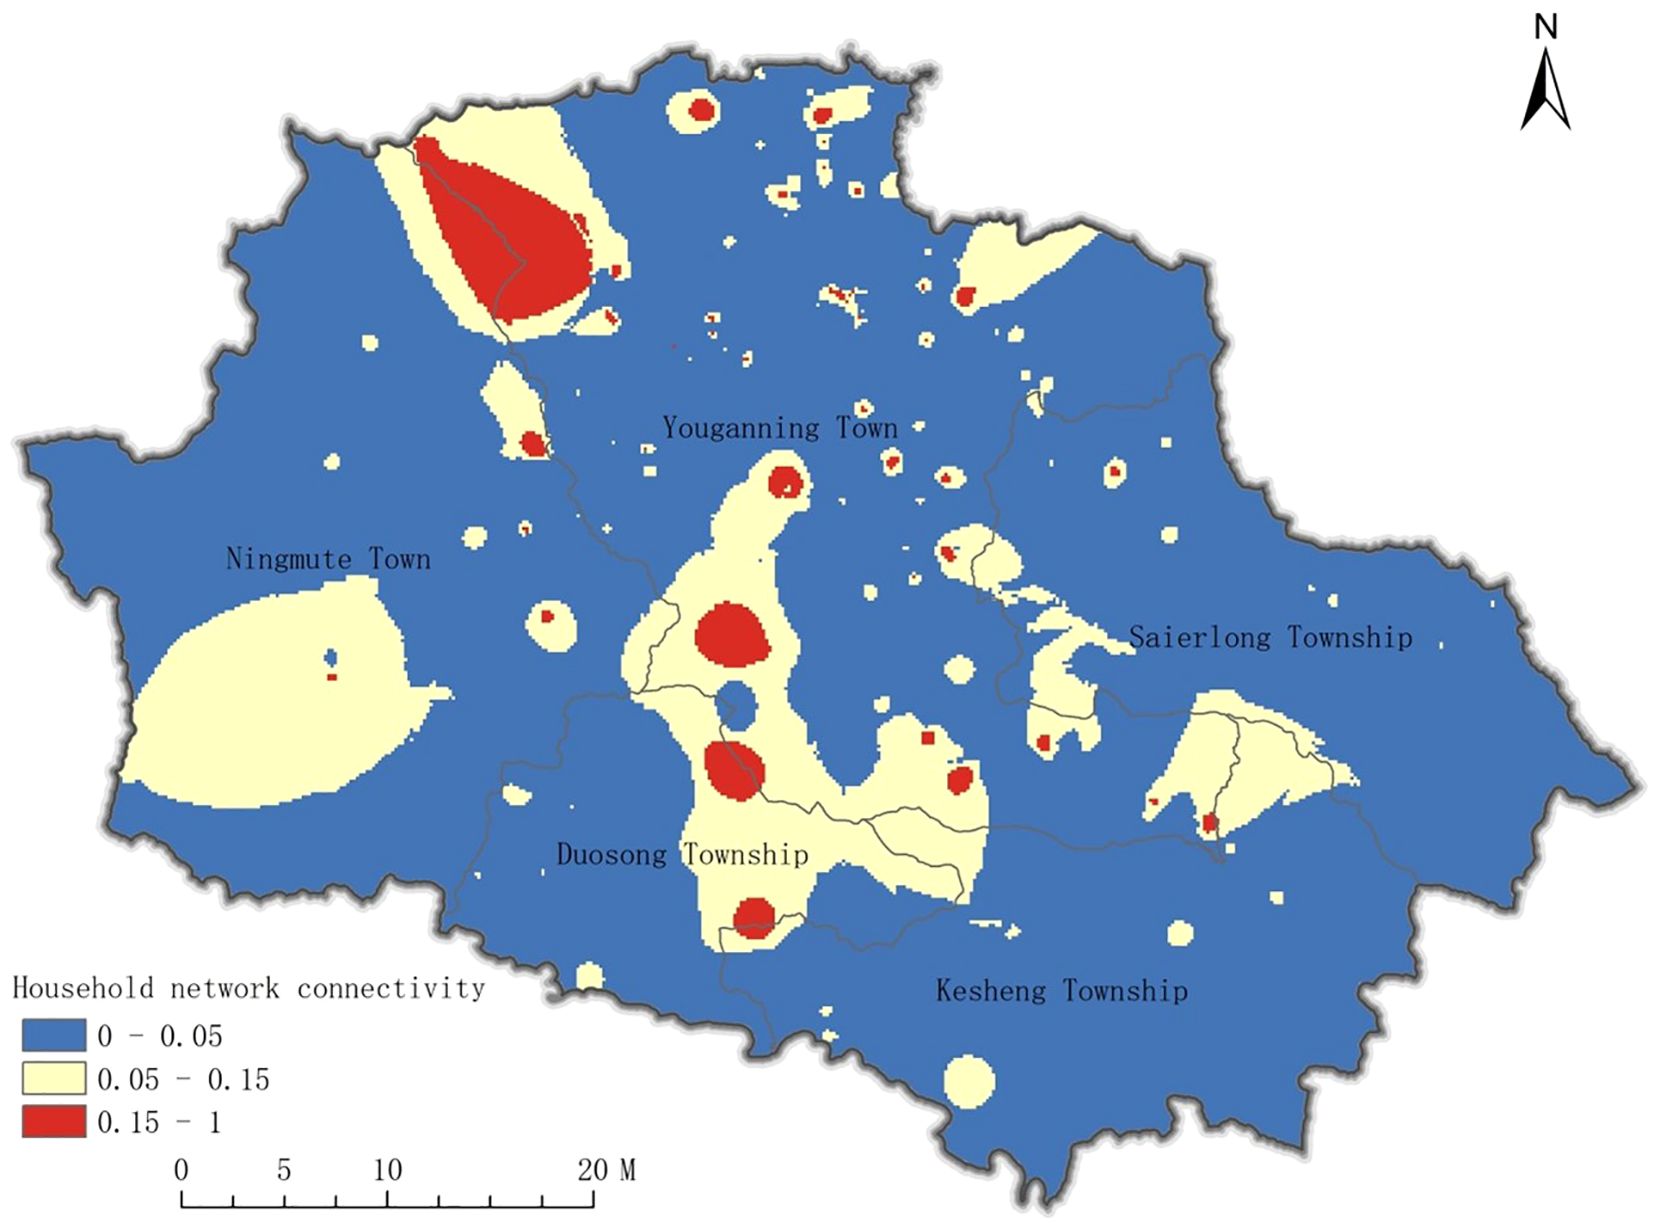
Figure 3. Strength of the mobility linkages of herders.
These findings suggest that in Henan County, mobility between townships and towns is limited, with high-intensity mobility occurring primarily at township and town junctions. This indicates relatively low mobility in herdsmen’s grazing behavior in Henan County.
3.1.3 Analysis of herders’ grazing intensity
The grazing intensity of herders is calculated via Equation 5 on the basis of the analytical results of two dimensions: the centrality of herders’ flow network and the intensity of herders’ flow linkage. As shown in Figure 4, light grazing is the main focus in Henan County, accounting for nearly 55% of the total area. This grazing intensity is primarily distributed in the central part of Youganning Town, the northern section of Ningmute Town, and most areas of Saierlong Township. Moderate grazing ranks second, accounting for nearly 40% of the grazing intensity, which is concentrated in most areas of Kesheng Township, the southern part of Youganning Town, the eastern section of Duosong Township, and the southern part of Ningmute Town. Heavy grazing is relatively uncommon and appears primarily in a sporadic distribution, notably at the northwest junction of Youganning Town and Ningmute Town, where a substantial contiguous area of heavy grazing is observed.
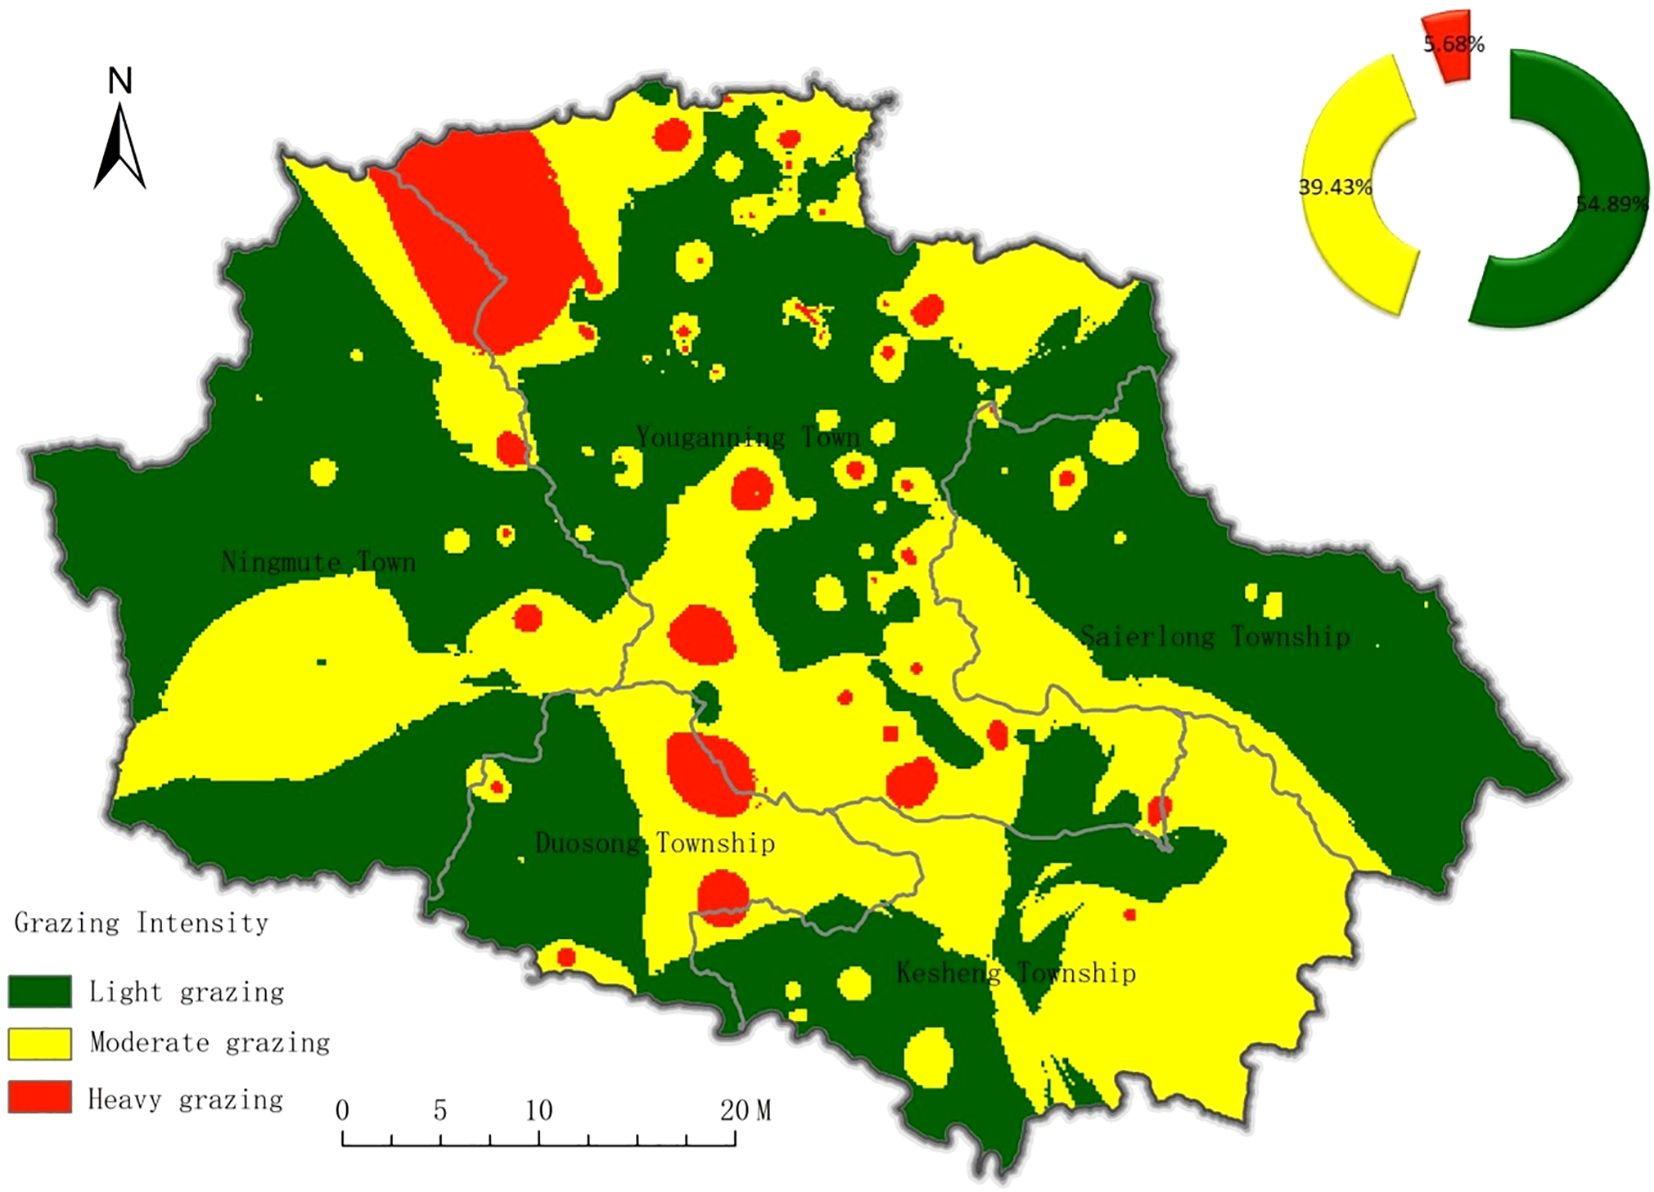
Figure 4. Grazing intensity of herders.
Table 1 and Figure 5 show the grazing situation in each township of Henan County. The analysis revealed that among the five townships in Henan County, the average grazing intensity was relatively concentrated, between 0.03–0.07, and the overall grazing intensity was not high. There were obvious differences in the maximum and minimum grazing intensities in Youganning and Ningmute. Youganning Town experiences mainly light grazing and moderate grazing, Ningmute Town, Duosong Township, and Saierlong Township experience mainly light grazing, and Kesheng Township experiences mainly moderate grazing. Overall, the grazing intensity in Youganing Town is relatively high, with light and moderate grazing maintaining at about 45%. In Kesheng Township, moderate grazing accounts for about 63% of all grazing. The situation in Duosong Township is similar to that in Youganing Town. Although light grazing accounts for nearly 51%, moderate grazing accounts for nearly 42%.
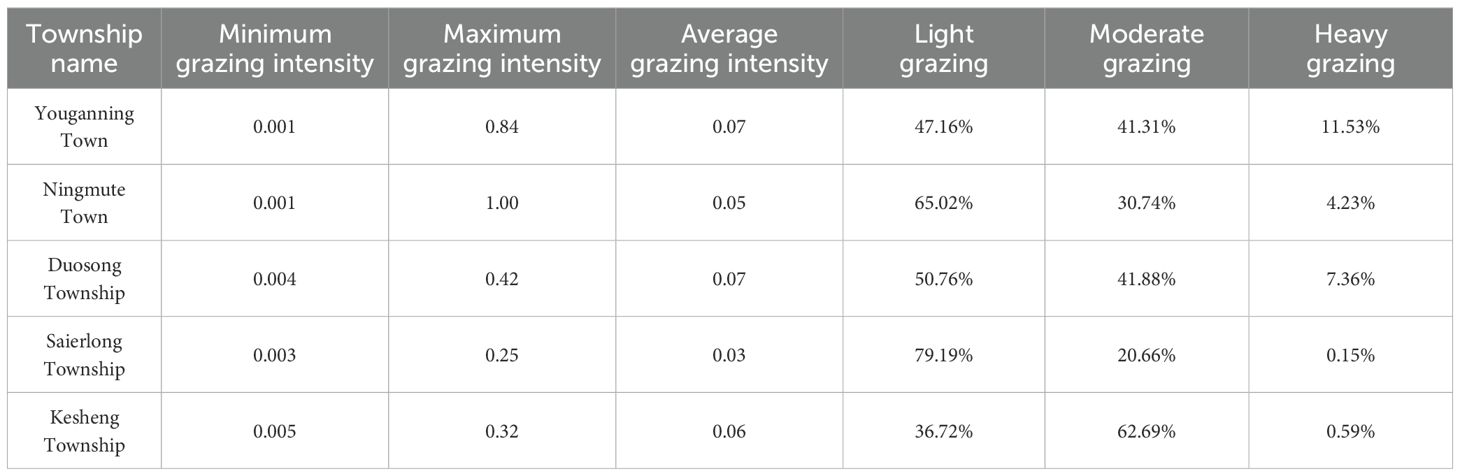
Table 1. Table of grazing intensities in each township.

Figure 5. Graph of grazing intensity in each township.
3.2 Comparative verification
By comparing the total number of livestock with the total area of pastures, the measured grazing intensity in the surveyed area was determined (Table 2). According to national grazing intensity evaluation standards and existing research on grazing intensity (Zhang et al., 2020a; Du et al., 2019a), the grazing intensity in the surveyed area is predominantly light grazing. With the exception of Kesheng Township, the grazing intensity in other regions aligns closely with the findings presented in this study. A further comparison revealed that the grazing intensity estimated on the basis of mobile phone signaling data can depict the grazing intensity in more spatial detail, which is more conducive to serving grassland management.
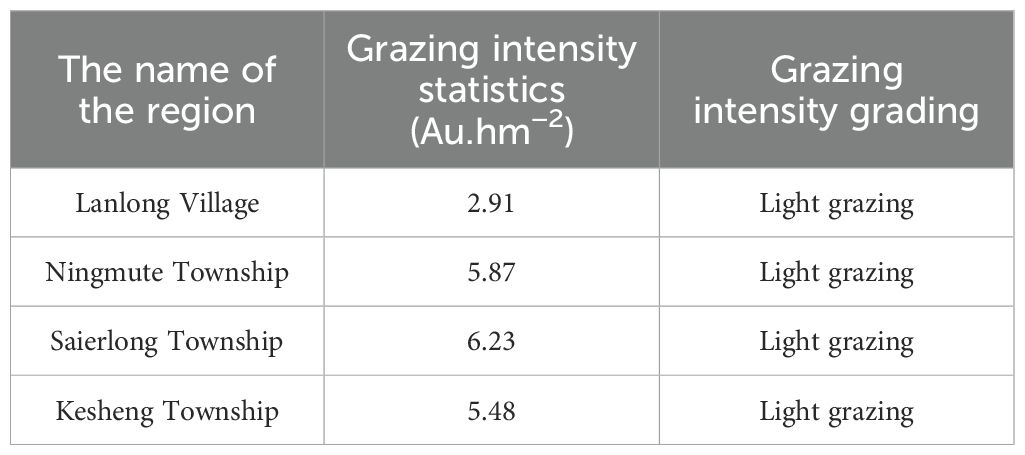
Table 2. Grazing intensity statistics.
In summer, herders move their flocks to lush summer pastures, which are usually far from their settlements. Over time, they gradually shift their flocks closer to their settlements. Through the distribution map of the settlement density (Figure 6), areas with relatively high settlement density mainly feature light and moderate grazing, with a small portion being heavily grazed, whereas areas with relatively low settlement density are mainly moderately and heavily grazed. This also conforms to the activity patterns of summer pastures (Ai, 2010), further reflecting the grazing characteristics of Henan County. However, in some areas of Youganing Town and Ningmuthe Town, heavily and moderately grazed areas are concentrated in regions with relatively high settlement densities. The main reason for this is the significant differences in mobile phone signaling data in these areas.
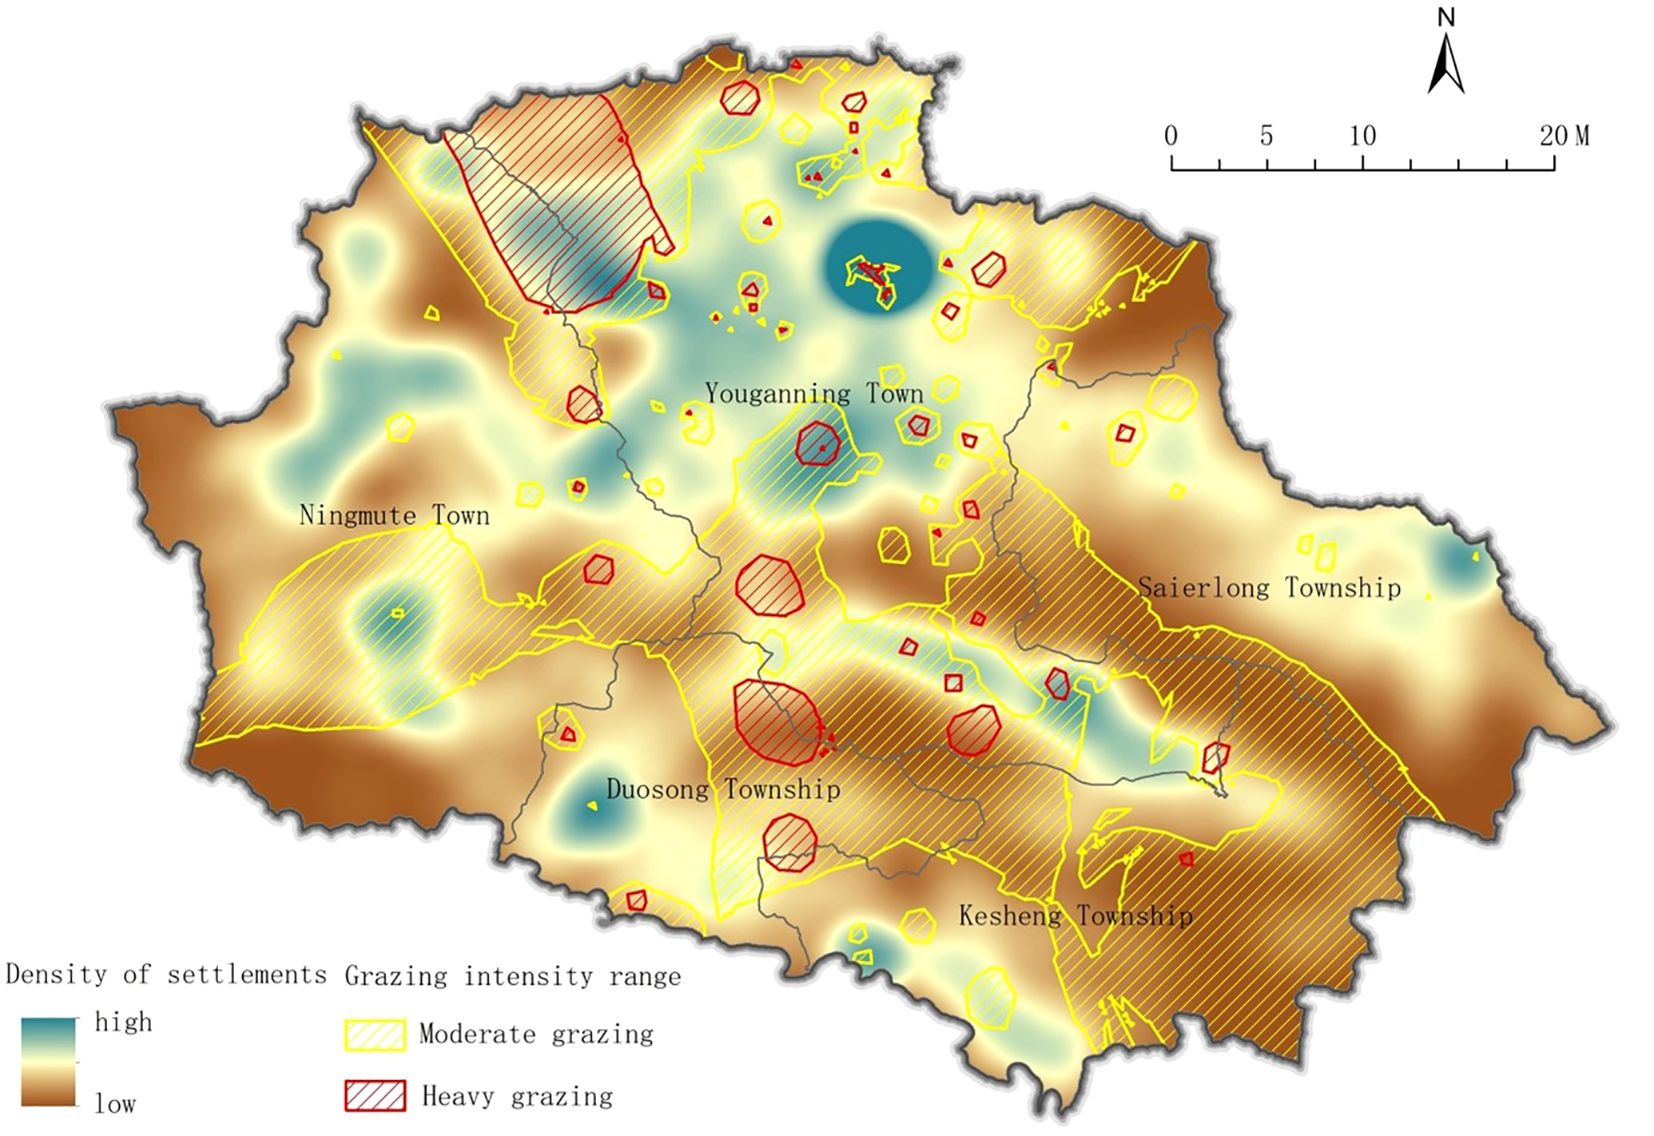
Figure 6. Relationship between grazing intensity and settlement density.
In a study of settled nomadic herding in Mongolia Autonomous County, Henan Province, Ai (2010) reported that summer pastures are generally distributed in alpine meadows at relatively high altitudes. The elevation of Henan County is 3167–4518 m (Figure 7); on the basis of the spatial distribution of elevation and the moderate and heavy grazing intensity ranges, the grazing intensity estimated on the basis of the mobile phone signaling data in this study is mainly concentrated in the elevation gradient of 3600–4100 m, and there is also a certain distribution in the 4100–4518 m range. This finding is basically consistent with the grazing behavior in the summer pastures of Henan County and further proves the rationality of estimating grazing intensity on the basis of mobile phone signaling data.
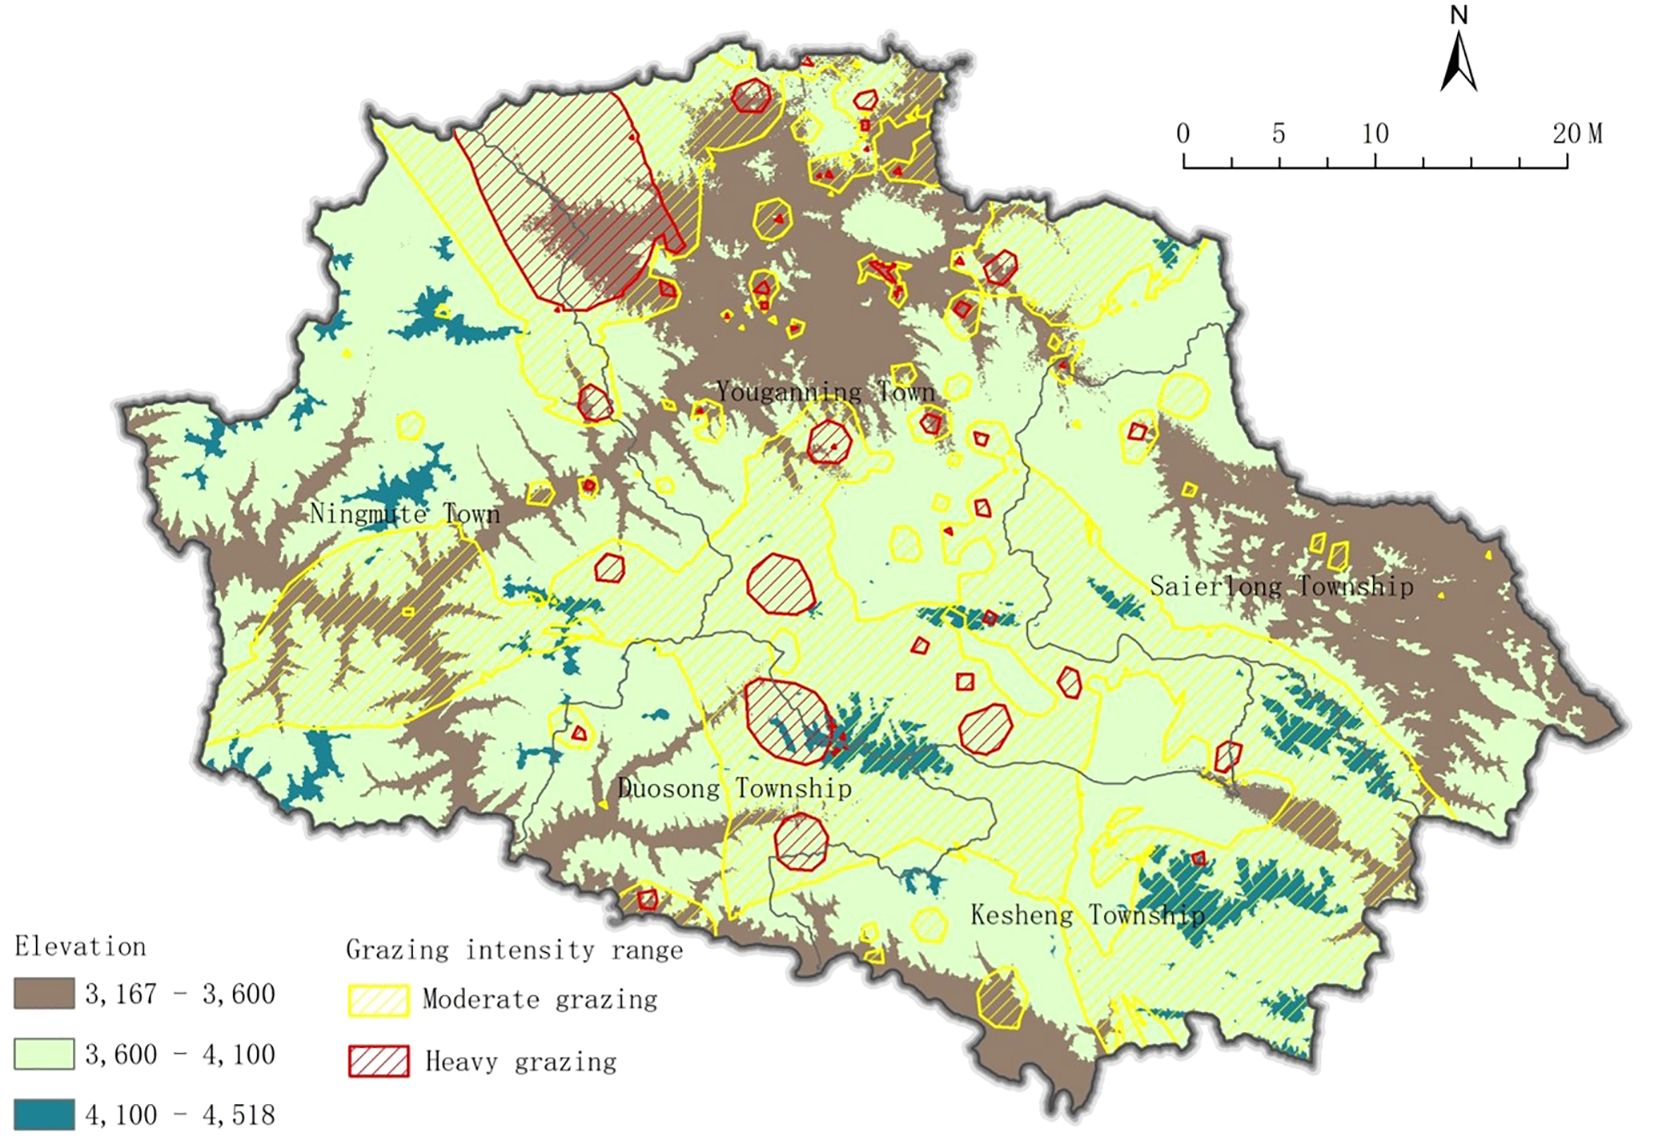
Figure 7. Relationships between grazing intensity and elevation.
4 Discussion
Pastoralism is the main daily activity of herders. Scientific grazing intensity is one of the main means used to protect grasslands and utilize them rationally. The traditional estimation of grazing intensity is mostly a macroscopic estimation, which estimates the grazing intensity within an administrative region via statistics of livestock numbers and grassland area data. This method is relatively inflexible and cannot effectively reflect the grazing intensity in different areas of the entire region. It estimates the grazing intensity of the entire region based on a few points. Currently, some researchers have used collars worn by leading sheep to estimate grazing intensity. However, this estimation method is costly and requires a relatively complete livestock management system to collect and obtain data from the positioning collars. It also requires investment to maintain the positioning equipment in case of loss or damage. This method is difficult to promote in regions where the informatization of animal husbandry is relatively slow and is not convenient for large-scale monitoring. Hu et al. (2022) estimated the grazing intensity on the Qinghai-Tibet Plateau using the grazing probability and grazing density. This method requires establishing a functional relationship between livestock behavior and its influencing factors. However, the influencing factors vary by region, so this method needs to be combined with regional characteristics to determine the influencing factors. Xing et al. (2021a) estimated the grazing intensity on the Ruoergai Plateau using above-ground net primary productivity and above-ground biomass. This method requires ground measurement data, meteorological data, and other information. With the development of information technology, mobile phone signaling data have the characteristics of dynamic collection and strong continuity (Li et al., 2021) and can reflect real-time behavior in a timely manner. It has been gradually applied to the analysis of human flow (Hou et al., 2021). The dynamic behavior of the rural population was analyzed via mobile phone signaling data, which is consistent with the research purpose of this paper, which is to reflect human behavior through big data such as mobile phone signaling data. For herders, the movement during the grazing process mainly considers the number of livestock and the movement trajectory of livestock and combines factors such as grassland management and grassland grazing. Therefore, the movement behavior of herders can reflect the activity trajectory and intensity of livestock, thereby reflecting the grazing intensity of the grassland. Therefore, the use of mobile phone signaling data to simulate grazing intensity provides a new method for studying grazing intensity. This method can better manage smart animal husbandry and effectively solve the problems of difficult data acquisition and different regional factor characteristics in the estimation process of grazing intensity. On the basis of mobile phone signaling data, this paper establishes the centrality and connection strength of herders’ movement networks through herders’ grazing behavior and uses the inverse distance weighting interpolation method to build a model for estimating herders’ grazing intensity, thereby more finely presenting the grid-based grazing intensity. Moreover, this paper compares the research results with the traditional statistics of grazing intensity, the spatial distribution of settlement data, and the spatial distribution of elevation. The qualitative results of grazing intensity in Henan County obtained via mobile phone signaling data are basically consistent with the traditional statistics of grazing intensity. The spatial distribution area is also in line with the characteristics of herders’ grazing behavior on the Qinghai-Tibet Plateau and is also consistent with the spatial distribution area of elevation and the grazing behavior of summer pastures on the Qinghai-Tibet Plateau model in summer. This further verifies that mobile phone signaling data can be used to qualitatively estimate herders’ grazing intensity.
The results of this study provide support for real-time monitoring of herders’ grazing intensity. It can quickly achieve timely, convenient, and large-scale estimations of grazing intensity by obtaining mobile phone signaling data. By obtaining mobile phone signaling data from herders in the study area, the grazing intensity in the area can be captured in real time, and monthly and annual estimations can be made. Moreover, this method realizes a grid-based fine evaluation, which can be combined with spatial distribution to rationally allocate resources and protect grassland resources. According to the research results and spatial distribution, in Yoganing Town, grazing in the northwestern and southern regions needs to be reasonably optimized on the basis of the distribution of cattle and sheep in each village and cooperative to ensure a reasonable carrying capacity of the grassland, a balance between grass and livestock, and a moderate grazing intensity. The grazing intensity in Keseng Township also needs to be further adjusted based on the distribution of cattle and sheep in Keseng Township to allocate resources rationally. The situation in Duosong Township is similar to that in Yoganing Town. To ensure the rational use of resources, it is also necessary to rationally allocate resources in moderately grazed areas.
In addition, the research in this paper has certain limitations. Given that Henan County is a purely pastoral county, all the mobile phone signaling data obtained for Henan County are assumed to be from herders in this paper. However, there are still nonherders moving in pastoral areas, and this part of the data will also lead to certain differences in the estimation of grazing intensity. In the future, as mobile phone signaling data gradually improve, herders and non-herders can be identified in the data preprocessing process to further improve the accuracy of the estimation. Henan County is located on the Qinghai-Tibet Plateau, and there are areas within the county where mobile phone signaling data signals are lost; that is, some areas have missing mobile phone signaling data. In this paper, during the data preprocessing process, the missing data in the lost signal areas were supplemented on the basis of the surrounding mobile phone signaling data. In the research process of estimating grazing intensity, the inverse distance weighting method was used to obtain the grazing intensity situation of Henan County. Although the missing data were supplemented, some differences in the estimation of grazing intensity still occurred. In the future, with the gradual development of information technology and the increase in mobile phone base stations in pastoral areas, the situation of signal loss will be gradually solved, and the analysis of mobile phone signaling data can be better carried out. In this work, the estimation of grazing intensity is only qualitatively described, but in the future, the number of livestock in the study area can be spatially processed and converted into standard units, combined with the grazing intensity of herders, to more specifically reflect the grazing intensity of grasslands in terms of quantity.
5 Conclusion
This study utilized mobile phone signaling data from Henan County to develop an estimation method for grazing intensity, effectively illustrating the spatial distribution characteristics of grazing intensity in the region. This research provides a big data-based spatial estimation method for grazing intensity, which can also facilitate efficient and convenient management of grassland resources.
1. With a comprehensive understanding of the current state of big data mobile phone signaling, it is argued that the grazing intensity of herders can be quantitatively estimated via these data. Accordingly, an estimation method for herders’ grazing intensity was constructed on the basis of the spatial mobility of herders. By using the inverse distance weighting method, two indicators, namely, the centrality of the herders’ mobility network and the intensity of mobility connections, were established. Finally, the grazing intensity of herders was comprehensively estimated. The feasibility of this method was validated through empirical analysis in Henan County.
2. Examining spatial characteristics, the centrality of the herdsmen’s mobile network is concentrated in a point-like pattern, primarily centered around Duosong Township and Youganning Township, with decreasing outward diffusion. The overall linkage degree of the herders’ network exhibits a circular distribution, with low connection intensity predominating. The mobility intensity between herders and towns is minimal, with high mobility intensity occurring only at the junctions of each township. This further indicates that herders’ grazing behavior in Henan County is relatively static. Therefore, the grazing intensity of herders in Henan County primarily reflects light grazing activities.
3. When the spatial distributions of grazing intensity, residential density, and elevation distributions obtained from some statistical data of Henan County are combined, the spatial distribution of grazing intensity is roughly consistent with the grazing intensity obtained from the statistical data, there are differences in departmental areas, and the area accounts for a small proportion.
Data availability statement
The original contributions presented in the study are included in the article/supplementary material. Further inquiries can be directed to the corresponding author.
Author contributions
ZQ: Conceptualization, Methodology, Writing – original draft, Writing – review & editing. MZ: Conceptualization, Methodology, Writing – review & editing. ZL: Conceptualization, Methodology, Writing – review & editing. QD: Conceptualization, Methodology, Project administration, Writing – review & editing. CZ: Formal analysis, Writing – review & editing. YY: Writing – review & editing. QC: Writing – review & editing.
Funding
The author(s) declare that financial support was received for the research and/or publication of this article. This study was supported by “Western Young Scholars” Project of the “Western Light” Talent Training Program of the Chinese Academy of Sciences (2023).
Conflict of interest
The authors declare that the research was conducted in the absence of any commercial or financial relationships that could be construed as a potential conflict of interest.
Generative AI statement
The author(s) declare that no Generative AI was used in the creation of this manuscript.
Publisher’s note
All claims expressed in this article are solely those of the authors and do not necessarily represent those of their affiliated organizations, or those of the publisher, the editors and the reviewers. Any product that may be evaluated in this article, or claim that may be made by its manufacturer, is not guaranteed or endorsed by the publisher.
References
Ahas R., Aasa A., Mark Ü., Pae T., and Kull A. (2007). Seasonal tourism spaces in Estonia: Case study with mobile positioning data. Tourism Manage. 28, 898–910. doi: 10.1016/j.tourman.2006.05.010
Ai L. (2010). From traditional nomadism to Settled nomadism: Investigation of settled nomadism in Henan Mongolian Autonomous County of Qinghai Province. Chaidamu Kaifa Yanjiu 6, 46–48. 10.3969/j.issn.1005-6718.2010.06.016
Chen X., Yu B., Gong J., Wang P., and Elliott A. L. (2018). Social capital associated with quality of life mediated by employment experiences: evidence from a random sample of rural-to-urban migrants in China. Soc. Indic. Res. 139, 327–346. doi: 10.1007/s11205-017-1617-1
Cheng X., Cheng X., Li C., and Chen J. (2021). Sample expansion model of household travel survey using cellphone data. J. Tongji Univ. Natural Sci. 49, 86–96. doi: 10.11908/j.issn.0253-374x.20196
Du J., Yi S., Qin Y., Yu H., and Ma J. (2019a). Distribution and cause of plateau pika (Ochotona curzoniae) burrows in Henan Mongolian Autonomous county, Qinghai Province. J. Anhui Agric. Univ. 43, 415–419.
Du Y., Yu W., Li B., and Qin L. (2019b). A grazing intensity estimation method based on trajectory data. Heilongjiang Animal Science and Veterinary Medicine. doi: CNKI:SUN:HLJX.0.2019-12-011
Goodspeed R., Yan X., Hardy J., Vydiswaran V. G. V., Berrocal V. J., Clarke P., et al. (2018). Comparing the data quality of global positioning system devices and mobile phones for assessing relationships between place, mobility, and health: field study. JMIR mHealth uHealth 20, 1–14. doi: 10.2196/mhealth.9771
Hadachi A., Pourmoradnasseri M., and Khoshkhah K. (2020). Unveiling large-scale commuting patterns based on mobile phone cellular network data. J. Transport Geography 89, 102871. doi: 10.1016/j.jtrangeo.2020.102871
Hou Q., Zhou J., and Liu D. (2021). Spatial characteristics of rural population activities in qin-han new city villages based on cellphone signaling analysis. Plann. Construction 2, 98–105. doi: 10.3390/su11072159
Hu Z. (2019). Analysis of factors influencing the herder’s behavior of grazing by hiring shepherd. J. Arid Land Resour. Environ. 33, 29–34. doi: 10.13448/j.cnki.jalre.2019.102
Hu X., Wang Z., Zhang Y., and Gong D. (2022). Spatialization method of grazing intensity and its application in Tibetan Plateau. Acta Geographica Sin. 77, 547–558. doi: 10.11821/dlxb202203004
Huang Q., Yang Y., Xu Y., Yang F., Yuan Z., and Sun Y. (2021). Citywide road-network traffic monitoring using large-scale mobile signaling data. Neurocomputing 444, 136–146. doi: 10.1016/j.neucom.2020.07.150
Jia Y., Ge Y., Ling F., Guo X., Wang J., Wang L., et al. (2018). Urban land use mapping by combining remote sensing imagery and mobile phone positioning data. Remote Sens. 10, 446. doi: 10.3390/rs10030446
Leng J., Qi X., and Cao Z. (2023). Research on grassland grazing management strategy based on differential game. J. Arid Land Resour. Environ. 38, 1–8. doi: 10.13448/j.cnki.jalre.2024.001
Li L., Huang C., Zhang Y., Liu L., Wang Z., Zhang H., et al. (2023). Mapping the multi-temporal grazing intensity on the Qinghai-Tibet Plateau using geographically weighted random forest. Sci. Geogr. Sin. 1, 10.13249. doi: 10.13249/j.cnki.sgs.2023.03.003
Li Z., Zheng F., and Qin X. (2021). A study on the level of urban internationalization in the Yangtze River Delta: Based on international roaming mobile signaling data of foreigners in China. Geographical Res. 40, 1025–1041. doi: 10.11821/dlyj020200062
Liang D., Xinyi N., and Xiaodong S. (2015). Urban spatial studies with big data of mobile location: A progress review. Urban Plann. Int. 30, 53–58. doi: CNKI:SUN:GWCG.0.2015-04-009
Liu Y., Alsaleh R., and Sayed T. (2021). Modeling the influence of mobile phone use distraction on pedestrian reaction times to green signals: A multilevel mixed-effects parametric survival model. Transportation Res. Part F 81, 115–129. doi: 10.1016/j.trf.2021.05.020
Lu Z., Long Z., and Yu Q. (2019). Analysis on the job-housing spatial distribution and commuting characteristics of kunshan city based on cellular signaling data. J. Modern Urban Res. 3, 50–55. doi: CNKI:SUN:XDCS.0.2019-03-009
Mingxuan S., Jie W., and Hongtao J. (2021). Remote sensing interpretation method for grassland grazing intensity: A case study of alpine grassland in Hejing County. J. China Agric. Univ. 26, 174–184. doi: 10.11841/j.issn.1007-4333.2021.04.16
Niu X., Ding L., and Song X. (2017a). Analyzing suburban new town development in Shanghai from the perspective of jobs-housing spatial relationship. City Plann. Rev. 41, 47–53,126. doi: 10.3969/j.issn.1006-0022.2017.01.008
Niu X., Wang Y., and Ding L. (2017b). Measuring urban system hierarchy with cellphone signaling. J. Planners 33, 50–56. doi: 10.11819/cpr20170807a
Setiadi Y. and Uluwiyah A. (2017). “Published. Improving data quality through big data: Case study on big data-mobile positioning data in Indonesia tourism statistics,” in 2017 International Workshop on Big Data and Information Security (IWBIS) (IEEE, Jakarta, Indonesia), 43–48.
Wang D., Wang C., Xie , Zhong W., Wu M., Zhu W, et al. (2015). Comparison of retail trade areas of retail centers with different hierarchical levels: a case study of east Nanjing road, Wujiaochang,Anshan road in Shanghai. Urban Plann. Forum 3, 50–60. doi: 10.16361/j.upf.201503007
Xing Z., Jiyan W., and Bing Y. (2021a). Remote sensing mon⁃itoring of grazing intensity in Zoige Plateau based on aboveground Net Primary Productivity and above-ground biomass. Pragmatic Sci. 38, 544–553. doi: 10.11829/j.issn.1001-0629.2020-0410
Xing Z., Zhang X., Zan X., Xiao C., and Liu J. (2021b). Crowdsourced social media and mobile phone signaling data for disaster impact assessment: A case study of the 8.8 Jiuzhaigou earthquake. Int. J. Disaster Risk Reduction 0, 10220. doi: 10.1016/j.ijdrr.2021.102200
Xinyi N., Liang D., and Xiaodong S. (2015). Understanding urban spatial structure of shanghai central city based on mobile phone data. China City Plann. Rev. 24, 15–23. doi: 10.20113/j.ccpr.2015.03.003
Yin L., Lin N., and Zhao Z. (2021). Mining daily activity chains from large-scale mobile phone location data. Cities 109, 103013. doi: 10.1016/j.cities.2020.103013
Yongkai H. U., Lu S., Jian Z., and Bin R. (2015). An improved method of extracting OD information based on mobile phone data. J. Transport Inf. Saf. 33, 84–90. doi: 10.3963/j.issn1674-4861.2015.05.013
Yue J., Yang X., and Yin G. (2021). Analysis of suburban highway traffic status based on mobile phone signaling data. Technol. Economy Areas Commun. 23, 1–8. doi: 10.19348/j.cnki.issn1008-5696.2021.03.001
Zhang T. (2016). Job-housing spatial distribution analysis in shanghai metropolitan area based on cellular signaling data. Urban Transport China 14, 15. doi: 10.13813/j.cn11-5141/u.2016.0103
Zhang W., Fang C., Zhou L., and Zhu J. (2020b). Measuring megaregional structure in the Pearl River Delta by mobile phone signaling data: A complex network approach. Cities 104, 102809. doi: 10.1016/j.cities.2020.102809
Zhang Y., Ma N., and Guo Y. (2021). Identification of county urban system based on mobile phone signaling data: A case of poyang county,jiangxi province. Areal Res. Dev. 40, 91–95. doi: 10.3969/j.issn.1003-2363.2021.01.017
Zhang J., Yuan M., Zhang J., Li H., Wang J., Zhang X., et al. (2020a). Responses of the NDVI of alpine grasslands on the Qinghai-Tibetan Plateau to climate change and human activities over the last 30 years. Acta Ecol. Sin. 40, 6269–6281. doi: 10.5846/stxb201909201962
Zhao Z., Wei Y., Pang R., Wang S., and Feng Z. (2017). Alter-based centrality and power of Chinese city network using inter-provincial population flow. Acta Geographica Sin. 72, 1032–1048. doi: 10.11821/dlxb201706007
Zhong W. and Wang D. (2018). Urban space study based on the temporal characteristics of residents’ behavior. Prog. Geogr 8, 1106–1118. doi: 10.18306/dlkxjz.2018.08.010
Zhong W., Wang D., Xie D., and Yan L. (2017). Dynamic characteristics of Shanghai’s population distribution using cell phone signaling data. Geogr. Res. 36, 972–984. doi: 10.11821/dlyj201705013
Zhou J.-Z., Hou Q.-H., Fan X.-Y., and Du Y. (2019). Village-town system in suburban areas based on cellphone signaling mining and network hierarchy structure analysis. IEEE Access 7, 128579–128592. doi: 10.1109/ACCESS.2019.2939504
Keywords: mobile phone signaling data, network centrality, network connection intensity, grazing intensity, spatial characterization
Citation: Qiao Z, Zheng M, Li Z, Dong Q, Zhang C, Yu Y and Cao Q (2025) Research on the spatial characterization of herder grazing intensity supported by mobile phone signaling data. Front. Ecol. Evol. 13:1526099. doi: 10.3389/fevo.2025.1526099
Received: 17 November 2024; Accepted: 06 May 2025;
Published: 03 June 2025.
Edited by:
Lalit Kumar Sharma, Zoological Survey of India, IndiaCopyright © 2025 Qiao, Zheng, Li, Dong, Zhang, Yu and Cao. This is an open-access article distributed under the terms of the Creative Commons Attribution License (CC BY). The use, distribution or reproduction in other forums is permitted, provided the original author(s) and the copyright owner(s) are credited and that the original publication in this journal is cited, in accordance with accepted academic practice. No use, distribution or reproduction is permitted which does not comply with these terms.
*Correspondence: Quanmin Dong, NzgyMjM5NTM2QHFxLmNvbQ==