 Julia Niemeyer
 Fernando M. Resende
 Edberto Moura Lima
 Mariana M. Vale
- 1Federal University of Rio de Janeiro, Rio de Janeiro, Brazil
- 2Rio de Janeiro State University, Rio de Janeiro, Brazil
- 3Institute for Hydrology and Water Management, Department of Water, Atmosphere and Environment, University of Natural Resources and Life Sciences Vienna, Vienna, Austria
- 4Department of Ecology, Institute of Biology, Federal University of Rio de Janeiro, Rio de Janeiro, Brazil
Northeastern South America is among the continent’s most climate-vulnerable regions, marked by low socioeconomic indices and high climatic hazards, particularly droughts. We did a climate change risk assessment for the region’s most important watershed, incorporating the three components of risk — hazards, exposure, and vulnerability — a procedure rarely done. We analyzed land use and climate change hazards, human population exposure, and socio-environmental vulnerability by mapping ecosystem services and socioeconomic indices. We pinpointed 15 high-risk municipalities out of 455 in the study region, suggesting existing ecosystem-based adaptation (EbA) policies at the municipal level to reduce vulnerability, coupled with watershed-scale technological solutions. We also provide an online dashboard with an interactive map to facilitate results visualization and support the decision-making process. Our proposed approach is transferable globally, focusing on enhancing the effectiveness of EbA in responding to climate change.
1 Introduction
Climate change-induced increases in the frequency and intensity of extreme events threaten biodiversity and ecosystem functioning, resulting in serious impacts on food, water, and energy security (IPCC, 2021). Impacts are expected to worsen in the near-term, and, therefore, well-planned adaptation efforts are imperative. Adaptation is especially urgent in highly vulnerable areas, i.e. locations with high poverty, poor governance, and limited access to basic services and resources, which are expected to suffer the most (Pörtner et al., 2022). The lack of adaptive capacity, i.e. the ability to cope and adapt to the changing climate, increases vulnerability (IPCC, 2018; Foden et al., 2019). At the local level, poverty and inadequate access to resources, such as health facilities, education, and natural resources intensify human vulnerability to climate change (Torres et al., 2012; Bourne et al., 2016). Despite important efforts and international agreements focusing on mitigation (i.e. reduction of the concentration of greenhouse gases in the atmosphere), adaptation strategies are imperative to increase resilience (Scarano, 2017; Niemeyer and Vale, 2022).
Ecosystem-based adaptation (EbA) are solutions that tackle nature’s fundamental role in promoting adaptation to climate change (Bourne et al., 2016). Ecosystem services (ES) are vital functions of biodiversity and ecosystems that benefit humans directly or indirectly (MEA, 2005; IPBES, 2018, 2020). These include food and water provision, climate regulation, health and cultural benefits (MEA, 2005; Pires et al., 2018). Biodiversity sustains most of these ecosystem functions, and natural features support ecosystems and people in adapting to climate change (Colls et al., 2009; Bourne et al., 2016; Kasecker et al., 2018; Pires et al., 2018; Pörtner et al., 2022). EbA uses biodiversity and ES to facilitate adaptation as part of an overall adaptation strategy and is generally more cost-effective than conventional approaches (Secretariat of the Convention on Biological Diversity, 2009; Scarano, 2017; Manes et al., 2022b). It implies that humans’ well-being and survival hinge on ecosystem functioning, and that conservation, restoration, and sustainable management of natural resources are paramount to protect and buffer communities against negative short and long-term climate impacts (Bourne et al., 2016; Costanza et al., 2017; Manes et al., 2022a, b). It drives sustainability by conserving biodiversity, ES, and mitigating carbon, while reducing poverty and inequalities (Scarano, 2017).
Northeastern South America (NES) is among the continent’s most climate-vulnerable regions (de Oliveira et al., 2012), marked by low socioeconomic indices and high climatic hazards, including the most pronounced drought ever recorded (Castellanos et al., 2022). Predominantly situated in the Brazilian Semiarid region (Figure 1), the region faces escalating droughts due to climate and land use changes (Assad et al., 2016; Bragagnolo et al., 2017; da Silva et al., 2018; Castellanos et al., 2022). Projected hazards indicate total precipitation reduction and an increase in dryness (Castellanos et al., 2022). Food and water insecurity are key issues in the region, exacerbated by a highly vulnerable population, which includes Indigenous Peoples and local communities, as well as smallholder farmers, all intrinsically dependent on ES for their livelihoods (Tabarelli et al., 2017; Niemeyer and Vale, 2022).
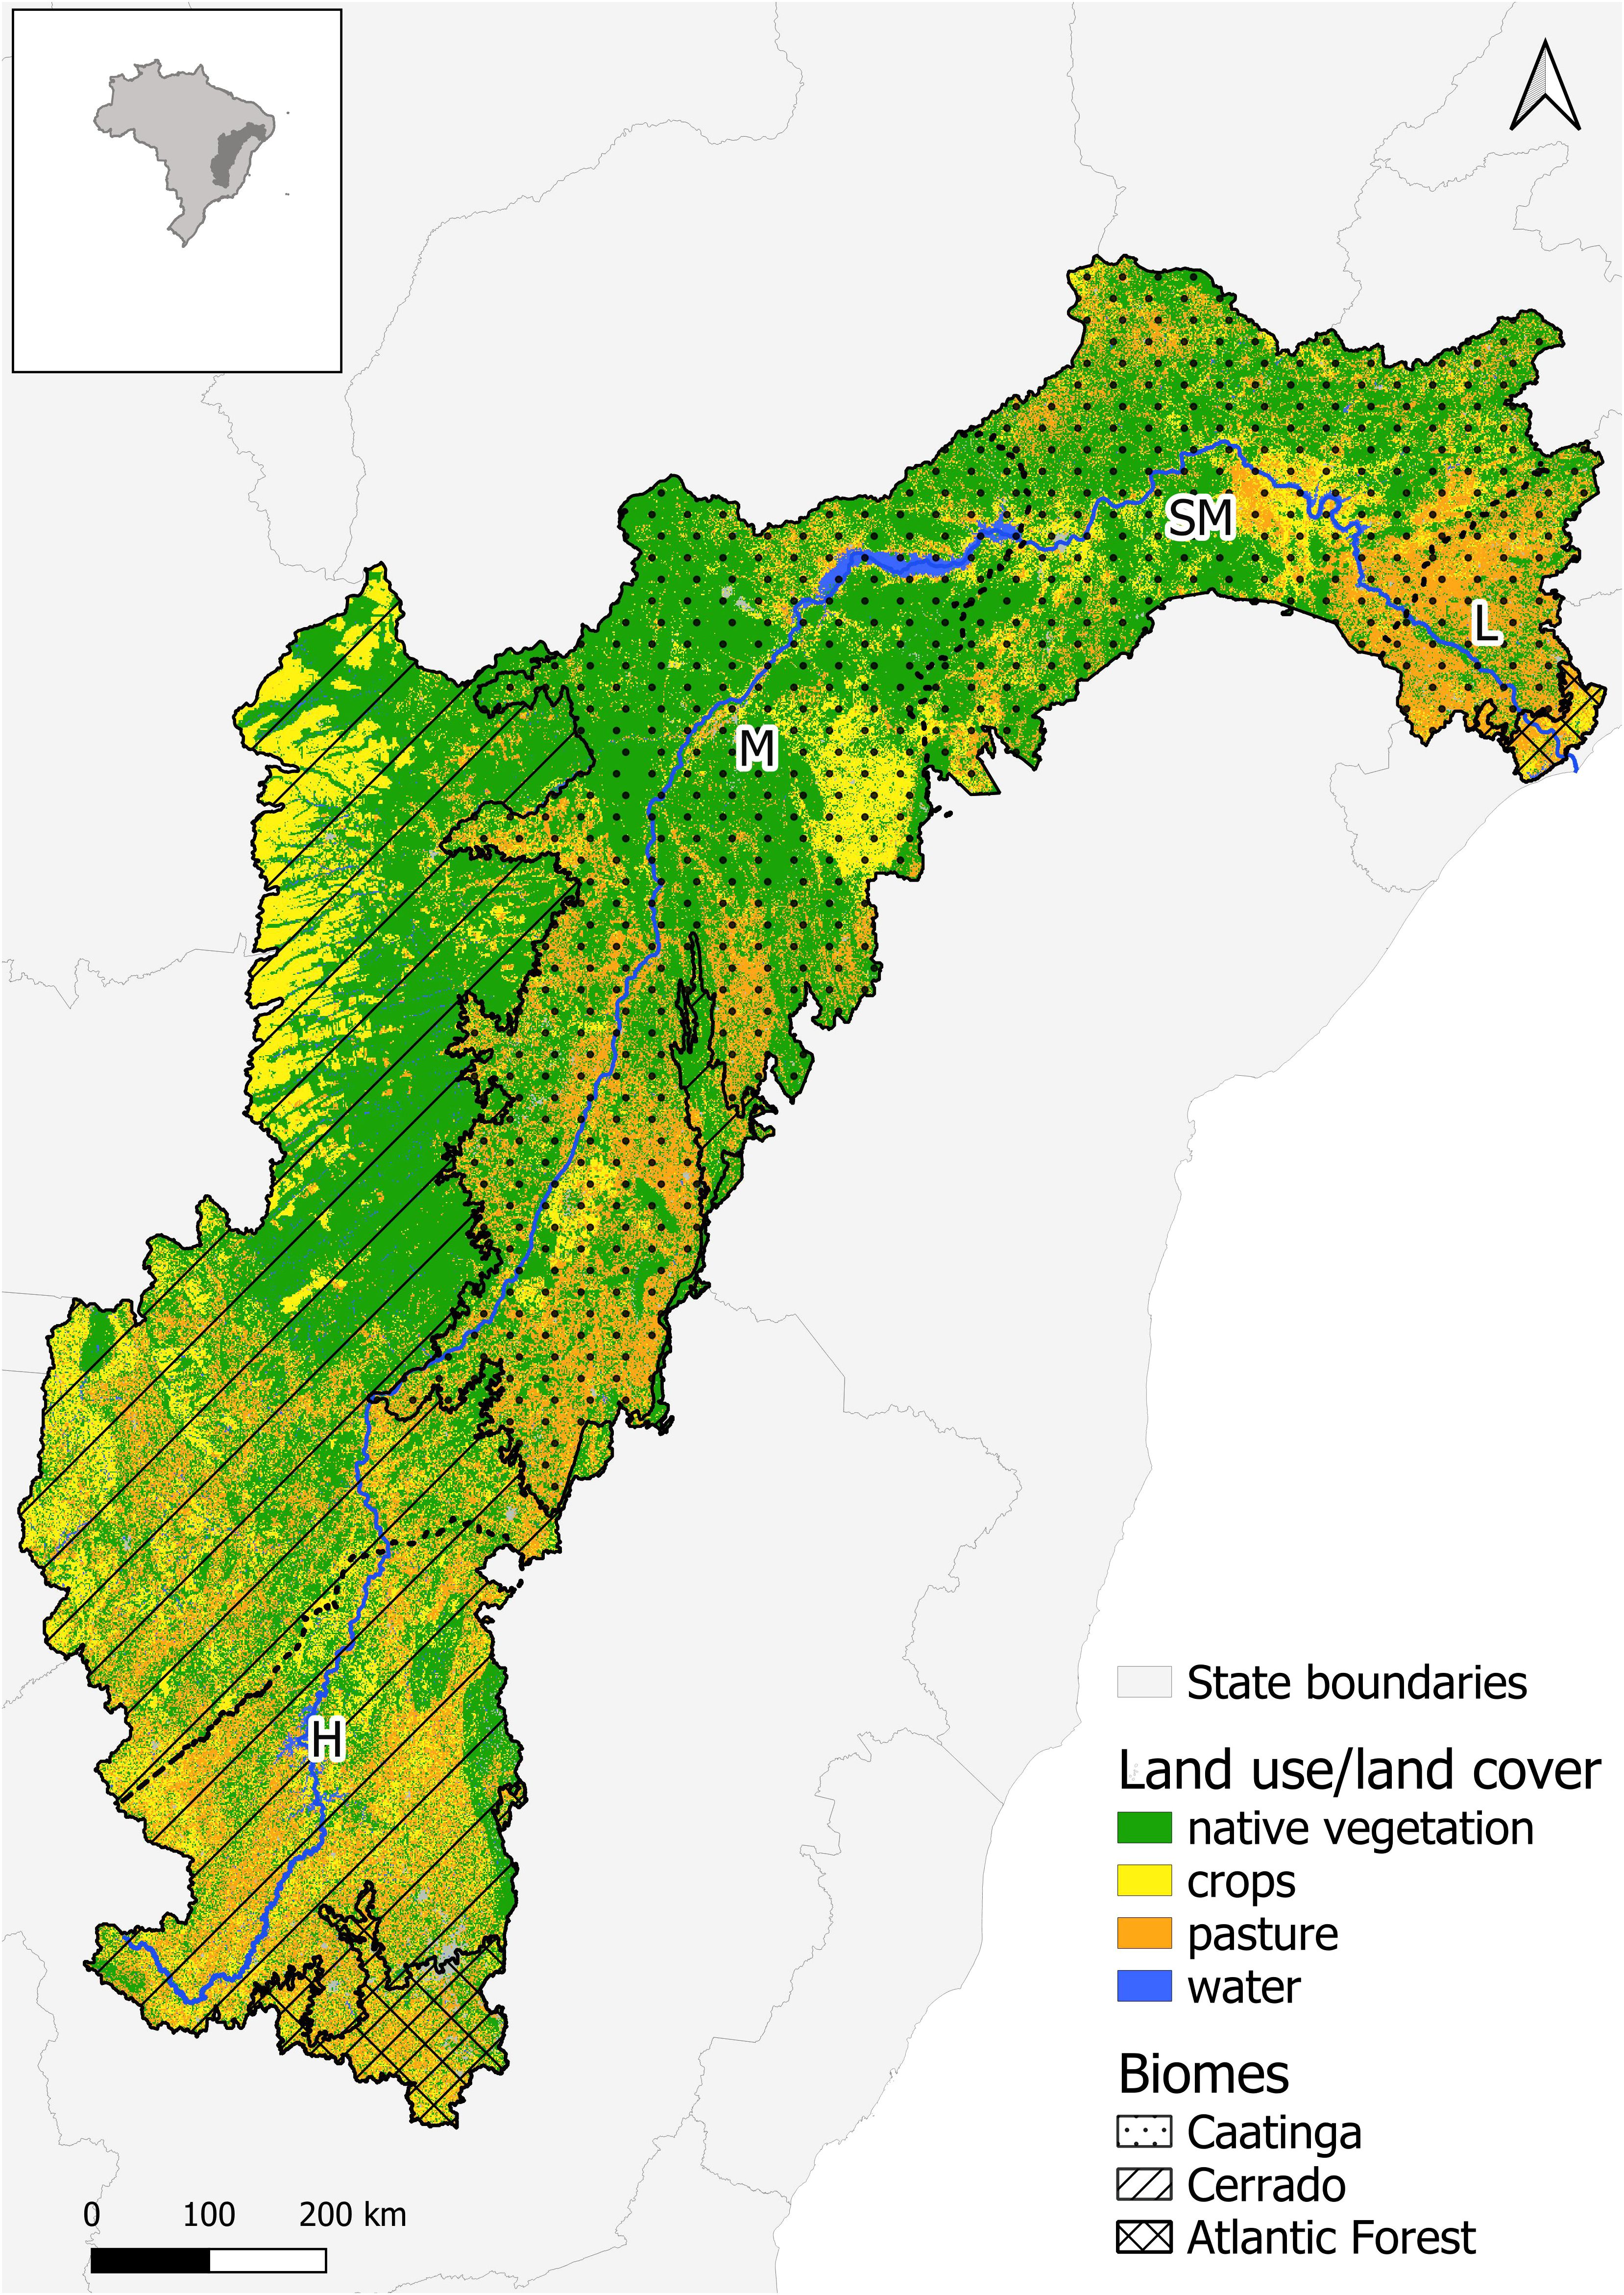
Figure 1. Study region: the São Francisco River Basin (SFB) and its simplified land use/land cover and biomes: Caatinga, Cerrado, and Atlantic Forest. The four physiographic regions: L, Low São Francisco; SM, Sub-Medium São Francisco; M, Medium São Francisco and H, High São Francisco.
NES is considered an EbA hotspot due to socioeconomic fragilities (Kasecker et al., 2018), and its rich socio-biodiversity is under increasing threat (Niemeyer and Vale, 2022). Integrating EbA into policies would support the adaptation goals of the United Nations Framework Convention on Climate Change (UNFCCC), the Kunming-Montreal Global Biodiversity Framework of the Convention on Biological Diversity (CBD), and the Sustainable Development Goals (SDGs) (IUCN, 2017). EbA is a priority adaptation strategy in many international and national agreements, such as the Nationally Determined Contributions (NDCs) under the Paris Agreement (IUCN, 2017; Shah et al., 2019; Brazil, 2021). There is an urgent need to turn policy and planning into rapid and effective implementation. This should be done through an integrated risk approach, as highlighted by the recent COVID-19 pandemic (UNEP, 2021). Nonetheless, risk assessments seldom include all three dimensions of climate risk (hazards, vulnerability, and exposure).
Here we present a comprehensive climate risk assessment in the São Francisco Basin, the most relevant watershed in NES, aiming to identify high-risk municipalities for effective science-based EbA policies. High-risk areas show lower resilience and adaptive capacity, i.e. the potential or ability of a human system to adjust to climate change (Foden et al., 2019). In these areas, people suffer the most from water shortage and low quality, higher temperatures, and have cultural ties to the land and lower socioeconomic development. Ensuring that EbA is implemented in the right locations and with strategies tailored to the specific needs of the area is crucial to achieve all potential benefits and prevent negative impacts (Parmesan et al., 2022). Our analysis encompasses hazards, exposure, and socio-environmental vulnerability, including cultural aspects, to fill gaps and mainstream EbA policy implementation.
2 Methods
2.1 Study area
The São Francisco River Basin (SFB) in NES is the third largest watershed in Brazil, occupying 8% of the country (~640.000 km²) (Figure 1). It crosses six Brazilian States and is divided into four physiographic regions: Low (5% of the watershed), Sub-Medium (17% of the watershed), Medium (39% of the watershed), and High São Francisco (~40% of the watershed) (MMA, 2006).
The SFB still holds 57% of its native vegetation cover (MMA, 2006; Mapbiomas Project 2022b). The remaining area is intensively anthropized mainly by pasture (23% of the basin), agriculture (5%), or both (11%) (Mapbiomas Project, 2022b; Figure 1). The watershed covers a myriad of climates and vegetation types within three out of the five naturally occurring vegetation types, called “biomes” in Brazil: Cerrado savannas, Caatinga seasonally dry forests, and Atlantic Forest rainforest (Figure 1).
The SFB is vital for ES provision in Brazil, with over 70% of its water used for grain and fruit irrigation, primarily for exports (MMA, 2017). Its waters are also responsible for 12% of the national hydropower production (Marengo et al., 2019; da Silva et al., 2021). It accounts for 12% of national hydropower production (Marengo et al., 2019; da Silva et al., 2021), significantly impacting Brazil’s GDP. Facing the greatest socio-economic impacts from natural climatic variability (Brasil, 2006; Marengo et al., 2012), the São Francisco River, central to the SFB, sustains traditional communities such as Indigenous Peoples, quilombolas(Afro-Brazilian descendants of escaped enslaved people who formed autonomous communities in settlements known as quilombos), family farmers, artisanal fishermen, extractivists and gipsy communities (Niemeyer and Vale, 2022; MMA, 2016). The Northeast region alone holds 17% of Brazil’s Indigenous Peoples and more than half of the quilombolas communities (Damasco and Antunes, 2020). These are the most vulnerable population due to their low political representativeness and high cultural value, often unique and irreplaceable. Although there have been little empirical studies that explore the cultural, emotional and spiritual attachments to land and landscapes through interviews or participatory methods, it is widely recognized that a sense of place (sensu Casey, 2001) - enhances communities’ resilience and adaptation capacity to global changes (Selfa et al., 2021).
For centuries, traditional communities in the SFB have shaped their livelihoods and history attached to their lands through adaptation and resistance, learning how to coexist with the Semiarid and keeping up with the São Francisco River’s natural cycles (Moulin et al., 2021; Niemeyer and Vale, 2022). The SF River has many names (Velho Chico, Parapitinga and Opará) and serves the communities who depend on it not only for food and water, but also as a cultural and spiritual reference (MMA, 2017). Locals report that the piracema (the fish migration period), as well as folkloric beings linked to rivers, such as Iara and Caboclo d’Água, are no longer seen due to the impacts of global changes and dam construction (Moulin et al., 2021). Future climate change impacts are expected to worsen, leading to the loss of unique and irreplaceable cultural ES tied to the land and the SF River. It will also exacerbate agricultural productivity and water supply challenges, further increasing food and water insecurity, particularly for the most vulnerable and impoverished populations (Marengo et al., 2018).
2.2 Analysis
We used the IPCC (2014) framework (Figure 2) to assess climate risk in SFB municipalities, focusing on the three main components: hazard, exposure, and vulnerability. Climate risk results from the interaction between hazards, exposure, and vulnerability of human and natural systems (IPCC, 2018; Foden et al., 2019; Pörtner et al., 2022). Hazards are climate-induced physical events, trends, or their physical impacts that may adversely affect socio-ecological systems (IPCC, 2018; Foden et al., 2019). Exposure comprehends the presence of people, human and cultural assets, species, or ecosystems in places that could be adversely affected by climate change (IPCC, 2018; Foden et al., 2019). Finally, vulnerability is the propensity or predisposition of a system to be adversely affected by the effects of climate change (IPCC, 2018; Foden et al., 2019). We mapped various variables associated with each component (Figure 2).
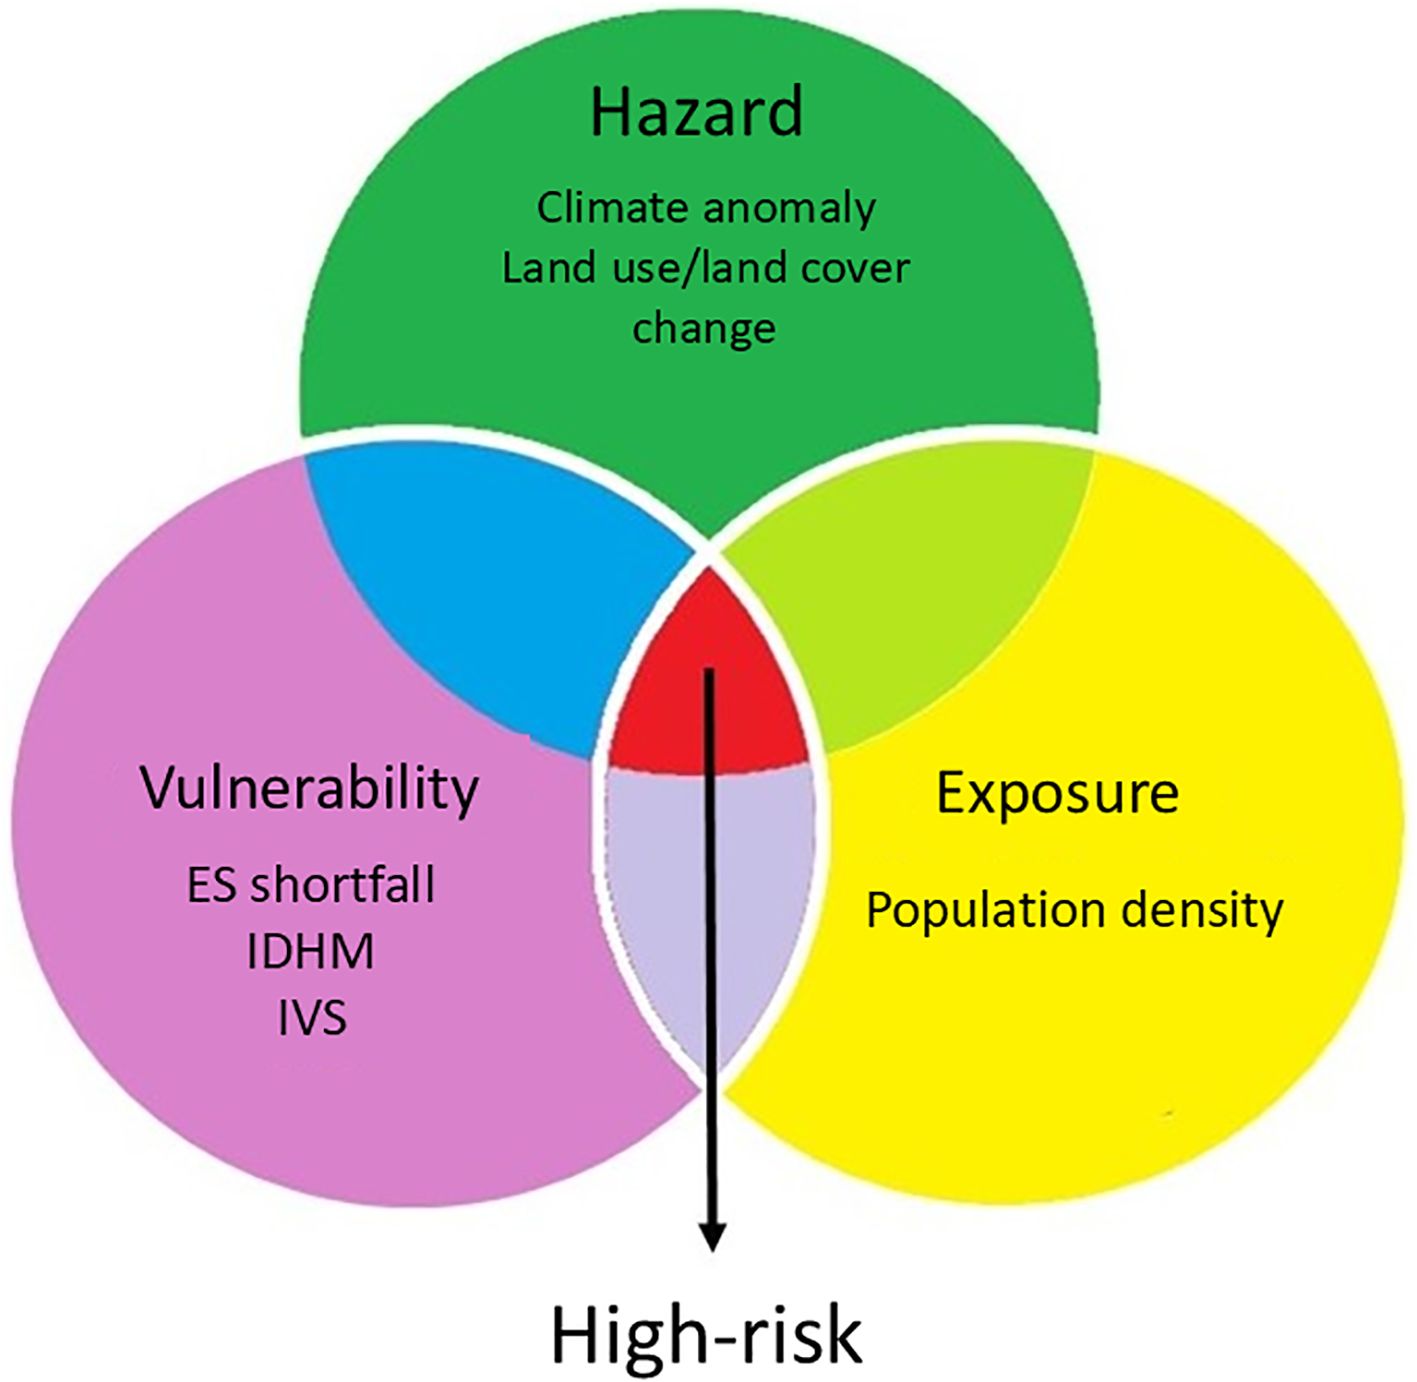
Figure 2. Climate change risk framework. The green circle represents the variables used to estimate hazards; the yellow circle represents the variable used to estimate exposure; and the lilac circle represents the variables used to estimate vulnerability. The overlap of the three components of risk represented the areas of high risk (red). ES, ecosystem services; IDHM, Municipal Human Development Index and IVS, Social Vulnerability Index in Portuguese acronym. Adapted from IPCC (2014) and Foden et al. (2019).
We analyzed risk at the municipal level, as local adaptation strategies are best developed at this scale, with municipalities having the autonomy to enact regulations and collaborate with neighboring areas (Kasecker et al., 2018; da Silva et al., 2017). Municipalities are places where on-ground actions occur, such as urban development, environmental protection, and provision of water supply and sanitation (Alves et al., 2020), and where national plans, such as the National Adaptation Plan, may succeed or fail (da Silva et al., 2017). Our analysis included all municipalities that had their centroid inside the SFB limits, using the IBGE database, totaling 452 municipalities.
We computed mean values for each risk component variable per municipality and categorized them into four groups based on quantiles, where the lowest values fell on the first quartile, and the highest values fell on the fourth quartile. High-risk municipalities were those with high hazards, vulnerability, and exposure concurrently (Figure 3). We selected municipalities falling into the quartile with higher land use change or climate anomaly values (high hazard); lower ES values, or higher sense of place values, and lower IDHM values or higher IVS values (high vulnerability); and higher population density (high exposure). All analyses were spatially explicit, with maps of ~1km x 1km spatial resolution and SAD69 projection.
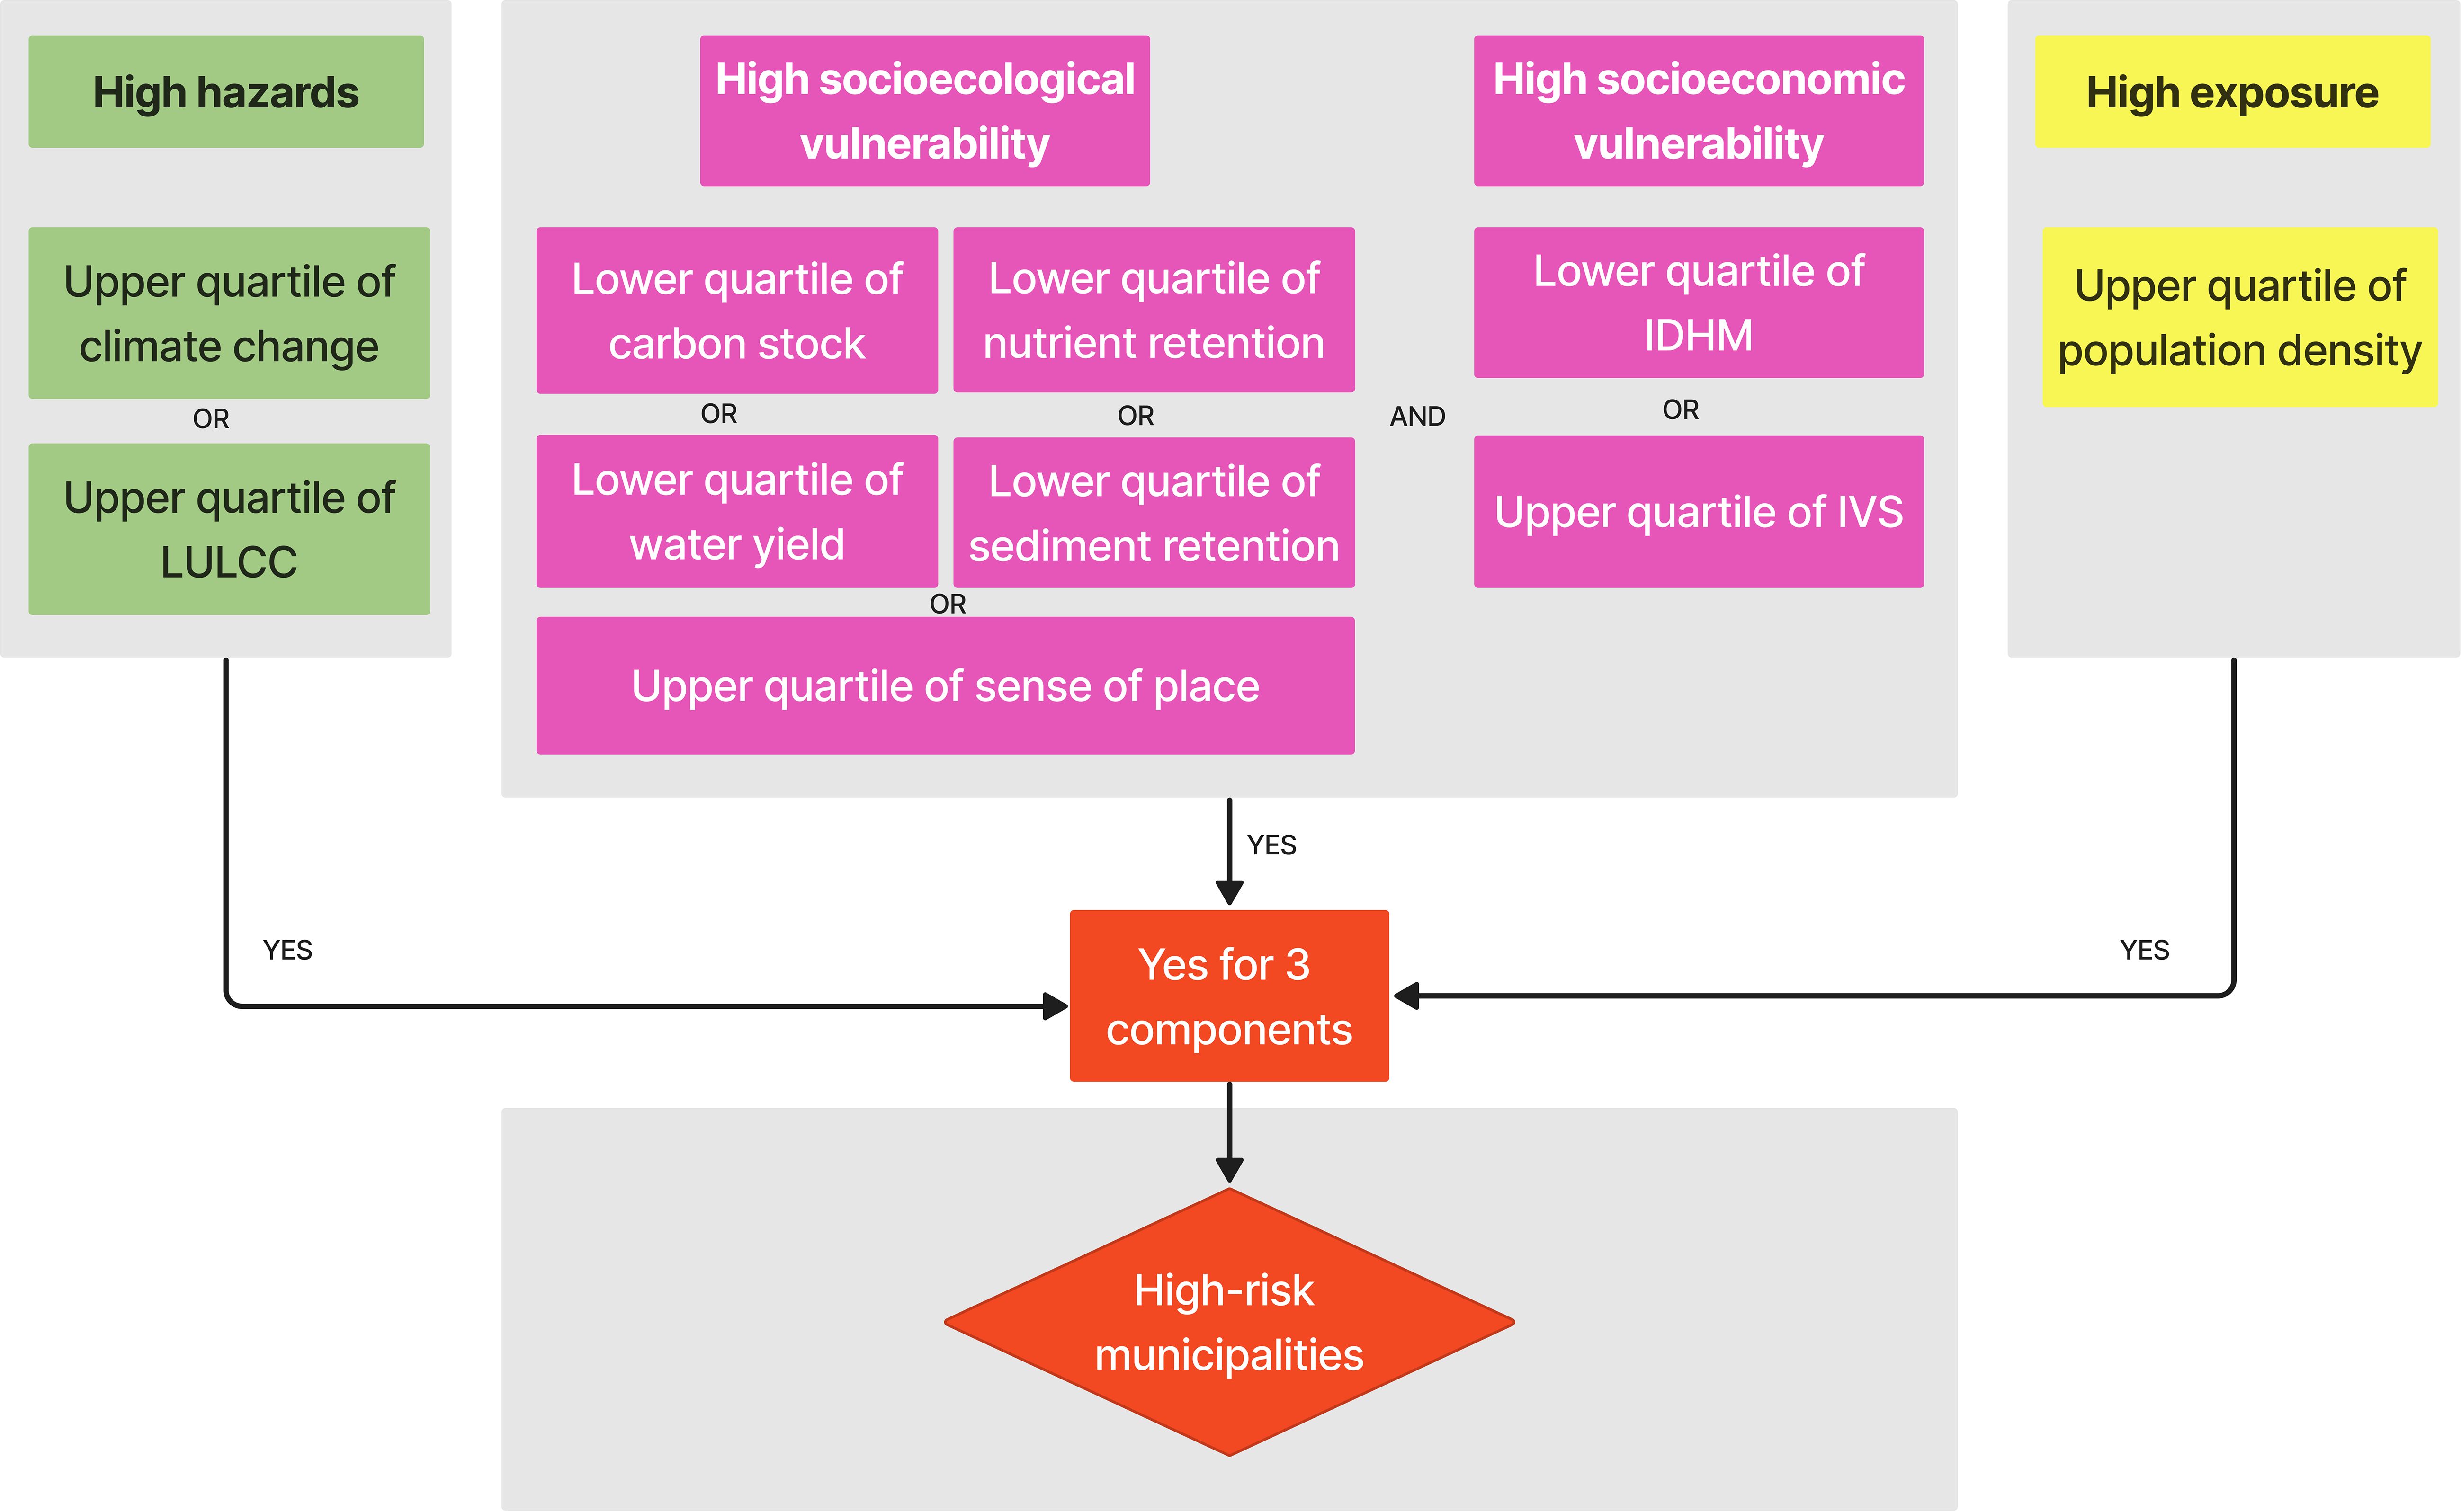
Figure 3. Flowchart explaining the selection of high-risk areas. The lower quartile holds 25% of the lowest values while the upper quartile holds 25% of the highest values. Therefore, if an area (here, a municipality) is in the upper quartile of climate change or land use change (LULCC), it is under high hazards. An area is considered highly vulnerable if it falls into the lower quartile for carbon stock, nutrient retention, water yield, or sediment retention, or the upper quartile for the sense of place, while also being in the lower quartile for IDHM or the upper quartile for IVS. If an area is in the upper quartile of population density, it is under high exposure. When an area is under high vulnerability, high hazards and high exposure, it is a high-risk area.
2.2.1 Hazard
We analyzed climatic and land use change-induced hazards (Figure 3), calculated as future climate anomaly and potential future deforestation, respectively.
For the climatic hazard, we followed the method by Williams et al. (2007) and Ribeiro et al. (2016) to estimate climate change anomaly, which measures the magnitude of climate change in mean values throughout time. We analyzed precipitation and temperature anomalies based on the sum of Standardized Euclidean Distances (SED) for the historical period and 2050. Higher values of SED indicate higher local climate change (Borges and Loyola, 2020). We evaluated the mean annual temperature and mean annual precipitation, and standardized values by the inter-annual standard deviation (historical period) of temperature and precipitation seasonality (Borges and Loyola, 2020; Ribeiro et al., 2016). We obtained historical (1960-1990) and future (2050) bioclimatic variables from Worldclim with a 1km resolution. We used CMIP5’s HADGEM2-ES, the best-performing global circulation model (CGM) for the study region (Álmagro et al., 2020; Avila-Diaz et al., 2020), and two Representative Concentration Pathways (RCP): an optimistic (RCP 4.5) and a pessimistic (RCP 8.5). We calculated the mean values of climate anomaly per municipality. Projected climate changes can vary considerably among GCMs, as different models are known to perform better in specific regions of the world (Cai et al., 2009; Yin et al., 2013). Therefore, whenever possible, studies should prioritize GCMs that demonstrate good performance in the region of interest (Vale et al., 2021). Given that our study area is quite small, we opted to use a circulation model known to perform well in this specific region, rather than relying on multiple models, reducing the uncertainty that arises from ensemble averaging.
For the land use hazard, we used the Otimizagro model for 2013 and 2050 under a business-as-usual scenario (Soares-Filho et al., 2013, 2016). Otimizagro simulates pasture and agriculture expansion in Brazil based on historical and trend information on agricultural production, following the requirements of the Native Vegetation Protection Law, which controls deforestation and conservation of native vegetation inside private lands (Soares-Filho et al., 2013; Niemeyer et al., 2020). We subtracted the native vegetation in 2050 from the native vegetation in 2013 to produce a map of potential vegetation loss. Then, we calculated an index of the amount of vegetation loss pixels/km² within each municipality.
Municipalities were categorized into different hazard conditions using quartiles of climate anomaly and land use change values (Borges and Loyola, 2020). Hazard-prone municipalities exhibit high values of climate anomaly or land use change (Figure 3).
2.2.2 Exposure
We analyzed exposure as municipal human population density, i.e. the number of people per km² (Figure 3). In more populated areas, more people and human assets are expected to be exposed to climate-induced hazards, such as droughts, sea-level rise, erosion, and heavy rainfall events (Castellanos et al., 2022). We used estimates of municipal population in 2021 from IBGE (2021) and calculated the population density (number of people/km²) in each municipality. Highly exposed municipalities have high values of population density (Figure 3).
2.2.3 Vulnerability
To ensure comprehensive vulnerability analysis, we evaluated socio-environmental and socioeconomic vulnerability (Figure 3). Socio-environmental vulnerability was determined based on five ES, while socioeconomic vulnerability relied on two socioeconomic indices.
We analyzed the following ES: water yield, water quality, erosion control, sense of place, and carbon stock, chosen for their regional or global relevance. For example, water security (i.e. reliable availability of acceptable quality and quantity of water) is paramount to sustaining agriculture, industry, and human well-being (Pires et al., 2018), and a key issue especially in the Semiarid region of the SFB (Niemeyer and Vale, 2022). Erosion control is essential as sediment runoff affects downstream irrigation, water quality, recreation, and reservoir performance, with potential intensification due to land use conversion and changes in land management practices (Sharp et al., 2018). Sense of place is a cultural ES that plays a vital role in adaptation strategies, being associated with recognized features of an ecosystem or locality fostering a sense of authentic attachment and belonging (MEA, 2005; Adger et al., 2013; Hernández-Morcillo et al., 2013). The carbon stock of a landscape contributes globally to climate mitigation through carbon sequestration by native vegetation and soils (Gomes et al., 2019).
We used the InVEST software (Integrated Valuations of Ecosystem Services and Tradeoffs) to model and map ES provision (Kareiva, 2011; Manhães et al., 2016; Duarte et al., 2016; Resende et al., 2019). For water yield, we used InVEST’s Annual Water Yield Model, which calculates the amount of rainfall that reaches a stream (mm/km²/year). As land use change alters the water cycle through changes in evapotranspiration, infiltration, and water retention patterns, the model offers insights into how different land use patterns affect annual water yield (Sharp et al., 2018). For water quality, we used the Nutrient Delivery Ratio Model. This model maps nutrient sources (nitrogen and phosphorus) from watersheds and their transport to streams (index). Anthropogenic nutrient sources may include industrial effluent, urban discharges, and fertilizer used in agriculture and residential areas. The model’s output facilitates the evaluation of nutrient retention by natural vegetation. The nutrient retention service is especially relevant for addressing surface water quality concerns (Sharp et al., 2018). We followed the methodology by Yang et al. (2018) to calculate nutrient retention based on InVEST outputs (see Supplementary Material for more information). Finally, for erosion control, we used the Sediment Delivery Ratio Model, which assesses landscape capacity to retain sediment and nutrients, contributing to maintaining soil fertility and water quality (Resende et al., 2019). Sediment dynamics at the catchment scale are influenced by climate, soil properties, topography, and vegetation. Sediment retention reflects land cover’s ability to prevent sediment transport to streams (t/km²/year). Supplementary Materials provide details on datasets and input calculation methods. We analyzed the sense of place as the number of indigenous and Quilombo sites per municipality based on IBGE (2020) data. These sites represent permanent settlements inhabited by self-declared Indigenous Peoples or quilombolas (IBGE, 2020), where the landscapes’ ecosystem has an intrinsic cultural value (de Oliveira Braga et al., 2014). For carbon stock (t/km²), we summed aboveground and soil carbon stock maps from Englund et al. (2017) and Gomes et al. (2019), respectively. For socio-environmental vulnerability analysis, we computed mean ES values per municipality and categorized them into four quantile groups (Figure 3). Higher socio-environmental vulnerability is observed where carbon stock, water yield, water quality, or erosion control are low, or sense of place is high (Figure 3).
We used the Municipal Human Development Index (IDHM, PNUD/IPEA/FJP, 2020) and the Municipal Social Vulnerability Index (IVS in Portuguese acronym, IPEA, 2016) to assess socioeconomic vulnerability. IDHM comprises three dimensions of human development: longevity, education, and income dimensions, reflecting the opportunity for a long, healthy life, access to knowledge, and a standard of living ensuring basic needs1. It adjusts to each municipality’s reality, reflecting regional challenges. It varies from 0 (very low human development) to 1 (very high human development). IVS complements IDHM, emphasizing social exclusion and vulnerability beyond monetary resources (IPEA, 2016). It comprises sixteen indices across three dimensions: urban infrastructure, human capital, and income/work. Ranging from 0 (very low vulnerability) to 1 (very high vulnerability), IVS aims to highlight governmental flaws in service provision (IPEA, 2016). Socioeconomic vulnerability is higher where IDHM is very low, or IVS is high (Figure 3).
Highly vulnerable municipalities have very low ES values or high sense of place values, alongside very low IDHM or high IVS (Figure 3).
3 Results
3.1 Hazard
By 2050, the SFB may lose 331,000 km2 of native vegetation, a 26% reduction from 2013, mainly in the Medium and Sub-Medium São Francisco regions dominated by Cerrado and Caatinga vegetation (Figures 4A, B). The Medium São Francisco exhibits higher potential climate anomalies, particularly under pessimistic scenarios, as expected (Figures 4B, C). Municipalities generally experience medium to high potential climate anomaly, showing consistent spatial trends across scenarios (Figures 4E, F). Therefore, we opted to utilize climate anomaly projections from the pessimistic scenario for subsequent analyses.
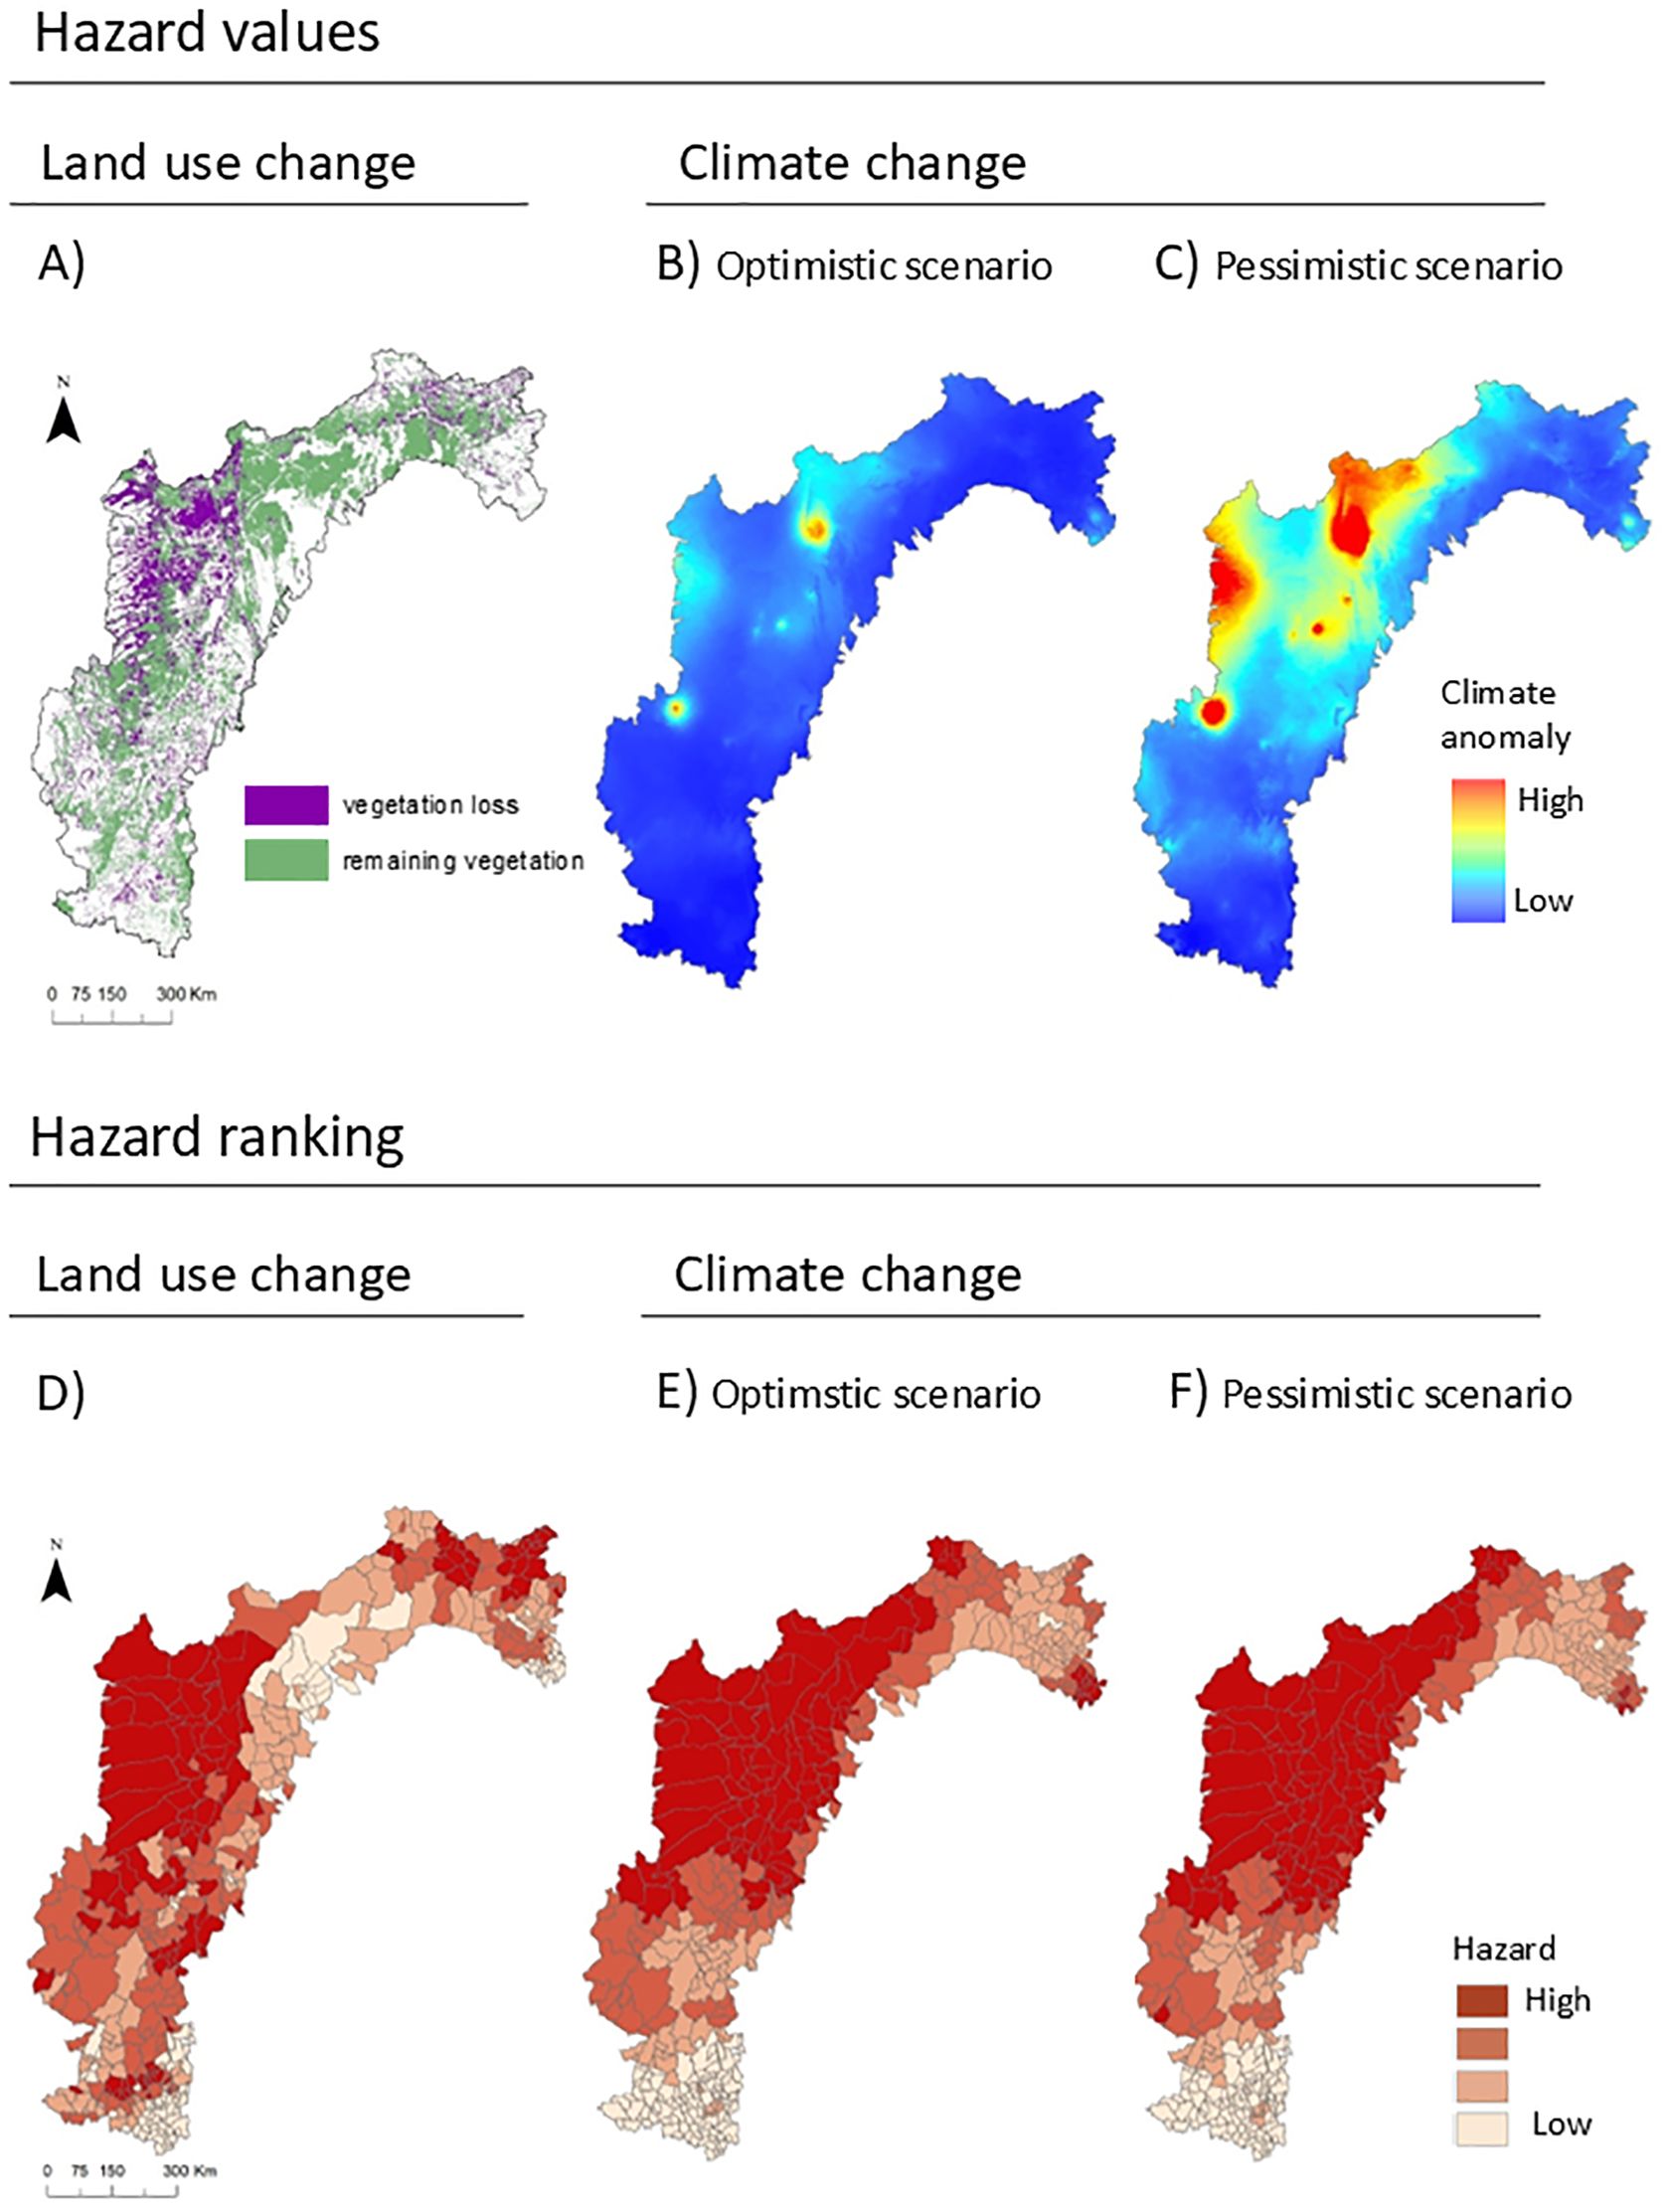
Figure 4. Potential hazards projected to 2050 within the São Francisco River basin. (A) land use change (difference between vegetation in 2050 and 2013); (B, C) climate anomaly according to the optimistic (RCP4.5) and the pessimistic (RCP8.5) scenarios; (D) municipalities’ hazard ranking based on land use change; and (E, F) municipalities hazard ranking based on climate anomaly under the scenarios.
Worrisomely, climate and land use changes spatially coincide, with the Medium São Francisco predicted to endure the most pronounced changes (Figures 4, 5). In contrast, municipalities in the High São Francisco region primarily experience minimal climate and land use alterations. Among the 455 municipalities analyzed, 9% were in the highest hazard category, most within the Medium São Francisco, covered by Cerrado (red municipalities in Figure 5). Meanwhile, 10% fell into the lowest hazard category, mostly in the High São Francisco and covered by Atlantic Forest (blue municipalities in Figure 5). See Supplementary Table SM4 and the online dashboard2 for result details.
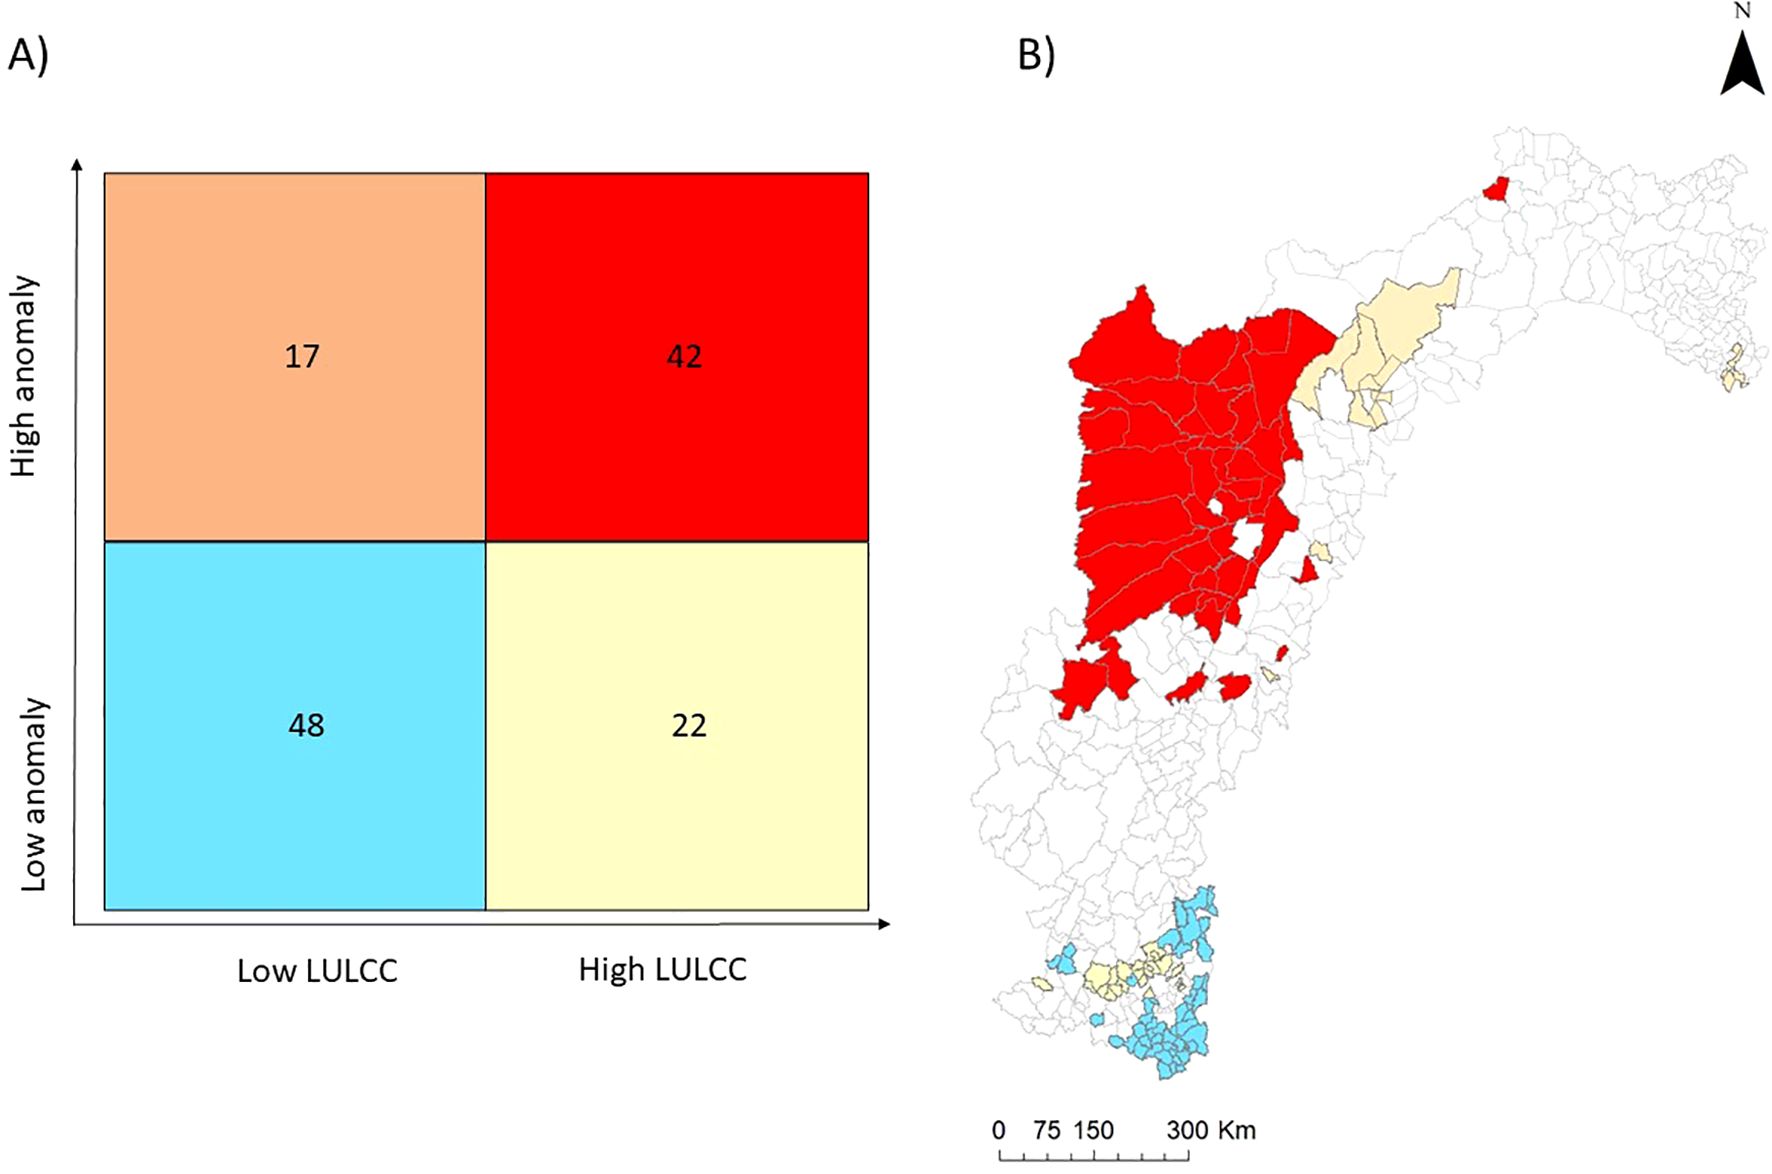
Figure 5. Synthesis of climatic and land use hazards within the São Francisco River basin. (A) Diagram showing different conditions of climate anomaly and land use change (LULCC). Numbers within the squares show how many municipalities fall within that category. (B) Map showing the municipalities that fall within each category in the diagram. The map uses the same color scheme as in (A), with blank municipalities representing those that do not fall within specified categories.
3.2 Exposure
There are 113 municipalities under high exposure, i.e. have high population density (Figure 6), 45% of which are in the High São Francisco region, and 42% in the Low São Francisco region, mostly within the Atlantic Forest (48%). Conversely, of the 114 municipalities that are under very low exposure, 66% are in the High São Francisco region, and 35% are in the Medium São Francisco region, mostly within the Cerrado (85%).
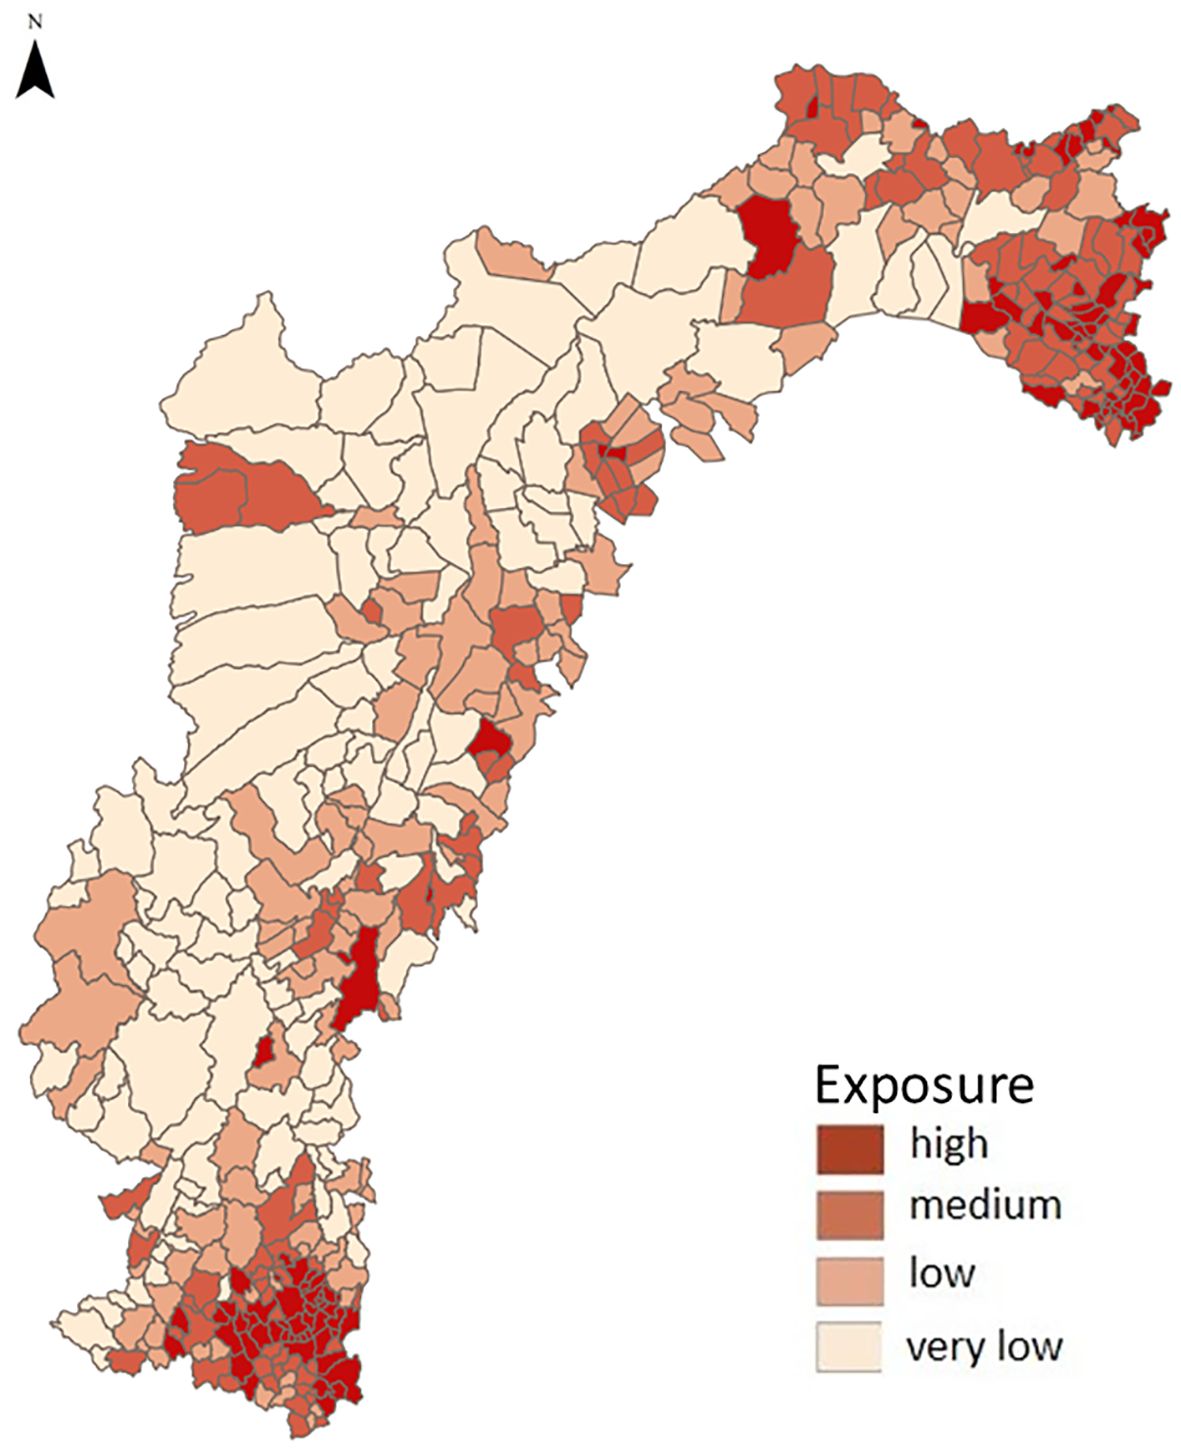
Figure 6. Exposure within the São Francisco River basin. Municipalities are ranked based on population density.
3.3 Vulnerability
Ecosystem services (ES) exhibited idiosyncratic spatial patterns (Figure 7A). Carbon stock and water yield were lower in the Sub-Medium and Low São Francisco regions, increasing southwards towards the High São Francisco. Water yield was also higher in the Medium and High São Francisco areas. Water quality remained consistently high across the basin, although slightly elevated in the Sub-Medium São Francisco. Erosion control had moderate to low values basin-wide. The sense of place was relatively higher in the Sub-Medium São Francisco and lower in the Medium and High São Francisco regions.
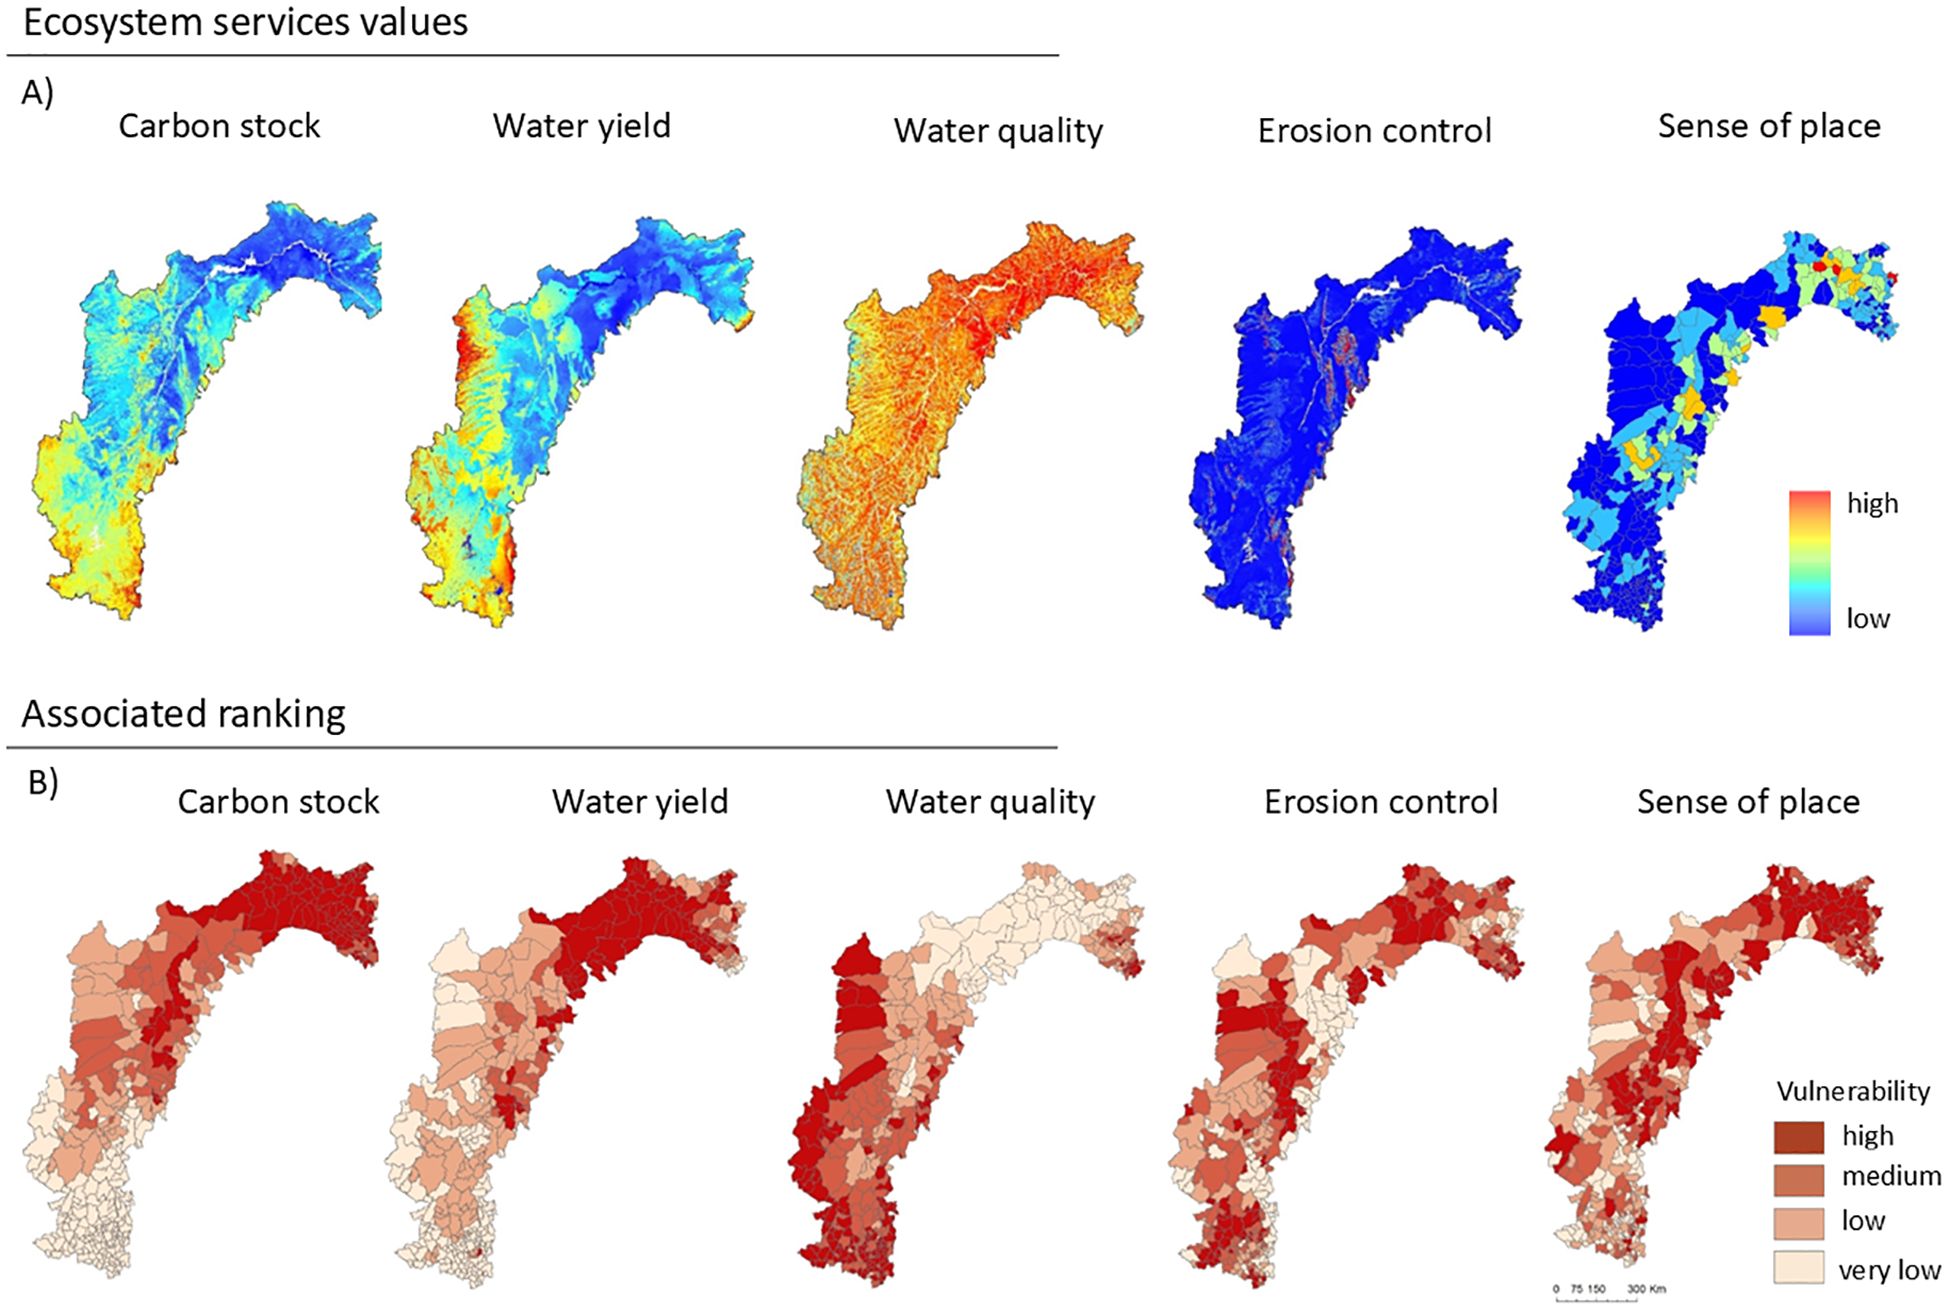
Figure 7. Vulnerability given by the provision of ecosystem services within the São Francisco River basin. (A) Estimated values for each ecosystem service. Note that sense of place is calculated per municipality, while other ecosystem services are calculated per pixel (1 km² resolution). (B) Municipality ranking based on ecosystem services values separated into quartiles.
Most municipalities (78%) had high vulnerability to at least one ES (Figure 7B). None were highly vulnerable to all ES simultaneously, though one (Catuti, Minas Gerais state) showed high vulnerability to four ES, excluding the sense of place, presenting medium cultural value. Additional municipality details are available in Supplementary Table SM4. Primarily, highly vulnerable municipalities were in the Sub-Medium and Low São Francisco regions, mainly within Caatinga vegetation, occasionally Cerrado. However, for water quality, the most vulnerable municipalities were in the Medium and High São Francisco regions.
Socioeconomic indices revealed a consistent trend, with the highest vulnerability (low IDHM and high IVS) clustered in the Sub-Medium and Low São Francisco, contrasting with low vulnerability in most High São Francisco municipalities (Figure 8). Lower IDHM and higher IVS values indicate higher socioeconomic vulnerability.
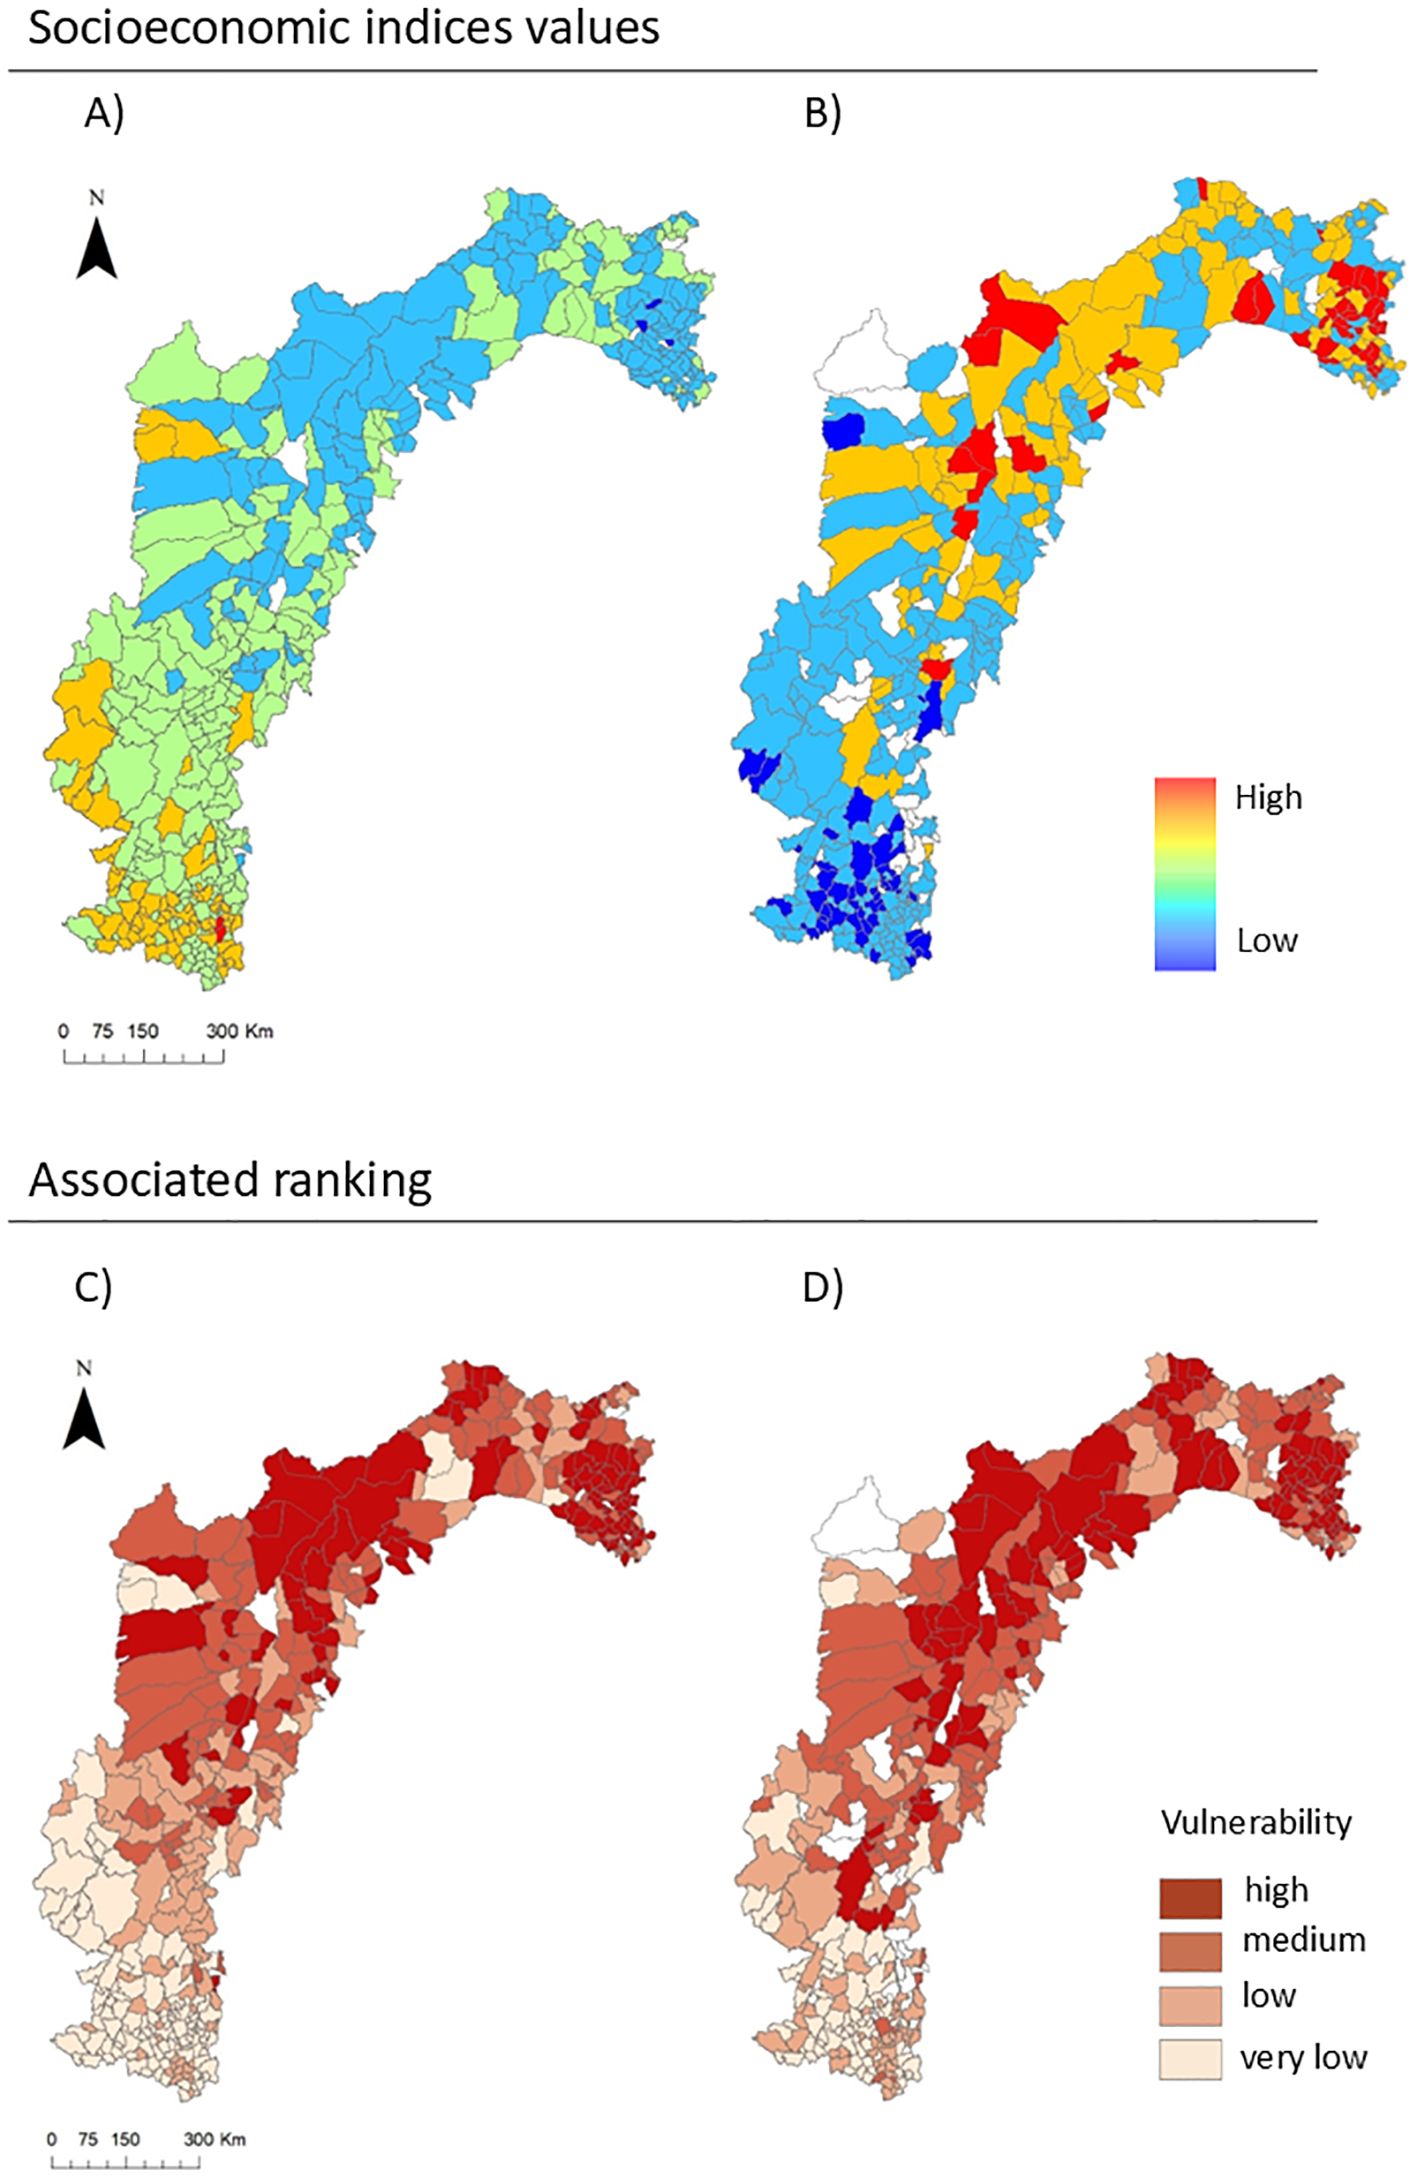
Figure 8. Vulnerability given by socioeconomic indices within the São Francisco River basin. (A) Values of Municipal Human Development Index (IDHM) and (B) of Municipal Social Vulnerability Index (IVS); Municipality ranking based on (C) IDHM and (D) IVS, separated into quantiles. Blanks represent municipalities with no information.
Most municipalities (94%) with high socioeconomic vulnerability in the SFB are in the Caatinga biome, in the Northeast region (Figures 8C, D). About 83% of municipalities intersected very low IDHM and high IVS, with all but one located in the Sub-Medium or Low São Francisco. Additional details are provided in Supplementary Table SM4 and interactive spatial visualization is provided in the online dashboard.
3.4 High-risk areas
Municipalities under higher risk are in the intersection between hazards, exposure, and vulnerability (Figure 9). Fifteen municipalities in the SFB were identified as high-risk, combining all three components (red in Figure 9), with some in the Sub-Medium and most in the Low São Francisco. Additionally, 97 municipalities (21%) intersect two risk components: 52 with high hazard and vulnerability (blue in Figure 9), 29 with high exposure and hazard (light green in Figure 9), and 16 with high exposure and vulnerability (lilac in Figure 9). Further details on municipalities and their risk components are available in Supplementary Table SM4 and interactive spatial visualization is provided in the online dashboard.
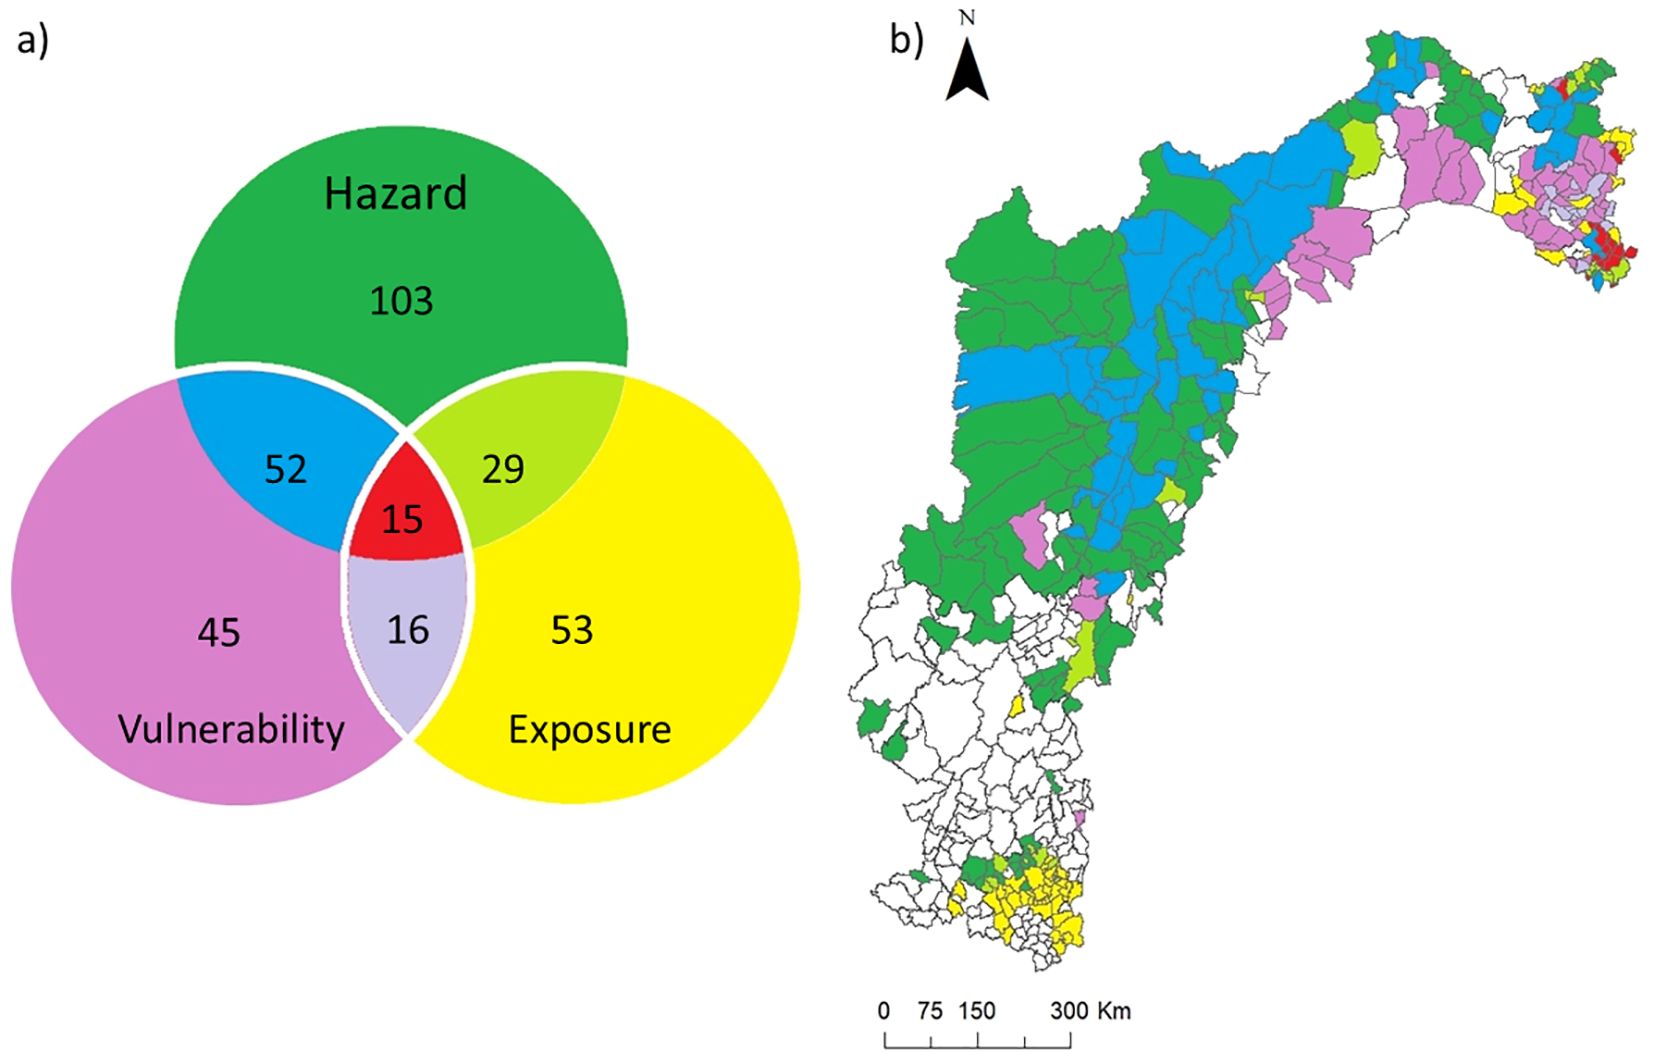
Figure 9. Risk components in municipalities within the São Francisco River basin. (A) Diagram showing the three components of risk (hazard, exposure, and vulnerability) and the number of municipalities that fall within the components or in the intersection between components. (B) Map showing the municipalities with the same color scheme as in (A). Framework based on Borges and Loyola (2020).
4 Discussion
The SFB combines low socio-economic development with severe drought stress, rendering the region particularly vulnerable to climate change. We identified the municipalities facing the most significant climate change risks. Our discussion encompasses the biophysical and social aspects of our findings, along with management strategies to enhance resilience in these high-risk municipalities to ongoing climate change.
4.1 Biophysical and social dimensions
Our findings indicate higher hazards in municipalities of the Northwest (Medium São Francisco) (Vieira et al., 2020). Deforestation is projected to primarily impact the Cerrado and Caatinga regions in the North and Northeast of the SFB. Notably, in 2021, Cerrado and Caatinga ranked as the second and third most deforested biomes in Brazil (Mapbiomas Project, 2022a). In the Caatinga, chronic deforestation accelerates land degradation, increasing desertification risk (Vieira et al., 2020). High aridity and land degradation could also increase fire susceptibility, under a positive feedback that further exacerbates desertification (Castellanos et al., 2022; Vieira et al., 2020; Viegas et al., 2022). Indeed, fire occurrences related to agricultural expansion in the Caatinga increased by 167% between 2020 and 20213. Additionally, desertification is associated with carbon emissions from soil and vegetation, underscoring the global significance of preserving Brazilian dry forests as potential carbon sinks (Fernandes et al., 2020, 2021).
Our study identified a water quality gradient, declining from the High to the Low São Francisco, consistent with prior research (Bettencourt et al., 2016; MMA, 2017). However, this does not imply that the Northeast is devoid of water quality issues, as approximately 55% of the region’s water is unfit for human consumption, and 77% of the Low São Francisco has water unsuitable for irrigation (MMA, 2017). Anthropic activities have contributed to water quality deterioration (Bettencourt et al., 2016; MMA, 2017). Water scarcity is projected to be exacerbated by climate change-induced aridity and rising irrigation demands, which currently represents 77% of water withdrawals (Lucas et al., 2021; Paredes-Trejo et al., 2021; da Silva et al., 2021; Vieira et al., 2020). Freshwater ecosystems and biodiversity are also impacted, as is shown by the decreased productivity of traditional artisanal fishing (MMA, 2017).
The São Francisco River, Brazil’s national integration river, has lost 50% of its natural water surface in the last three decades, and hydroelectricity generation is declining (Mapbiomas Project, 2022b; da Silva et al., 2021). Anticipated rainfall reductions by 2100, possibly as early as 2050, will impact water availability and hydropower generation, and hydroelectricity production in the SFB could completely cease during drought years by 2030 (de Jong et al., 2018). These projections are expected to exacerbate socio-environmental vulnerabilities and conflicts over water, leading to population migration to other regions (Marengo et al., 2012; Forcella et al., 2015).
Our findings suggest low erosion control throughout the São Francisco River. Scarce yet intense rainfall increases surface runoff and sediment transport, negatively impacting river sedimentation, hydropower generation, and water quality (Bettencourt et al., 2016). Recovery of riparian vegetation could be an important EbA strategy in municipalities most affected by river sedimentation and water degradation (Holanda et al., 2005, 2009). Strengthening and enforcing the Native Vegetation Protection Law could support such efforts (Niemeyer et al., 2020). Restoration efforts could focus on species providing food and medicine to boost income generation and engage landholders (Holanda et al., 2005).
It is important to note that the water yield, water quality, and erosion control results derived from widely used, although simplified, models (Sharp et al., 2018), that potentially deviate from reality due to limited local-scale data for model parametrization. Still, we used concise, reliable information from studies within or near the SFB region. Moreover, water demand should be included in future analysis, which could impact high-risk area identification. Thus, the information provided here serves to evaluate the relative potential for ES provision within the region, being an initial step in the decision-making process.
The Northeast region holds the highest sense of place value within the SFB, representing individuals’ attachment and identity to their surroundings (Adger et al., 2013). Indigenous and quilombola territories in Brazil effectively mitigate deforestation, foster regrowth, and are pivotal for biodiversity and ES conservation (Lima et al., 2020; Resende et al., 2021; Alves-Pinto et al., 2022), playing a key role in guaranteeing human wellbeing and supporting climate change adaptation (Scarano, 2017; Pires et al., 2018). Additionally, Semiarid communities have developed cultural practices and social technologies to adapt to climate-related risks. Incorporating local knowledge into policy frameworks can enhance the effectiveness and scalability of adaptation initiatives, as demonstrated by the success of the 1 Million Cisterns Program (P1MC) (Niemeyer and Vale, 2022). The P1MC is a large-scale initiative to provide access to safe drinking water through rainwater harvesting in Brazil’s semi-arid region.
Global impacts on land and ecosystems lead not only to species loss, but also to the disruption of social processes and the loss of ecosystem services (Moulin et al., 2021). Climate change jeopardizes cultural values and expressions, which influence societal responses and adaptations to climate risks (Adger et al., 2013). Cultural ES is often unique and irreplaceable, yet still overlooked in vulnerability assessments (Pires et al., 2018). Indigenous Peoples and local communities are typically the first and most drastically affected by climate change, often displaced from their valued places (Thomas et al., 2019). Territory, human displacement, and indigenous and local knowledge are non-economic losses driven by climate change (UNFCCC, 2024). While the cultural dimension in our analysis remains superficial, our approach offers a valuable starting point to represent people-place relationships, an aspect often overlooked in assessments of ecosystem services and EbA in Brazil (Pires et al., 2021). This is particularly relevant given the historical resistance and claims for ancestral land by Indigenous Peoples and quilombola communities. Still, we strongly encourage that further studies are conducted in direct contact with Indigenous Peoples and local communities. Directly engaging local communities in knowledge co-production fosters inclusivity and should integrate decision-making and EbA policy development (Bourne et al., 2016; Niemeyer and Vale, 2022).
4.2 High-risk areas management
We identified fifteen high-risk municipalities in SFB (Supplementary Table SM4). These areas show relatively low vulnerability to water availability, possibly due to higher relative precipitation. The vast majority are under high hazards related to climate anomaly. Inhabitants of high-risk municipalities have a significant social vulnerability, especially considering the high number of indigenous and quilombolas sites. These communities are particularly vulnerable and should be a focal point for EbA policies. These municipalities have either very low or high susceptibility to land use changes, likely due to extensive pastureland conversion already in place. The Low São Francisco region has the lowest native vegetation percentage under protection (4%) within the basin (Mapbiomas Project, 2022b). Thus, expanding protected areas could be a key EbA strategy to mitigate further deforestation. Policymakers should analyze each risk component of high-risk municipalities and integrate local data to develop and implement effective EbA strategies.
Analyzing risk components helps identify high-risk areas for EbA strategies, improving adaptation capacity. However, local EbA measures contribute, but are not enough in reducing climatic hazards in the short term, requiring large-scale mitigation actions that reduce greenhouse gas emissions or increase their sequestration. Similarly, reducing exposure typically involves resettlement, which is desirable only in disaster-prone situations. Hence, widespread local EbA actions in the SFB would be effective in reducing vulnerability and climate change impact (Garcia et al., 2019) and should be complemented by technological solutions at the regional or watershed scale.
EbA includes ecosystem conservation, restoration, and management (Scarano, 2017). Maintaining natural features increases ecosystems and species’ resilience to climate change, which is crucial for ecosystem service provision, thereby bolstering climate change adaptation and socio-ecological systems’ health (Bourne et al., 2016). Conservation, restoration, and sustainable management are crucial in areas prone to land use changes to bolster climate resilience (Bourne et al., 2016). However, the SFB is inadequately protected: only 7% of its native vegetation lies within protected areas, and just 1% falls within the strictly protected category (Jenkins et al., 2015; CNUC/MMA, 2022). This increases the risk of losing unique species and ecosystem functions. Land use and climate changes exacerbate extinction risks for SFB’s endemic species and the ecosystem services they provide (Manhães et al., 2016; Velazco et al., 2019). This emphasizes the need to expand this protected areas network, including indigenous and quilombolas’ territories, to safeguard species and ES that are essential for local welfare (Velazco et al., 2019; Colli et al., 2020; Resende et al., 2021; Niemeyer and Vale, 2022; Vale et al., 2023).
Payments for environmental services (PES), sustainable forest management incentives, and indigenous rights support may integrate biodiversity and ES conservation with socioeconomic development (Fernandes et al., 2021; Niemeyer and Vale, 2022). Providing technical assistance for sustainable agricultural practices like agroforestry and implementing deforestation-curbing policies could enhance native vegetation regeneration and carbon sequestration in Brazil’s Semiarid region (Fernandes et al., 2021; Niemeyer and Vale, 2022). Designing protected areas that balance biodiversity conservation and ES provision, resilient to climate change, is crucial (Manhães et al., 2016; Velazco et al., 2019).
Hydropower from the São Francisco River is an important energy source for Northeast Brazil (Milhorance et al., 2019) but is already suffering reductions due to drought. which is expected to increase along with climate change. Climate change impacts and increased demand may reduce water availability by up to 50% by 2050 at the Sobradinho hydroelectric plant within the SFB (de Jong et al., 2018; da Silva et al., 2021). Other than investments in irrigation regulations, investing in renewable resources like wind and solar energy are technical solutions that offer cheaper, more sustainable alternatives that are less vulnerable to climate change (de Jong et al., 2018). In 2025, the Northeast is responsible for almost 90% of Brazil’s wind energy production (https://l1nq.com/lHP56), and solar and wind energy production in the region are expected to increase (da Silva et al., 2021; de Jong et al., 2019). However, regulatory frameworks for wind and solar power in the region need improvement due to negative social and ecological impacts resulting from institutional weaknesses, fraudulent licensing, and procedural injustices, which have marginalized local communities from decision-making (Gorayeb et al., 2018). Impacts include wind farms near ecologically significant areas and displacement of Indigenous Peoples and traditional communities lacking formal land titles (Gorayeb et al., 2018; Niemeyer and Vale, 2022).
Given the São Francisco River’s significance and vulnerability to climate change, urgent implementation of a sustainable restoration program is imperative. Proposed in 2001 by the federal government, the Revitalization program aims to enhance socio-environmental conditions, ensure water access, promote sustainable economic activities, and implement preventative measures and improve sanitation (IPEA, 2019; Alves da Silva Rosa et al., 2021). Despite slow progress, it stands as a vital EbA and is key to achieving regional water security (Alves da Silva Rosa et al., 2021; Niemeyer and Vale, 2022).It offers soil conservation benefits and opportunities for soil remediation and native vegetation restoration in low sediment retention areas. Incentives for a more sustainable development are paramount, and the Revitalization program of the SFB must be the center of sustainable investments both in high-risk areas and the SFB entirely.
There are still several obstacles to the effective implementation of EbA. Some of the most prominent challenges in the region include a strong policy focus on infrastructure and engineering solutions rather than on nature-based approaches; conflicts due to land concentration and the political influence of agribusiness; existing policies that fail to effectively reverse social vulnerabilities or enhance climate resilience, further undermining efforts to adapt to changing conditions; biodiversity conservation is still limited in the region, as well as restoration and the Revitalization program; and finally, Brazil’s constant changes in the political environment are a significant challenge to environmental sustainability, being unable to maintain some EbA-key policies in the long-term (Niemeyer and Vale, 2022). In addition, there is a high global financial gap for adaptation measures that exceed current available cash flows (Brandon et al., 2025). Adaptation actions are often misinterpreted as avoiding climate-related losses only, when it delivers economic, social, and environmental returns (Brandon et al., 2025).
5 Conclusions
Our study offers spatially explicit priorities for climate change adaptation in the São Francisco River basin in NES. It can aid decision-makers in developing science-based regional action plans and implementing effective EbA policies. High-risk municipalities are mainly in the Northeast region, within the Caatinga biome, facing threats to food, water security, and health. These areas should prioritize EbA strategies like restoration, conservation, and sustainable resource management to enhance resilience for both people and biodiversity. Niemeyer and Vale (2022) proposed policies and legal instruments to support EbA in the Caatinga seasonally dry forests.
EbA should be integrated into municipal development plans, drawing inspiration from the National Adaptation Plan (Kasecker et al., 2018). Simultaneously, technological solutions for energy security, such as expanding solar and wind power production, should be implemented at the watershed scale, observing socioenvironmental safeguards. Our findings can guide Brazilian decision-makers in initiating EbA strategies, supported by robust monitoring and evaluation systems. It should also involve local communities and the São Francisco River Basin committee to ensure inclusive and cohesive actions.
The online dashboard we developed4 provides interactive spatial visualization to facilitate the decision-making process. It allows users to visualize the SFB on Google Earth Engine over a map or satellite imagery, and select from the drop-down menu, or click on the municipality the user is most interested in. A pop-up window will appear showing the name and risk category, and the user will be able to choose which risk category to be portrayed on the map. While this dashboard provides a visual and interactive overview of the region’s situation, Supplementary Table SM4 offers insights into the most critical risk components that need to be prioritized in each municipality to promote EbA.
To maximize benefits and avoid harm, EbA must be implemented in the right areas with tailored approaches and inclusive governance. Our method helps identify crucial risk components, facilitating the development of municipality-specific adaptation solutions. This is the first step of the decision-making process and local specificities must be recognized in order to develop appropriate actions. This approach can be applied elsewhere in the globe to assess a region’s potential to deliver ecosystem services, serving as a decision-making baseline. However, for site-specific actions, we recommend including local field data analysis.
Data availability statement
The raw data supporting the conclusions of this article will be made available by the authors, without undue reservation.
Author contributions
JN: Conceptualization, Data curation, Formal Analysis, Funding acquisition, Investigation, Methodology, Project administration, Resources, Software, Validation, Visualization, Writing – original draft, Writing – review & editing. FR: Conceptualization, Methodology, Supervision, Validation, Writing – review & editing. EM: Data curation, Writing – review & editing. MV: Conceptualization, Funding acquisition, Methodology, Project administration, Resources, Supervision, Validation, Visualization, Writing – review & editing.
Funding
The author(s) declare that financial support was received for the research and/or publication of this article. JN received support from The Brazilian Council for Scientific and Technological Development (CNPq Grant no. 142215/2019-8) and the Chagas Filho Foundation for Research Support of the State of Rio de Janeiro (Grants no. E-26/202.356/2022 and E-26/200.366/2024). MMV received support from the National Council for Scientific and Technological Development (CNPq PQ Grant no. 304908/2021-5) and the Chagas Filho Foundation for Research Support of the State of Rio de Janeiro (Grant no. E-26/202.647/2019). This study was developed in the context of the National Institute for Science and Technology in Ecology, Evolution and Conservation of Biodiversity (INCT EECBio, CNPq Grant no. 465610|2014-5, FAPEG 201810267000023) and the Brazilian Network on Global Climate Change Research (Rede CLIMA) (FINEP Grant no. 01.13.0353-00).
Conflict of interest
The authors declare that the research was conducted in the absence of any commercial or financial relationships that could be construed as a potential conflict of interest.
Generative AI statement
The author(s) declare that no Generative AI was used in the creation of this manuscript.
Publisher’s note
All claims expressed in this article are solely those of the authors and do not necessarily represent those of their affiliated organizations, or those of the publisher, the editors and the reviewers. Any product that may be evaluated in this article, or claim that may be made by its manufacturer, is not guaranteed or endorsed by the publisher.
Supplementary material
The Supplementary Material for this article can be found online at: https://www.frontiersin.org/articles/10.3389/fevo.2025.1536445/full#supplementary-material
Footnotes
- ^ https://www.br.undp.org
- ^ https://julianiemeyer.users.earthengine.app/view/risksfen
- ^ https://queimadas.dgi.inpe.br/queimadas/portal
- ^ https://julianiemeyer.users.earthengine.app/view/risksfen
References
Adger W. N., Barnett J., Brown K., Marshall N., and O’Brien K. (2013). Cultural dimensions of climate change impacts and adaptation. Nat. Clim Change 3, 112–117. doi: 10.1038/NCLIMATE1666
Álmagro A., Oliveira P. T. S., Rosolem R., Hagemann S., and Nobre C. A. (2020). Performance evaluation of Eta/HadGEM2-ES and Eta/MIROC5 precipitation simulations over Brazil. Atmospheric Res. 244, 105053. doi: 10.1016/j.atmosres.2020.105053
Alves P. B. R., Rufino I. A. A., Feitosa P. H. C., Djordjević S., and Javadi A. (2020). Land-use and legislation-based methodology for the implementation of sustainable drainage systems in the semi-arid region of Brazil. Sustainability 12, 661. doi: 10.3390/su12020661
Alves da Silva Rosa L., Morais M., and Saito C. H. (2021). Water security and river basin revitalization of the são francisco river basin: A symbiotic relationship. Water 13, 907. doi: 10.3390/w13070907
Alves-Pinto H. N., Cordeiro C. L., Geldmann J., Jonas H. D., Gaiarsa M. P., Balmford A., et al. (2022). The role of different governance regimes in reducing native vegetation conversion and promoting regrowth in the Brazilian Amazon. Biol. Conserv. 267, 109473. doi: 10.1016/j.biocon.2022.109473
Assad L. T., Aldeanueva C. M., Curi M., and Litre G. (2016). Do combate à seca à convivência com o Semiárido: Novos caminhos à procura da sustentabilidade. Cadernos Linguagem e Sociedade 7, 7–21. doi: 10.18472/SustDeb.v7nEsp.2016.21522
Avila-Diaz A., Abrahão G., Justino F., Torres R., and Wilson A.. (2020). Extreme climate indices in Brazil: evaluation of downscaled earth system models at high horizontal resolution. Clim Dyn 54, 5065–5088. doi: 10.1007/s00382-020-05272-9
Bettencourt P., Fulgêncio C., Grade M., Alcobia S., Monteiro J. P., Oliveira R., et al. (2016). Plano de recursos hídricos da bacia hidrográfica do rio São Francisco. Recursos Hídricos 37, 73–80. doi: 10.5894/rh37n1-cti3
Borges F. J. A. and Loyola R. (2020). Climate and land-use change refugia for Brazilian Cerrado birds. Perspect. Ecol. Conserv. 18, 109–115. doi: 10.1016/j.pecon.2020.04.002
Bourne A., Holness S., Holden P., Scorgie S., Donatti C. I., and Midgley G. (2016). A socio-ecological approach for identifying and contextualizing spatial ecosystem-based adaptation priorities at the sub-national level. PloS One 11, e0155235. doi: 10.1371/journal.pone.0155235
Bragagnolo C., Vieira F. A. S., Correia R. A., Malhado A. C. M., and Ladle R. J. (2017). “Cultural Services in the Caatinga,” in Caatinga. Eds. Silva J. M. C., Leal I. R., and Tabarelli M. (Springer, Cham). doi: 10.1007/978-3-319-68339-3_12
Brandon C., Kratzer B., Aggarwal A., and Heubaum. H. (2025). Strengthening the investment case for climate adaptation: A triple dividend approach (Washington, DC: World Resources Institute). Working Paper. doi: 10.46830/wriwp.25.00019
Brasil (2006). “Caderno da região hidrográfica do São Francisco,” in Ministério do Meio Ambiente. Secretaria de Recursos Hídricos (MMA, Brasília). Available online at: https://www.mma.gov.br/estruturas/161/_publicacao/161_publicacao03032011023538.pdf
Brazil (2021). “Ministry of Science, Technology and Innovations. Secretariat for Research and Scientific Training,” in Fourth National Communication of Brazil to the United Nations Framework Convention on Climate Change. (Ministry of Science, Technology and Innovations, Brasília).
Cai X., Wang D., Zhu T., and Ringler C. (2009). Assessing the regional variability of GCM simulations. Geophys Res. Lett. 36, L02706. doi: 10.1029/2008GL036443
Casey E. (2001). Between geography and philosophy: what does it mean to be in the place-world? Ann. Assoc. Am. Geographers - Ann. ASSN AMER Geogr. 91, 683–693. doi: 10.1111/0004-5608.00266
Castellanos E., Lemos M. F., Astigarra L., Postigo C. J., Chacón N., Cuvi N., et al. (2022). “Chapter 12: central and south america,” in Climate Change 2022: Impacts, Adaptation, and Vulnerability. Contribution of Working Group II to the Sixth Assessment Report of the Intergovernmental Panel on Climate Change (Cambridge University Press, Cambridge, UK and New York, NY, USA), 1689–1816. doi: 10.1017/9781009325844.014
CNUC/MMA (2022). Unidades de Conservação por Bioma. Brazil. Available online at: https://www.mma.gov.br/areasprotegidas/cadastro-Nacional-de-ucs.html
Colli G. R., Vieira C. R., and Dianese J. C. (2020). Biodiversity and conservation of the Cerrado: recent advances and old challenges. Biodivers Conserv. 29, 1465–1475. doi: 10.1007/s10531-020-01967-x
Colls A., Ash N., and Ikkala N. (2009). Ecosystem-based Adaptation: A natural response to climate change (Gland, Switzerland: IUCN), 16.
Costanza R., De Groot R., Braat L., Kubiszewski I., Fioramonti L., Sutton P., et al. (2017). Twenty years of ecosystem services: how far have we come and how far do we still need to go? Ecosyst. Serv. 28, 1–16. doi: 10.1016/j.ecoser.2017.09.008
Damasco F. and Antunes M. (2020). Encontro de geografias no mapeamento censitário de localidades indígenas e quilombolas. Rev. Bras. Geog 65, 2–24. doi: 10.21579/issn.2526-0375_2020_n2_2-24
da Silva J. M. C., Barbosa L. C. F., de Souza Pinto L. P., and Chennault C. M. (2017). “Sustainable development in the Caatinga,” in Caatinga (Springer, Cham), 445–458. doi: 10.1007/978-3-319-68339-3_1
da Silva J. M. C., Leal I. R., and Tabarelli M. (2018). Caatinga: the largest tropical dry forest region in South America. (Springer).
da Silva M. V. M., Silveira C., Costa J., Martins E. S. P. R., and Vasconcelos Júnior F. (2021). Projection of climate change and consumptive demands projections impacts on hydropower generation in the são francisco river basin, Brazil. Water 13, 332. doi: 10.3390/w13030332
de Jong P., Barreto T. B., Tanajura C. A., Kouloukoui D., Oliveira-Esquerre K. P., Kiperstok A., et al. (2019). Estimating the impact of climate change on wind and solar energy in Brazil using a South American regional climate model. Renew Energy 141, 390–401. doi: 10.1016/j.renene.2019.03.086
de Jong P., Tanajura C. A. S., Sánchez A. S., Dargaville R., Kiperstok A., and Torres E. A. (2018). Hydroelectric production from Brazil’s São Francisco River could cease due to climate change and inter-annual variability. Sci. Total Environ. 634, 1540–1553. doi: 10.1016/j.scitotenv.2018.03.256
de Oliveira G., Araújo M. B., Rangel T. F., Alagador D., and Diniz-Filho J. A. F. (2012). Conserving the Brazilian semiarid (Caatinga) biome under climate change. Biodiv Conserv. 21, 2913–2916. doi: 10.1007/s10531-012-0346-7
de Oliveria Braga L. R., MaChado M. M. M., and Ruchkys Ú.A. (2014). Modelagem de recursos da geodiversidade como suporte às práticas ritualísticas de comunidades de matriz africana/Modeling resources of geodiversity to support ritualistic practice of communities of African origin. Caderno Geografia 24, 233–248. doi: 10.5752/P.2318-2962.2014v24n42p233
Duarte G. T., Ribeiro M. C., and Paglia A. P. (2016). Ecosystem services modeling as a tool for defining priority areas for conservation. PloS One 11, e0154573. doi: 10.1371/journal.pone.0154573
Englund O., Sparovek G., Berndes G., Freitas F., Ometto J. P., Oliveira P.V.D.C.E., et al. (2017). A new high-resolution nationwide aboveground carbon map for Brazil. Geo Geogr. Environ. 4, e00045. doi: 10.1002/geo2.45
Fernandes M. M., de Moura Fernandes M. R., Garcia J. R., Matricardi E. A. T., de Almeida A. Q., Pinto A. S., et al. (2020). Assessment of land use and land cover changes and valuation of carbon stocks in the Sergipe semiarid region, Brazil: 1992–2030. Land Use Policy 99, 104795. doi: 10.1016/j.landusepol.2020.104795
Fernandes M. M., de Moura Fernandes M. R., Garcia J. R., Matricardi E. A. T., de Souza Lima A. H., de Araújo Filho R. N., et al. (2021). Land use and land cover changes and carbon stock valuation in the São Francisco river basin, Brazil. Environ. Chall 5, 100247. doi: 10.1016/j.envc.2021.100247
Foden W. B., Young B. E., Akçakaya H. R., Garcia R. A., Hoffmann A. A., Stein B. A., et al. (2019). Climate change vulnerability assessment of species. Wiley Interdiscip. Reviews: Climate Change 551. doi: 10.1002/wcc.551
Forcella D., Moser R., and Gonzalez L. (2015). Rural Microfinance and Climate Change: Geographical Credits Allocation and Vulnerability (An Analysis of Agroamigo in Brazil’s Northeastern States). doi: 10.2139/ssrn.2599056
Garcia K. C., Mollica A., de Matos D. F., and da Paz L. R. L. (2019). “Sustainable Hydropower: Using Ecosystem-based Adaptation to Increase Local Adaptation Capacity in Brazil,” in Handbook of Climate Change and Biodiversity (Springer, Cham), 167–178. doi: 10.1007/978-3-319-98681-4_10
Gomes L. C., Faria R. M., de Souza E., Veloso G. V., Schaefer C. E. G., and Fernandes Filho E. I. (2019). Modeling and mapping soil organic carbon stocks in Brazil. Geoderma 340, 337–350. doi: 10.1016/j.geoderma.2019.01.007
Gorayeb A., Brannstrom C., de Andrade Meireles A. J., and de Sousa Mendes J. (2018). Wind power gone bad: Critiquing wind power planning processes in northeastern Brazil. ERSS 40, 82–88. doi: 10.1016/j.erss.2017.11.027
Hernández-Morcillo M., Plieninger T., and Bieling C. (2013). An empirical review of cultural ecosystem service indicators. Ecol. Indic. 29, 434–444. doi: 10.1016/j.ecolind.2013.01.013
Holanda F. S. R., Ismerim S. S., Rocha I. P. D., Jesus A. S. D., Filho R. N. D. A., and Júnior A. V. D. M. (2009). Environmental perception of the São Francisco riverine population in regards to flood impact. J. Hum. Ecol. 28, 37–46. doi: 10.1080/09709274.2009.11906216
Holanda F. S. R., Santos L. G. D. C., Santos C. M. D., Casado A. P. B., Pedrotti A., and Ribeiro G. T. (2005). Riparian vegetation affected by bank erosion in the Lower São Francisco River, Northeastern Brazil. Rev. Árvore 29, 327–336. doi: 10.1590/S0100-67622005000200016
IBGE – Instituto Brasileiro de Geografia e Estatística (2020). Base de Informações Geográficas e Estatísticas sobre os indígenas e quilombolas 2019 – Notas Técnicas (Rio de Janeiro).
IBGE – Instituto Brasileiro de Geografia e Estatística (2021). Diretoria de Pesquisas - DPE - Coordenação de População e Indicadores Sociais – COPIS. Estimativas da População Residente no Brasil e Unidades da Federação com Data de Referência em 1° de Julho de 2021. Brazil. Available online at: https://www.ibge.gov.br/
IPBES (2018). The IPBES regional assessment report on biodiversity and ecosystem services for the Americas. Secretariat of the Intergovernmental Science-Policy Platform on Biodiversity and Ecosystem Services. Eds. Rice J., Seixas C. S., Zaccagnini M. E., Bedoya-Gaitán M., and Valderrama N. (Bonn, Germany), 656.
IPBES (2020). Workshop Report on Biodiversity and Pandemics of the Intergovernmental Platform on Biodiversity and Ecosystem Services. Eds. Daszak P., Amuasi J., das Neves C. G., Hayman D., Kuiken T., Roche B., Zambrana-Torrelio C., Buss P., Dundarova H., Feferholtz Y., Földvári G., Igbinosa E., Junglen S., Liu Q., Suzan G., Uhart M., Wannous C., Woolaston K., Mosig Reidl P., O’Brien K., Pascual U., Stoett P., Li H., and Ngo H. T. (Bonn, Germany: IPBES secretariat). doi: 10.5281/zenodo.4147317
IPCC (2014). “Summary for policymakers,” in Climate Change 2014: Impacts, Adaptation, and Vulnerability. Part A: Global and Sectoral Aspects. Contribution of Working Group II to the Fifth Assessment Report of the Intergovernmental Panel on Climate Change. Eds. Field C. B., Barros V. R., Dokken D. J., Mach K. J., Mastrandrea M. D., Bilir T. E., Chatterjee M., Ebi K. L., Estrada Y. O., Genova R. C., Girma B., Kissel E. S., Levy A. N., MacCracken S., Mastrandrea P. R., and White L. L. (Cambridge University Press, Cambridge, United Kingdom and New York, NY, USA), 1–32.
IPCC (2018). “Annex I: Glossary,” in Global Warming of 1.5°C. An IPCC Special Report on the impacts of global warming of 1.5°C above pre-industrial levels and related global greenhouse gas emission pathways, in the context of strengthening the global response to the threat of climate change, sustainable development, and efforts to eradicate poverty. Eds. Matthews J. B. R., Masson-Delmotte V., Zhai P., Pörtner H.-O., Roberts D., Skea J., Shukla P. R., Pirani A., Moufouma-Okia W., Péan C., Pidcock R., Connors S., Matthews J. B. R., Chen Y., Zhou X., Gomis M. I., Lonnoy E., Maycock T., Tignor M., and Waterfield T. (Cambridge University Press, Cambridge, UK and New York, NY, USA), 541–562. doi: 10.1017/9781009157940.008
IPCC (2021). “Summary for Policymakers,” in Climate Change 2021: The Physical Science Basis. Contribution of Working Group I to the Sixth Assessment Report of the Intergovernmental Panel on Climate Change. Eds. Masson-Delmotte V., Zhai P., Pirani A., Connors S. L., Péan C., Berger S., Caud N., Chen Y., Goldfarb L., Gomis M. I., Huang M., Leitzell K., Lonnoy E., Matthews J. B. R., Maycock T. K., Waterfield T., Yelekçi O., Yu R., and Zhou B. (Cambridge University Press, Cambridge, UK and New York, NY, USA), 3–32. doi: 10.1017/9781009157896.001
IPEA (2016). Atlas da vulnerabilidade social nos municípios brasileiros. Eds. Costa M. A. and Marguti B. O. ( Brasília). Available online at: http://repositorio.ipea.gov.br/handle/11058/4381
IPEA (2019). Revitalização da bacia hidrográfica do rio São Francisco: histórico, diagnóstico e desafios. Eds. Castro CésarN. de and Pereira C. N. ( Brasília), 366. Available online at: http://repositorio.ipea.gov.br/bitstream/11058/9351/1/Revitalizacao%20da%20bacia%20hidrografica%20%20do%20rio%20s%C3%A3o%20francisco.pdf
IUCN (2017). Issues briefs: Ecosystem-based adaptation. Available online at: https://iucn.org/issues-briefs
Jenkins C. N., Alves M. A. S., Uezu A., and Vale M. M. (2015). Patterns of Vertebrate diversity and protection in Brazil. PloS One 10, e0145064. doi: 10.1371/journal.pone.0145064
Kareiva P. (Ed.). (2011). Natural capital: theory and practice of mapping ecosystem services. Oxford University Press.
Kasecker T. P., Ramos-Neto M. B., da Silva J. M. C., and Scarano F. R. (2018). Ecosystem-based adaptation to climate change: defining hotspot municipalities for policy design and implementation in Brazil. Mitig Adapt Strateg Glob Change 23, 981–993. doi: 10.1007/s11027-017-9768-6
Lima M., do Vale J. C. E., de Medeiros Costa G., dos Santos R. C., Correia Filho W. L. F., Gois G., et al. (2020). The forests in the indigenous lands in Brazil in peril. Land Use Policy 90, 104258. doi: 10.1016/j.landusepol.2019.104258
Lucas M. C., Kublik N., Rodrigues D. B. B., Meira Neto A. A., Almagro A., Melo D., et al. (2021). Significant baseflow reduction in the sao francisco river basin. Water 13, 2. doi: 10.3390/w13010002
Manes S., Vale M. M., Malecha A., and Pires A. P. (2022b). Nature-based solutions promote climate change adaptation safeguarding ecosystem services. Ecosyst. Serv. 55, 101439. doi: 10.1016/j.ecoser.2022.101439
Manes S., Vale M. M., and Pires A. P. F. (2022a). The effectiveness of climate action and land recovery across ecosystems, climatic zones and scales. Reg. Environ. Change 22, 5. doi: 10.1007/s10113-021-01866-z
Manhães A. P., Mazzochini G. G., Oliveira-Filho A. T., Ganade G., and Carvalho A. R. (2016). Spatial associations of ecosystem services and biodiversity as a baseline for systematic conservation planning. Divers. Distrib 22, 932–943. doi: 10.1111/ddi.12459
Mapbiomas Project (2022a). Mapeamento Anual de Cobertura e Uso da Terra do Brasil - Coleção 6. Available online at: https://mapbiomas-br-site.s3.amazonaws.com/Fact_Sheet_PASTAGEM_13.10.2021_ok_ALTA.pdf
Mapbiomas Project (2022b). Bacia do São Francisco: dia nacional em defesa do rio São Francisco. Brazil, 11. Available online at: https://mapbiomas-br-site.s3.amazonaws.com/FSRioS%C3%A3oFrancisco_03062022_ok3.pdf
Marengo J. A., Alves L. M., Alvala R., Cunha A. P., Brito S., and Moraes O. L. (2018). Climatic characteristics of the 2010–2016 drought in the semiarid Northeast Brazil region. Anais da Academia Bras. Ciências 90, 1973–1985. doi: 10.1590/0001-3765201720170206
Marengo J. A., Chou S. C., Kay G., Alves L. M., Pesquero J. F., Soares W. R., et al. (2012). Development of regional future climate change scenarios in South America using the Eta CPTEC/HadCM3 climate change projections: climatology and regional analyses for the Amazon, São Francisco and the Paraná River basins. Climate Dynamics 38, 1829–1848. doi: 10.1007/s00382-011-1155-5
Marengo J. A., Cunha A. P., Soares W. R., Torres R. R., Alves L. M., de Barros Brito S. S., et al. (2019). “Increase risk of drought in the semiarid lands of Northeast Brazil due to regional warming above 4°C,” in Climate Change Risks in BRAZIL. Eds. Nobre C., Marengo J., and Soares W. (Springer, Cham). doi: 10.1007/978-3-319-92881-4_7
Milhorance C., Mendes P., Mesquita P., Morimura M., Reis R., Rodrigues Filho S., et al. (2019). O desafio da integração de políticas públicas para a adaptação às mudanças climáticas no semiárido brasileiro. Rev. Bras. Climatol 24. doi: 10.5380/abclima.v24i0.56484
MMA (2006). Caderno da Região Hidrográfica do São Francisco/Ministério do Meio Ambiente, Secretaria de Recursos Hídricos (Brasília: MMA). Available online at: https://www.mma.gov.br
MMA (2016). Plano Nacional de Adaptação. Available online at: http://www.mma.gov.br/clima/adaptacao/plano-nacional-deadaptacao
MMA (2017). Atualização e complementação do diagnóstico do Macrozoneamento Ecológico-Econômico da Bacia Hidrográfica do Rio São Francisco. Brazil. Available online at: http://www.mma.gov.br/gestao-territorial/zoneamento-territorial/macrozee-da-bacia-do-são-francisco
Moulin G., Esteves B., Carnevalli F., Torres J., Bertelli M., Cançado W., et al. (2021). Seres-rios: São Francisco, jequitinhonha, doce (Belo Horizonte: BDMG Cultural).
Niemeyer J., Barros F. S., Silva D. S., Crouzeilles R., and Vale M. M. (2020). Planning forest restoration within private land holdings with conservation co-benefits at the landscape scale. Sci. Total Environ. 717, 135262. doi: 10.3390/rs13193921
Niemeyer J. and Vale M. M. (2022). Obstacles and opportunities for implementing a policy-mix for ecosystem-based adaptation to climate change in Brazil’s Caatinga. Land Use Policy 122, 106385. doi: 10.1016/j.landusepol.2022.106385
Paredes-Trejo F., Barbosa H. A., Giovannettone J., Kumar T. L., Thakur M. K., Buriti C. D.O., et al. (2022). Drought assessment in the São Francisco River Basin using satellite-based and ground-based indices. Remote Sens. 13 (19), 3921.
Parmesan C., Morecroft M. D., Trisurat Y., Adrian R., Anshari G. Z., Arneth A., et al. (2022). Terrestrial and Freshwater Ecosystems and Their Services. In Pörtner H.-O., D. C., Tignor M., Poloczanska E. S., Mintenbeck K., Alegría A., et al (Eds.), Climate Change 2022: Impacts, Adaptation and Vulnerability. Contribution of Working Group II to the Sixth Assessment Report of the Intergovernmental Panel on Climate Change (pp. 197–303). Cambridge, UK and New York, NY: Cambridge University Press.
Pires A. P., Amaral A. G., Padgurschi M. C., Joly C. A., and Scarano F. R. (2018). Biodiversity research still falls short of creating links with ecosystem services and human well-being in a global hotspot. Ecosystem Serv. 34, 68–73. doi: 10.1016/j.ecoser.2018.10.001
Pires A. P., Shimamoto C. Y., Padgurschi M. C., Scarano F. R., and Marques M. C. (2021). “Atlantic Forest: ecosystem services linking people and biodiversity,” in The Atlantic Forest. Eds. Marques M. C. M. and Grelle C. E. V. (Springer, Cham), 347–367. doi: 10.1007/978-3-030-55322-7_16
PNUD/IPEA/FJP (2020). Atlas do Desenvolvimento Humano no Brasil (Pnud Brasil: Ipea e FJP). Available onine at: http://atlasbrasil.org.br/acervo/biblioteca
Pörtner H. O., Roberts D. C., Adams H., Adler C., Aldunce P., Ali E., et al. (2022). “Summary for Policy Makers,” in Climate change 2022: impacts, adaptation and vulnerability (IPCC, UN).
Resende F. M., Cimon-Morin J., Poulin M., Meyer L., Joner D. C., and Loyola R. (2021). The importance of protected areas and Indigenous lands in securing ecosystem services and biodiversity in the Cerrado. Ecosystem Serv. 49, 101282. doi: 10.1016/j.ecoser.2021.101282
Resende F. M., Cimon-Morin J., Poulin M., Meyer L., and Loyola R. (2019). Consequences of delaying actions for safeguarding ecosystem services in the Brazilian Cerrado. Biol. Conserv. 234, 90–99. doi: 10.1016/j.biocon.2019.03.009
Ribeiro B. R., Sales L. P., De Marco P. Jr., and Loyola R. (2016). Assessing mammal exposure to climate change in the Brazilian amazon. PloS One 11, e0165073. doi: 10.1371/journal.pone.0165073
Scarano F. R. (2017). Ecosystem-based adaptation to climate change: concept, scalability and a role for conservation science. Perspectiv Ecol. Conserv. 15, 65–73. doi: 10.1016/j.pecon.2017.05.003
Secretariat of the Convention on Biological Diversity (2009). Connecting Biodiversity and Climate Change Mitigation and Adaptation: Report of the Second Ad Hoc Technical Expert Group on Biodiversity and Climate Change (Montreal).
Selfa T., Marini V., and Abrams J. B. (2021). Place attachment and perceptions of land-use change: cultural ecosystem services impacts of eucalyptus plantation expansion in Ubajay, Entre Ríos, Argentina. Ecol. Soc. 26, 44. doi: 10.5751/ES-12870-260444
Shah S. I. A., Zhou J., and Shah A. A. (2019). Ecosystem-based Adaptation (EbA) practices in smallholder agriculture; emerging evidence from rural Pakistan. J. cleaner production 218, 673–684. doi: 10.1016/j.jclepro.2019.02.028
Sharp R., Tallis H. T., Ricketts T., Guerry A. D., et al. (2018). InVEST+VERSION+ User’s guide. The natural capital project, stanford university, university of minnesota, the nature conservancy, and world wildlife fund.
Soares-Filho B., Lima L. S., Hissa L. V., Costa W. L., Rodrigues H. O., Ferreira B. M., et al. (2013). OTIMIZAGRO: Uma Plataforma Integrada de Modelagem de Uso e Mudanças no Uso da Terra para o Brasil. Final report. Belo Horizonte (MG): Centro de Sensoriamento Remoto, Universidade Federal de Minas Gerais; 2013 Jun. Report No.: 978-85-61968-04-5. Sponsored by the Secretaria de Assuntos Estratégicos da Presidência do Brasil.
Soares-Filho B., Rajão R., Merry F., Rodrigues H., Davis J., Lima L., et al. (2016). Brazil’s market for trading forest certificates. PloS One 11, e0152311. doi: 10.1371/journal.pone.0152311
Tabarelli M., Leal I. R., Scarano F. R., and da Silva J. M. C. (2017). “The future of the caatinga,” in Caatinga (Springer, Cham), 461–474. doi: 10.1007/978-3-319-68339-3_10
Thomas K., Hardy R. D., Lazrus H., Mendez M., Orlove B., Rivera-Collazo I., et al. (2019). Explaining differential vulnerability to climate change: A social science review. Wiley Interdiscip. Rev. Clim. Change. 10 (2), e565.
Torres R. R., Lapola D. M., Marengo J. A., and Lombardo M. A.. (2012). Socio-climatic hotspots in Brazil. Climatic Change 115, 597–609. doi: 10.1007/s10584-012-0461-1
United Nations Environment Programme (UNEP) (2021). Adaptation Gap Report 2021: The gathering storm – Adapting to climate change in a post-pandemic world. Nairobi. Available at: https://www.unep.org/resources/adaptation-gap-report-2021.
UNFCCC (United Nations Framework Convention on Climate Change) (2024). Non-Economic Losses – Featuring loss of territory and habitability, ecosystem services and biodiversity, and cultural heritage. [Technical paper].
Vale M. M., Arias P. A., Ortega G., Cardoso M., Oliveira B. F., Loyola R., et al. (2021). “Climate change and biodiversity in the Atlantic Forest: best climatic models, predicted changes and impacts, and adaptation options,” in The Atlantic Forest. Eds. Marques M. C. M. and Grelle C. E. V. (Springer, Cham), 253–267. doi: 10.1007/978-3-030-55322-7_12
Vale M. M., Vieira M. V., Grelle C. E. V., Manes S., Pires A. P., Tardin R. H., et al. (2023). Ecosystem services delivered by Brazilian mammals: spatial and taxonomic patterns and comprehensive list of species. Perspect. Ecol. Conserv. 21, 302–310. doi: 10.1016/j.pecon.2023.10.003
Velazco S. J. E., Villalobos F., Galvão F., and De Marco Júnior P. (2019). A dark scenario for Cerrado plant species: Effects of future climate, land use and protected areas ineffectiveness. Divers. Distrib 25, 660–673. doi: 10.1111/ddi.12886
Viegas L. M. D., Sales L., Hipólito J., Amorim C., de Pereira E. J., Ferreira P., et al. (2022). We’re building it up to burn it down: fire occurrence and fire-related climatic patterns in Brazilian biomes. PeerJ 10, e14276. doi: 10.7717/peerj.14276
Vieira R. M. D., Tomasella J., Barbosa A. A., Martins M. A., Rodriguez D. A., Rezende F. S., et al. (2020). Desertification risk assessment in Northeast Brazil: Current trends and future scenarios. Land Degradation Dev. 32, 224–240. doi: 10.1002/ldr.3681
Williams J. W., Jackson S. T., and Kutzbach J. E. (2007). Projected distributions of novel and disappearing climates by 2100 AD. Proc. Natl. Acad. Sci. 104, 5738–5742. doi: 10.1073/pnas.0606292104
Yang S., Zhao W., Liu Y., Wang S., Wang J., and Zhai R. (2018). Influence of land use change on the ecosystem service trade-offs in the ecological restoration area: Dynamics and scenarios in the Yanhe watershed, China. Sci. Total Environ. 644, 556–566. doi: 10.1016/j.scitotenv.2018.06.348
Keywords: climate change, land use change, conservation, ecosystem-based adaptation, Rio São Francisco, Brazilian semi-arid, Caatinga
Citation: Niemeyer J, Resende FM, Moura Lima E and Vale MM (2025) Risk and adaptation of socio-ecological systems to global change in the dry forests of Northeastern South America. Front. Ecol. Evol. 13:1536445. doi: 10.3389/fevo.2025.1536445
Received: 28 November 2024; Accepted: 11 June 2025;
Published: 01 July 2025.
Edited by:
Ajay Sharma, Auburn University, United StatesReviewed by:
Miguel Alfonso Ortega-Huerta, National Autonomous University of Mexico, MexicoRen Cao, Auburn University, United States
Copyright © 2025 Niemeyer, Resende, Moura Lima and Vale. This is an open-access article distributed under the terms of the Creative Commons Attribution License (CC BY). The use, distribution or reproduction in other forums is permitted, provided the original author(s) and the copyright owner(s) are credited and that the original publication in this journal is cited, in accordance with accepted academic practice. No use, distribution or reproduction is permitted which does not comply with these terms.
*Correspondence: Julia Niemeyer, anVsaWEubmllbWV5ZXJAZ21haWwuY29t