 Zongzhu Chen1,2
 Xiaorong Jiang3*Xiaoyan Pan1,2Yiqing Chen1,2Jinrui Lei1,2Tingtian Wu1,2Xiaohua Chen1,2Yuanling Li1,2
 Tiezhu Shi4*
- 1Hainan Academy of Forestry, Haikou, China
- 2Key Laboratory of Tropical Forestry Resources Monitoring and Application of Hainan Province, Haikou, China
- 3College of Resources Environment and Tourism, Hubei University of Arts and Science, Xiangyang, China
- 4School of Architecture and Urban Planning, Shenzhen University, Shenzen, China
Background: Protected areas like national parks play a pivotal role in carbon sequestration, a function essential for achieving global climate mitigation goals as climate change accelerates. However, a significant challenge lies in reconciling conservation mandates with pressures for economic growth within these regions.
Methods: The present study addresses this issue by investigating China’s Hainan Tropical Rainforest National Park (HNTRNP). By integrating 10 natural and socioeconomic variables, we applied the PLUS-InVEST model to quantify historical carbon stock dynamics from 1980 to 2020 and to project future storage capacities for 2035 under various development pathways.
Results: Our results demonstrate that: (1) In the last forty years, there has been a notable rise in forest area alongside a reduction in grassland and arable land. This shift has led to a pattern of carbon storage characterized by an initial decline of 0.65 Tg between 1980 and 2010, succeeded by a swift expansion during the period 2010–2020; (2) he geographic arrangement of carbon stocks has been largely stable, except for marked variations observed in the eastern high-altitude regions, namely Bawangling, Yinggeling, Wuzhishan, and Diaoluoshan; (3) Ecological protection policies effectively curb built land expansion and enhance carbon sequestration. By 2035, carbon storage under the ecological protection (EP) scenario is projected to reach 110.85 Tg, 1.28 Tg (1.17%) higher than the natural development (ND) scenario and 1.64 Tg (1.50%) higher than the tourism development (TD) scenario.
Conclusion: Ultimately, this study informs future land management and conservation efforts within HNTRNP by demonstrating that sustainable socioeconomic development must be synthesized with robust ecological protection.
1 Introduction
As the specter of global climate change looms large, the terrestrial biosphere’s potential to sequester carbon has emerged as a pivotal subject of scientific inquiry and a fundamental aspect of environmental policy (Goldstein et al., 2020; Ariluoma et al., 2021). As a cornerstone of its sustainable development policy, China’s 2020 “dual-carbon” initiative targets a 2030 carbon peak and 2060 carbon neutrality by simultaneously cutting anthropogenic emissions and boosting ecological carbon sinks. As a pivotal component of this national strategy, the enhancement of ecosystems’ carbon storage and sequestration capacities has emerged as a critical focus for policymakers and researchers globally (Zhong et al., 2023; Yu et al., 2023). Among Earth’s ecosystems, tropical rainforests, with their vast biomass, stand out for their exceptional capability to sequester carbon, a trait that is unmatched by any other biome (Cuni-Sanchez et al., 2021; Li et al., 2022). HNTRNP epitomizes this uniqueness, representing China’s most concentrated, diverse, pristine, and expansive continental tropical island rainforest. Additionally, HNTRNP functions as the ecological cornerstone of Hainan Island, safeguarding regional climate stability and water security through its intact forest canopy and soil carbon stocks. As a national biodiversity flagship with global significance for tropical forest conservation, this ecosystem serves an irreplaceable function in maintaining regional ecological balance and mitigating climate change (Chang et al., 2022). Consequently, it is of paramount practical importance to scrutinize the spatiotemporal dynamics of regional carbon reserves as influenced by land use transformations. It is equally crucial to forecast future carbon storage capacities and their spatial distributions under various development scenarios (Fan et al., 2023; Zhang Y. et al., 2024).
The intricate relationship between land-use alterations and carbon sequestration is a focal point of contemporary environmental science, particularly in the discourse surrounding climate change mitigation (Chang et al., 2022; Huang et al., 2023). Anthropogenic and natural-induced shifts in land cover and usage patterns have a profound bearing on the capacity of tropical rainforest ecosystems like HNTRNP to act as carbon sinks or sources. Unlike temperate forests, which experience seasonal fluctuations in productivity, the year-round warm and humid climate of HNTRNP supports continuous vegetation growth, enhancing its role as a carbon sink. However, this characteristic also makes it highly susceptible to abrupt land-use changes, such as deforestation for infrastructure development (Yue et al., 2020; Guo et al., 2024). The pursuit of global carbon neutrality (Liu et al., 2024) necessitates a thorough understanding of how land-use changes impact carbon sequestration. On a global scale, researchers have widely employed remote sensing and GIS technologies to quantify these effects on carbon stocks (Walker et al., 2022; Zhuang et al., 2022). Integrating comprehensive global land cover datasets, these efforts have delineated the carbon losses attributable to deforestation and land degradation, juxtaposed against the carbon gains from reforestation and afforestation initiatives (Mo et al., 2023). The effects of land-use change on carbon storage vary dramatically worldwide. While deforestation in critical areas like the Amazon and African lowland forests has released vast amounts of carbon (Heinrich et al., 2021; Cuni-Sanchez et al., 2021), afforestation in northern China has proven effective at enhancing carbon sinks (Qiu et al., 2020). However, the permanence of such gains is not guaranteed, as these carbon reservoirs remain susceptible to ongoing and future disturbances.
The methodologies for estimating carbon reserves have evolved from the traditional ground survey techniques to include remote sensing technologies and the integration of models. Although ground surveys offer higher precision, they are constrained in estimating carbon storage over large spatial extents (Zhang D. et al., 2023). Remote sensing methods are particularly well-suited for monitoring the aboveground biomass of specific ecosystems (Zhang et al., 2021). In contrast to these, model simulation methods have gained popularity due to their accessible data acquisition, ease of manipulation, and robust applicability across various scales of carbon storage research (Wang et al., 2022). Amidst a suite of models, the InVEST model distinguishes itself as a powerful tool for estimating carbon storage within a defined region for a specific timeframe, as well as for investigating carbon storage variations triggered by shifts in land use (He et al., 2016; Kusi et al., 2020; Bacani et al., 2024). This model is favored for its modest demand for input parameters, rapid computational speed, and the high precision of its assessments. In the realm of existing scholarly work, the InVEST model has been synergistically combined with a suite of land use simulation models, including CLUES-S (Sun et al., 2023), CA-Markov (Zhong et al., 2022), FLUS (Shao et al., 2023) and SD-CLUE-S (Zhang Z. et al., 2023). Yet, the existing models fall short in effectively discerning how policies influence and direct shifts in land use, and they find it challenging to nimbly model the patch-level dynamics across diverse land use categories. The PLUS model addresses the complexities of land use simulation by integrating a rule-mining framework for land use growth with a mechanism for stochastic patch initiation (Liang et al., 2021; Yin et al., 2024).
Despite the extensive research at broader scales, investigations into smaller, more localized scales, such as those within national parks, are less prevalent. These conserved areas, characterized by limited land-use alterations, harbor stable ecosystems that are instrumental in the sustenance and enhancement of carbon storage (Lama et al., 2024). The establishment of HNTRNP serves as a testament to the significance of such localized studies, enriching our understanding of carbon dynamics at the micro-scale. In the context of China’s ambitious goals to achieve carbon peak and carbon neutrality, this research aligns with the nation’s strategic objectives, offering a pathway to enhance the carbon sink function of protected areas. Despite the recognized importance of tropical rainforests for global carbon storage, a comprehensive, long-term quantitative assessment that links historical carbon dynamics with future conservation planning remains a critical research gap, particularly for vital protected areas like HNTRNP. To provide a scientific basis for conservation management in HNTRNP, this study undertakes a three-stage analysis. The research first quantifies four decades (1980–2020) of spatiotemporal carbon dynamics. It then develops a multi-criteria framework to identify high-priority conservation areas based on carbon storage and other key variables. Lastly, it models future (2035) carbon potential under ecological protection (EP), tourism development (TD), and natural development (ND) scenarios to evaluate the outcomes of different management pathways. The findings are expected to provide actionable insights for conservation policy-making in HNTRNP and offer a replicable methodology for other tropical forest ecosystems globally.
2 Data and methods
2.1 Study region
HNTRNP is located in central Hainan Island, extending from 18°33′16″ to 19°14′16″ N latitude and from 108°44′32″ to 110°04′43″ E longitude (Figure 1). It covers most of the eastern Wuzhi Mountain range and the western Limu Mountain range in the south-central region of Hainan Island, covering a total area of 4,269.32 km2. HNTRNP, piloted in 2019 and formally established in September 2021, represents the only “continental island-type” tropical rainforest at the confluence of Asia’s tropical rainforests and the global monsoon evergreen broad-leaved forest belt, acting as a bastion for China’s tropical biodiversity and genetic resources. The park’s boundaries, informed by geographical features such as mountain ranges and water systems, are integrated with national spatial planning, resulting in the delineation into seven distinct management zones: Wuzhishan, Diaoluoshan, Bawangling, Jianfengling, Limushan, Yinggeling, and Maorui. For management purposes, HNTRNP is divided into two distinct zones. The core conservation area, designated as the primary hotspot for tropical rainforests, spans 2,331 km² (54.6% of the park), while the general control area constitutes the surrounding 1,938 km² (45.4%). This zone serves as an expansion buffer for the tropical rainforest and the Hainan gibbon (Nomascus hainanus), while also functioning as a key region for the sustainable socioeconomic development of local communities. Additionally, the general control area is home to 129 natural villages, with a resident population of approximately 22,800 individuals as of 2020.
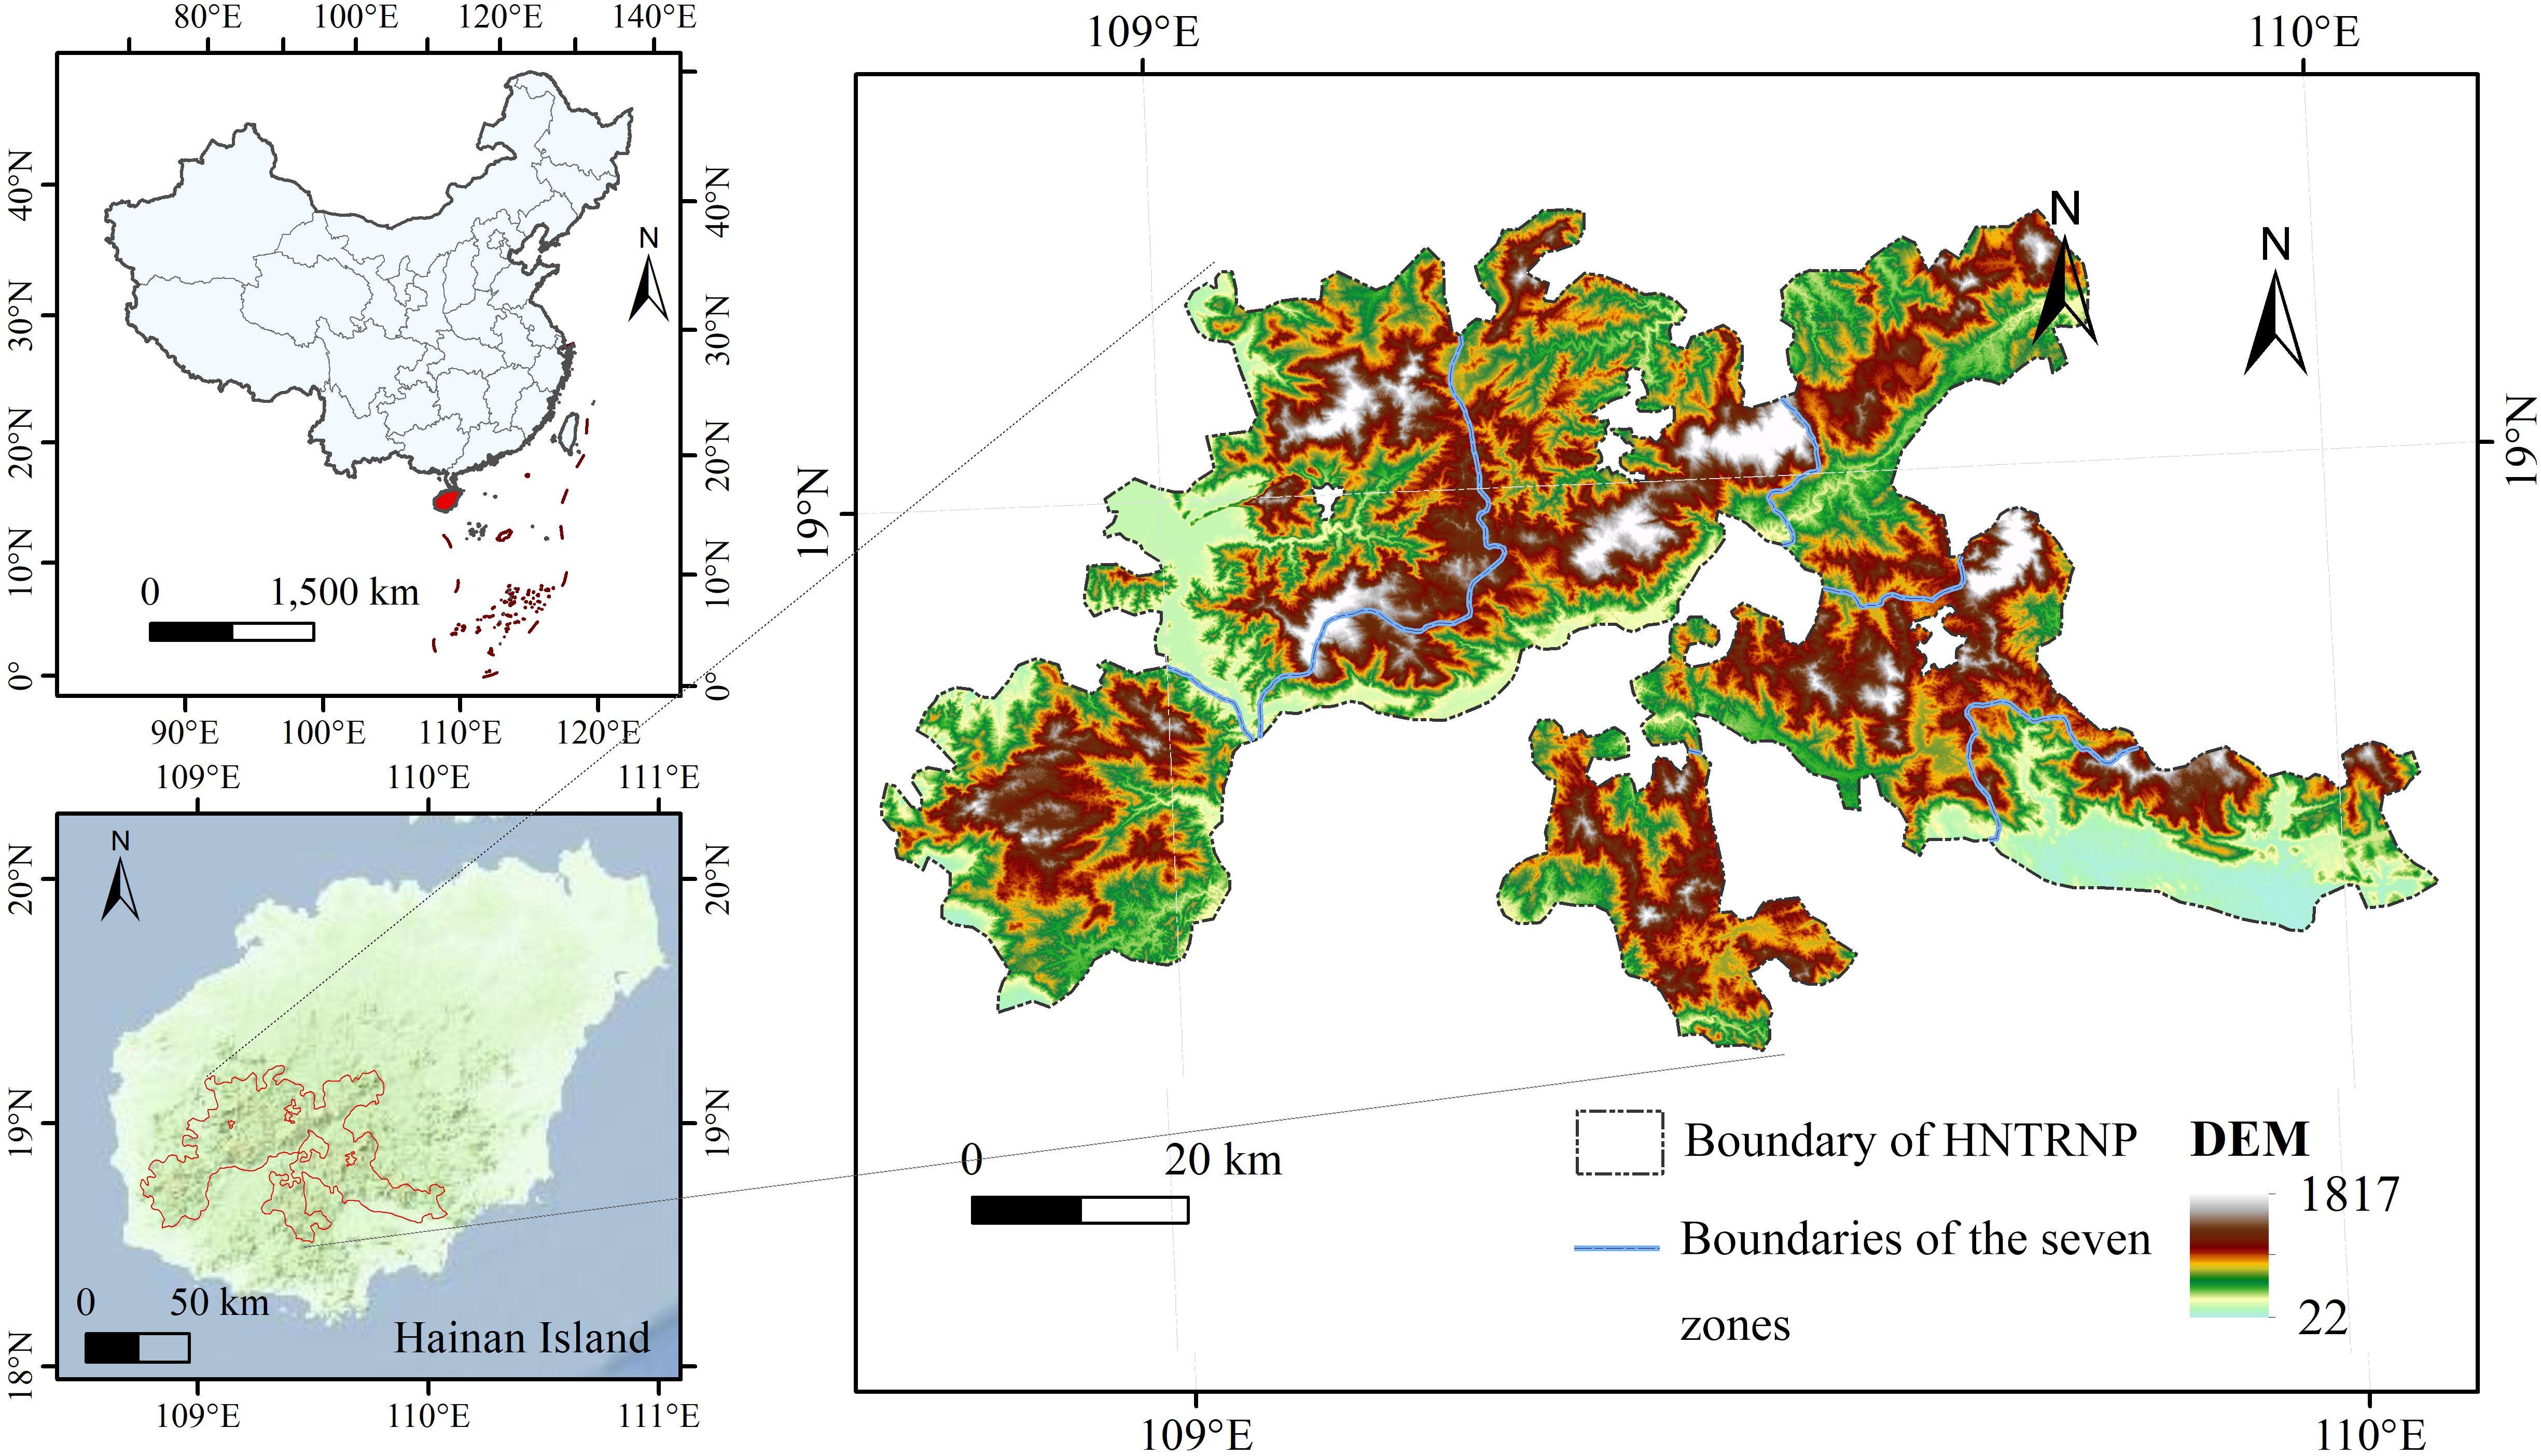
Figure 1. Location and topographical map of HNTRNP.
2.2 Data sources and research framework
The primary datasets for this study include vector boundaries and land use maps, details of which are provided in Table 1. Following the national standard (GB/T 21010-2007), the land use data were classified into six primary categories: cropland, forest, grassland, water bodies, built land, and unused land. The boundaries of the research area were established with reference to the “Master Plan for Hainan Tropical Rainforest National Park (2023-2030),” which delineates core protection and general control areas. For the PLUS model, we selected 10 natural and socioeconomic drivers based on two criteria: their established significance in land-use change studies (Wang S. et al., 2023) and the availability of consistent, long-term spatial data for the study area. These drivers collectively represent key natural constraints (e.g., DEM, slope, precipitation) and anthropogenic pressures (e.g., GDP, population, proximity to roads). Factors such as soil type were excluded due to the lack of high-resolution historical data, while policy intensity was not used as a historical driver as it is explicitly modeled within our three future scenarios. All driver datasets were preprocessed to a consistent 30m resolution and normalized within the PLUS model.
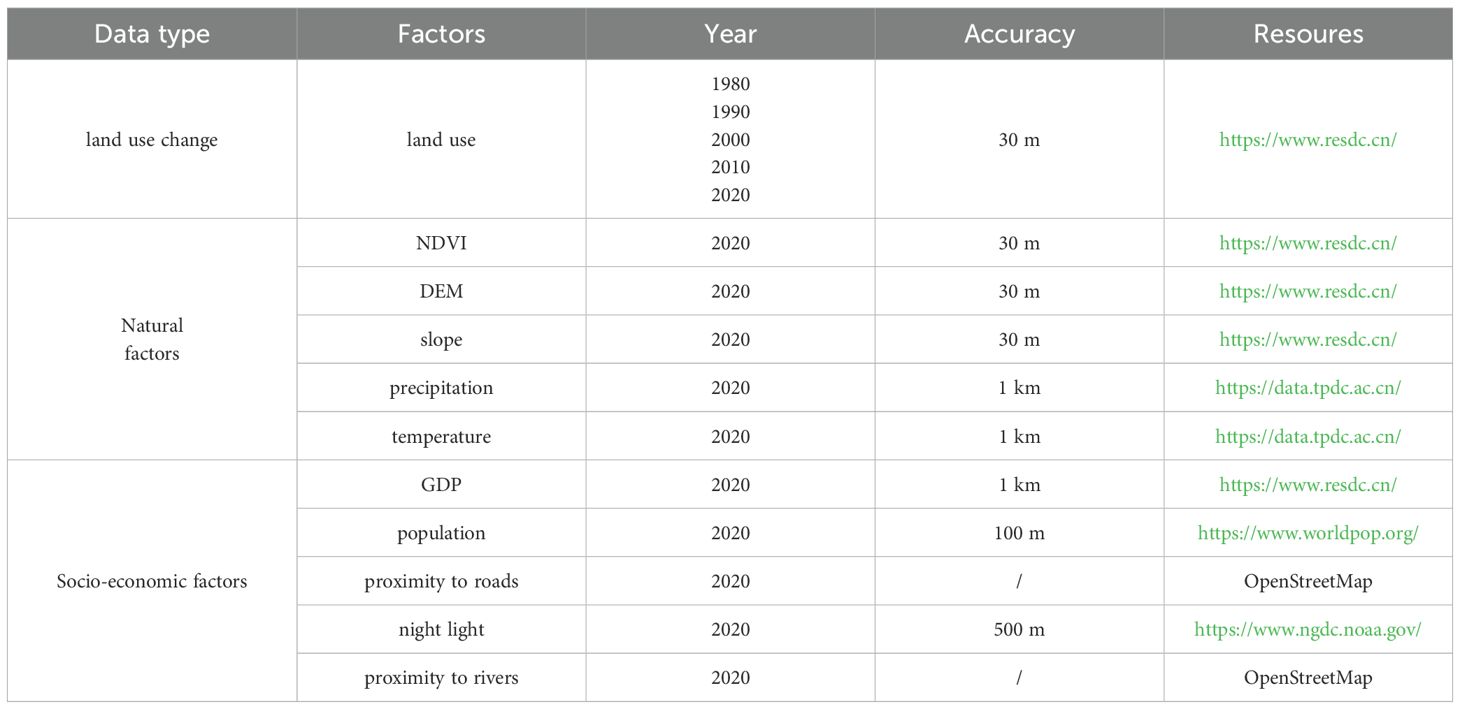
Table 1. Description of the data.
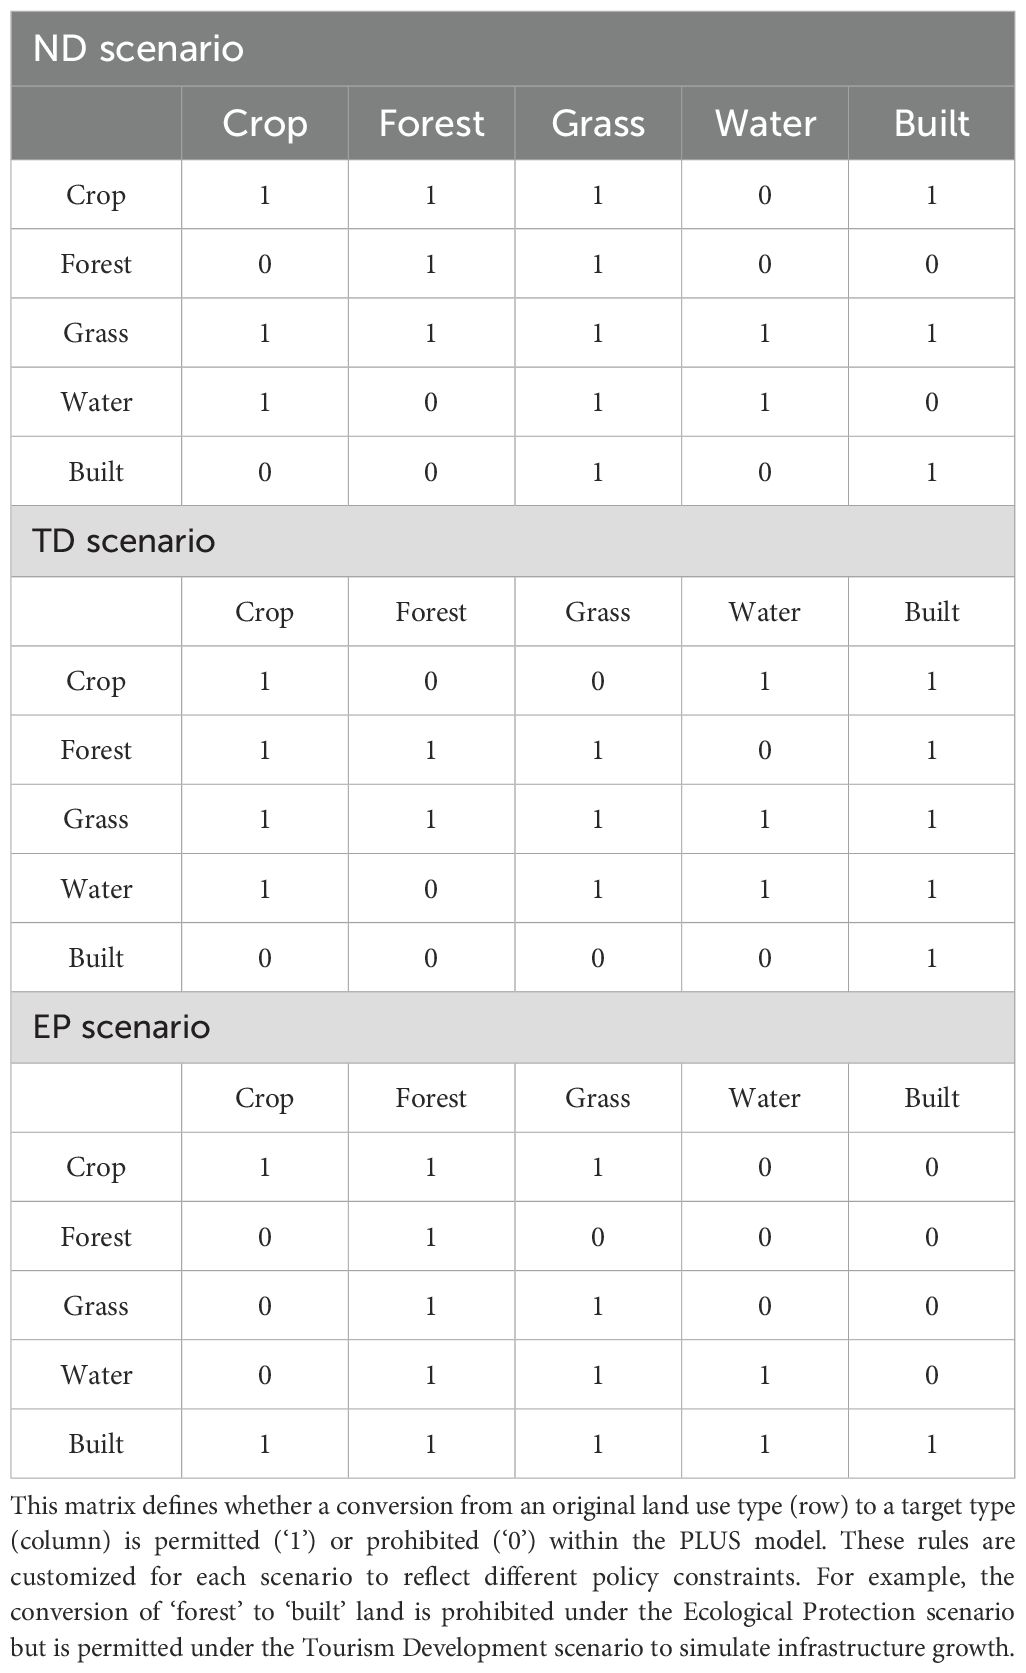
Table 2. Land use transition matrix under different scenarios.
This study examines carbon storage dynamics in the HNTRNP, emphasizing the equilibrium between ecological preservation and economic progress amidst global climate change and dual carbon objectives. We modeled the spatiotemporal dynamics of carbon storage using an integrated PLUS-InVEST approach. Historical analysis (1980–2020) was conducted using the InVEST model. Future land-use scenarios were then simulated with the PLUS model, which was parameterized using ten key natural and socioeconomic indicators to provide a multifaceted assessment. Building on this, the study further projects carbon storage levels for 2035 under various development pathways, examining the influence of distinct socioeconomic scenarios on ecological conservation outcomes. Figure 2 shows the methodological workflow.
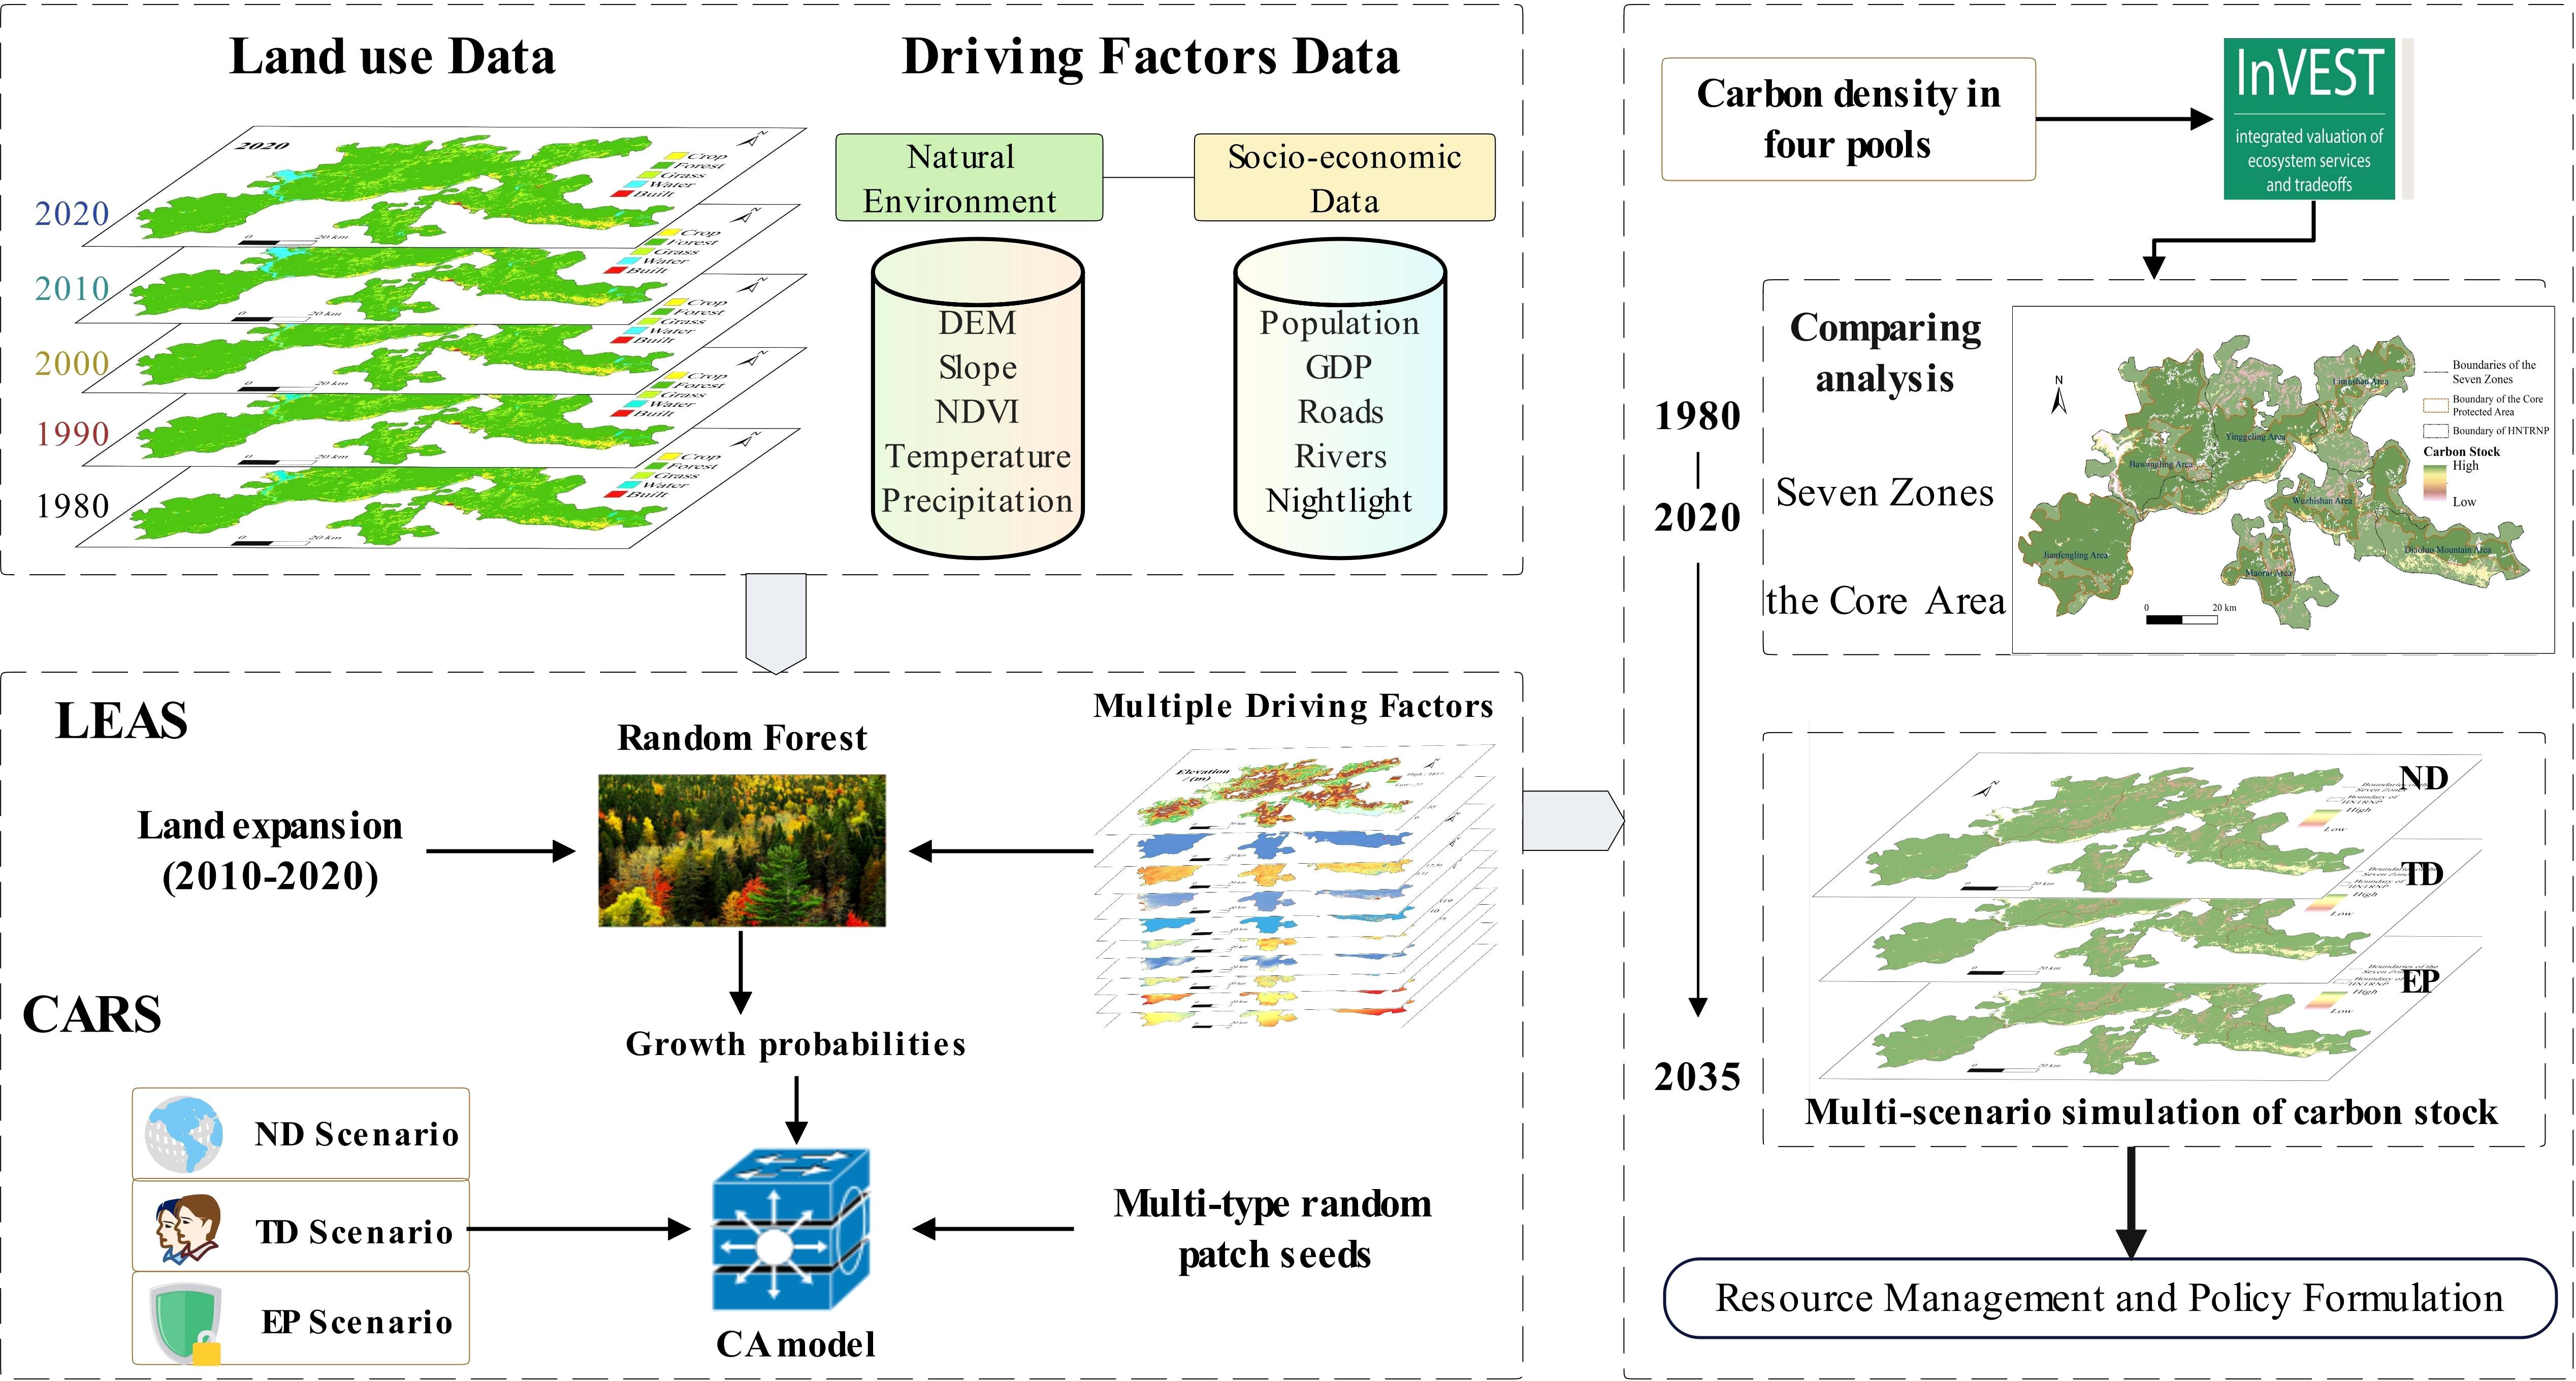
Figure 2. The conceptual framework of this study.
2.3 Methods
2.3.1 The PLUS model
To simulate future landscape patterns, this study employs the Patch-generating Land Use Simulation (PLUS) model. An advanced cellular automaton (CA) framework developed by Liang et al. (2021), the PLUS model overcomes the limitations of traditional approaches by integrating a two-stage process. First, the Land Expansion Analysis Strategy (LEAS) module uses a random forest algorithm to analyze the relationship between historical land-use expansion (derived from two temporal datasets) and a set of specified driving factors, thereby determining the growth probability for each land-use type. Subsequently, the Cellular Automata for Random Seeds (CARS) module simulates the future landscape by modeling the competitive dynamics among different land uses at the patch level. This simulation is guided by domain weights, a critical parameter calibrated from the historical expansion proportion of each land-use category, to govern the allocation of land-use changes. The model’s demonstrated superiority in both simulation accuracy and its ability to capture the mechanisms of landscape change makes it highly suitable for this research.
2.3.1.1 Driving factors
To ensure the model’s predictive accuracy, we first calibrated and validated it using historical data from 2000 to 2020. The model was parameterized with ten key driving factors, selected based on the environmental characteristics of Hainan and established literature (Yin et al., 2024). These drivers encompass natural conditions (elevation, slope, temperature, precipitation, NDVI, distance to water bodies) and socioeconomic indicators (distance to roads, Nighttime Light Index, GDP density, population density), as detailed in Figure 3. The LEAS module was trained on observed land-use transitions between 2000 and 2010 to generate development probability surfaces for each land-use type and quantify the contribution of each driver. Subsequently, using the 2010 land-use map as a baseline and these probability surfaces as input, the CARS module simulated the 2020 landscape. A comparison of the simulated 2020 map against the actual observed map yielded robust validation metrics: a Kappa coefficient of 0.95, an overall accuracy of 0.97, and a Figure of Merit (FOM) of 0.253. These results confirm the model’s high fidelity and its suitability for reliably projecting land-use scenarios for the year 2035.
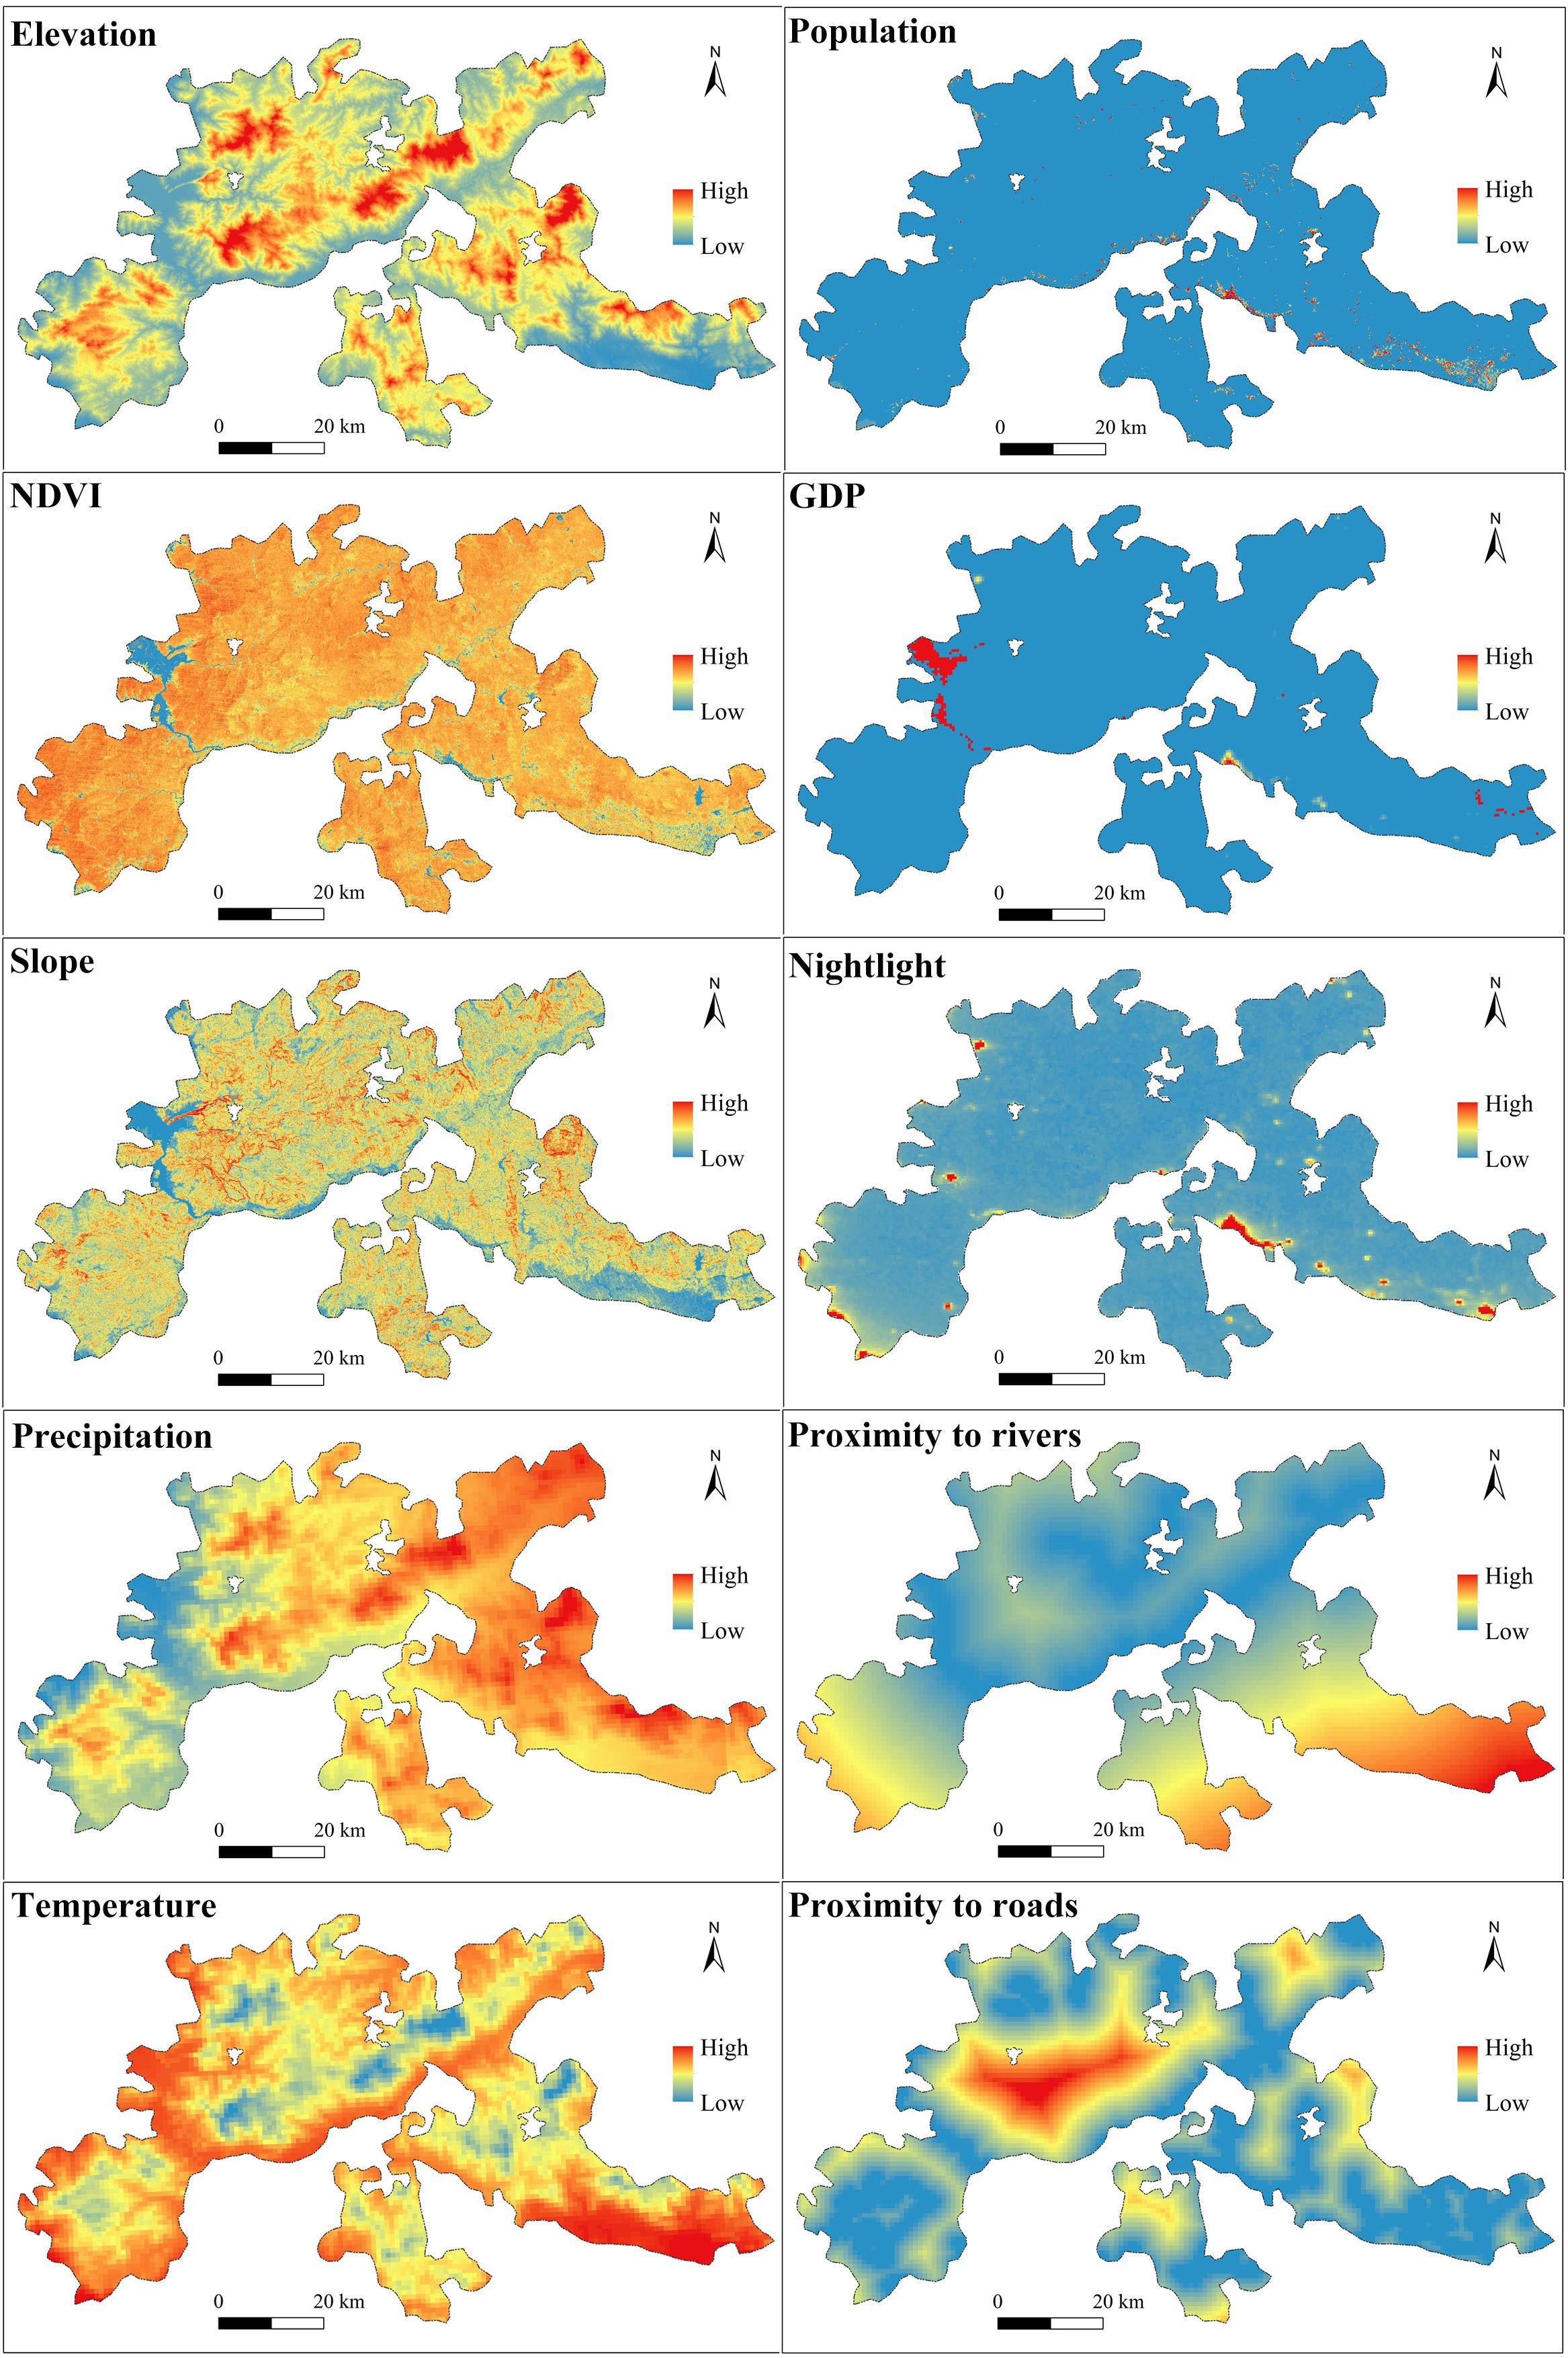
Figure 3. Driving factors of land use change in HNTRNP.
2.3.1.2 Scenario setting
The design of future land-use scenarios was guided by prior research (Zhang Y. et al., 2024), validated through key policy documents like the Master Plan for HNTRNP (2023–2030), and refined based on consultations with the Hainan Forestry Bureau. Three scenarios were developed—Natural Development (ND), Tourism Development (TD), and Ecological Protection (EP)—based on distinct sets of explicit assumptions and land-use transition constraints (Table 2):
1. Natural Development (ND) Scenario: This scenario serves as a business-as-usual baseline. We assumed that land-use change dynamics would follow the historical trajectory observed between 2010 and 2020. The transition probabilities were directly calculated from this period’s land-use data, with no new policy constraints imposed. This approach provides a benchmark for evaluating the impact of the other two policy-driven scenarios.
2. Tourism Development (TD) Scenario: This scenario models the strategic push for economic growth under Hainan’s “International Tourism Island” initiative. The core assumption is that demand for tourism infrastructure will drive the expansion of built areas. This was implemented by: (a) increasing the transition probability of cropland and unused land converting to built land, particularly in areas with high development suitability (e.g., proximity to existing towns and major transportation routes); and (b) prohibiting inefficient reverse conversions, such as from built land back to cropland. Crucially, to reflect the national park’s fundamental mandate, the direct conversion of core forestland to built land remained strictly prohibited.
3. Ecological Protection (EP) Scenario: This scenario fully embodies HNTRNP’s conservation mandate and aligns with “no-deforestation” and carbon sequestration goals. The primary assumptions were: (a) a strict zero-conversion policy for all forestland, meaning its transition probability to any other land-use type was set to zero; and (b) proactive ecological restoration, modeled by increasing the transition probability of grassland to forestland, especially in ecologically sensitive areas or zones designated for reforestation. This scenario prioritizes the enhancement of ecosystem services and carbon storage above all other land uses.
2.3.2 Carbon storage calculation based on the InVEST model
To evaluate carbon storage dynamics, we employed the InVEST model’s carbon module. Following the methodology described by Babbar et al. (2021), this tool calculates total carbon stocks by summing the carbon stored in four key components: aboveground biomass, belowground biomass, soil, and dead organic matter. The specific formulas used to compute the total carbon for each land-use type are as follows:
where i denotes the number of land use types, Ci-total represents the total carbon storage for all land types, while Ci-above, Ci-below, Ci-soil, and Ci-dead represent the carbon densities in the aboveground and belowground biomass, soil, and dead organic matter for the i-th land use type, respectively. Ai signifies the area corresponding to the i-th land use type. This formula allows for a detailed accounting of carbon sequestration across different ecosystem components, providing a nuanced view of carbon dynamics within HNTRNP. The final carbon density values for each land-use type in HNTRNP were derived by adapting a national dataset from the National Ecological Science Data Center, using the correction framework established by Gong et al. (Table 3).
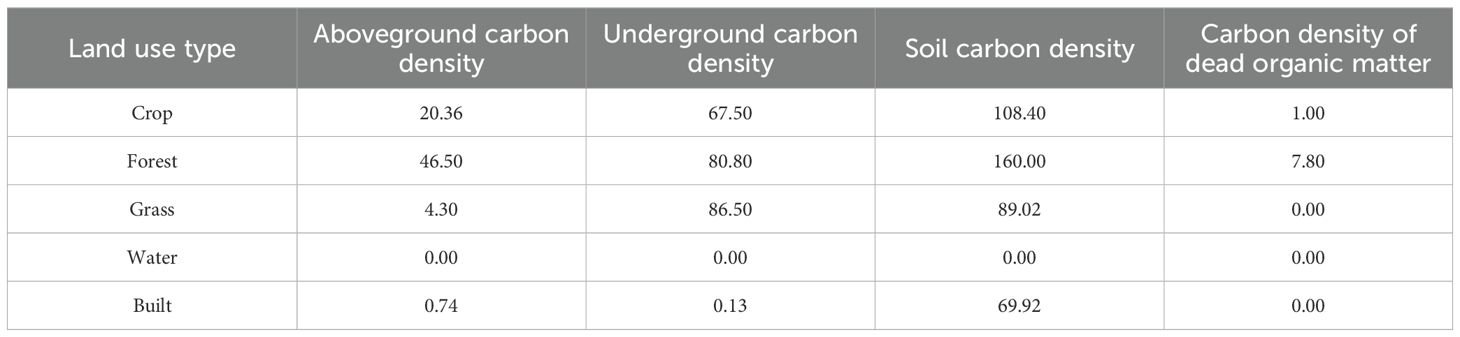
Table 3. Regional carbon densities of different land use types of HNTRNP (t/hm2).
3 Results
3.1 The evolution of land use within HNTRNP (1980 - 2020)
An analysis of the landscape composition reveals a matrix dominated by forest land, which occupies over 87% of the study area (Table 4). Anthropogenic features such as residential land are sparse, covering less than 2% of the total area. Between 1980 and 2020, the forest land area rose from 3,628.06 km² to 3,822.26 km², an increase of 194.20 km², demonstrating a sustained upward trajectory. Water bodies and residential areas also increased, by 33.89 km² and 1.25 km², respectively, during the 40-year span, with stability observed until 2000, followed by a swift growth phase. Conversely, grasslands and croplands have seen a steady decline, decreasing by 178.08 km² and 49.26 km², respectively. The decrease in grasslands was more substantial in the initial years, whereas the reduction in croplands became more pronounced after 2000. The overall land use transformation in HNTRNP is marked by a notable decrease in both grassland and cropland, contrasted with a substantial increase in forested areas.
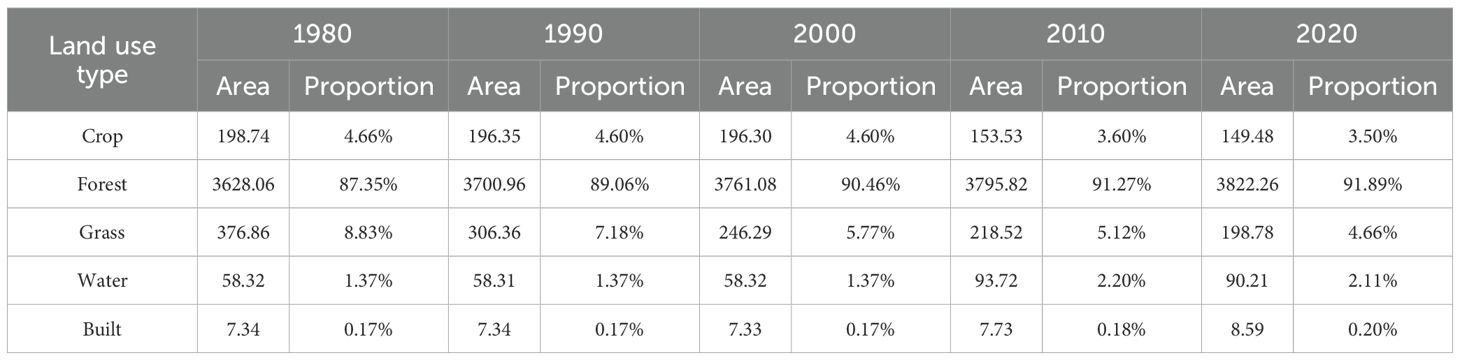
Table 4. Land use area (km2) and proportion (%) in HNTRNP from 1980 to 2020.
The land use transition dynamics in HNTRNP from 1980 to 2020 are illustrated in Figure 4 and Figure 5. Grasslands were the predominant outgoing land type, transferring an area of 116.22 km², which constituted 50.10% of the total outgoing area, primarily into forest land, cropland, and water bodies, accounting for 53.73%, 36.77%, and 9.34% of the transitions, respectively. Cropland transitions accounted for 43.54 km², or 18.77% of the total outgoing area, predominantly converting into water bodies (48.30% of outgoing cropland area) and forest land (47.22% of outgoing cropland area). Conversely, transitions to water bodies and built-up area were minimal, collectively comprising only 3.74% of the total outgoing land area. Analyzing incoming land types, cropland and forest land were the primary recipients, with 86.77 km² and 84.50 km² transitioning in, predominantly from grasslands. These transitions contributed 49.25% and 73.90% to the incoming areas of cropland and forest, respectively. The mutual transition between crop and forest also played a significant role. The incoming area for water bodies was 37.16 km², with over 90% resulting from the conversion of cropland. A notable example is the Daguangba Reservoir in Ledong County, where the water area increased by 33.25 km² between 1980 and 2020 (see Figure 5F), primarily due to the submersion of cropland for hydropower construction. Overall, the defining characteristic of land use transitions in HNTRNP over the 40-year period was the interconversion among grasslands, forest land, and cropland.
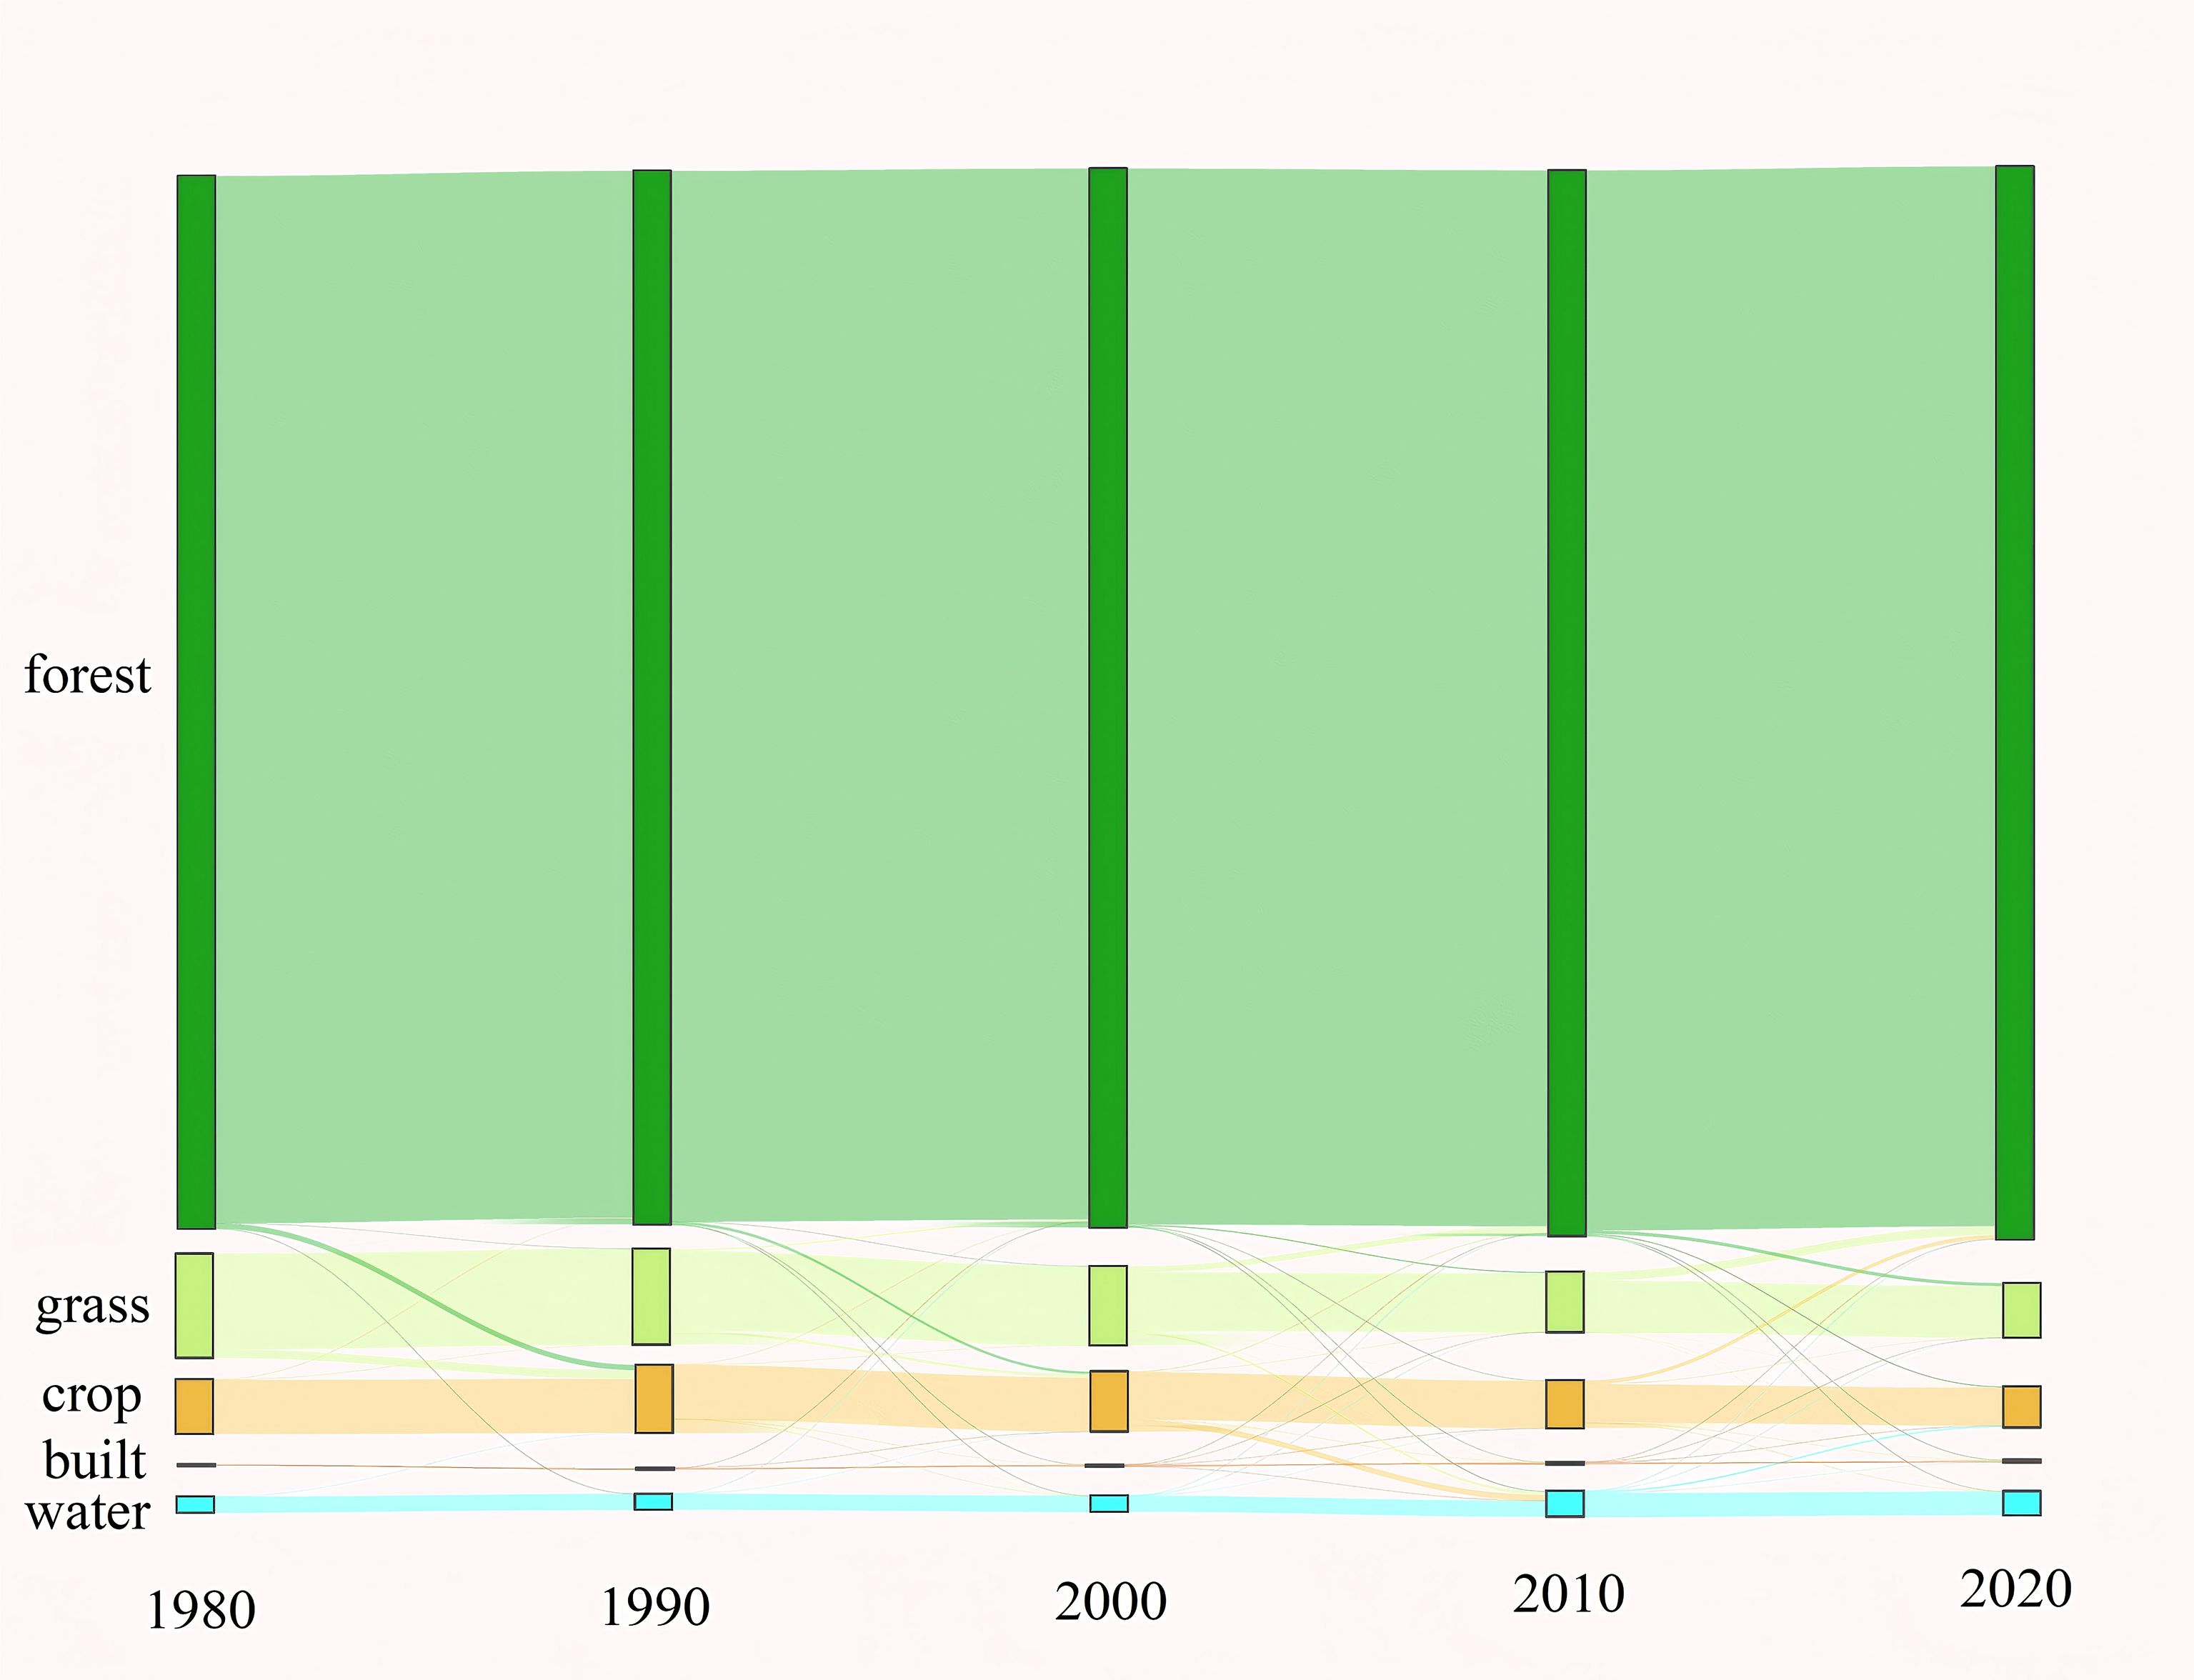
Figure 4. Sankey diagram of land use transfer.
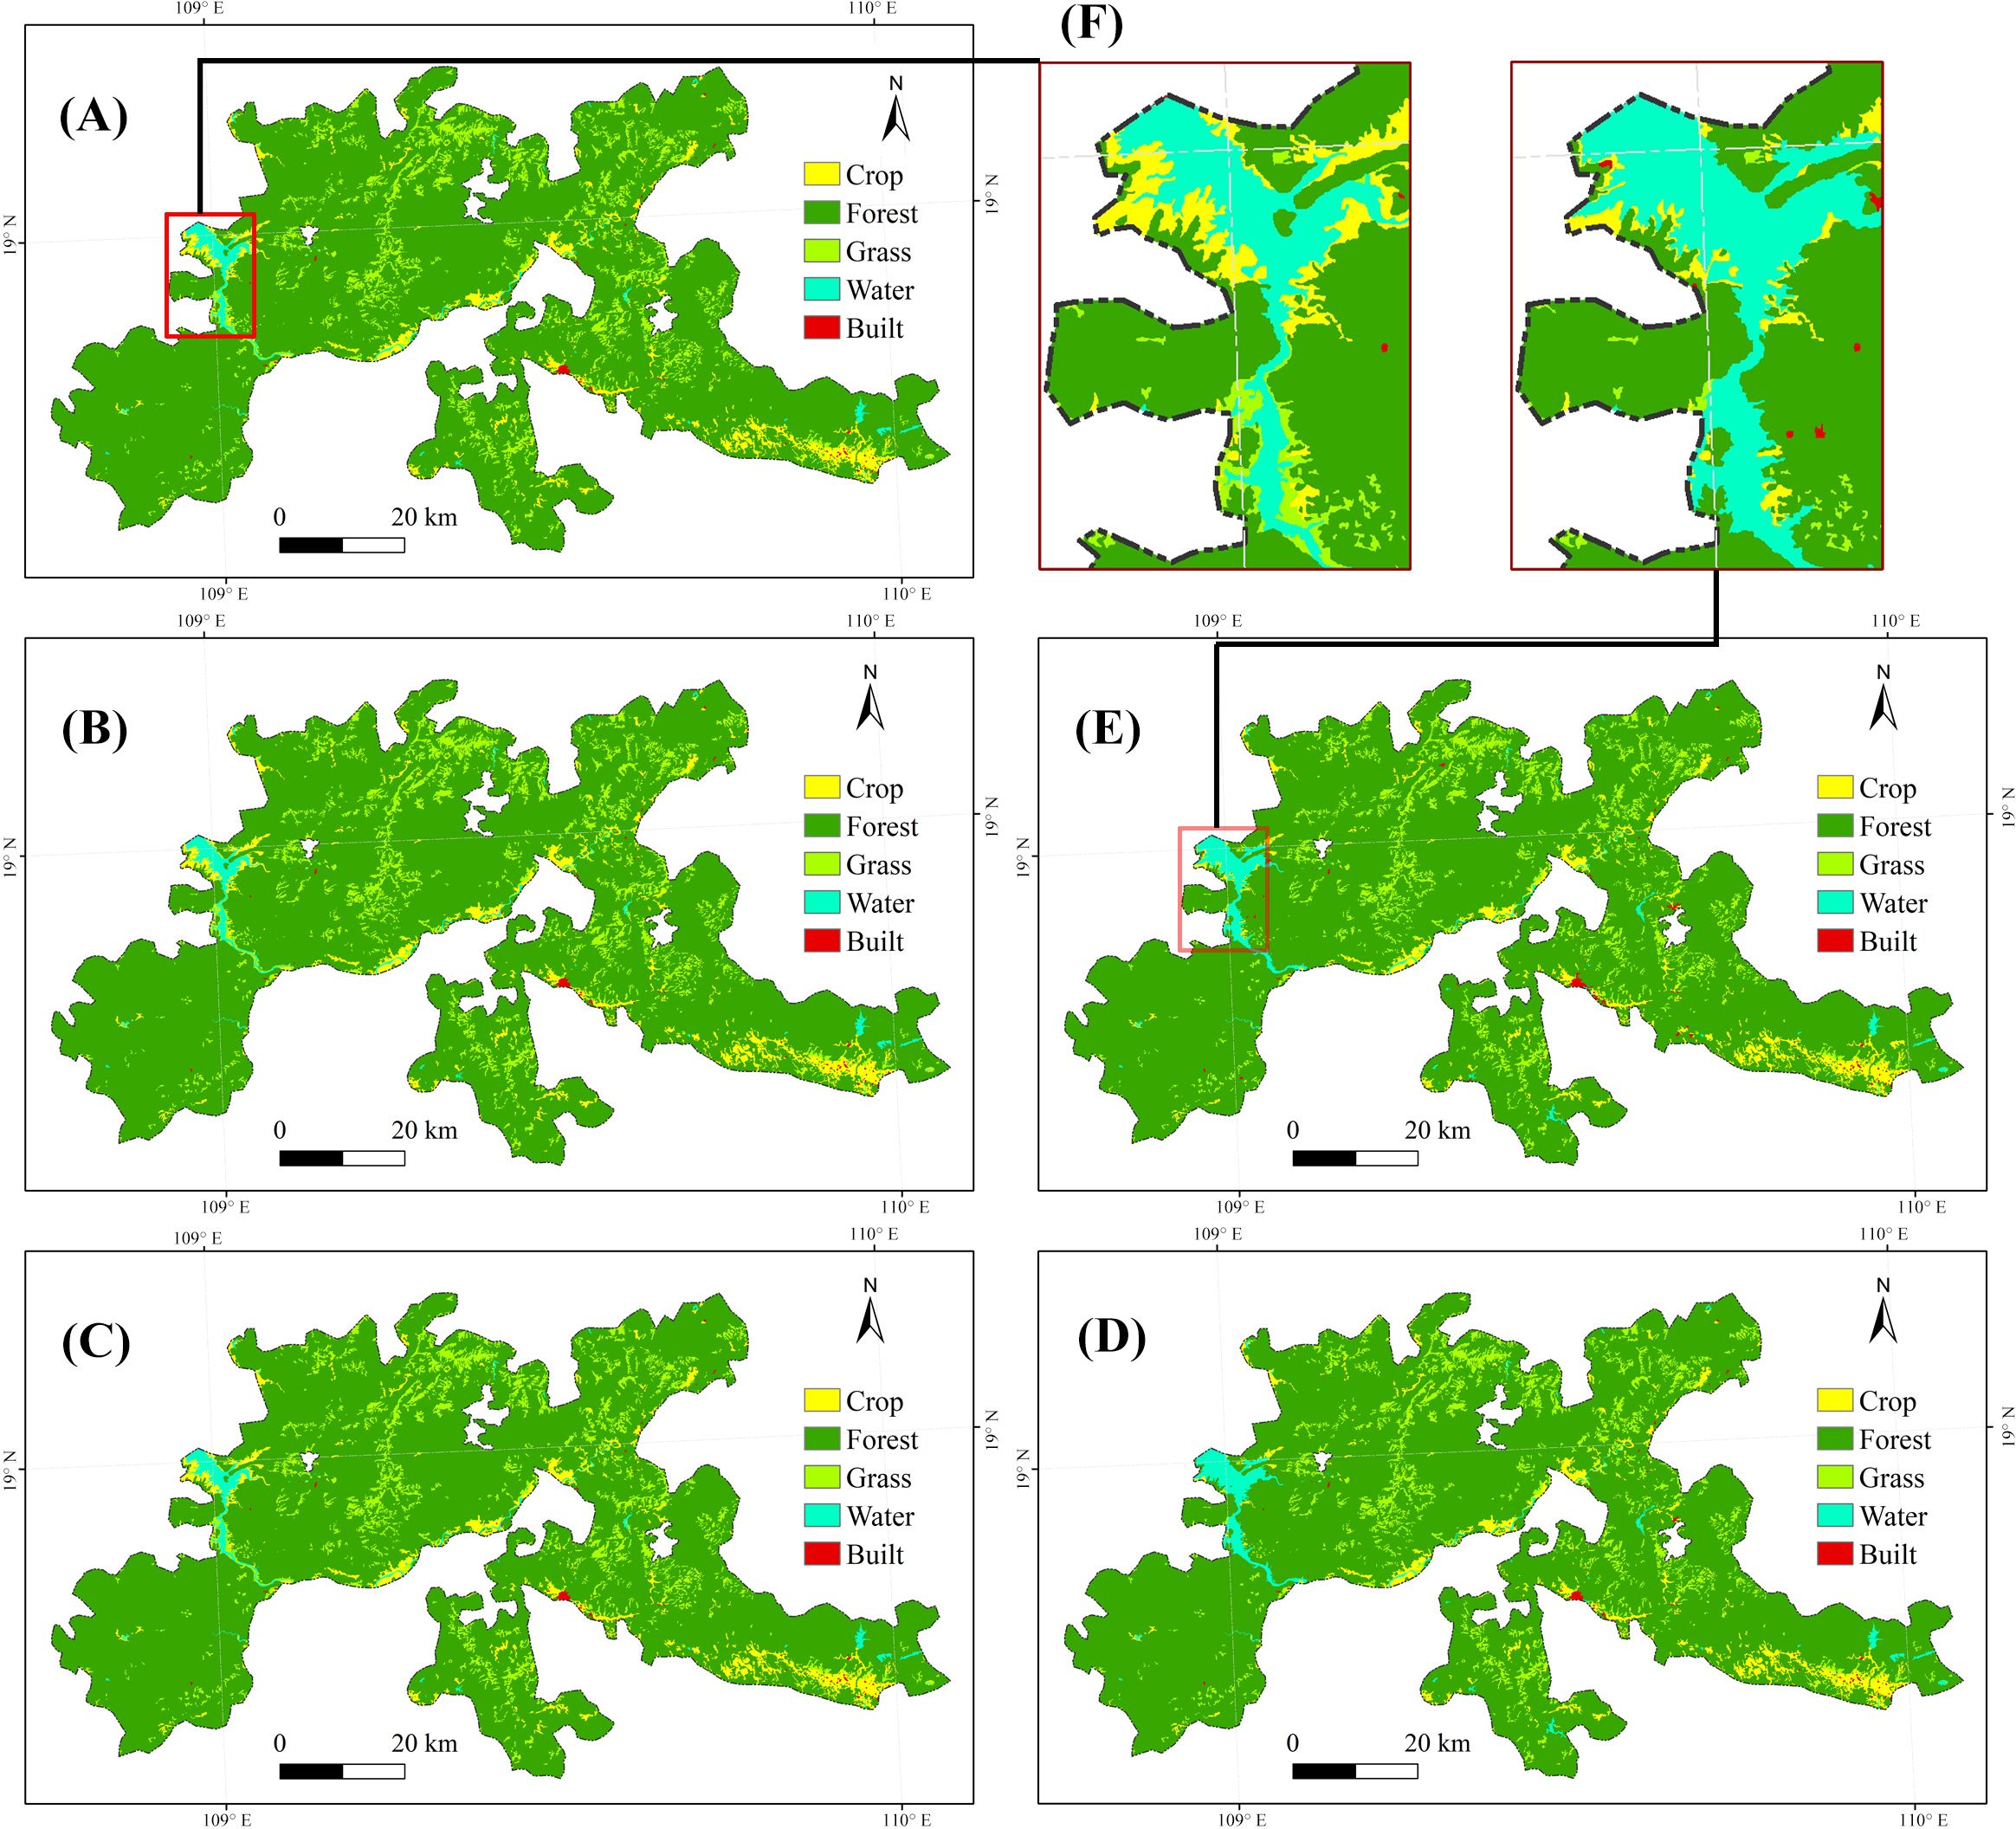
Figure 5. Spatial–temporal evolution of land use in HNTRNP from 1980 to 2020. (A) 1980; (B) 1990; (C) 2000; (D) 2010; (E) 2020; (F) comparing specific areas between 1980 and 2020.
3.2 Carbon storage dynamics (1980-2020)
Over the four-decade study period (1980-2020), the spatial distribution of carbon storage in HNTRNP remained remarkably stable, a pattern that directly mirrors the region’s consistent, forest-dominated land use. As expected, carbon stocks were concentrated in high-density forest ecosystems, while the lowest values were consistently found in water bodies and built-up land, such as those in the Bawangling and Wuzhishan areas, respectively (Figures 6A, B). Despite this overall spatial stability, the net change in total carbon storage fluctuated between different time intervals. To precisely identify the locations of these subtle changes, we delineated the study area into three categories: zones of carbon increase, decrease, and relative stability.
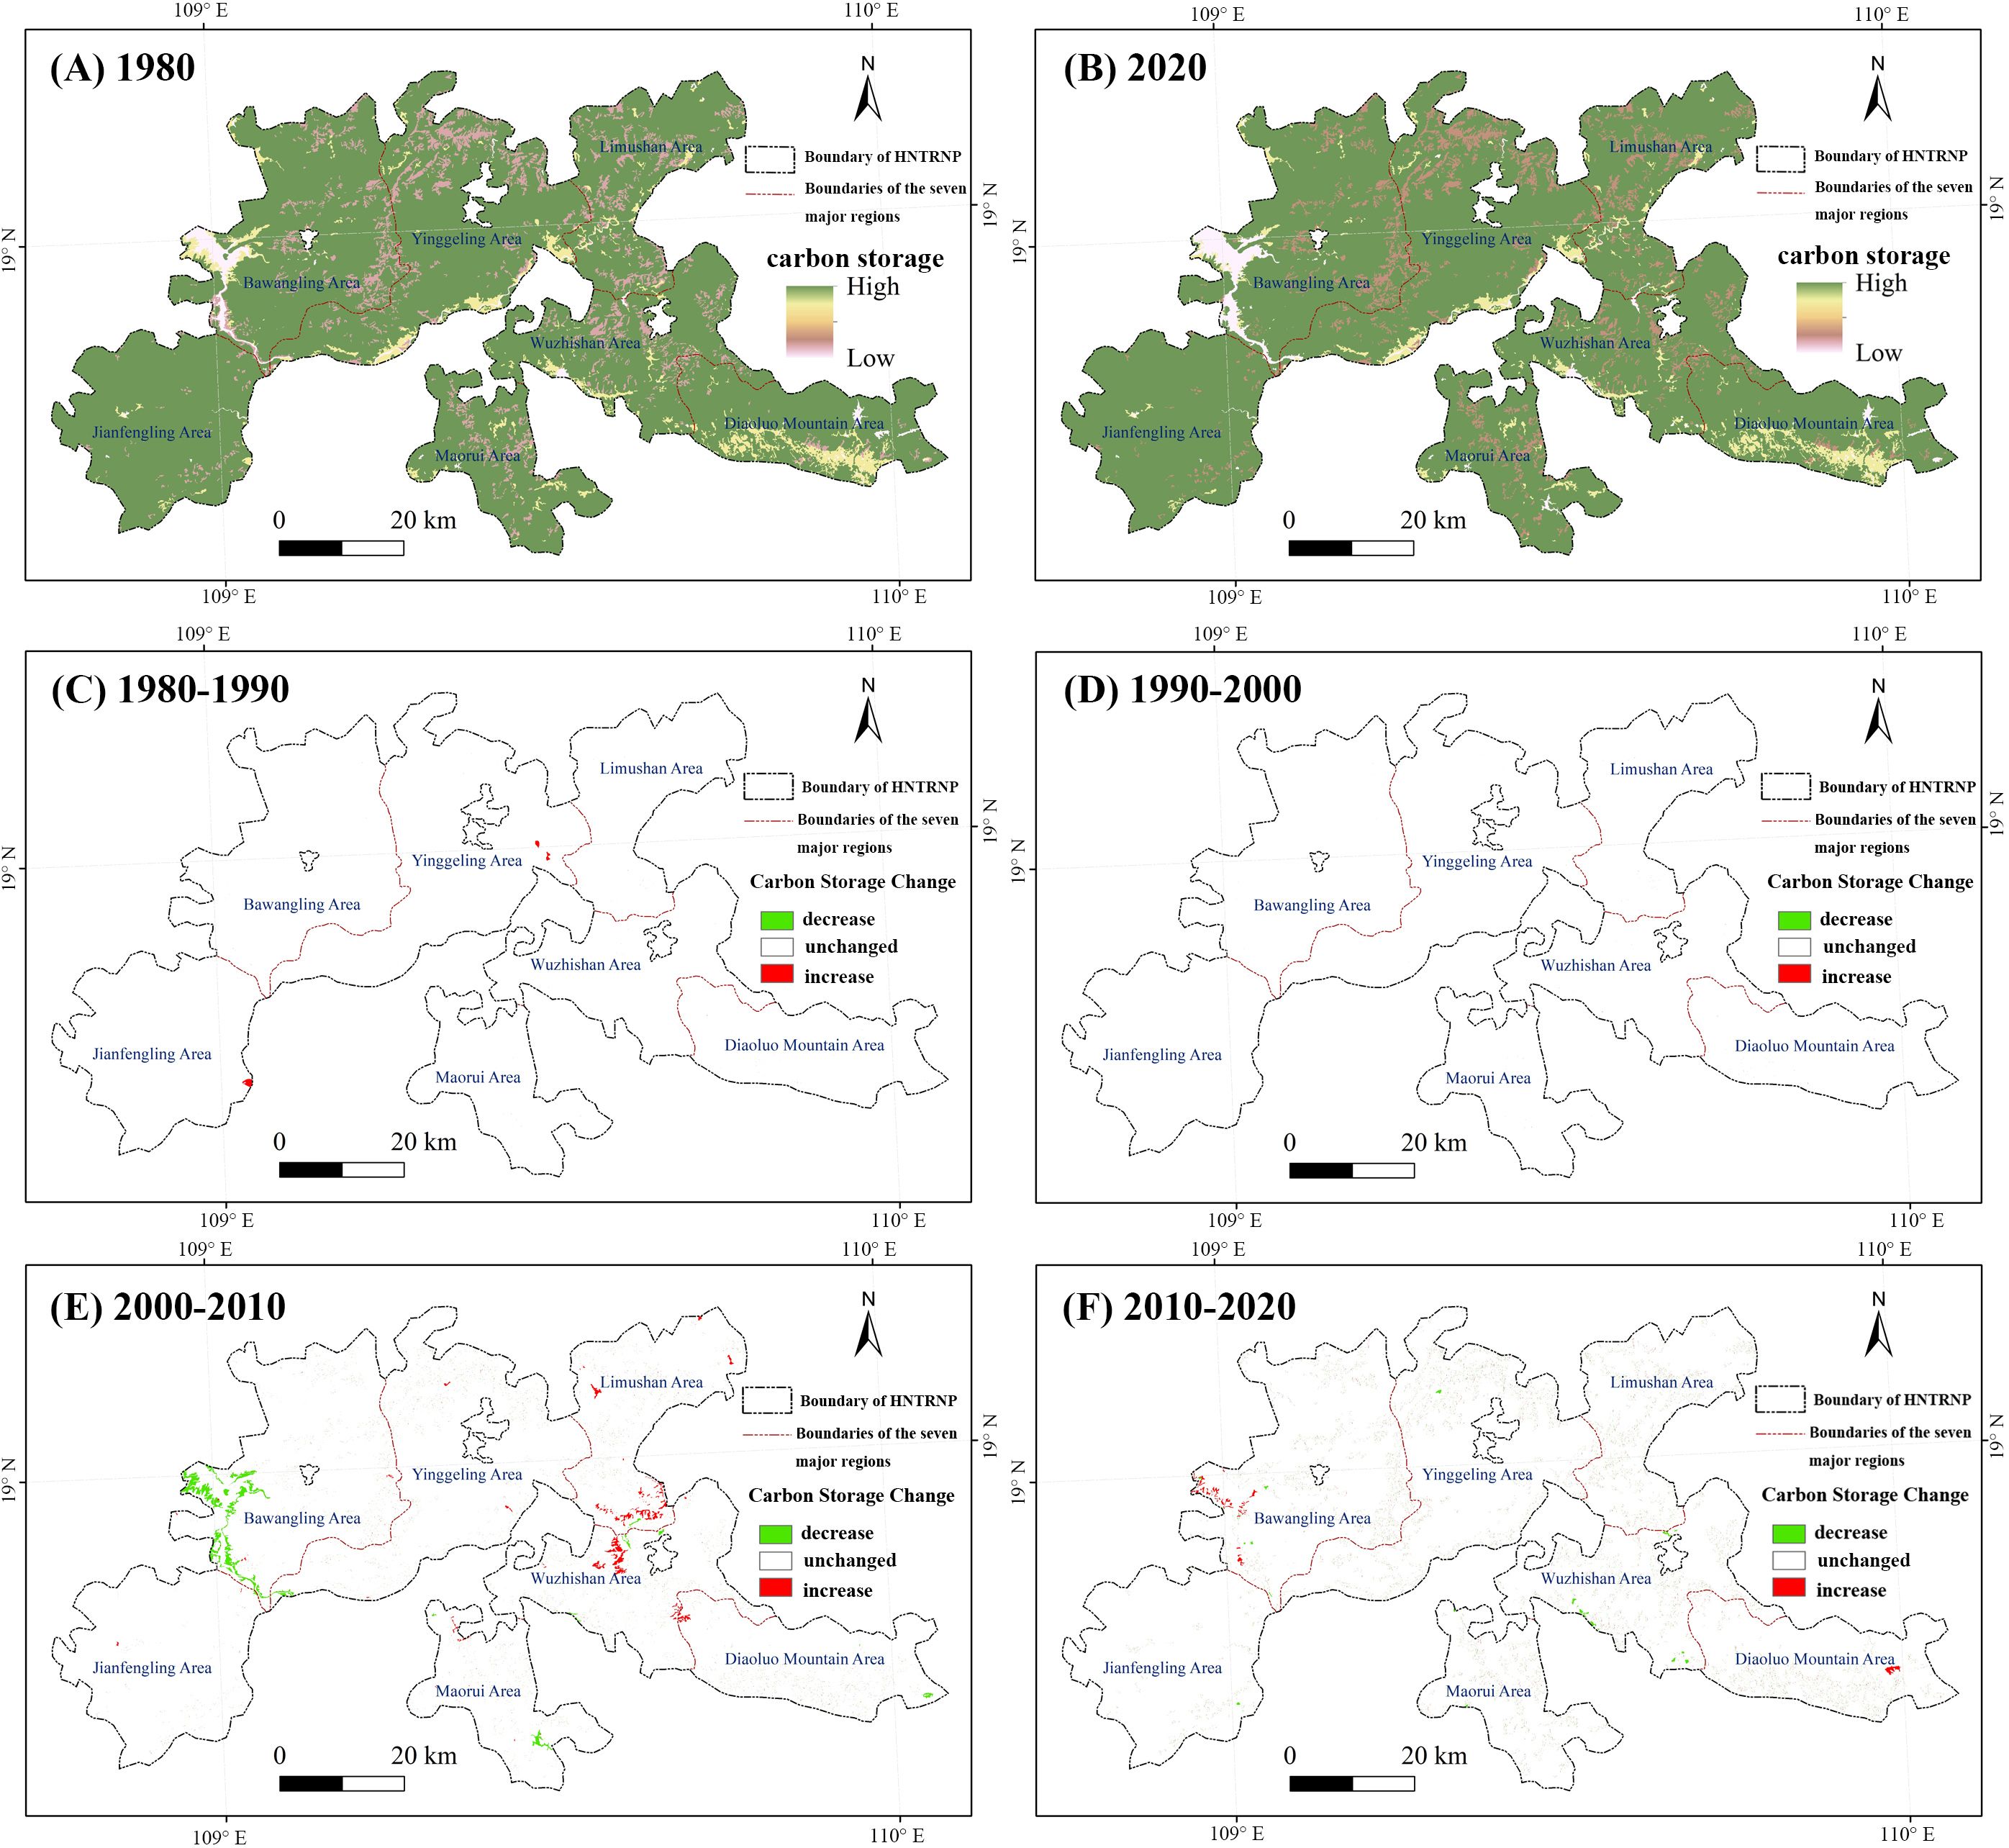
Figure 6. Characteristics of carbon storage and spatial changes in HNTRNP from 1980 to 2020. (A, B) show the spatial distribution of carbon storage in 1980 and 2020, respectively; (C–E, F) depict the changes from 1980–1990, 1990–2000, 2000–2010, and 2010–2020.
From 1980 to 2000, carbon storage remained relatively stable, with an increase of only 0.07 Tg over the 20-year period, marking the smallest variation during this time (see Figures 6E, F). However, between 2000 and 2010, significant fluctuations occurred, with marked decreases primarily observed in the Bawangling region’s Changjiang River basin. Between 2000 and 2010, carbon storage exhibited a notable decline of 0.65 Tg, marking the most significant fluctuation observed during the study period. From 2010 to 2020, carbon sequestration within the HNTRNP region displayed a gradual ascending trend, with isolated instances of significant increase noted in the eastern part of the Changjiang River basin and the western reaches of the Diaoluoshan area.
The 2020 data in Table 5 further corroborate this spatial differentiation: subregions such as Yinggeling (CV = 10.53%) and Jianfengling (CV = 5.75%) have maintained high carbon density (280.50–285.30 t/hm²) and low coefficients of variation through continuous protection, indicating enhanced ecosystem stability. The low CV in northern Limushan (CV = 7.12%) reflects that ecological restoration policies have effectively promoted uniform carbon distribution. In contrast, marginal areas (e.g., Bawangling, Diaoluoshan), affected by reservoir construction and tourism development, exhibit reduced carbon density (210.70–225.80 t/hm²) and elevated CV (15.70–23.11%), with significantly intensified spatial heterogeneity. This differentiation pattern reveals the impact mechanism of nature conservation and human activities on carbon storage—strict protection maintains carbon distribution stability, while disturbances lead to fragmented carbon storage.
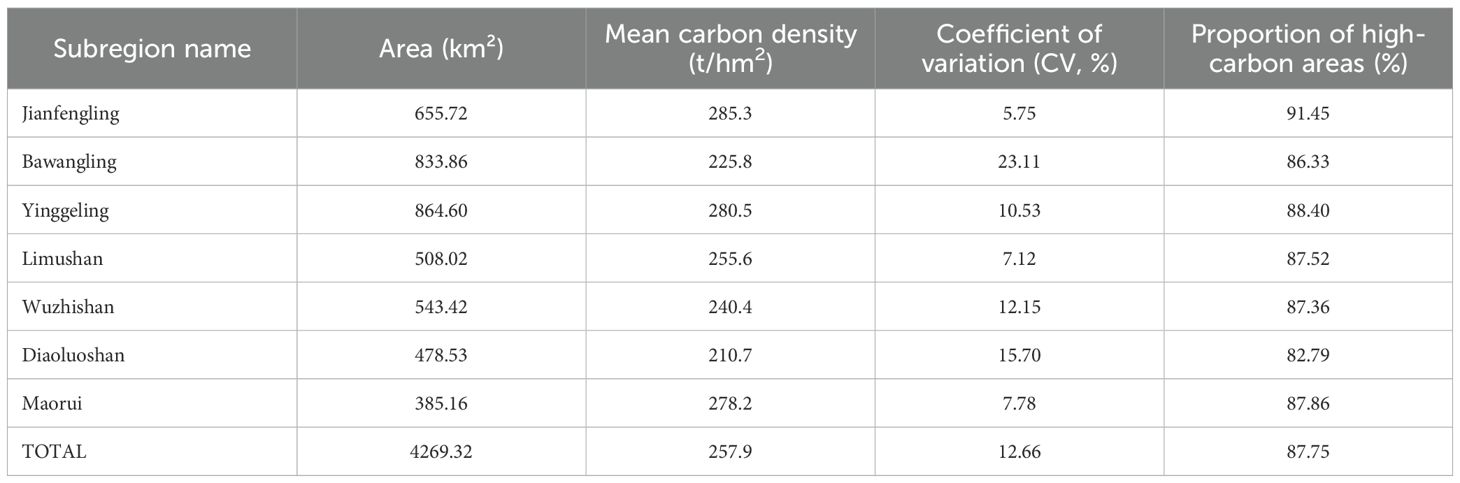
Table 5. Statistical characteristics of carbon storage in seven regions (2020).
3.3 Spatiotemporal changes in carbon storage under multi-scenario land use simulations
To explore potential land use trajectories, we employed the PLUS model to simulate patterns for the year 2035 under several development scenarios. The resulting projections, detailed spatially in Figure 7 and quantified in Table 6, reveal a key trend: while the overall land-use structure of HNTRNP is expected to remain stable, significant transformations are concentrated in localized areas. For instance, the ND scenario projects a contraction in cropland, water bodies, and built land by 2.75 km², 3.21 km², and 0.47 km², respectively. Conversely, forestland and grassland showed an upward trend, increasing by 3.51 km² and 2.92 km², respectively. In the TD scenario, the area of forestland, grassland, and water bodies all decreased, with reductions of 21.18 km², 5.81 km², and 0.94 km², respectively, while cropland expanded by 25.39 km² and built-up area increased by 2.62 km². Under the EP scenario, following the implementation of policies such as the National Park Ecological Protection Law and improvements in ecological environment monitoring, the forestland area saw a substantial increase of 81.84 km², primarily converted from cropland and grassland. Concurrently, the expansion of urban land was effectively curbed, with the increased area reduced to 5.43 km².
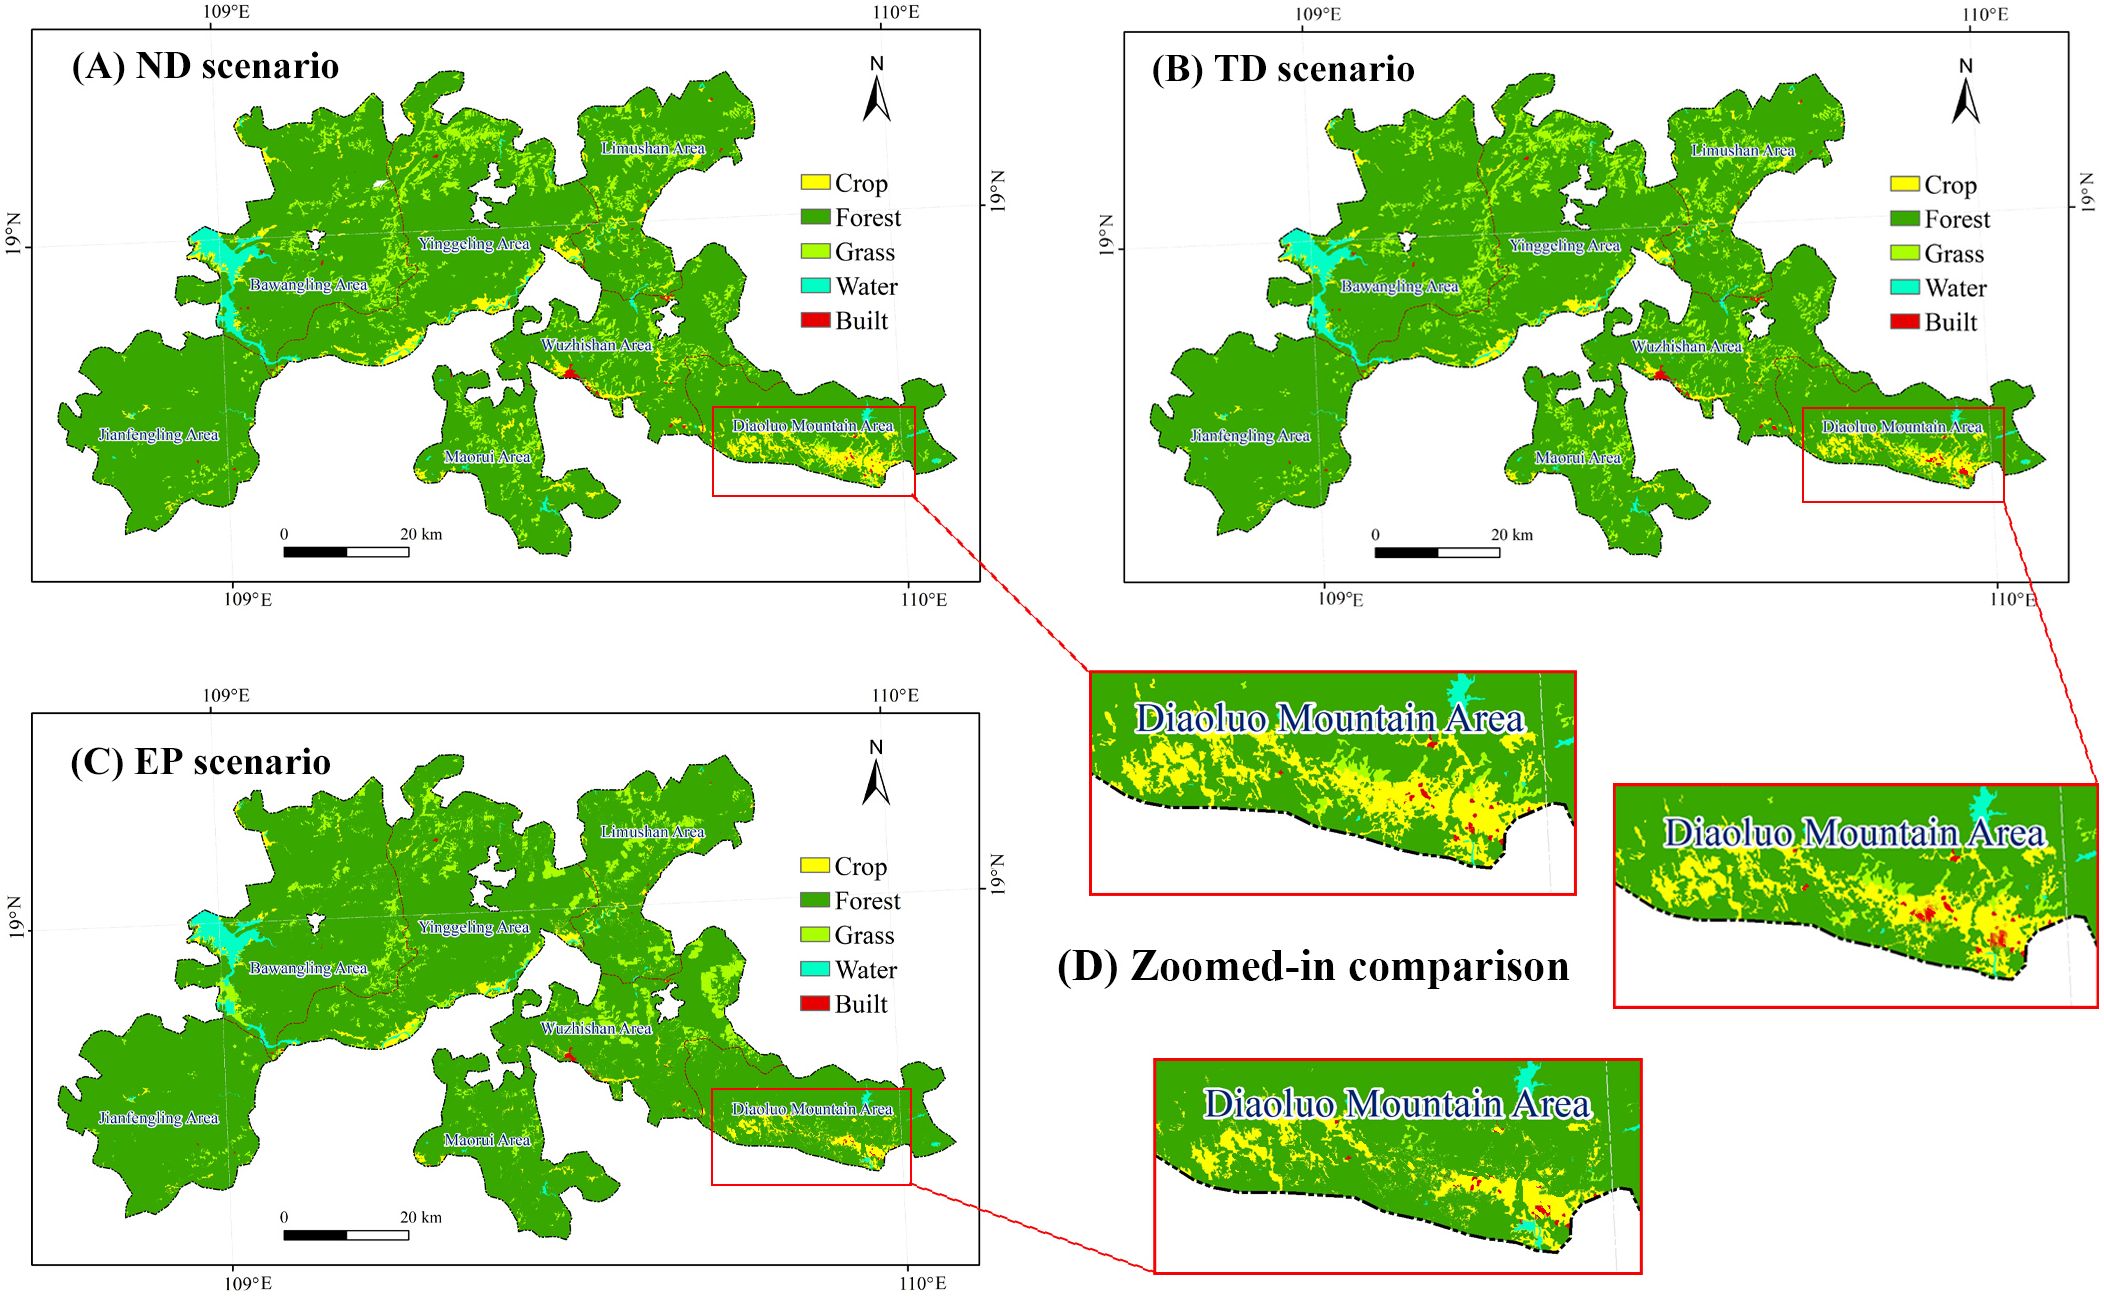
Figure 7. Simulation results of land use under different scenarios in HNTRNP in 2035. (A) ND scenario; (B) TD scenario; (C) EP scenario; (D) Zoomed-in comparison of the Diaoluo Mountain Area under different scenarios.
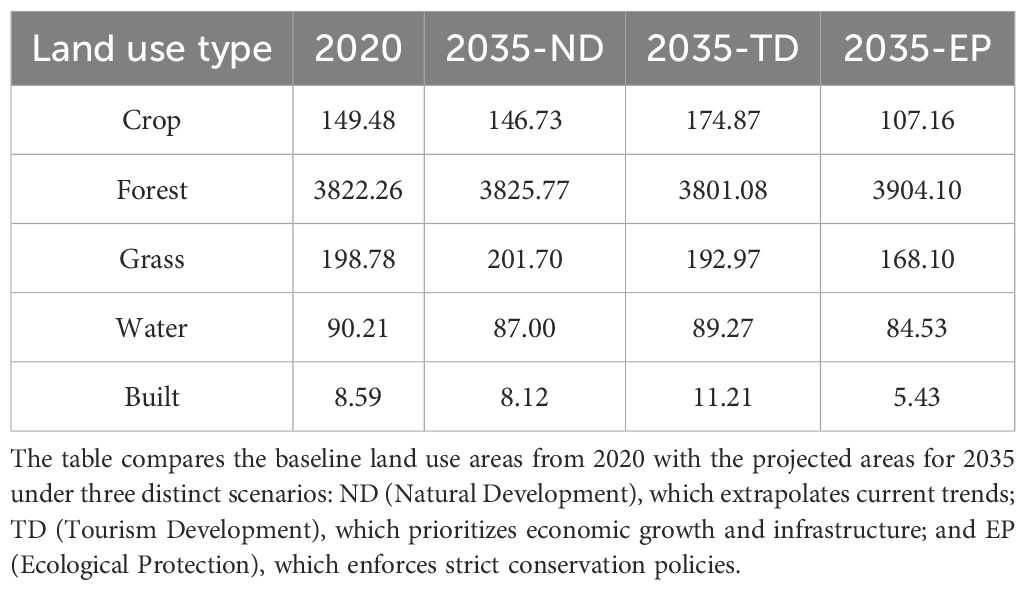
Table 6. Land use type area statistics under three scenarios for 2035 (/km²).
The results demonstrate that targeted ecological protection measures can serve as an effective brake on urban sprawl. Without such interventions, as modeled in the other two scenarios, built-up areas are projected to expand in line with a business-as-usual trajectory. Under ecological protection, although cropland and grassland shrink, forestland—crucial for ecological stability—experiences a significant increase. Implementing these protective measures would limit the spread of cropland and built-up area, benefiting regional environmental conservation. By 2035, the spatial distribution of land use is projected to align with traditional patterns, driven by national park policies that convert large areas of cropland and grassland into forestland. Forestland will dominate, covering more than 90% of the total area. Most cropland changes will occur in the eastern Diaoluoshan area, where cropland is expected to decrease by 28.31% under the EP scenario. In contrast, built-up area will contract more rapidly, with a reduction of up to 36.79%, primarily in the urban and suburban areas of the Wuzhishan. Additionally, ecological migration policies will reduce scattered mountain settlements, further accelerating the reduction in built-up area.
The spatial distribution of the total carbon storage in HNTRNP for the year 2035 under three scenarios, as depicted in Figure 8, shows no significant deviation from the data recorded in 2020. The total carbon storage levels are predominantly maintained around 110 Tg, with the EP scenario exhibiting the highest carbon storage at 110.85 Tg, followed by the ND scenario with 109.57 Tg, and the TD scenario with the lowest predicted value of 109.21 Tg. These findings suggest that despite different developmental trajectories, the carbon sequestration capacity of HNTRNP has remained relatively stable, likely due to effective ecological conservation and management strategies. The park’s landscape is overwhelmingly dominated by high-density carbon sinks. In contrast, areas of low carbon storage are sparse and geographically confined, appearing primarily as pockets within the eastern reservoir wetlands and as isolated patches of grassland and rural settlements in the central region. This distribution indicates that the forest ecosystems in these regions possess high carbon density and significant carbon sequestration potential. These ecosystems stabilize the regional carbon cycle, bolster carbon sink capacity, and aid in mitigating global climate change.
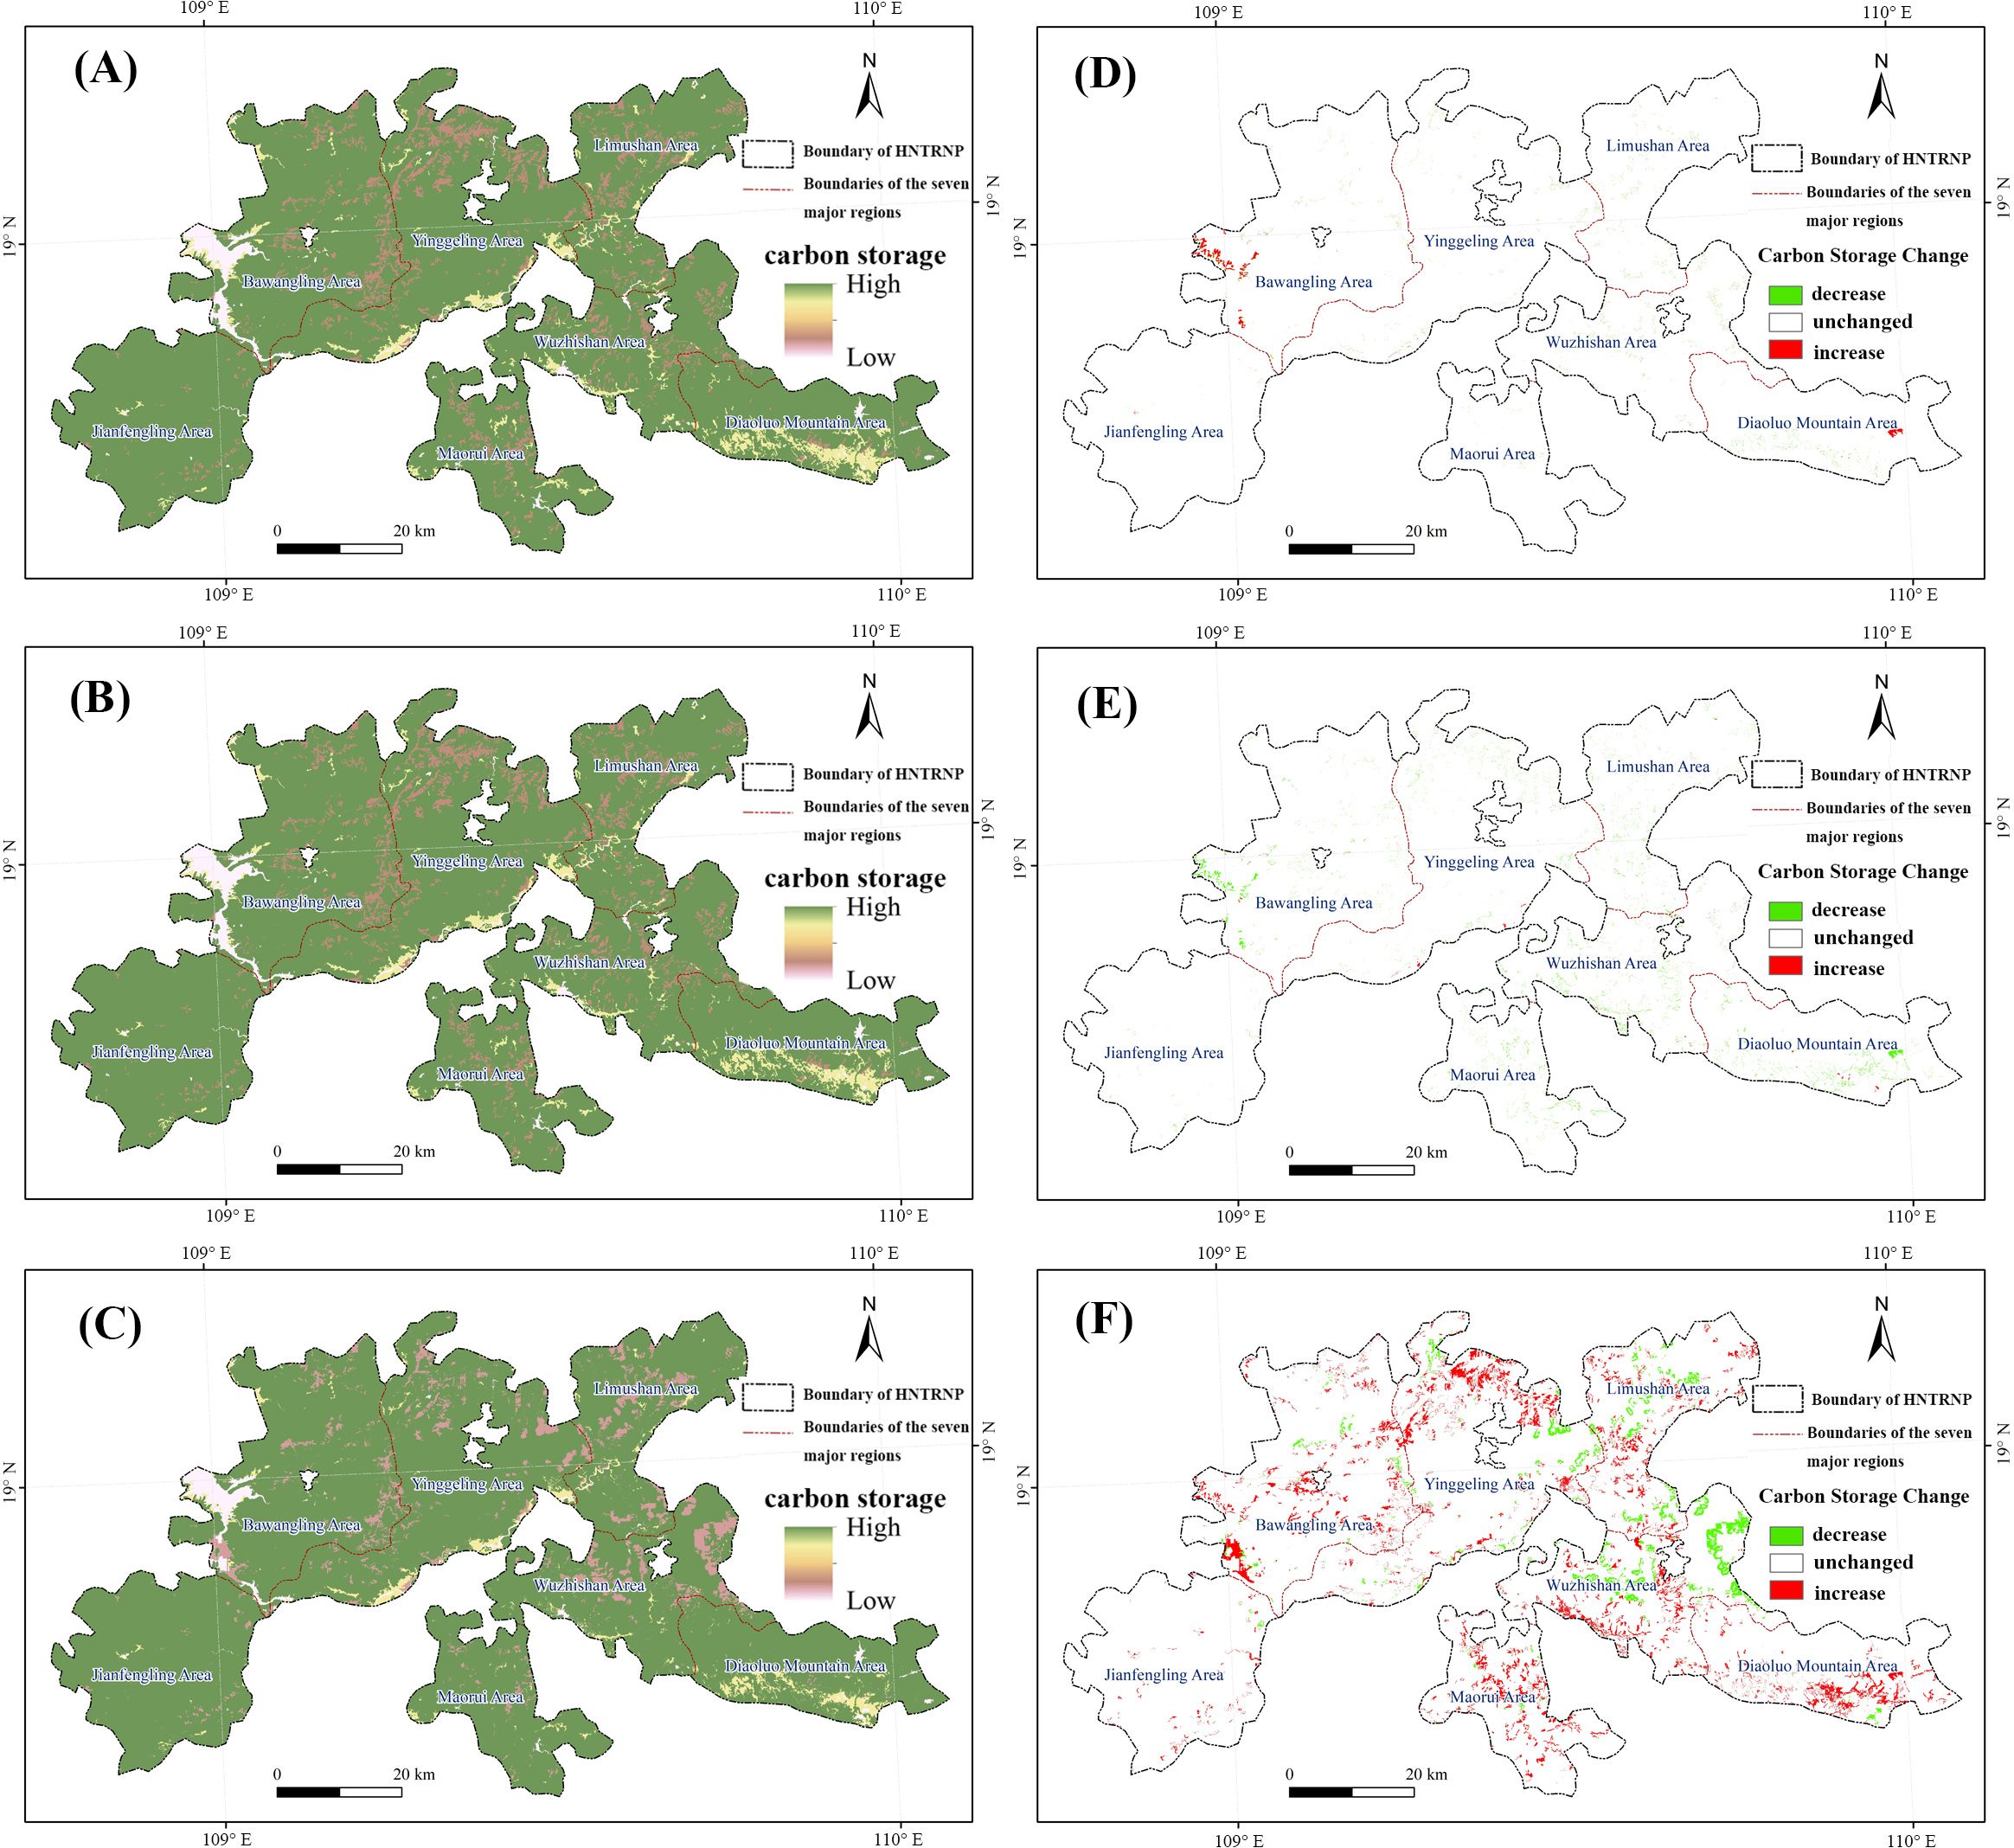
Figure 8. Characteristics of carbon storage and spatial changes in HNTRNP under different scenarios in 2035. (A–C) represent the predicted distribution of carbon storage for the ND, TD, and EP and EP scenarios in 2035, respectively; (D–F) represent the distribution of differences between the predicted carbon storage values and the actual carbon storage values in 2020 for the three scenarios of ND, TD, and EP, respectively.
The implementation of a zoned management strategy in HNTRNP unveils unique ecological and carbon storage characteristics in diverse regions. A comparative assessment of carbon storage dynamics in the seven primary zones is essential to assess their individual roles in carbon sequestration and identify key zones crucial for maintaining overall carbon storage stability in the park. This evaluation empowers park management to allocate resources strategically, enhance protection in critical areas, and enact tailored ecological restoration initiatives in specific zones, thereby bolstering the park’s role as a carbon sink. Comparing the carbon storage patterns in HNTRNP for the year 2035 under the ND and TD scenarios to those in 2020, the data predominantly indicate a reduction in carbon sequestration across the park’s sectors (Table 7). Most notably, under the TD scenario, the reduction in carbon storage significantly surpasses the increase, with a striking ratio of 10.31. The primary areas of decrease are located in the Bawangling, Diaoluoshan, and Wuzhishan subregions, which is linked to the concentrated distribution of built and water bodies, making these areas prime for ecological tourism development. Such development could lead to irreversible land-use conversions, thereby adversely affecting the park’s carbon storage capacities and ecological services. Conversely, the EP scenario predicts an opposite trend, with an increase in carbon storage that exceeds the reduction, dropping the ratio to 2.58. A ranking of the increased carbon storage areas among the seven zones is as follows: Yinggeling (54.23 km²) > Bawangling (48.03 km²) > Diaoluoshan (31.70 km²) > Wuzhishan (30.31 km²) > Limushan (29.85 km²) > Maorui (29.78 km²) > Jianfengling (6.33 km²). It is noteworthy that the Wuzhshan area also shows a substantial reduction in carbon storage (40.94 km²), attributable to the intensive distribution of built and crop and the resulting land-use changes within this zone.
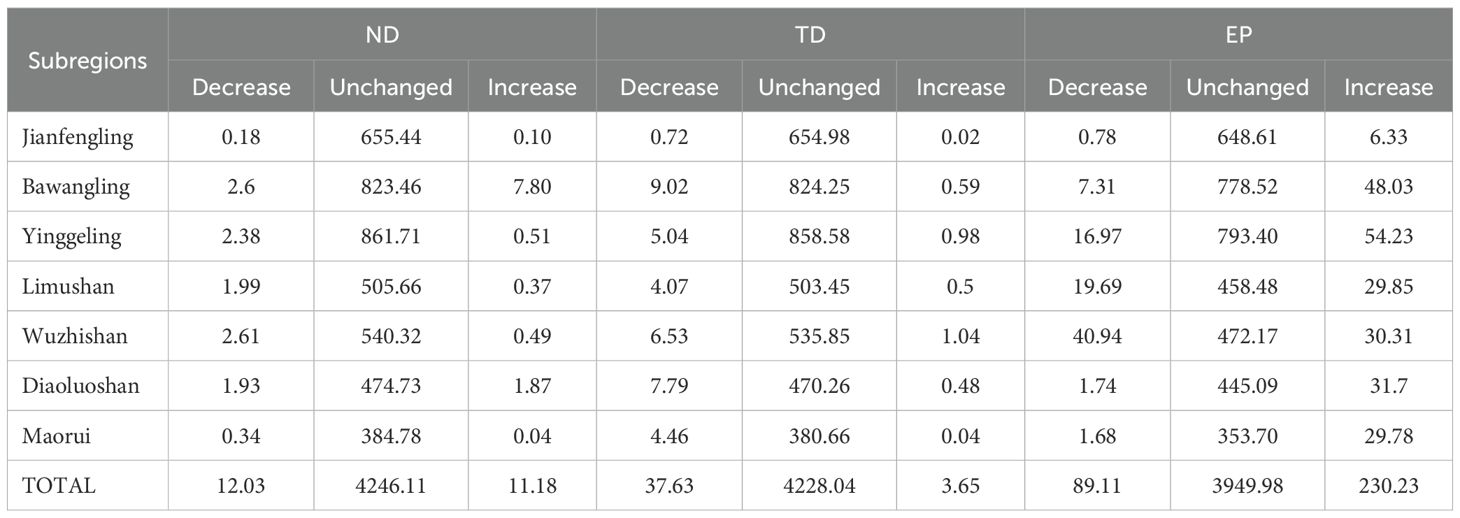
Table 7. Land area statistics in 7 subregions for carbon storage changes in HNTRNP under 3 scenarios in 2020 and 2035 (km2).
4 Discussion
4.1 The value of carbon storage in national park
As one of China’s inaugural national parks, HNTRNP protects a core tropical ecosystem where exceptional biodiversity and high carbon density are vital for regional ecological balance (Wei et al., 2024). Consequently, quantifying its carbon storage is essential. Such an assessment serves a dual purpose: it clarifies the park’s potential contribution to China’s national “dual carbon” strategy and provides a scientific foundation for leveraging national parks in global climate governance. (Nandal et al., 2023). While the literature on forest carbon storage is robust (Wu et al., 2023; Zhang H. et al., 2024), the role of tropical montane rainforests as carbon sinks in global climate research has been relatively underexplored (Pan et al., 2024). The rainforest ecosystem in central Hainan exhibits considerable carbon storage capacity and, due to its rich biodiversity, holds notable ecological value in global climate response (Wang J. et al., 2023; Du et al., 2024). However, Hainan’s economic development, combined with the expansion of infrastructure and agricultural operations, poses an increasing threat to the ecology. This might lower forest cover, hinder carbon sequestration, and even turn the land into a carbon source. Furthermore, biodiversity loss and ecosystem degradation threaten regional ecological security and climate stability (Lapola et al., 2023).
Disentangling the effects of human pressures from the outcomes of conservation initiatives on Hainan’s rainforest requires a spatiotemporal analysis of how land-use change governs its carbon storage capacity. While the PLUS–InVEST modeling framework is widely used, our study provides a novel contribution through its application to HNTRNP—China’s only large-scale tropical rainforest ecosystem and a globally significant carbon sink. This study specifically examines the HNTRNP, utilizing GIS and the InVEST carbon storage module to analyze spatial carbon storage patterns and predict the consequences of different land-use scenarios. By addressing existing gaps in carbon storage data for Hainan’s rainforest, this research provides valuable insights for ecological protection and management within national parks. The results not only establish a scientific foundation for sustainable management of the Hainan rainforest but also contribute to regional carbon balance, promote low-carbon development in Hainan and beyond, facilitate the transition from carbon sources to sinks, optimize national ecological security, and significantly advance the implementation of the “dual carbon” strategy.
HNTRNP, as a core tropical ecosystem and one of China’s first national parks, holds unique biodiversity and substantial carbon storage capacity, which are critical for regional carbon balance (Wei et al., 2024). Our study reveals that the park’s average carbon density (257.65 Mg/hm², Table 5) is 38% higher than Hainan’s provincial average (163.70 Mg/hm², Wu et al., 2024) and surpasses coastal mangrove forests (217.00 Mg/hm², Shi et al., 2024), underscoring its role as a key carbon sink. This aligns with the global tropical rainforest average (241.6 Mg/hm², Pan et al., 2011), validating the park’s significance in climate mitigation.
However, our temporal analysis (1980–2020) reveals a “increase-decrease-increase” trajectory in carbon storage, with a notable decline of 0.65 Tg between 2000–2010 (Figure 6). This decline correlates with the conversion of 23.5 km² cropland to water bodies in Bawangling due to the Daguangba Reservoir (Table 5, CV = 23.11%), demonstrating how infrastructure development can fragment carbon storage. Conversely, the post-2010 rebound (0.58 Tg increase) is attributed to grassland-to-forest conversion in Wuzhishan and Limushan (Table 5, carbon density: 240.40–255.60 Mg/hm²), illustrating the effectiveness of ecological restoration policies. Overall, the results fall within the confidence intervals established by previous research, with the calculated average suggesting a slight overestimation of the total carbon storage in Hainan’s tropical rainforest ecosystem. This highlights areas that warrant further review and refinement in future modeling efforts.
4.2 Determinants of carbon storage in HNTRNP
Land use patterns directly impact terrestrial ecosystems and subsequently explain the variance in regional carbon storage, as corroborated by substantial research (Cuni-Sanchez et al., 2021; Yao et al., 2024). Forest and cropland are typically the predominant land types contributing to regional carbon sinks (Seitz et al., 2023), while the expansion of built-up areas represents an important factor reducing carbon stocks (Gong et al., 2023). Therefore, this study further assessed the contributions of 10 influencing factors to forestland, cropland and built-up areas (as shown in Figure 9), providing insights into the drivers underlying spatial changes in carbon storage. In HNTRNP, where forests comprise over 80% of the landscape, elevation, NDVI, and hydrological proximity emerged as primary determinants of carbon storage capacity. The positive correlation between forest distribution and elevation aligns with ecoclimatic theory, as cooler temperatures and increased precipitation at higher altitudes foster the growth of carbon-dense tropical tree species (Pan et al., 2024). The results demonstrate that high-elevation areas like Yinggeling and Jianfengling are stable, high-value carbon sinks (high density, low CV). Management should therefore prioritize and reinforce strict protection policies in these core zones to safeguard the park’s most critical carbon assets. These areas should be designated as “no-go” zones for any new infrastructure or intensive tourism.
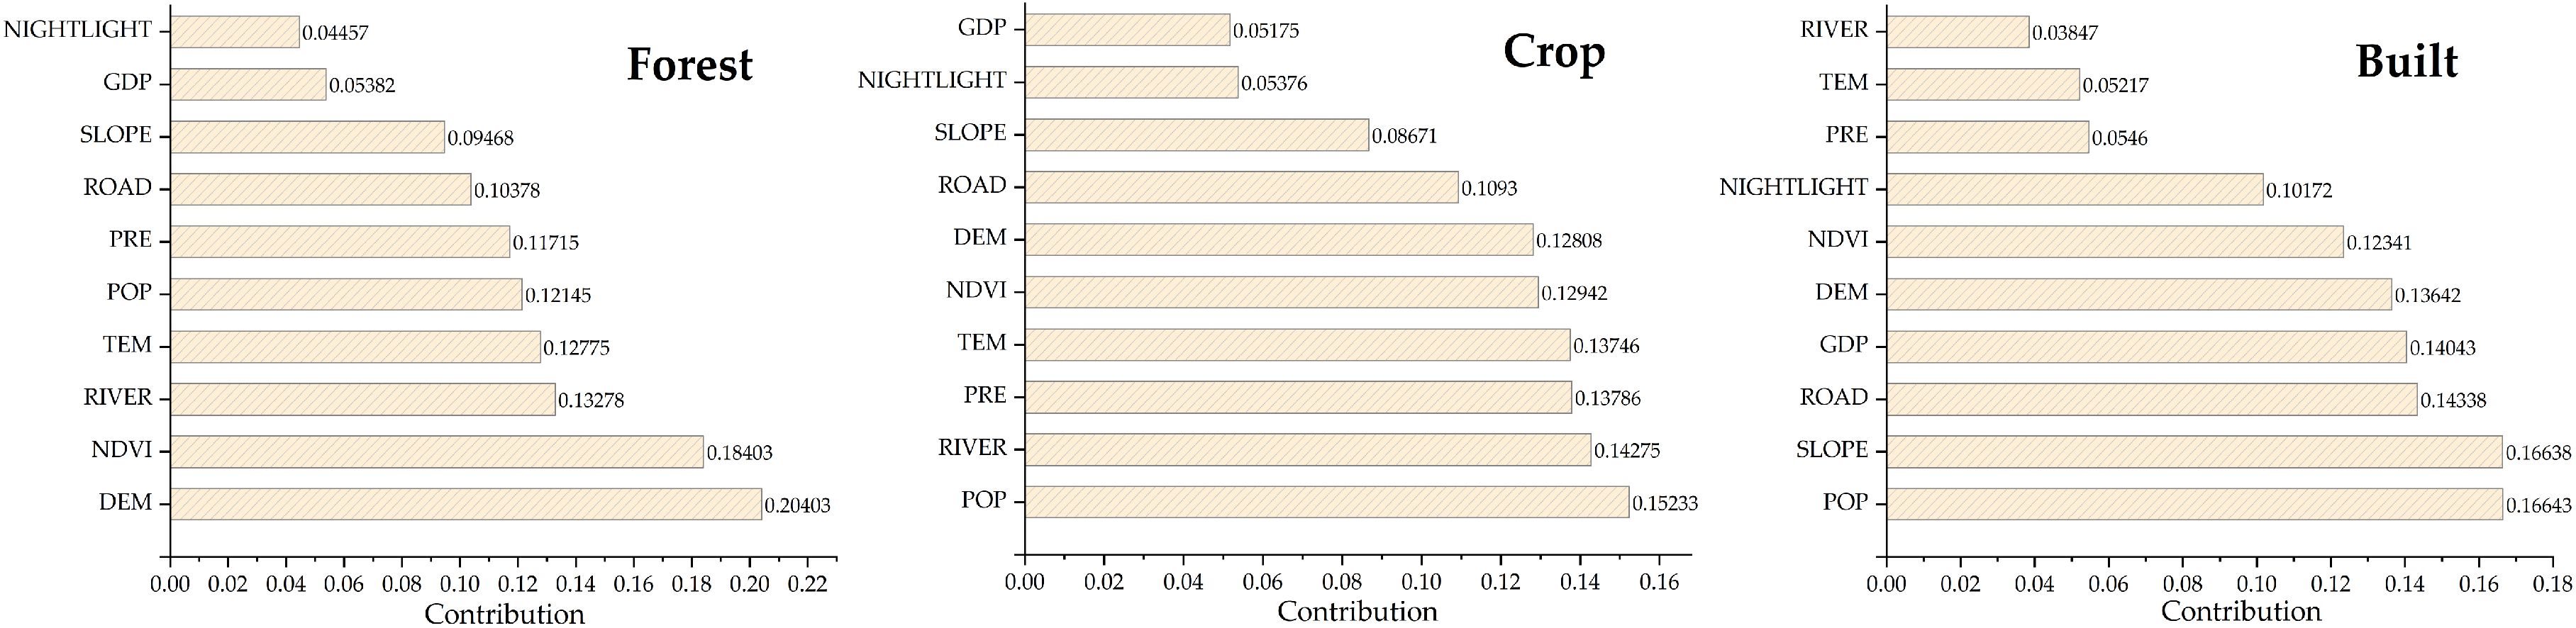
Figure 9. Contribution of driving factors to forest, crop and built in HNTRNP. NIGHTLIGHT refers to nighttime light index; GDP is Gross Domestic Product; DEM is Digital Elevation Model (here referring to altitude); ROAD is buffer distance from roads; RIVER is buffer distance from water bodies; PRE is precipitation; POP is population density; TEM is air temperature; NDVI is Normalized Difference Vegetation Index.
Built land expansion in HNTRNP is primarily governed by population density, topographic slope, and transportation networks, consistent with Hainan’s broader urbanization trajectory (Yao et al., 2024). The clustering of built-up areas in low-lying, accessible regions reflects economic efficiency but exacerbates deforestation and habitat fragmentation, thereby threatening carbon sinks. The spatiotemporal dynamics of carbon storage within HNTRNP are strongly linked to major land-use changes driven by both policy and infrastructure projects. The most significant fluctuation—the sharp decline between 2000 and 2010—can be directly attributed to the construction of the Daguangba Reservoir. This project led to the inundation of vast areas of cropland, resulting in a substantial loss of terrestrial carbon storage in the Bawangling region. Concurrently, ecological restoration efforts in other areas, such as the shift from grassland to forest cover in Wuzhishan and Limushan, partially offset these losses, highlighting the competing influences on the park’s carbon budget.
4.3 Limitations of the forecast results
The spatiotemporal changes in land cover and carbon stocks of HNTRNP were identified in this work by combining the PLUS-InVEST models based on land use data. However, the models’ forecasting skills are limited (Wu et al., 2024). First, there is a scarcity of study on the carbon concentrations of various land use types in HNTRNP and other tropical rainforest locations in China. This study adopted carbon density values from established inventories for adjacent regions (Liu et al., 2023; Zhang D. et al., 2023), as site-specific measurement data for HNTRNP’s unique tropical montane rainforests remain limited. While this approach adheres to standard practices for landscape-scale carbon modeling, it may not fully resolve microhabitat variations within the park. Future research should prioritize ground-based LiDAR scanning and long-term flux monitoring to develop ecosystem-specific carbon assessment frameworks, thereby enhancing the accuracy of regional carbon modeling; second, the carbon sequestration efficiency of tropical rainforest ecosystems is twice that of other terrestrial forest ecosystems, placing them among those with the highest carbon density (Yao et al., 2024). However, this study’s land use classification lacked sufficient granularity, such as failing to distinguish between natural and plantation forests or the carbon density differences between trees and shrubs, which may affect simulation accuracy (Lázaro-Lobo et al., 2023); simultaneously, fluctuations in carbon density influenced by factors including terrain, vegetation types and soil types were not considered in the model calculations (Rahbar Alam Shirazi et al., 2023), which could impact the simulation outcomes.
5 Conclusions
To understand the historical and future trajectories of land use and carbon storage in HNTRNP, this study applied the PLUS and InVEST models. We first quantified land use changes and their effects on carbon stocks between 1980 and 2020, and then forecasted these dynamics forward to 2035 under various scenarios. This study concludes that: (1) A retrospective analysis spanning 40 years revealed that land use changes in HNTRNP was primarily driven by reciprocal conversions between forest and cropland/grassland, concentrated mainly in the central Bawangling and Yinggeling regions as well as in Wuzhishan and the eastern Diolaoshan areas, demonstrating an overall spatial pattern characterized by dispersed but concentrated changes. (2) Carbon storage in the study area’s ecosystems initially decreased before increasing, totaling 110 Tg while maintaining relative stability, attributed primarily to comprehensive forest protection and systematic restoration implemented across Hainan Province since the 1990s, preserving relative stability in regional land use types. (3) In three simulated scenarios, the projected total carbon storage for 2035 showed consistent levels across two scenarios—remaining stable in line with 2020 levels in the ND scenario and increasing under the EP scenario. This reflects the efficacy of ecological protection policies in safeguarding high carbon density areas such as forests and grasslands, consequently boosting ecosystem carbon sequestration capacities. Future research should prioritize developing ecosystem-specific carbon assessment frameworks for HNTRNP through field measurements. Moreover, to enhance the robustness of forecasts, future modeling efforts should incorporate sensitivity analyses—for example, by using a range of plausible carbon density values to generate confidence intervals around the projections, thereby providing a clearer picture of the potential variability in future carbon storage.
Data availability statement
The original contributions presented in the study are included in the article/supplementary material. Further inquiries can be directed to the corresponding authors.
Author contributions
ZC: Conceptualization, Writing – original draft. XJ: Conceptualization, Methodology, Software, Visualization, Writing – original draft, Writing – review & editing. XP: Software, Writing – original draft. YC: Project administration, Writing – original draft. JL: Investigation, Writing – original draft. TW: Investigation, Writing – original draft. XC: Data curation, Writing – original draft. YL: Data curation, Writing – original draft. TS: Project administration, Writing – original draft.
Funding
The author(s) declare financial support was received for the research and/or publication of this article. This research was funded by the Natural Science Foundation of Hubei Province (2023AFD058) and the Hainan Provincial Science and Technology 518 Program (ZDKJ202008).
Conflict of interest
The authors declare that the research was conducted in the absence of any commercial or financial relationships that could be construed as a potential conflict of interest.
Generative AI statement
The author(s) declare that no Generative AI was used in the creation of this manuscript.
Any alternative text (alt text) provided alongside figures in this article has been generated by Frontiers with the support of artificial intelligence and reasonable efforts have been made to ensure accuracy, including review by the authors wherever possible. If you identify any issues, please contact us.
Publisher’s note
All claims expressed in this article are solely those of the authors and do not necessarily represent those of their affiliated organizations, or those of the publisher, the editors and the reviewers. Any product that may be evaluated in this article, or claim that may be made by its manufacturer, is not guaranteed or endorsed by the publisher.
References
Ariluoma M., Ottelin J., Hautamäki R., Tuhkanen E. M., and Mänttäri M. (2021). Carbon sequestration and storage potential of urban green in residential yards: A case study from Helsinki. Urb. For. Urban Green. 57, 126939. doi: 10.1016/j.ufug.2020.126939
Babbar D., Areendran G., Sahana M., Sarma K., Raj K., and Sivadas A. (2021). Assessment and prediction of carbon sequestration using markov chain and inVEST model in sariska tiger reserve, India. J. Clean. Prod. 278, 123333. doi: 10.1016/j.jclepro.2020.123333
Bacani V. M., da Silva B. H., Sato A. A., Sampaio B. D., da Cunha E. R., Vick E. P., et al. (2024). Carbon storage and sequestration in a eucalyptus productive zone in the Brazilian Cerrado, using the Ca-Markov/Random Forest and InVEST models. J. Clean. Prod. 444, 141291. doi: 10.1016/j.jclepro.2024.141291
Chang X., Xing Y., Wang J., Yang H., and Gong W. (2022). Effects of land use and cover change (LUCC) on terrestrial carbon stocks in China between 2000 and 2018. Resour. Conserv. Recy. 182, 106333. doi: 10.1016/j.resconrec.2022.106333
Cuni-Sanchez A., Sullivan M. J. P., Platts P. J., Lewis S. L., Marchant R., Imani G., et al. (2021). High aboveground carbon stock of African tropical montane forests. Nature. 596, 536–542. doi: 10.1038/s41586-021-03728-4
Du L., Liu H., Liu H., Liu W., Quan Z., and Zhang Y. (2024). Value assessment and prediction of regulating ecosystem services in hainan tropical rainforest national park, China. Sustainability. 16, 9170. doi: 10.3390/su16219170
Fan L., Cai T., Wen Q., Han J., Wang S., Wang J., et al. (2023). Scenario simulation of land use change and carbon storage response in Henan Province, China: 1990–2050. Ecol. Indic. 154, 110660. doi: 10.1016/j.ecolind.2023.110660
Goldstein A., Turner W. R., Spawn S. A., Anderson-Teixeira K. J., Cook-Patton S., Fargione J., et al. (2020). Protecting irrecoverable carbon in Earth’s ecosystems. Nat. Clim. Change 10, 287–295. doi: 10.1038/s41558-020-0738-8
Gong W., Duan X., Sun Y., Zhang Y., Ji P., Tong X., et al. (2023). Multi-scenario simulation of land use/cover change and carbon storage assessment in Hainan coastal zone from perspective of free trade port construction.J. Clean. Prod. 385, 135630. doi: 10.1016/j.jclepro.2022.135630
Guo W., Teng Y., Li J., Yan Y., Zhao C., Li Y., et al. (2024). A new assessment framework to forecast land use and carbon storage under different SSP-RCP scenarios in China. Sci. Total Environ. 912, 169088. doi: 10.1016/j.scitotenv.2023.169088
He C., Zhang D., Huang Q., and Zhao Y. (2016). Assessing the potential impacts of urban expansion on regional carbon storage by linking the LUSD-urban and InVEST models. Environ. Model. Software 75, 44–58. doi: 10.1016/j.envsoft.2015.09.015
Heinrich V. H., Dalagnol R., Cassol H. L., Rosan T. M., De Almeida C. T., Silva Junior C. H., et al. (2021). Large carbon sink potential of secondary forests in the Brazilian Amazon to mitigate climate change. Nat. Commun. 12, 1785. doi: 10.1038/s41467-021-22050-1
Huang Y., Xie F., Song Z., and Zhu S. (2023). Evolution and multi-scenario prediction of land use and carbon storage in jiangxi province. Forests. 14, 1933. doi: 10.3390/f14101933
Kusi K. K., Khattabi A., Mhammdi N., and Lahssini S. (2020). Prospective evaluation of the impact of land use change on ecosystem services in the Ourika watershed, Morocco. Land Use Policy. 97, 104796. doi: 10.1016/j.landusepol.2020.104796
Lama S., Zhang J., and Luan X. (2024). Evaluating the conservation status and effectiveness of multi-type protected areas for carbon sequestration in the loess plateau, China. Atmosphere. 15, 764. doi: 10.3390/atmos15070764
Lapola D. M., Pinho P., Barlow J., Aragão L. E., Berenguer E., Carmenta R., et al. (2023). The drivers and impacts of Amazon forest degradation. Science. 379, eabp8622. doi: 10.1126/science.abp8622
Lázaro-Lobo A., Ruiz-Benito P., Cruz-Alonso V., and Castro-Díez P. (2023). Quantifying carbon storage and sequestration by native and non-native forests under contrasting climate types. Global Change Biol. 29, 4530–4542. doi: 10.1111/gcb.16810
Li Y., Brando P. M., Morton D. C., Lawrence D. M., Yang H., and Randerson J. T. (2022). Deforestation-induced climate change reduces carbon storage in remaining tropical forests. Nat. Commun. 13, 1964. doi: 10.1038/s41467-022-29601-0
Liang X., Guan Q., Clarke K. C., Liu S., Wang B., and Yao Y. (2021). Understanding the drivers of sustainable land expansion using a patch-generating land use simulation (PLUS) model: A case study in Wuhan, China. Comput. Environ. Urban. Syst. 85, 101569. doi: 10.1016/j.compenvurbsys.2020.101569
Liu L., Qu J., Gao F., Maraseni T. N., Wang S., Aryal S., et al. (2024). Land use carbon emissions or sink: research characteristics, hotspots and future perspectives. Land. 13, 279. doi: 10.3390/land13030279
Liu J., Yan Q., and Zhang M. (2023). Ecosystem carbon storage considering combined environmental and land-use changes in the future and pathways to carbon neutrality in developed regions. Sci. Total Environ. 903, 166204. doi: 10.1016/j.scitotenv.2023.166204
Mo L., Zohner C. M., Reich P. B., Liang J., de Miguel S., Nabuurs G.-J., et al. (2023). Integrated global assessment of the natural forest carbon potential. Nature. 624, 92–101. doi: 10.1038/s41586-023-06723-z
Nandal A., Yadav S. S., Rao A. S., Meena R. S., and Lal R. (2023). Advance methodological approaches for carbon stock estimation in forest ecosystems. Environ. Monit. Assess. 195, 315. doi: 10.1007/s10661-022-10898-9
Pan Y., Birdsey R. A., Fang J., Houghton R., Kauppi P. E., Kurz W. A., et al. (2011). A large and persistent carbon sink in the world’s forests. Science. 333, 988–993. doi: 10.1126/science.1201609
Pan Y., Birdsey R. A., Phillips O. L., Houghton R. A., Fang J., Kauppi P. E., et al. (2024). The enduring world forest carbon sink. Nature. 631, 563–569. doi: 10.1038/s41586-024-07602-x
Qiu Z., Feng Z., Song Y., Li M., and Zhang P. (2020). Carbon sequestration potential of forest vegetation in China from 2003 to 2050: Predicting forest vegetation growth based on climate and the environment. J. Clean. Prod. 252, 119715. doi: 10.1016/j.jclepro.2019.119715
Rahbar Alam Shirazi F., Shahbazi F., Rezaei H., and Biswas A. (2023). Digital assessments of soil organic carbon storage using digital maps provided by static and dynamic environmental covariates. Soil Use Manage. 39, 948–974. doi: 10.1111/sum.12900
Seitz D., Fischer L. M., Dechow R., Wiesmeier M., and Don A. (2023). IThe potential of cover crops to increase soil organic carbon storage in German croplands. Plant and Soil 488, 157–173. doi: 10.1007/s11104-022-05438-w
Shao Z., Chen C., Liu Y., Cao J., Liao G., and Lin Z. (2023). Impact of land use change on carbon storage based on FLUS-inVEST model: A case study of chengdu–chongqing urban agglomeration, China. Land. 12, 1531. doi: 10.3390/land12081531
Shi X., Wu L., Zheng Y., Zhang X., Wang Y., Chen Q., et al. (2024). Dynamic estimation of mangrove carbon storage in hainan island based on the inVEST-PLUS model. Forests. 15, 750. doi: 10.3390/f15050750
Sun L., Yu H., Sun M., and Wang Y. (2023). Coupled impacts of climate and land use changes on regional ecosystem services. J. Environ. Manage. 326, 116753. doi: 10.1016/j.jenvman.2022.116753
Walker W. S., Gorelik S. R., Cook-Patton S. C., Baccini A., Baccini A., Farina M. K., Solvik K. K., et al. (2022). The global potential for increased storage of carbon on land. PNAS 119, e2111312119. doi: 10.1073/pnas.2111312119
Wang S., Huang Y., Jiang X., Wang T., and Jin Y. (2023). Identification and optimization of ecological security patterns in the xiangyang metropolitan area. IEEE J-Stars. 16, 8671–8679. doi: 10.1109/JSTARS.2023.3310154
Wang Z., Li X., Mao Y., Li L., Wang X., and Lin Q. (2022). Dynamic simulation of land use change and assessment of carbon storage based on climate change scenarios at the city level: A case study of Bortala, China. Ecol. Indic. 134, 108499. doi: 10.1016/j.ecolind.2021.108499
Wang J., Wang H., Ding Y., Zhang Y., Cong W., Zang R., et al. (2023). Shifting cultivation and logging change soil organic carbon functional groups in tropical lowland rainforests on Hainan Island in China. For. Ecol. Manage. 549, 121447. doi: 10.1016/j.foreco.2023.121447
Wei L., Li M., Ma Y., Wang Y., Wu G., Liu T., et al. (2024). Construction of an ecological security pattern for the national park of hainan tropical rainforest on the basis of the importance of the function and sensitivity of its ecosystem services. Land. 13, 1618. doi: 10.3390/land13101618
Wu C., Coffield S. R., Goulden M. L., Randerson J. T., Trugman A. T., and Anderegg W. R.. (2023). Uncertainty in US forest carbon storage potential due to climate risks. Nat. Geosci. 16, 422–429. doi: 10.1038/s41561-023-01166-7
Wu W., Huang Z., Sun Z., Zhang J., Wang S., Fang M., et al. (2024). Simulation and attribution analysis of terrestrial ecosystem carbon storage of Hainan Island from 2015 to 2050. Sci. Total Environ. 917, 170348. doi: 10.1016/j.scitotenv.2024.170348
Yao X., Zhou L., Wu T., Yang X., and Ren M. (2024). Ecosystem services in National Park of Hainan Tropical Rainforest of China: Spatiotemporal dynamics and conservation implications. J. Nat. Conserv. 80, 12649. doi: 10.1016/j.jnc.2024.126649
Yin Y., Yang R., Song Z., Lu Y., Zhang Y., Zhang L., et al. (2024). Simulation of wetland carbon storage in coastal cities under the coupled framework of socio-economic and ecological sustainability: A case study of Dongying city. Sustain. City Soc 108, 105481. doi: 10.1016/j.scs.2024.105481
Yu Y., Guo B., Wang C., Zang W., Huang X., Wu Z., et al. (2023). Carbon storage simulation and analysis in Beijing-Tianjin-Hebei region based on CA-plus model under dual-carbon background. Geomat. Nat. Hazards. Risk. 14, 2173661. doi: 10.1080/19475705.2023.2173661
Yue C., Ciais P., Houghton R. A., and Nassikas A. A. (2020). Contribution of land use to the interannual variability of the land carbon cycle. Nat. Commun. 11, 3170. doi: 10.1038/s41467-020-16953-8
Zhang Z., Jiang W., Peng K., Wu Z., Ling Z., and Li Z. (2023). Assessment of the impact of wetland changes on carbon storage in coastal urban agglomerations from 1990 to 2035 in support of SDG15.1. Sci. Total Environ. 877, 162824. doi: 10.1016/j.scitotenv.2023.162824
Zhang Y., Liao X., and Sun D. (2024). A coupled inVEST-PLUS model for the spatiotemporal evolution of ecosystem carbon storage and multi-scenario prediction analysis. Land. 13, 509. doi: 10.3390/land13040509
Zhang H., Liu S., Yu J., Li J., Shangguan Z., and Deng L. (2024). Thinning increases forest ecosystem carbon stocks. For. Ecol. Manage. 555, 121702. doi: 10.1016/j.foreco.2024.121702
Zhang T., Zhang W., Yang R., Liu Y., and Jafari M. (2021). CO2 capture and storage monitoring based on remote sensing techniques: A review. J. Clean. Prod. 281, 124409. doi: 10.1016/j.jclepro.2020.124409
Zhang D., Zhao Y., and Wu J. (2023). Assessment of carbon balance attribution and carbon storage potential in China's terrestrial ecosystem. Resour. Conserv. Recy. 189, 106748. doi: 10.1016/j.resconrec.2022.106748
Zhong C., Bei Y., Gu H., and Zhang P. (2022). Spatiotemporal evolution of ecosystem services in the Wanhe watershed based on cellular automata (CA)-Markov and InVEST models. Sustainability. 14, 13302. doi: 10.3390/su142013302
Zhong Z., Chen Y., Fu M., Li M., Yang K., Zeng L., et al. (2023). Role of CO2 geological storage in China's pledge to carbon peak by 2030 and carbon neutrality by 2060. Energy. 272, 127165. doi: 10.1016/j.energy.2023.127165
Keywords: land use change, carbon storage, PLUS-InVEST model, multi-scenario, Hainan Tropical Rainforest National Park (HNTRNP)
Citation: Chen Z, Jiang X, Pan X, Chen Y, Lei J, Wu T, Chen X, Li Y and Shi T (2025) Multi-scenario land use simulation and carbon storage prediction analysis in the Hainan Tropical Rainforest National Park. Front. Ecol. Evol. 13:1539340. doi: 10.3389/fevo.2025.1539340
Received: 04 December 2024; Accepted: 24 October 2025;
Published: 17 November 2025.
Edited by:
João de Deus Vidal Jr., Leipzig University, GermanyCopyright © 2025 Chen, Jiang, Pan, Chen, Lei, Wu, Chen, Li and Shi. This is an open-access article distributed under the terms of the Creative Commons Attribution License (CC BY). The use, distribution or reproduction in other forums is permitted, provided the original author(s) and the copyright owner(s) are credited and that the original publication in this journal is cited, in accordance with accepted academic practice. No use, distribution or reproduction is permitted which does not comply with these terms.
*Correspondence: Xiaorong Jiang, amlhbmd4ckBoYnVhcy5lZHUuY24=; Tiezhu Shi, dGllemh1c2hpQHN6dS5lZHUuY24=