 Kaede Miyata
 Yuta Kusakabe2†
 Hiroshi Honda
- 1R&D Safety Science Research, Kao Corporation, Haga, Tochigi, Japan
- 2Exihibition, Nakagawa Aquatic Park, Otawara, Tochigi, Japan
Metabarcoding analysis using fish environmental RNA (eRNA) has demonstrated higher performance compared to that using fish environmental DNA (eDNA) in the Naka River in Japan. However, the results from representative sampling sites were insufficient to estimate the diversity of organisms in the entire river. Therefore, we validated the evaluation performance using additional traditional field survey (TFS) data. Data from seven traditional field surveys on fish, covering the area near the sampling points where eDNA/eRNA metabarcoding analyses were conducted, were obtained. Ten fish species were newly identified, with nine determined using the eDNA and eRNA metabarcoding analyses. Performance was evaluated in terms of both positive predictive value (PPV) and sensitivity. Except for species specifically detected only near the estuary, the additional use of field survey data increased the PPV from 26.5% to 36.3% for eDNA and from 43.6% to 57.7% for eRNA. After combining the results of multiple surveys, the sensitivities for eDNA and eRNA increased from 52.4% to 67.4% and from 57.1% to 69.8%, respectively. The increase in PPV was more pronounced for eRNA than for eDNA, indicating that eRNA does not decrease PPV when multiple datasets are merged. The superior performance of eRNA compared to eDNA suggests that eRNA metabarcoding analysis is valuable for accurately conducting ecological surveys and biodiversity assessments and may reduce the labor required for monitoring the entire river by optimizing sampling points for metabarcoding analysis.
1 Introduction
Metabarcoding analysis using environmental nucleic acids (eNA), which analyzes environmental DNA (eDNA) or RNA (eRNA) released from macro-organisms in aquatic environments, is the most promising method used for ecological surveys and biodiversity assessments (Bohmann et al., 2014; Deiner et al., 2017; Ficetola et al., 2008). The eNA metabarcoding analysis assesses non-invasively and provides biodiversity information, such as species richness and abundance (Dougherty et al., 2016; Foote et al., 2012; Fukumoto et al., 2015; Port et al., 2016; Thomsen et al., 2012a, 2012b; Yamamoto et al., 2016; Yamanaka and Minamoto, 2016). However, eNA can persist in the environment; therefore, it may lead to false positives. In general, false positive is defined as the species that do not inhabit near the sampling point. Mitigating false positives in metabarcoding analyses is a major challenge in interpreting molecular ecological surveys (Cristescu and Hebert, 2018; Ficetola et al., 2016).
False positives are generated due to two major causes: 1) the movement of eNA from upstream or exogenous sources areas (e.g., contamination from fishery and wastewater treatment plants (Inoue et al., 2023), and 2) rolling up of eNA from old sediments (Kuwae et al., 2020; Sakata et al., 2020). Thus, if more degradable molecules are utilized, molecular ecological surveys using high spatiotemporal resolution can mitigate false-positive effects. eRNA has attracted attention from researchers because it is less stable than eDNA (Cristescu, 2019; Veilleux et al., 2021; Yates et al., 2021). Miyata et al. (2021) took advantage of the fact that marine fish can be defined as false positive in rivers, and indicated that fish eRNA metabarcoding analysis effectively mitigates false positives due to contamination from exogenous sources. The performance was evaluated in terms of both positive predictivity (positive predictive value; PPV), the proportion of species identified by the analysis that were present in traditional field survey (TFS), and Sensitivity, the proportion of species that were found to be present in TFS by the analysis. In a study comparing the use of a TFS and the metabarcoding analysis to identify organisms in the entire river using representative sampling sites, the results revealed that the PPV of eRNA metabarcoding (43.6%) was higher than that of eDNA (26.5%), and eRNA had a few false positive species from outside areas (seawater fishes). Although sensitivity was considered high (90.0% and 100% in eDNA and eRNA, respectively) when narrowing down to a sampling site, many unknown species were detected using the metabarcoding analysis. Thus, their reported sensitivity and PPV were insufficient for the analysis of the entire river owing to a lack of sufficient TFS data to evaluate the performance of eRNA. TFS data play a critical role in determining true positive species for evaluating the likelihood of false positives, or in determining the target population of species to be evaluated for sensitivity.
In the present study, we analyzed additionally obtained TFS data to validate and interpret the performance of fish eRNA metabarcoding analyses to detect organisms in the entire Naka River in Japan from representative sampling sites.
2 Materials and methods
2.1 Species detected using the eDNA and eRNA metabarcoding analysis
From the molecular ecological surveys that have previously carried out at two representative sites in the Naka River, 83 and 55 species have been detected in the eDNA and eRNA, respectively, and 48 species have been identified as common species (Miyata et al., 2021). The principle of the protocol for preparing the species list is briefly described below. Briefly, a 3 L of water samples (3.0 L, n = 22:1 sample/site/day × 2 sites × 11 days) were collected from October 2018 to February 2019 at Nakagawa-oohashi (N36°32’55”, E140°19’34”) and Shin-nakabashi (N36°45’26”, E140°08’30”) on the Naka River in Japan, giving a total of 22 samples. The samples were filtered using Sterivex™ filter units (nominal pore size, 0.45 μm; Millipore, Billerica, MA, USA). Total eDNA was extracted using a DNeasy Blood and Tissue Kit (Qiagen, Hilden, Germany). Total eRNA was extracted using a ChargeSwitch total RNA cell kit (Thermo Fisher Scientific, Waltham, MA, USA) with DNase treatment, and cDNA was synthesized using a PrimeScript II 1st strand cDNA synthesis kit (TaKaRa Bio Inc., Shiga, Japan). Amplicon libraries were obtained via polymerase chain reaction (PCR) amplification using MiFish primers. The first PCR amplification was replicated four times. The second PCR was conducted to add adaptor and index sequences. The samples were subjected to MiSeq sequencing (Illumina, San Diego, CA, USA). Multiple FASTQ files were extracted using the FASTX Toolkit (ver. 0.0.14 [National Institute of Health, Bethesda, MD, USA], and alternative sequence variants (ASVs) were produced using DADA2 (Callahan et al., 2016). The primer sequence, 120 bp from the 3′ end, and the chimeras were removed using Qiime 2 (Bolyen et al., 2019) (ver. 2020.8). All processed ASVs were analyzed using the BLASTN program (ver. 2.9.0 [National Institute of Health]) using the MitoFish database (version 3.53, http://mitofish.aori.u-tokyo.ac.jp/ [University of Tokyo, Tokyo, Japan]).
2.2 Traditional field survey and the database
A previous study has analyzed the open data from TFS, and the results have revealed that 42 species inhabit the entire Naka River (Table 1) (Miyata et al., 2021). TFS data have been extracted from the Ministry of Land Infrastructure and Transport – River Environmental Database (MLIT-RE database). We compensated for the variations in the TFS data by using the average values from the available TFS data over the last 10 years during autumn and winter. However, false negatives may have occurred because of the limited number of inspections and survey areas. Ecological surveys of fish are prohibited for companies in Japan; therefore, we sought fish ecological survey data from permitted organizations like government agencies and obtained TFS data from a fish survey conducted at the Naka River system in the Tochigi Prefecture. The metabarcoding analysis (Miyata et al., 2021) was conducted in the Tochigi Prefecture, and the open data (MLIT-RE database) used contained other prefectural data (15 TFSs in October 2010, February 2011, and October 2016). A previous study retrospectively re-evaluated the performance of eDNA/eRNA metabarcoding analysis.
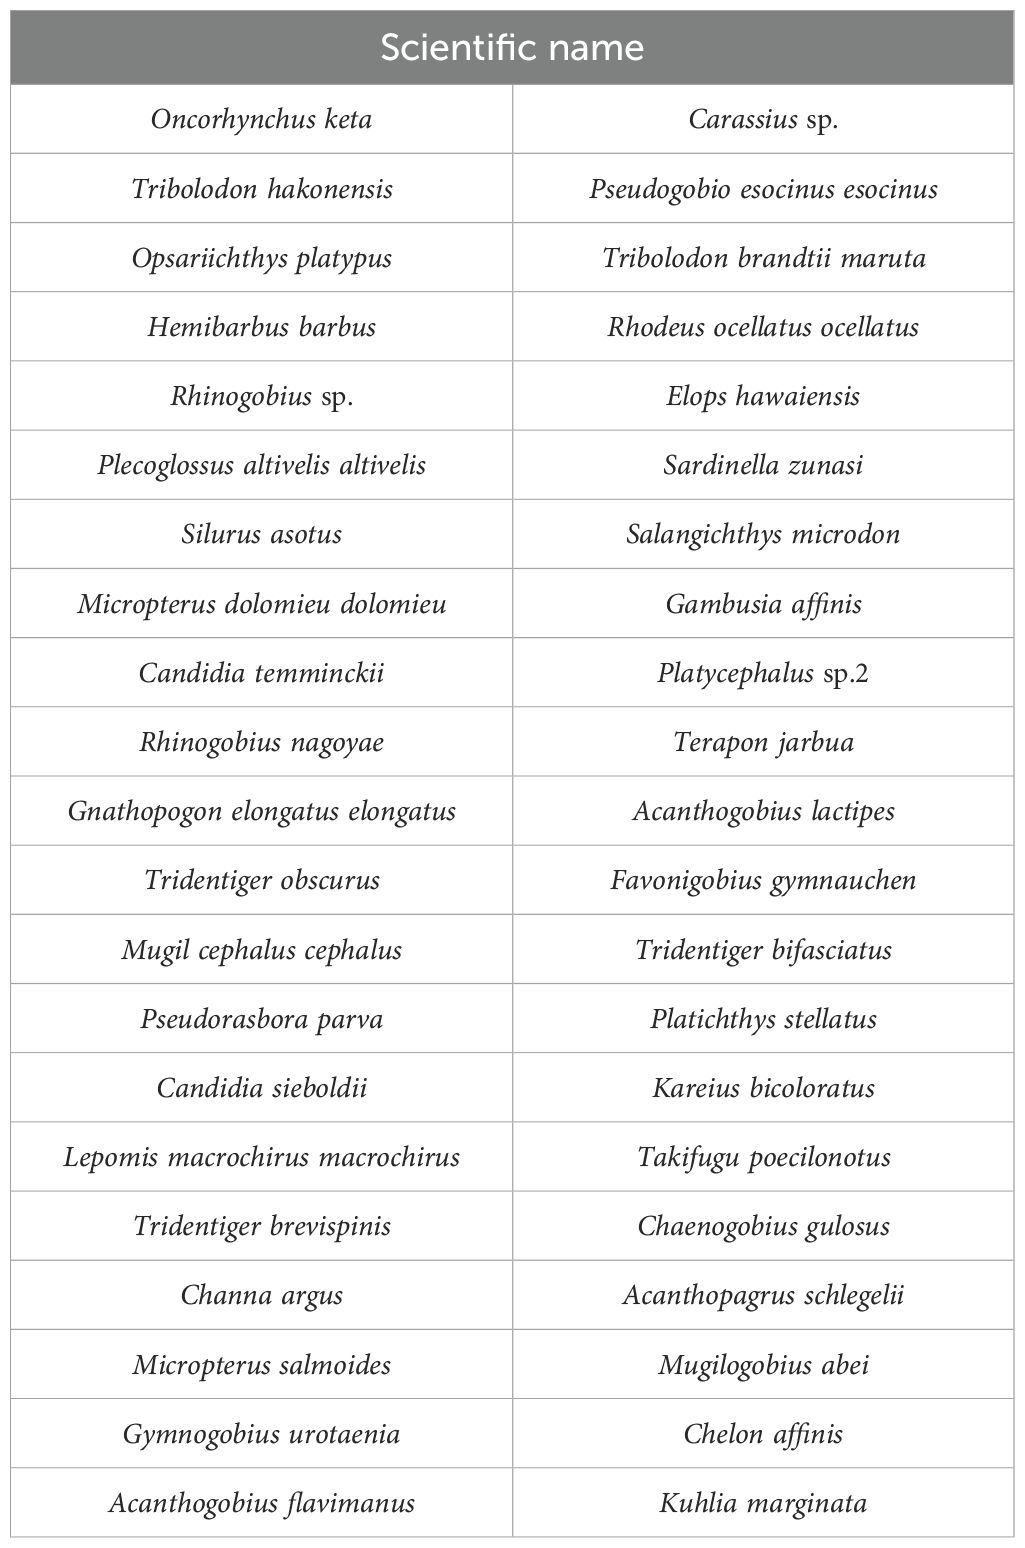
Table 1. List of fish species reported by Miyata et al. (2021).
Seven TFSs, which is near the sampling points of the metabarcoding (Nakagawa-oohashi [N36°32’55”, E140°19’34”] and Shin-nakabashi [N36°45’26”, E140°08’30”]) on the Naka River in Japan from September 2020 to January 2021, were conducted by the Tochigi Nakagawa Aquatic Park. Surveys were carried out at 20 points from the upper to the middle of the Naka River, using traditional sampling methods, such as scoop nets of approximately 5 mm mesh size, fishing floats, and electrofishing (LR-24 Electrofisher; Smith-Root, Vancouver, WA, USA) with an output voltage range of 200–400 V. The study was qualitative because the abundance of species data was treated as reference information. In the performance evaluation, we focused on species newly identified in the present survey and evaluated whether they were detected using eDNA or eRNA metabarcoding, as conducted by Miyata et al. (2021).
2.3 Performance evaluation of eDNA and eRNA metabarcoding analyses in ecological surveys
To evaluate the performance of eDNA/eRNA metabarcoding analysis as an alternative method for TFS, sensitivity and PPV were analyzed according to Miyata et al. (2021). PPV is the proportion of species identified by the analysis that were present in the site (TFS data), and sensitivity is the proportion of species that were found to be present in the site (TFS data) by the analysis. True positives were treated as “identified species using metabarcoding analysis of the observed species in TFS.” Specificity and negative predictivity were not evaluated because negatives in the TFS do not indicate true negatives due to their low sensitivity. These indices are widely used in medical research and detection/diagnosis method development, and recently, often used in performance evaluation of molecular ecological surveys (An et al., 2023; Cristescu, 2019; Li et al., 2024; Miyata et al., 2021; Veilleux et al., 2021; Yates et al., 2021). Even highly sensitive methods, if they generate more false positives than true positives, the method cannot be trusted (Jones et al., 2020).
Sensitivity and PPV were calculated using the following formulas:
In general, it is not possible to determine whether a species detected only in the metabarcoding analyses is a true or false positive. This is because the species may simply not be detected in the TFS. Therefore, in this study, we followed the procedure of Miyata et al. (2021) and defined false positives as saltwater or brackish water fish that should not be detected at the sampling sites.
The average total read numbers at the Nakagawa-oohashi and Shin-nakabashi sampling sites were used to compare the TFS data for the entire Naka River. Venn diagrams were used to compare the number of species determined using eDNA, eRNA, and TFS, considering that used in a previous study (Miyata et al., 2021) and TFS from an aquarium study (Seven TFSs conducted by the Tochigi Nakagawa Aquatic Park in this study). Furthermore, sensitivity and PPV were calculated, excluding species detected as estuarine-specific in the TFS. In this study, Kaimonbashi was defined as an estuary.
An F-test was used to determine the homogeneity of variance across sensitivities and positive predictivities. To compare eDNA and eRNA, a two-tailed paired t-test was performed when the underlying distributions were parametric and the variance was homogeneous, whereas the Wilcoxon signed-rank test was performed using Origin 2019b (OriginLab, Northampton, MA, USA) when the variance was heterogeneous. Statistical significance was set at p < 0.05.
3 Results
3.1 Newly identified species in additional traditional field survey
Ten species (Cottus pollux, Cottus reinii, Lefua echigonia, Misgurnus anguillicaudatus, Oncorhynchus mykiss, Salvelinus leucomaenis pluvius, Tachysurus tokiensis, Cobitis biwae species complex, Lethenteron sp.N./Lethenteron sp.S., and Oncorhynchus masou masou) were newly identified in surveys that were conducted at the Tochigi Nakagawa Aquatic Park (Table 2). Most species were detected using the eDNA or eRNA metabarcoding analyses (Figure 1). C. biwae species complex detected in the TFS comprises Cobitis sp. BIWAE type A, B, C, or D.Lethenteron sp.N./Lethenteron sp.S. detected in TFS comprises either Lethenteron sp.N. or Lethenteron sp.S. Cobitis sp. BIWAE type C and Lethenteron sp.S. were detected in eDNA and eRNA metabarcoding analyses, respectively, and may be undetectable in eDNA and eRNA metabarcoding analyses due to limitations of classification in TFS.
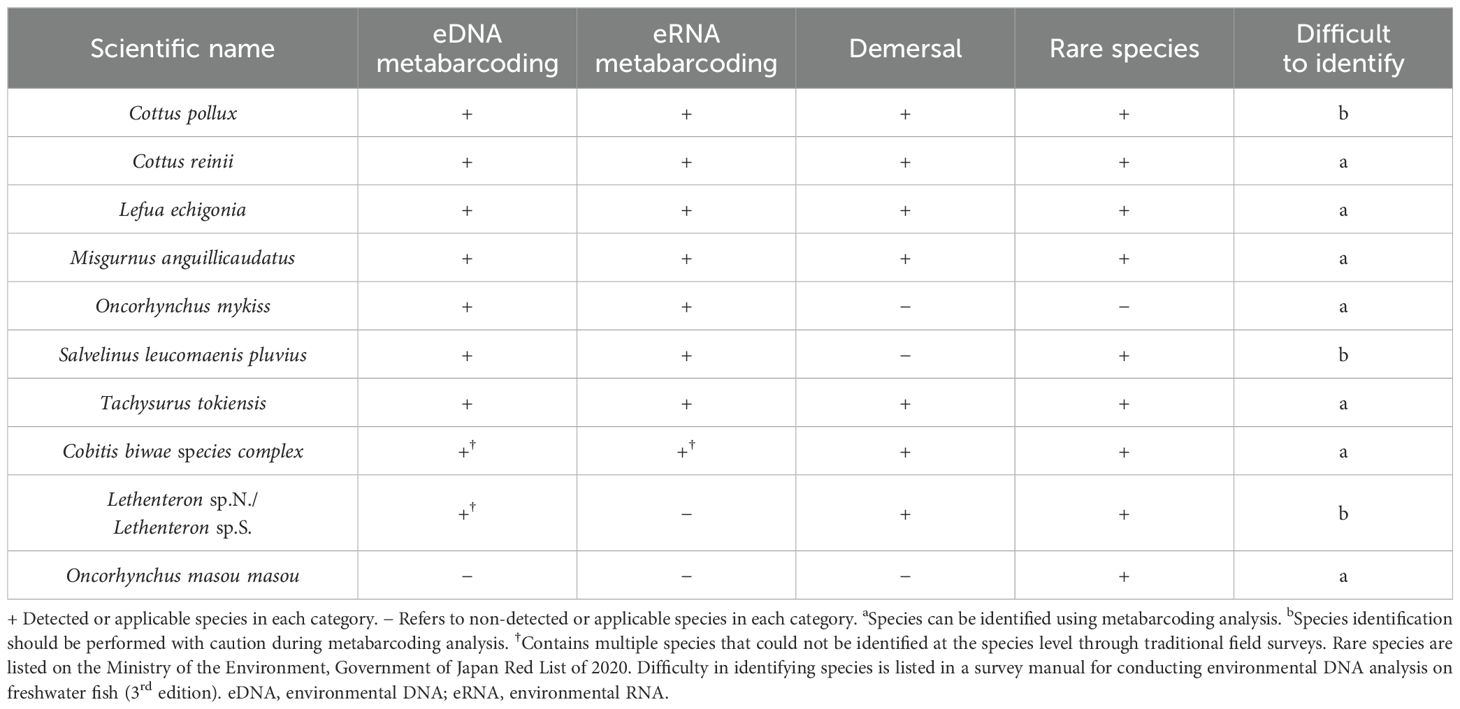
Table 2. Ten species newly detected in traditional field survey and metabarcoding analysis.
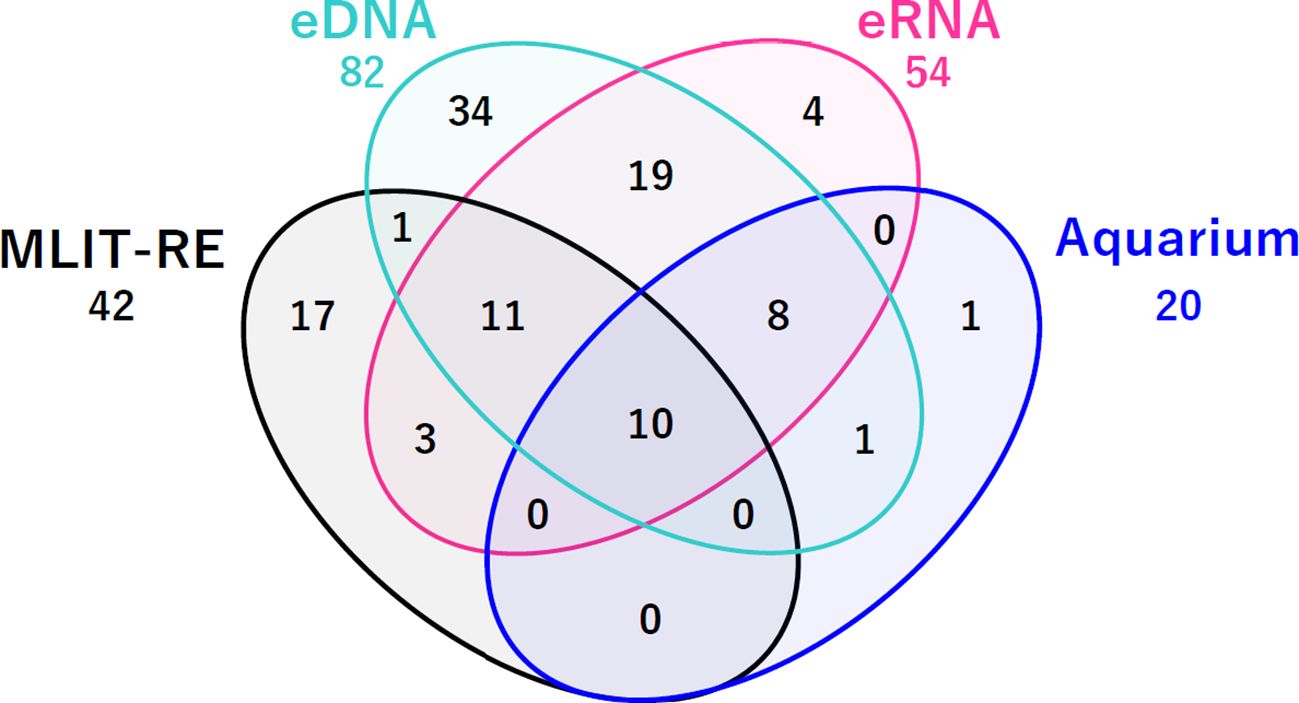
Figure 1. Comparison of environmental DNA and RNA metabarcoding analyses and newly analyzed traditional field survey data obtained from an aquarium survey. eDNA, species detected in eDNA metabarcoding analysis; eRNA, species detected in eRNA metabarcoding analysis; MLIT-RE, traditional field survey data from the Ministry of Land Infrastructure and Transport – River Environmental Database. Aquarium: newly identified species in traditional field surveys conducted by the Tochigi Nakagawa Aquatic Park.
The 10 identified species inhabit rivers in Japan, and 7 species are demersal fish, and 9 species are rare based on the Ministry of the Environment, Government of Japan Red List of 2020 (Ministry of the Environment Government of Japan, 2020) (Table 2). Identifying C. pollux, S. leucomaenis Pluvius, and Lethenteron sp. requires caution considering accuracy in metabarcoding analysis based on a survey manual for conducting eDNA analysis on freshwater fish (3rd edition) (Biodiversity Center of Japan, 2023).
3.2 Performance for the ecological survey of eDNA/eRNA metabarcoding analysis
The newly identified species allowed us to estimate the realistic performance of the eDNA and eRNA metabarcoding analyses, improving the eDNA and eRNA sensitivity and PPV. Sensitivity can be considerably improved by integrating the results of multiple surveys and assuming that a species is present if detected in any of the surveys (Figure 2). In this study, eDNA and eRNA sensitivity increased from 52.4% to 59.6% (+7.2%) and 57.1% to 61.5% (+4.4%), respectively, whereas PPV increased from 26.5% to 37.8% (+11.3%) and 43.6% to 59.3% (+15.7%), respectively. Thus, the improvement in sensitivity was equal between eDNA and eRNA, whereas PPV was improved for eRNA compared with that of eDNA. Merging the metabarcoding analysis results increased the sensitivity and PPV of eRNA compared with those of eDNA. ERNA was less likely to decrease PPV and increase sensitivity compared with those of eDNA. The unique characteristic of eRNAs is that data integration does not reduce PPV. Furthermore, excluding the estuarine-specific species detected in TFS, eDNA and eRNA, sensitivity increased from 59.6% to 67.4% (+7.8%) and 61.5% to 69.8% (+8.3%), respectively, whereas PPV slightly decreased from 37.8% to 36.3% (−1.5%) and 59.3% to 57.7% (−1.6%) for eDNA and eRNA, respectively.
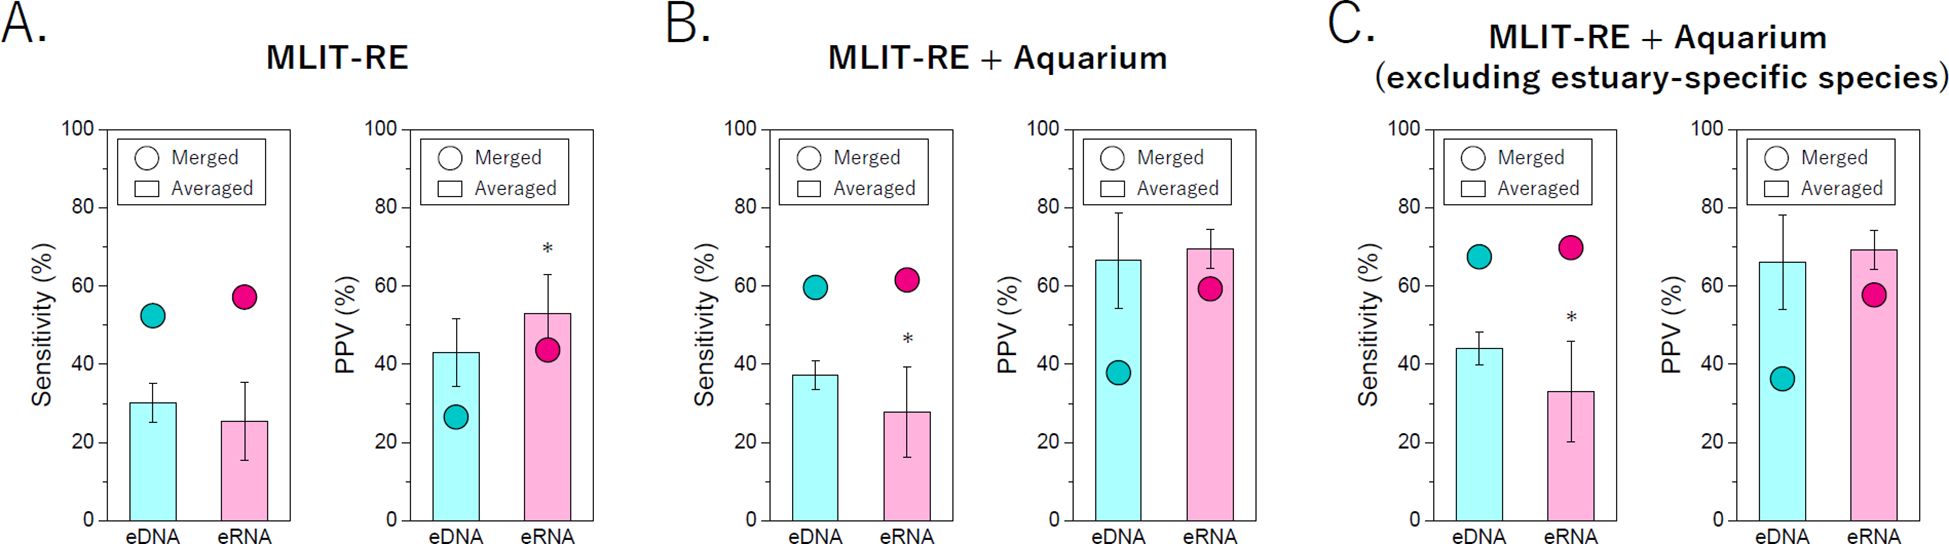
Figure 2. Improved performance of environmental DNA/environmental RNA metabarcoding analysis using traditional field survey (TFS) data obtained from an aquarium survey for ecological survey using additional TFS data. Sensitivity and positive predictive value (PPV) of metabarcoding analysis using TFS data obtained from (A) Ministry of Land Infrastructure and Transport – River Environmental Database (MLIT-RE), (B) MLIT-RE and aquarium survey, and (C) MLIT-RE and aquarium survey excluding the estuary. Bars and dots indicate performance when individual data were averaged and merged, respectively. Merged data was treated as true if it was detected in any one of the surveys or analyses conducted. *p < 0.05.
4 Discussion
Miyata et al. (2021) suggested that fish eRNA metabarcoding analysis is useful for specific ecological surveys with high PPV; however, its performance was insufficient for an ecological survey method that comprehensively captures the entire river at representative sampling points. Therefore, we performed additional analyses using the newly obtained TFS data to estimate the realistic performance of the molecular ecological survey using eDNA/eRNA. As a result, 10 fish species were newly identified (Table 2), and nine of the ten species were allocated to species that were detected during eDNA and eRNA metabarcoding analysis (Figure 1).
Ten species have been newly reported to inhabit the Naka river in Japan. Of the 10 fish species, 7 are demersal fish (Table 2). Furthermore, 9 species are rare. Demersal and rare fish may not have been found in previous ecological surveys because they hide in the sand and are scarce, respectively. Moreover, rare species have not been described from a conservation perspective. Furthermore, three species (Cottus pollux, Salvelinus leucomaenis pluvius, and Lethenteron sp.) required caution considering identification accuracy in metabarcoding analysis and species-specific analysis and technological development are needed for future analysis.
Regarding the performance of the ecological survey (Figure 2), adding the data for the 10 species considerably increased sensitivity and PPV, and subsequently, the performance of eRNA (sensitivity and PPV were approximately 60%). Regardless of the database used, eDNA showed a significant decrease in PPV when merged data was used, while eRNA showed almost no decrease in PPV. This is because, DNA detects more marine fish (false positives) due to merging than RNA. eRNA showed higher sensitivity than eDNA because eRNA would have a smaller amount of nucleic acids derived from false positives, and therefore more nucleic acids derived from living organisms would be available. Furthermore, excluding the estuarine-specific species detected in TFS, eDNA and eRNA sensitivities were improved by +7.8 and +8.3%, respectively. Contrastingly, eDNA and eRNA positive predictivities were slightly decreased by −1.5 and −1.6%, respectively, probably due to the detection of Tridentiger obscurus and Tribolodon brandtii maruta typically found downstream of rivers and estuaries, but can inhabit freshwater, suggesting that fish migrating upstream from the sea inhabit the middle stream of rivers and contaminate river water with DNA and RNA. A previous study revealed the high sensitivity of eRNA (100%) when the location of the species is narrowed down (Miyata et al., 2021). Additionally, the increase in PPV for eRNA (+15.7%) was considerably higher than that for eDNA (+11.3%). A high PPV indicates a low false-positive rate. Thus, if the eRNA detects fish species, it indicates that the species detected is likely to inhabit the vicinity of the sampling point. Previous studies and systemic reviews have highlighted that eRNA metabarcoding analysis is a positive assay for investigating whether fish species inhabit the sampling points (An et al., 2023; Cristescu, 2019; Li et al., 2024; Miyata et al., 2021; Veilleux et al., 2021; Yates et al., 2021), consistent with the findings of the present study. Although eNAs can capture data for a large survey area, the eDNA ability to detect a high number of false-positive species reduces the positive sensitivity when the results of multiple surveys are integrated. eRNA can maintain high PPV while retaining high sensitivity when data are integrated, significantly improving the practical operational challenges of routine molecular ecology surveys.
We have validated the previous results for eDNA/eRNA metabarcoding, but there are still some limitations, including the use of old TFS data (10 years old) and uncertainties due to the small number of sampling sites. Therefore, further studies are needed to evaluate its performance at larger spatial scales and taxonomic groups. In particular, performance in open systems (e.g. bays) needs to be evaluated. In addition, there is a need to better understand which environmental factors alter RNA degradation and how analysis affects performance, the type of primer used, the identification of difficult-to-identify species, and the increased cost and effort required for environmental RNA analysis.
In conclusion, we validated the performance of fish eRNA metabarcoding analysis for ecological surveys in the Naka River. We found that using additional ecological survey data improved eRNA sensitivity and PPV by approximately 60%. Furthermore, the increase in sensitivity and PPV of eRNA were higher than those of eDNA. Merging several measures of metabarcoding results leads to the high performance of eRNA considering the sensitivity and PPV (low false negative rate). Although eRNA analysis is time-consuming and resource-intensive compared to eDNA analysis, optimizing the number of surveys and geographic sampling areas could result in effective and robust evaluations. Multi-site and -temporal data analyses are required to elucidate how eDNA and eRNA can be used interchangeably.
Data availability statement
The original contributions presented in the study are publicly available. This data can be found here: DDBJ BioProject database, accession number PRJDB18562. Data from ecological surveys of arthropods are publicly available from the Ministry of Land Infrastructure and Transport – River Environmental Database (MLIT-RE database). http://www.nilim.go.jp/lab/fbg/ksnkankyo/ (accessed 9.7.19).
Author contributions
KM: Conceptualization, Data curation, Formal analysis, Investigation, Methodology, Project administration, Supervision, Visualization, Writing – original draft, Writing – review & editing. YK: Data curation, Resources, Writing – review & editing. YI: Methodology, Writing – review & editing. MY: Writing – review & editing. HH: Conceptualization, Formal analysis, Investigation, Methodology, Project administration, Supervision, Visualization, Writing – original draft, Writing – review & editing.
Funding
The author(s) declare that no financial support was received for the research and/or publication of this article.
Acknowledgments
We thank Mr. Takamitsu Kawaguchi for interpreting the ecological survey data on the TFS and eDNA/eRNA metabarcoding analysis. This study did not receive specific grants from public, commercial, or non-profit funding agencies.
Conflict of interest
Authors KM, YI, MY, and HH were employed by the company Kao Corporation.
The remaining author declares that the research was conducted in the absence of any commercial or financial relationships that could be construed as a potential conflict of interest.
Generative AI statement
The author(s) declare that no Generative AI was used in the creation of this manuscript.
Publisher’s note
All claims expressed in this article are solely those of the authors and do not necessarily represent those of their affiliated organizations, or those of the publisher, the editors and the reviewers. Any product that may be evaluated in this article, or claim that may be made by its manufacturer, is not guaranteed or endorsed by the publisher.
References
An H. E., Mun M. H., Kim C. B. (2023). Metabarcoding by combining environmental DNA with environmental RNA to monitor fish species in the Han River, Korea. Fishes 8, 550. doi: 10.3390/fishes8110550
Biodiversity Center of Japan (2023). A Survey Manual for Conducting eDNA Analysis on Freshwater Fish. 3rd edition (Biodiversity Center of Japan). Available at: https://www.biodic.go.jp/edna/reports/mifish_tebiki3.pdf (Accessed December 5, 2024).
Bohmann K., Evans A., Gilbert M. T. P., Carvalho G. R., Creer S., Knapp M., et al. (2014). Environmental DNA for wildlife biology and biodiversity monitoring. Trends Ecol. Evol. 29, 358–367. doi: 10.1016/j.tree.2014.04.003
Bolyen E., Rideout J. R., Dillon M. R., Bokulich N. A., Abnet C. C., Al-Ghalith G. A., et al. (2019). Reproducible, interactive, scalable and extensible microbiome data science using QIIME 2. Nat. Biotechnol. 37, 852–857. doi: 10.1038/s41587-019-0209-9
Callahan B. J., McMurdie P. J., Rosen M. J., Han A. W., Johnson A. J. A., Holmes S. P. (2016). DADA2: High-resolution sample inference from Illumina amplicon data. Nat. Methods 13, 581–583. doi: 10.1038/nmeth.3869
Cristescu M. E. (2019). Can environmental RNA revolutionize biodiversity science? Trends Ecol. Evol. 34, 694–697. doi: 10.1016/j.tree.2019.05.003
Cristescu M. E., Hebert P. D. N. (2018). Uses and misuses of environmental DNA in biodiversity science and conservation. Annu. Rev. Ecology Evolution Systematics 49, 209–230. doi: 10.1146/annurev-ecolsys-110617-062306
Deiner K., Bik H. M., Mächler E., Seymour M., Lacoursière-Roussel A., Altermatt F., et al. (2017). Environmental DNA metabarcoding: Transforming how we survey animal and plant communities. Mol. Ecol. 26, 5872–5895. doi: 10.1111/mec.14350
Dougherty M. M., Larson E. R., Renshaw M. A., Gantz C. A., Egan S. P., Erickson D. M., et al. (2016). Environmental DNA (eDNA) detects the invasive rusty crayfish Orconectes rusticus at low abundances. J. Appl. Ecol. 53, 722–732. doi: 10.1111/1365-2664.12621
Ficetola G. F., Miaud C., Pompanon F., Taberlet P. (2008). Species detection using environmental DNA from water samples. Biol. Lett. 4, 423–425. doi: 10.1098/rsbl.2008.0118
Ficetola G. F., Taberlet P., Coissac E. (2016). How to limit false positives in environmental DNA and metabarcoding? Mol. Ecol. Resour. 16, 604–607. doi: 10.1111/1755-0998.12508
Foote A. D., Thomsen P. F., Sveegaard S., Wahlberg M., Kielgast J., Kyhn L. A., et al. (2012). Investigating the potential use of environmental DNA (eDNA) for genetic monitoring of marine mammals. PloS One 7, e41781. doi: 10.1371/journal.pone.0041781
Fukumoto S., Ushimaru A., Minamoto T. (2015). A basin-scale application of environmental DNA assessment for rare endemic species and closely related exotic species in rivers: A case study of giant salamanders in Japan. J. Appl. Ecol. 52, 358–365. doi: 10.1111/1365-2664.12392
Inoue Y., Miyata K., Yamane M., Honda H. (2023). Environmental nucleic acid pollution: Characterization of wastewater generating false positives in molecular ecological surveys. ACS ES&T Water 3, 756–764. doi: 10.1021/acsestwater.2c00542
Jones E. P., Adams I. P., Walshaw J., Benucci M., MacArthur R., Boonham N., et al. (2020). Guidance for end users on DNA methods development and project assessment. JNCC Report No. 669a. Available at: https://hub.jncc.gov.uk/assets/8839bf2f-f934-4a9d-b25d-74a6d20ac875.
Kuwae M., Tamai H., Doi H., Sakata M. K., Minamoto T., Suzuki Y. (2020). Sedimentary DNA tracks decadal-centennial changes in fish abundance. Commun. Biol. 3, 558. doi: 10.1038/s42003-020-01282-9
Li W., Jia H., Zhang H. (2024). Evaluating the effectiveness of the eRNA technique in monitoring fish biodiversity – A case study in the Qingdao offshore, China. Global Ecol. Conserv. 51, e02888. doi: 10.1016/J.GECCO.2024.E02888
Ministry of the Environment Government of Japan (2020). Publication of red list 2020 of the Ministry of the Environment, Japan. Available online at: https://www.env.go.jp/en/press/107905_00001.html (Accessed May 31, 2021).
Miyata K., Inoue Y., Amano Y., Nishioka T., Yamane M., Kawaguchi T., et al. (2021). Fish environmental RNA enables precise ecological surveys with high positive predictivity. Ecol. Indic. 128, 107796. doi: 10.1016/J.ECOLIND.2021.107796
Port J. A., O’Donnell J. L., Romero-Maraccini O. C., Leary P. R., Litvin S. Y., Nickols K. J., et al. (2016). Assessing vertebrate biodiversity in a kelp forest ecosystem using environmental DNA. Mol. Ecol. 25, 527–541. doi: 10.1111/mec.13481
Sakata M. K., Yamamoto S., Gotoh R. O., Miya M., Yamanaka H., Minamoto T. (2020). Sedimentary eDNA provides different information on timescale and fish species composition compared with aqueous eDNA. Environ. DNA 2, 505–518. doi: 10.1002/EDN3.75
Thomsen P. F., Kielgast J., Iversen L. L., Møller P. R., Rasmussen M., Willerslev E. (2012a). Detection of a diverse marine fish fauna using environmental DNA from seawater samples. PloS One 7, e41732. doi: 10.1371/journal.pone.0041732
Thomsen P. F., Kielgast J., Iversen L. L., Wiuf C., Rasmussen M., Gilbert M. T. P., et al. (2012b). Monitoring endangered freshwater biodiversity using environmental DNA. Mol. Ecol. 21, 2565–2573. doi: 10.1111/j.1365-294X.2011.05418.x
Veilleux H. D., Misutka M. D., Glover C. N. (2021). Environmental DNA and environmental RNA: Current and prospective applications for biological monitoring. Sci. Total Environ. 782, 146891. doi: 10.1016/J.SCITOTENV.2021.146891
Yamamoto S., Minami K., Fukaya K., Takahashi K., Sawada H., Murakami H., et al. (2016). Environmental DNA as a ‘snapshot’ of fish distribution: A case study of Japanese jack mackerel in Maizuru bay, sea of Japan. PloS One 11, e0149786. doi: 10.1371/journal.pone.0149786
Yamanaka H., Minamoto T. (2016). The use of environmental DNA of fishes as an efficient method of determining habitat connectivity. Ecol. Indic. 62, 147–153. doi: 10.1016/J.ECOLIND.2015.11.022
Keywords: metabarcoding, environmental DNA, environmental RNA, sustainable development goals, traditional field surveys
Citation: Miyata K, Kusakabe Y, Inoue Y, Yamane M and Honda H (2025) Validation of fish environmental RNA metabarcoding analysis for ecological surveys by additional traditional field surveys in the Naka River. Front. Ecol. Evol. 13:1540001. doi: 10.3389/fevo.2025.1540001
Received: 05 December 2024; Accepted: 31 March 2025;
Published: 08 May 2025.
Edited by:
Ádám Lovas-Kiss, Hungarian Academy of Sciences, HungaryReviewed by:
Nikolaos V. Schizas, University of Puerto Rico at Mayagüez, Puerto RicoMaribet Gamboa, Catholic University of the Most Holy Conception, Chile
Copyright © 2025 Miyata, Kusakabe, Inoue, Yamane and Honda. This is an open-access article distributed under the terms of the Creative Commons Attribution License (CC BY). The use, distribution or reproduction in other forums is permitted, provided the original author(s) and the copyright owner(s) are credited and that the original publication in this journal is cited, in accordance with accepted academic practice. No use, distribution or reproduction is permitted which does not comply with these terms.
*Correspondence: Kaede Miyata, bWl5YXRhLmthZWRlQGthby5jb20=; Hiroshi Honda, aG9uZGEuaGlyb3NoaUBrYW8uY29t
†These authors have contributed equally to this work
‡ORCID: Kaede Miyata, orcid.org/0000-0001-6393-0457
Hiroshi Honda, orcid.org/0000-0002-2936-2617