 Norberto Domínguez-Amaya
 Fabian Brambach
 José Javier Corral-Rivas
 Martin Ehbrecht
- 1Silviculture and Forest Ecology of the Temperate Zones, University of Göttingen, Göttingen, Germany
- 2Biodiversity, Macroecology and Biogeography, University of Göttingen, Göttingen, Germany
- 3Facultad de Ciencias Forestales y Ambientales, Universidad Juárez del Estado de Durango, Durango, Mexico
Understanding the factors that shape biodiversity is crucial for predicting species responses to environmental change and for effective conservation planning. Broad-scale diversity patterns have been widely studied, yet the mechanisms determining biodiversity remain debated. In this study, we investigate the effect of environmental factors on plant diversity patterns along a subtropical elevational gradient in Durango, Mexico. Using a database of 820 permanent forest inventory plots distributed along a gradient ranging from 1300 m to 3000 m in elevation, we assessed how tree taxonomic diversity (TD) and phylogenetic diversity (PD) change with elevation and identified their key environmental drivers. We quantified TD and PD using Hill-Chao numbers and tested soil, topographic, and climate variables as drivers of diversity using generalized linear models. Our results revealed a unimodal pattern for both TD and PD, with peak diversity at mid-elevations (2290 m). Climate variables—mean annual precipitation, mean annual temperature, precipitation seasonality, and relative humidity—emerged as the most important drivers of diversity. The unimodal patterns observed for TD and PD in relation to annual precipitation and temperature align with the predictions of the Water-Energy Dynamics model, highlighting the importance of water-energy dynamics in shaping diversity patterns. The strong positive correlation between TD and PD across all levels of diversity suggests that evolutionary processes and shared environmental tolerances likely contribute to shaping both facets of diversity. These findings have important implications for conservation and forest management, particularly for identifying diversity hotspots along the elevational gradient and understanding the role of environmental filtering in shaping community assembly and phylogenetic diversity. Future research should expand on these findings by incorporating higher-resolution environmental data and explicitly accounting for forest management practices to further refine our understanding of diversity patterns.
Introduction
Mountainous regions harbor a disproportionately high amount of the world’s biodiversity, playing a critical role in species conservation (Körner, 2007; Rahbek et al., 2019). These regions are characterized by high topographic complexity with steep gradients of environmental factors, including temperature, precipitation (Chu et al., 2019), geomorphology (Asner et al., 2014), and soils (Ashton, 2003) leading to a high turnover of species composition and ecosystem structure (Peters et al., 2016; Salinas et al., 2021). Among the most striking patterns observed in mountains are elevational diversity gradients (EDG) (Guo et al., 2013; Rahbek, 1995). These gradients provide a unique opportunity to study how environmental factors shape biodiversity patterns, as they encompass a wide range of climatic and ecological conditions over short distances (Körner, 2007; Rahbek, 1995; Rahbek et al., 2019).
EDGs in trees often exhibit complex patterns, including decreasing species richness with increasing elevation and unimodal patterns with peaks at mid-elevations (McCain and Grytnes, 2010). The decline in diversity at higher altitude can be attributed to decreasing temperatures and limitations in nutrient availability (Bhatta et al., 2021; Brambach et al., 2017; Costa et al., 2023). Conversely, unimodal patterns in diversity may arise from the interplay between water and energy availability, with optimal conditions occurring at mid-elevations (Körner, 2007; McCain and Grytnes, 2010; Tolmos et al., 2022). Factors such as soil composition, anthropogenic and/or natural disturbances, and topography can influence microclimatic conditions and contribute to variation in diversity patterns along elevational gradients (Ben Saadi et al., 2022; Monge-González et al., 2021; Schall et al., 2018). Additionally, the length of the elevational gradient can influence the observed patterns (McCain and Grytnes, 2010). Patterns observed at the regional scale, may be influenced by factors such as sampling area and sampling intensity (Rahbek, 1995; McCain, 2007; Gotelli and Colwell, 2001), in contrast to local-scale studies, which may miss rare species or under-sample certain elevational zones (Grytnes and Romdal, 2008). Therefore, it is essential to consider the scale of the study when interpreting EDG patterns.
Although EDGs have been extensively studied, the underlying mechanisms driving biodiversity patterns remain a subject of ongoing research (Bertuzzo et al., 2016; Qian and Ricklefs, 2016). One key area of focus is the interplay between water and energy, recognized as crucial factors influencing species distributions and community assembly (Field et al., 2009; Hawkins et al., 2003). Two prominent frameworks, the Net Primary Production (NPP) model and the Water-Energy Dynamics (WED) model, offer contrasting perspectives on how these factors shape biodiversity (Vetaas et al., 2019).
The NPP model emphasizes energy availability, often measured through factors like evapotranspiration, temperature, or solar radiation, as the primary driver of biodiversity (Bhatta et al., 2021; Brown, 2014). It suggests that higher energy levels fuel speciation, reduce extinction rates, and promote genetic divergence. In contrast, the WED model proposes a more nuanced relationship, suggesting that species richness initially increases with available thermal energy, but beyond a certain threshold, water scarcity, whether due to evaporation or frost, becomes a limiting factor, constraining plant activity and ultimately reducing diversity (Hawkins et al., 2003; O’Brien, 1998). In the context of EDG, the NPP model would predict a decrease of diversity with elevation, while a unimodal pattern would be better explained by the WED model, where water limitation at the lower (warmer) end of the gradient would limit diversity.
Understanding biodiversity patterns across environmental gradients is critical for conservation planning and ecosystem management. Analyzing diversity within discrete elevational belts helps identify specific zones of biodiversity concentration, aiding in ecological understanding and practical forest management.
Traditionally, diversity patterns have been assessed through taxonomic diversity (TD), often quantified as species richness (Davies and Buckley, 2011). However, incorporating species’ relative abundances is essential for a more comprehensive understanding of ecosystem function and structure (Jost, 2006). Moreover, the integration of evolutionary history has proven crucial for fully capturing diversity patterns (Chao et al., 2014a). Phylogenetic diversity (PD), which quantifies biodiversity by summing branch lengths of a phylogenetic tree, provides insights into shared evolutionary history (Paúl et al., 2023). Hence, TD and PD can be used to comprehensively study diversity patterns along large geographical scales and help elucidate the relative influence of biotic and abiotic factors on forest community assembly (Tolmos et al., 2022).
This study investigates taxonomic and phylogenetic diversity patterns along a 1700 m elevational gradient in the Sierra Madre Occidental, Durango, Mexico. This region, a biodiversity hotspot with the country’s largest temperate forests and extensive associations of Pinus L., Quercus L., and Arbutus L. (González-Elizondo et al., 2012), provides an ideal setting to explore how environmental factors shape tree diversity and distribution at broad geographical scales. Natural forests within the study area are characterized by a mixed, uneven-aged woodland structure and a random spatial arrangement of trees (López-Serrano et al., 2019; Padilla-Martínez et al., 2020; Wehenkel et al., 2011).
While previous research has examined forest structure and species diversity patterns in the area (Chávez-Flores et al., 2020; Flores-Morales et al., 2022; Silva García et al., 2021), a critical gap remains in our understanding of how environmental factors jointly influence TD and PD along elevational gradients. Identifying areas of high TD and PD, and understanding their environmental drivers, provides essential information for prioritizing conservation efforts in areas of high evolutionary distinctiveness and developing effective management strategies. Addressing this research gap is particularly crucial given anticipated climate fluctuations and their effects on ecosystems and biodiversity (Abbass et al., 2022). This study uses a large data set of tree inventory plots to assess both facets of diversity (TD and PD). It considers species abundances through Hill-Chao numbers (Hill, 1973; Jost, 2006; Roswell et al., 2021), a unified family of diversity indices that account for the relative abundances of species to different degrees, including the established indices of species richness, Shannon diversity, and Simpson diversity (Chao et al., 2014b). This approach allows for direct comparisons of TD and PD, providing a more comprehensive understanding of biodiversity. Specifically, this study examines tree diversity patterns across the elevational gradient by 1) identifying the main genera and their distribution, 2) quantifying alpha and gamma diversity, and 3) identifying the key environmental drivers of these patterns. We hypothesize that (1) TD and PD reflect unimodal patterns peaking at mid-elevations due to drought stress at lower altitudes and harsher environmental conditions at higher altitudes (e.g., low temperature), and (2) climatic factors predominantly drive these trends.
Materials and methods
Study area
The study area comprises the forests of Durango state, which are distributed from north to south following the most extensive mountain range in the country (González-Elizondo et al., 2012), the Sierra Madre Occidental (SMO). This is the most important forest region in Mexico due to its extent and economic value (Crecente-Campo et al., 2014; Wehenkel et al., 2011). Our plot network covers an elevation range from 1386 to 3032 m (Figure 1). This region exhibits considerable climatic variation, ranging from tropical to temperate conditions; annual temperatures span from 9.2°C to 18.9°C, and mean annual precipitation varies significantly, from 563.1 mm to 2190.7 mm. The main vegetation types are Madrense, characterized by mixed woodlands (mainly pine-oak associations) located in subtropical to temperate areas; Xeric Madrense, distinguished by oak-pine forests, evergreen juniper scrub, and xerophytic scrub in semi-arid elevations and foothills; and Tropical regions, represented by tropical deciduous and semi-deciduous forests and subtropical scrub (González-Elizondo et al., 2012). These forests are characterized by high species richness and feature three dominant genera: Pinus with 24 species (46% of the Mexican total); Quercus, with 54 species (34%); and Arbutus, with 7 species (100%). A complex mosaic of uneven-aged woodlands with diverse tree species and a random spatial distribution is created by these mixed forests (López Serrano et al., 2019). The composition of these mixed forests is further shaped by the region´s management history, land ownership patterns, and socioeconomic development (Wehenkel et al., 2011).
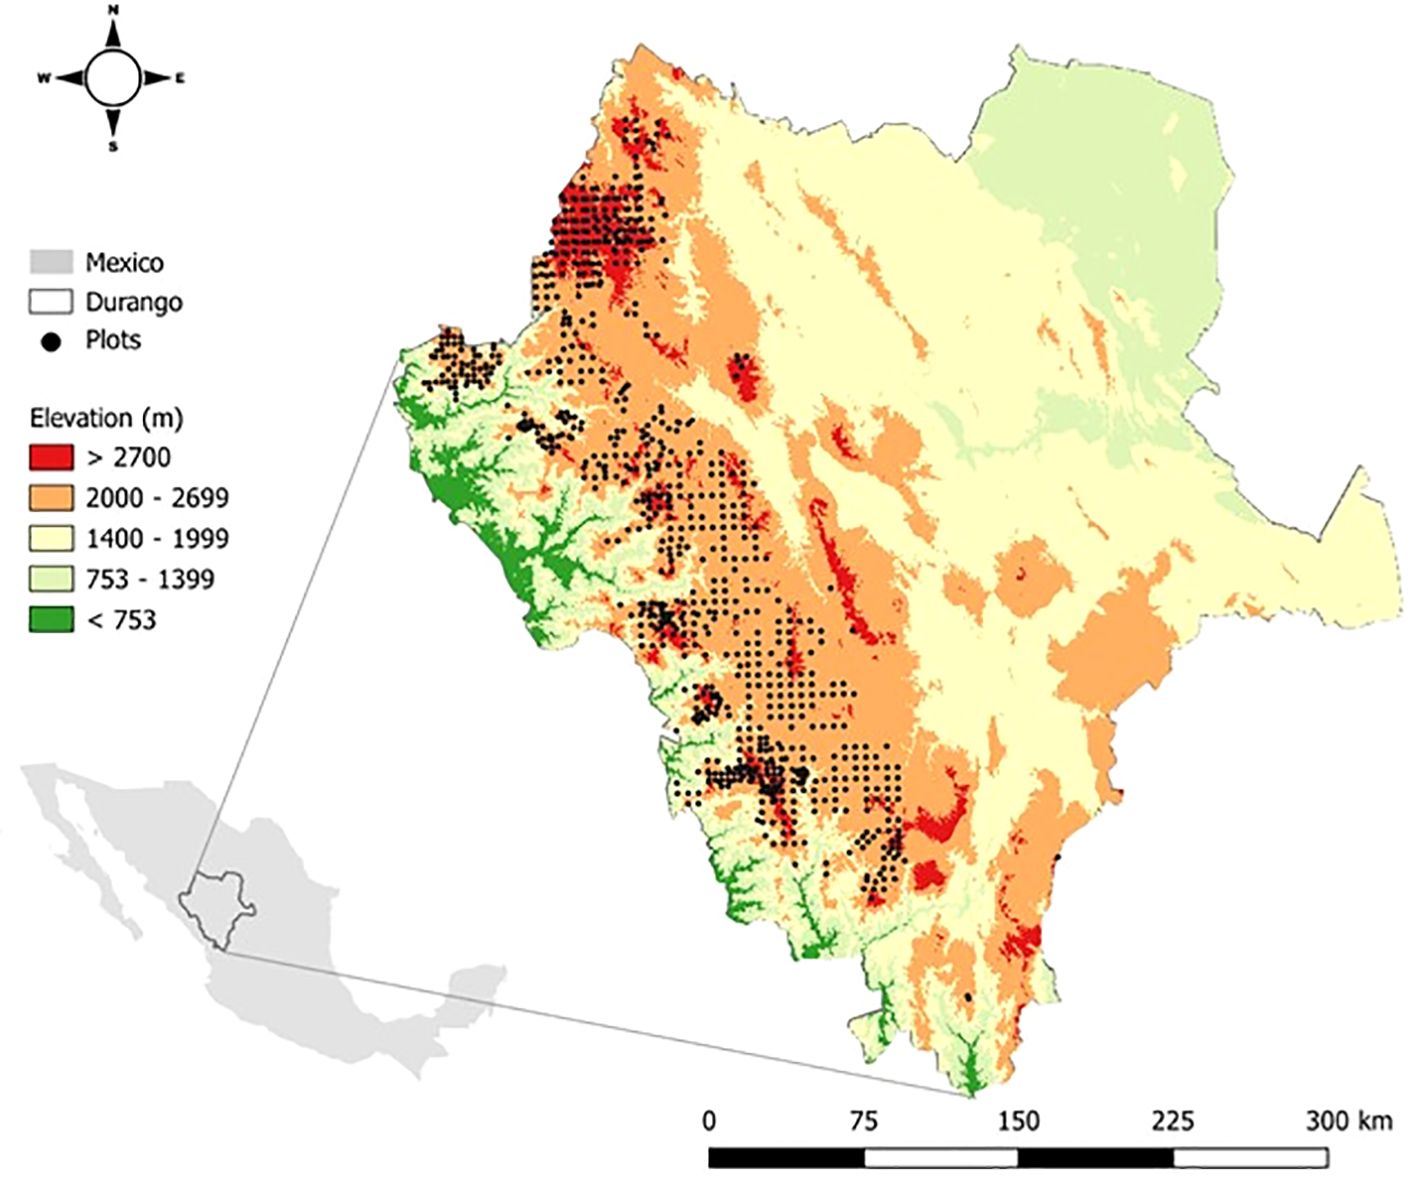
Figure 1. Distribution of permanent inventory plots (depicted as black dots) across the state of Durango, Mexico.
Study design and data structure
The data utilized in this study were gathered from a network of 820 permanent inventory plots established in 2007 for monitoring the state of forests in Durango (Figure 1). All plots were created following the methodology described by Corral-Rivas et al. (2009) and are located in differently managed and unmanaged stands representing the main forest types in the region. The plots are 50 m × 50 m in size and were created following a systematic sampling design with a grid of 5 km. The main recorded variables are species name, diameter at breast height (DBH) (measured at 1.3 m above ground level with a caliper), tree height (measured with Haglöf Vertex laser rangefinder (Haglöf Sweden, 2022), and tree position (azimuth and distance from the center plot to the measured trees). All trees with a DBH above 7 cm were measured. Species name standardization was conducted using the “tnrs” function from the R package TNRS (Boyle et al., 2013) using the World Checklist of Vascular Plants (Govaerts, 2023) as the taxonomic source. In total, 76 species were identified across all plots, of which 22 represented gymnosperms and 54 angiosperms.
Climate, soil, and topography data
To analyze the influence of environmental factors on diversity we used three open-source databases; CHELSA (Karger et al., 2017) for the climatic characterization of study sites, SoilGrids (Poggio et al., 2021) for the estimation of edaphic variables of interest, and NASA SRTM for the digital elevation model (NASA, 2024). CHELSA climate variables are based on a downscaled model output of temperature and precipitation average values from 1981–2010 estimated at a spatial resolution of 30 arcseconds (~ 1 km) (Karger et al., 2017). In total 11 CHELSA climatic variables were considered (Table 1). Elevation was not considered within the final group of selected environmental factors, given its high correlation with temperature. Furthermore, SoilGrids variables are the product of a digital soil mapping system predicted by machine learning estimations based on climate, land cover, and terrain morphology aspects. We focused on four soil variables (Table 1), which are provided at six standard depth intervals (0–5 cm, 5–15 cm, 15–30 cm, 30–60 cm, 60 cm –1 m, 1–2 m) at a spatial resolution of 250 meters. For this study, we focused on soil values representative of the first depth interval (0–5 cm). Finally, we created a digital elevation model of Durango state to estimate topographic variables of interest (Table 1) using the NASA SRTM digital elevation model (NASA, 2024; Qian, 2014) and open-source geospatial analysis platform GEE (Gorelick et al., 2017).
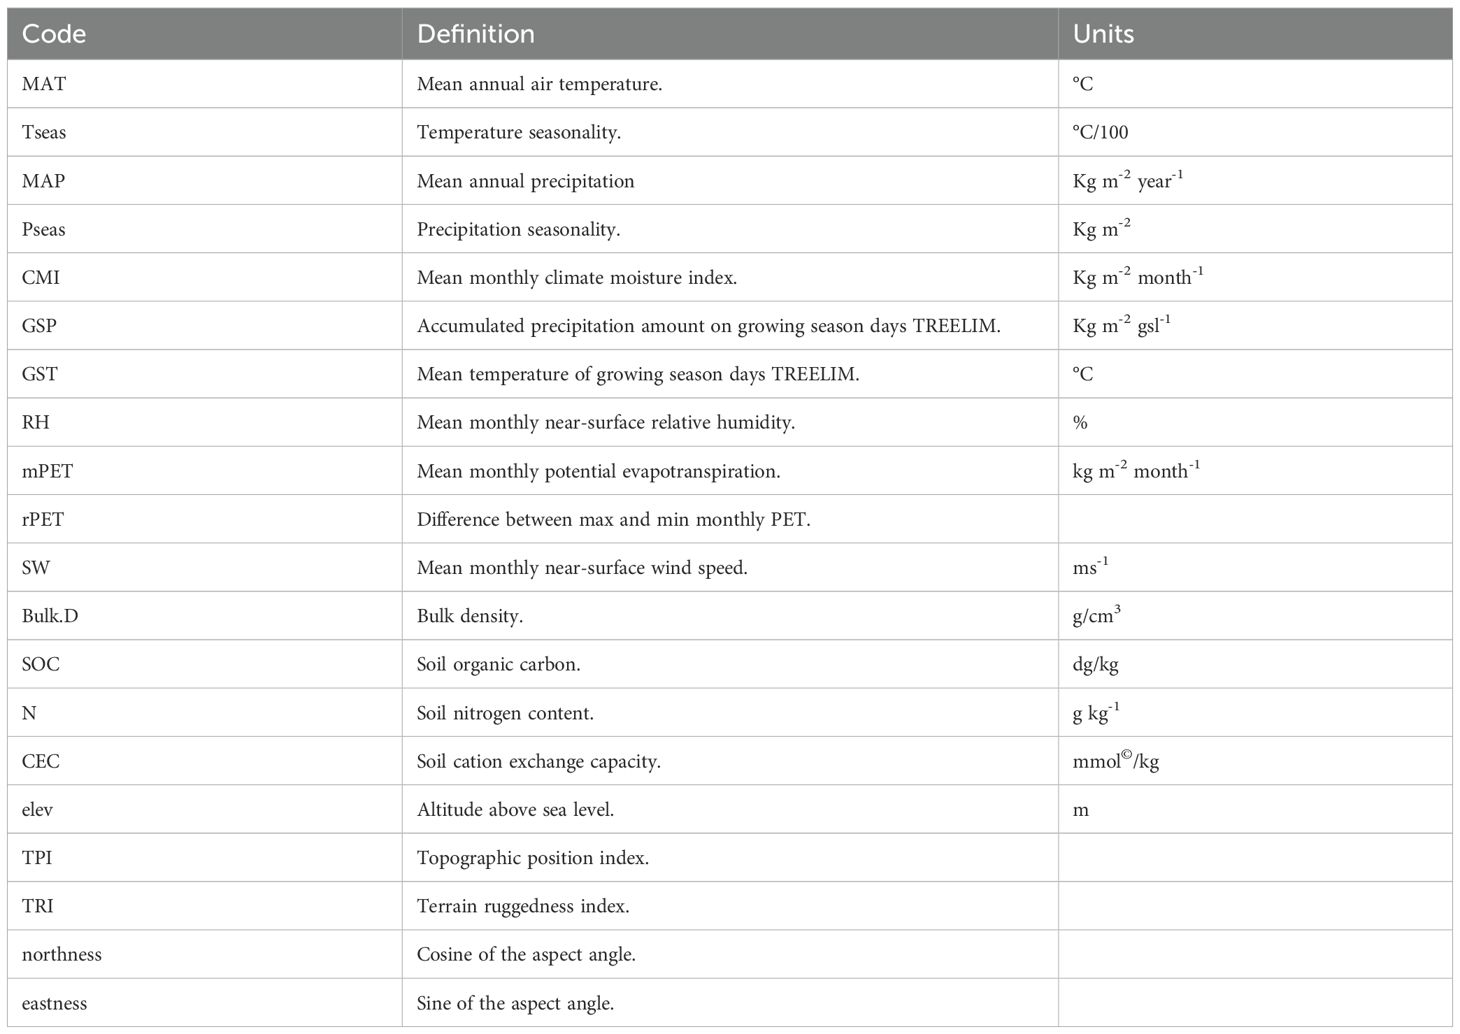
Table 1. Code, definition, and units of climatic, edaphic, and topographic variables.
Phylogeny construction
We built a phylogenetic tree considering all species in the inventory using the V.Phylomaker2 package in R (Y. Jin and Qian, 2022). This package allows the creation of phylogenies for vascular plants based on three different mega-trees and botanical nomenclature systems. The World of Plants (Hassler, 2025) mega-phylogeny was used as a backbone since most of the species identified in our study were standardized according to this plant database. This step is important to maximize name-matching between our species lists and the mega-phylogeny (Jin and Qian, 2022). Then, by using the “bind.relative” function, we bind species to their designated relative to reduce the number of polytomies and attach genera and species close to their relatives (Jin and Qian, 2019) in the final phylogenetic tree. We used the “phylo.maker” function to generate the phylogenetic tree, specifying the argument nodes=nodes.info.1.WP to incorporate genus and family node information from the World Plants (WP) database (Hassler, 2025). Additionally, we applied scenarios=S2, an argument that assigns species absent from the backbone phylogeny to positions in the tree based on taxonomic relationships using a randomized approach.
Diversity analysis
For the analysis of diversity, we focused on Hill-Chao numbers (Hill, 1973; Jost, 2006; Roswell et al., 2021). Originally designed to measure taxonomic diversity, they have recently been expanded to the functional and phylogenetic facets of diversity (Chao et al., 2014a). These diversity indices are categorized by a diversity order q ≥ 0, which allows focusing on rare, abundant, or dominant species, depending on the case. For TD, Hill-Chao numbers of order q=0 denote the total number of species (species richness), whereas q=1 and q=2 represent the effective number of abundant (Shannon diversity) and dominant species (Simpson diversity), respectively. Regarding PD, order q=0 denotes Faith’s phylogenetic diversity (total branch tree length) (Faith, 1992) divided by tree depth, while q=1 and q=2 represent transformations of phylogenetic entropy and Rao’s quadratic entropy (Chao et al., 2021), respectively.
Following the framework developed by Chao et al. (2021), we used the iNEXT3D R package (Chao and Hu, 2023) to estimate TD and PD across all study sites.
Observed Hill-Chao numbers for q=0, q=1, and q=2 were calculated for the two facets of diversity using the “iNEXT3D” function. Since diversity is known to depend on sample sizes and the number of individuals per plot varied, we also used the function “estimate3D” to calculate the same metrics standardized per 400 individuals using a rarefaction/extrapolation procedure. Lastly, to account for variation in sampling effort across the gradient of elevation, we used the “ggiNEXT3D” function to generate sample-size-based rarefaction and extrapolation curves, along with sample completeness curves for each Hill-Chao number. This analysis aimed to evaluate diversity across six different elevational belts (1800–2000 m, 2000–2200 m, 2200–2400 m, 2400-2600, and 2600–2800 m) by using a standardized number of plots (36), allowing us to compare diversity patterns at different stages along the elevation gradient while controlling for sampling effort (Chao and Jost, 2012).
Statistical analysis
All statistical computations were done using the open-source statistical software R, version 4.3.2 (R Development Core Team, 2023).
The diversity analysis was carried out considering the standardized diversity values for each Hill-Chao number (q0, q1, q2) and diversity facet (TD and PD). First, we fit generalized linear models (GLMs) using the Gaussian family and identity function and a quadratic argument to assess the correlation between diversity facets (TD-PD) for each Hill-Chao number. Second, we built GLMs using the same parameters mentioned before to test relationships between each diversity facet and elevation. Third, we constructed GLMs to analyze the effects of environmental variables on Hill-Chao numbers for each facet of diversity.
To avoid the multicollinearity of environmental variables, we created a correlation matrix (Supplementary Figure S1) with the initial dataset of 22 variables using the “ggcorrplot” function from the ggcorrplot package. Among variables with values greater than 0.7 (Dormann et al., 2013) according to Pearson’s correlation coefficient, we chose the one that we considered ecologically most relevant and/or easiest to interpret; the others were excluded from further analysis. A total of 14 explanatory variables were considered as environmental factors. Additionally, we performed a principal component analysis (PCA) using the “PCA” function from the FactoMine R package (Lê et al., 2008) to analyze the directionalities of the 14 explanatory variables and distributions of the plots. The PCA was visualized as a biplot using the function “fviz_pca_biplot” from the factoextra package (Kassambara and Mundt, 2020). Moreover, the model selection process was conducted applying a backward selection scheme using the “stepAIC” function from the MASS package to identify the most robust predictors. This was followed by a second-stage model selection using the “dredge” function from the MuMIn package (Bartoń, 2023), which systematically evaluates all possible combinations of predictor variables from a given global model and ranks them based on an information criterion (e.g., AIC in our study). The top model selection was based on model simplicity, and relevance of explanatory variables driving diversity patterns along large geographical scales. Finally, taking advantage of the performance package (Lüdecke et al., 2021), we (i) assessed the variance explained by the models by calculating their R-squared (R2) using the “r2” function; (ii) visually checked standard model assumptions (i.e. uniformity of residuals, homogeneity of variance, and collinearity) using the functions “check_model” and “check_collinearity”.
Results
Phylogenetic and taxonomic diversity patterns along the elevational gradient
Pinus L., Quercus L., Arbutus L., and Juniperus L. were the most common genera along the elevational gradient (Figure 2). While TD showed a significant unimodal relationship with elevation across all Hill-Chao numbers, the models explained only 4-5% of the total variance in the data (Figure 3A; Supplementary Table S2). This unimodal pattern predicts higher diversity at mid-elevations with a subsequent decline at higher elevations. Similarly, PD showed a positive significant correlation with elevation for Hill-Chao number q0, but a negative significant correlation for attributes q1 and q2 (Figure 3B; Supplementary Table S2). Like TD, elevation alone accounted for a small proportion of variability in PD: q=0 (R2 = 0.02), q=1 (R2 = 0.01), and q=2 (R2 = 0.02). Lastly, TD and PD displayed a strong positive correlation with each other across all three Hill-Chao numbers (Supplementary Figure S2).
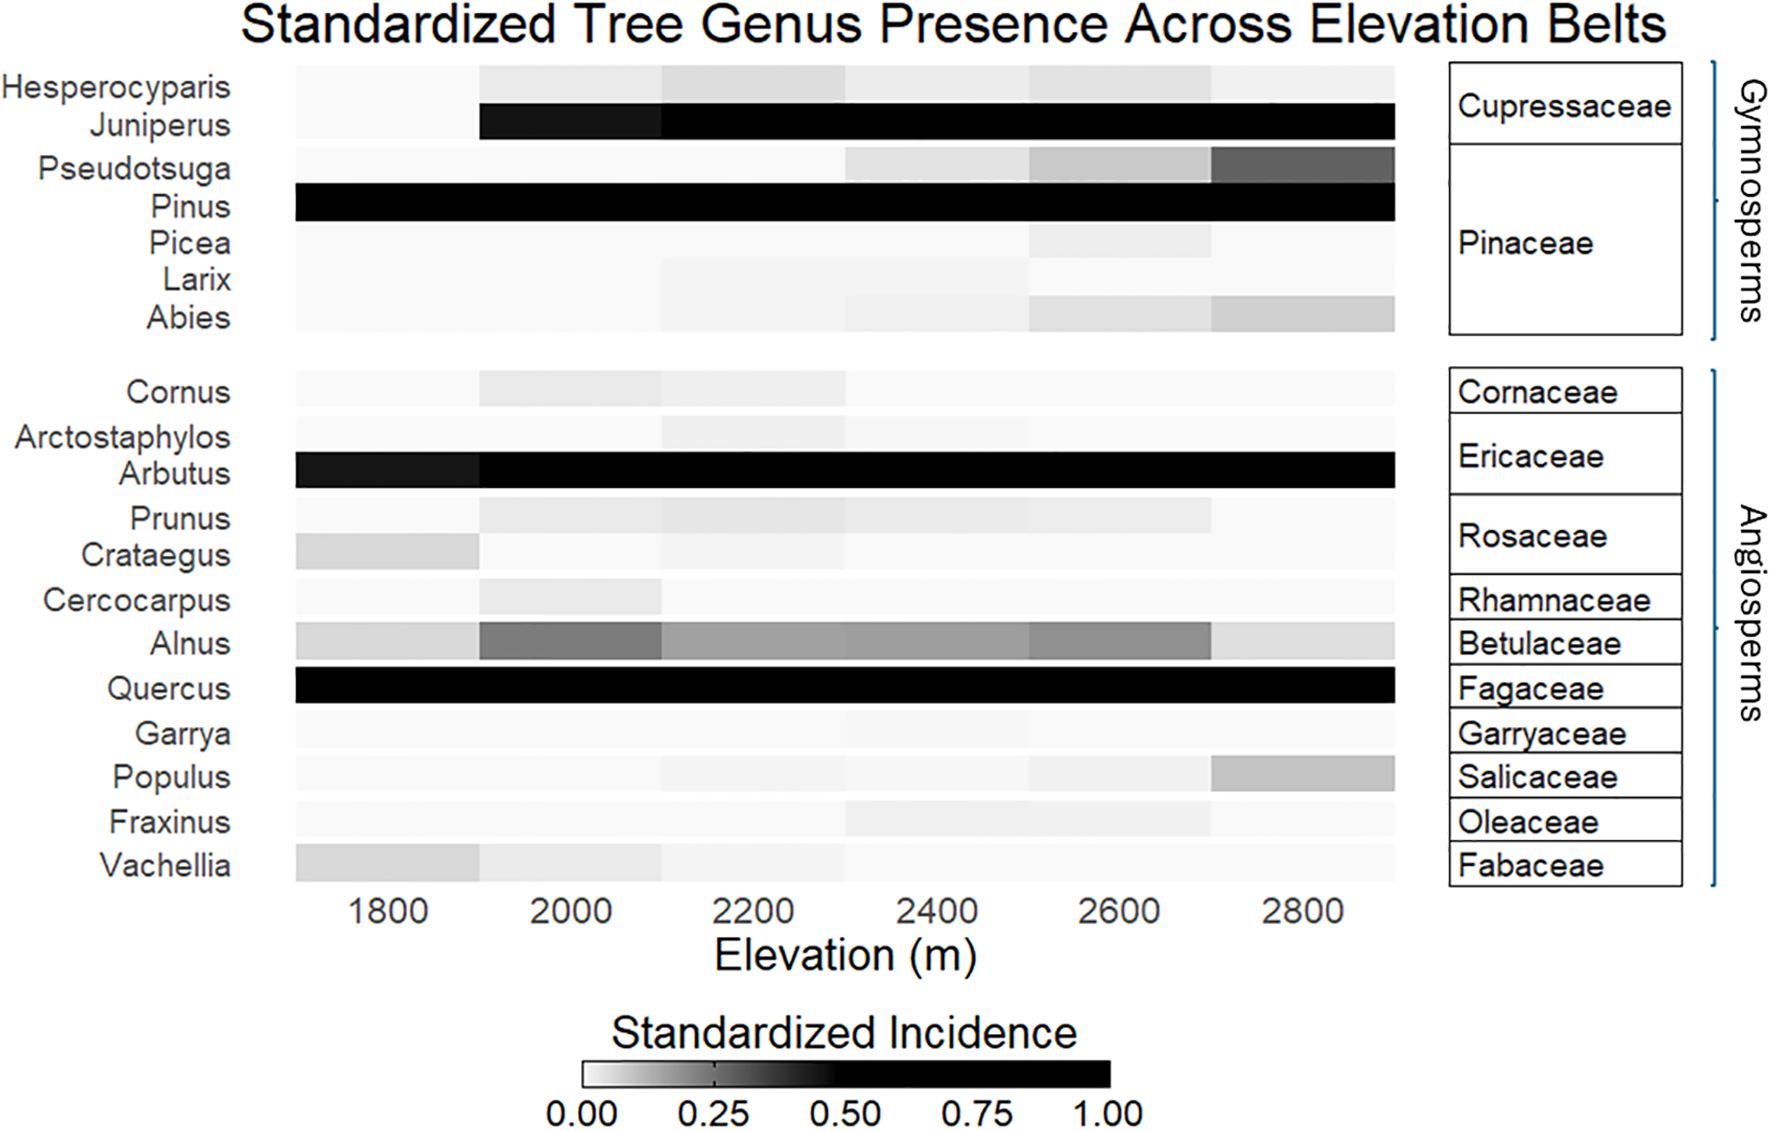
Figure 2. The most common genera along the elevation gradient. Tree genera are categorized by family and further divided into Gymnosperms and Angiosperms.

Figure 3. Diversity patterns along an elevational gradient in Durango, Mexico, represented by generalized linear models (GLMs) with 95% confidence intervals. (A) Taxonomic and (B) phylogenetic estimations against elevation in m a.s.l. Hill-Chao numbers were considered as diversity indices: q = 0 (left), q = 1 (center), and q = 2 (right).
On the other hand, the diversity analysis across elevational belts reflected interesting species diversity trends while accounting for a standardized number of plots and trees. For instance, elevational belts from 1800 m to 2400 m exhibit the highest taxonomic diversity (q0, q1, and q2), suggesting that mid-elevations have greater species richness, balanced abundances, and lower dominance (Figure 4A). Conversely, both the highest elevations (2600 m and 2800 m) display reduced diversity values across all orders, reflecting potential ecological constraints. Furthermore, curves for all diversity orders rise sharply with initial increases in sampling units and begin to plateau as they surpass the 36-plot threshold. The sample completeness curves show that fewer plots (i.e., lower sampling effort) are needed to reach sample completeness for the elevational belts from 2000 m to 2800 m, compared to the 1800 m belt (Figure 4B). Overall, the curves suggest that 36 standardized sampling units are sufficient to reach maximum sample coverage across all elevational belts. Moreover, the TD analysis, standardized to 400 trees per plot for each elevational belt, displayed the highest species richness (q0) at mid-elevations (from 2000 m to 2400 m) (Supplementary Figure S3A). This trend was also observed for q1 and q2, suggesting a balanced abundance and dominance within this elevational range. In contrast, the higher elevational belts (2600 m and 2800 m) exhibited the lowest TD estimations across all diversity orders. Finally, the sample completeness curves indicate that standardizing 200 trees per plot is sufficient to ensure robust sample completeness across all elevational belts (Supplementary Figure S3B).
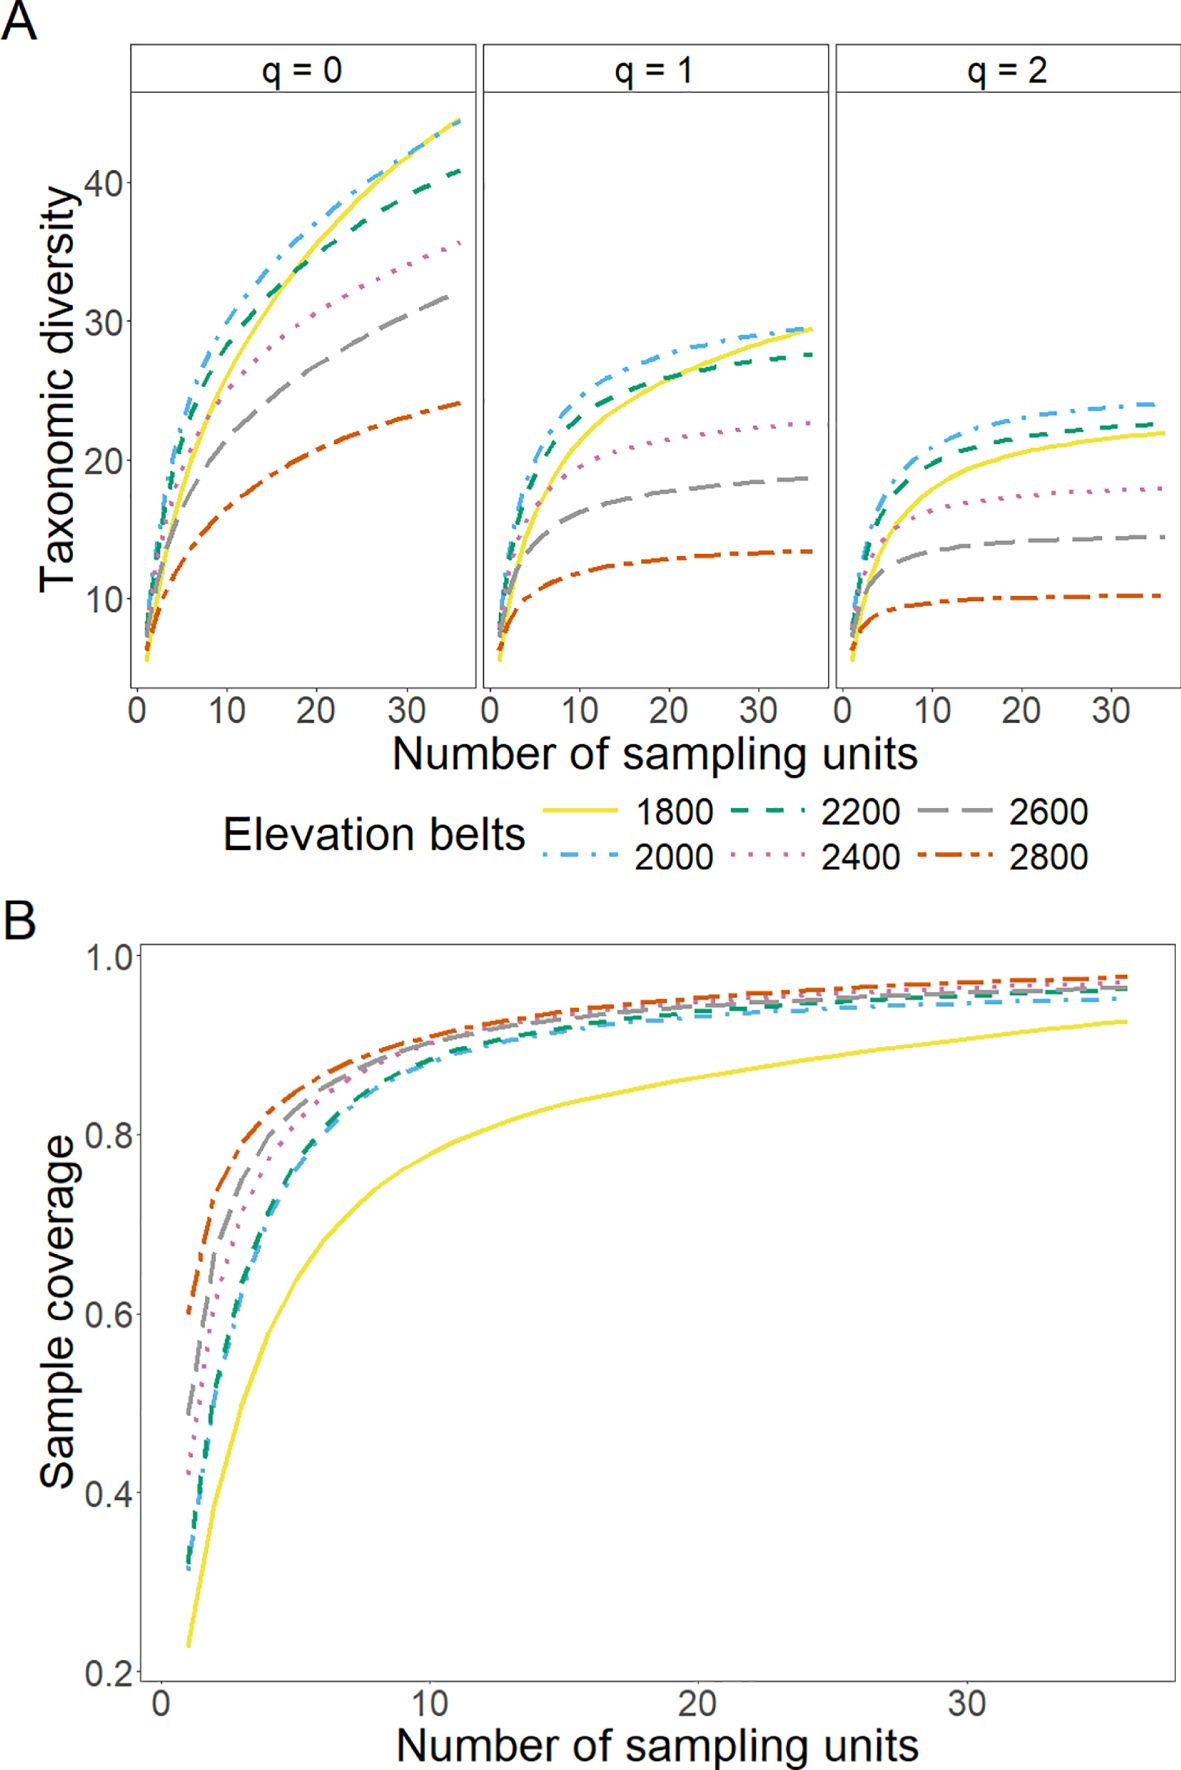
Figure 4. Sample-size-based sampling curve (A) and sample completeness curve (B) for taxonomic diversity as a function of the number of sampling units. Hill-Chao numbers were considered as diversity indices (A): q = 0 (left), q = 1 (center), and q = 2 (right). Different colors and line widths represent elevational belts (see legend).
Environmental drivers of diversity: climate, topography, and soil interactions
From all the 14 environmental variables considered in this study, climatic variables had a stronger influence on diversity patterns along the elevational gradient than edaphic and topographic variables.
According to the PCA results (Supplementary Figure S4), the first two principal components explain roughly 40% of data variance. On the other hand, PCA 3 and PCA 4 represent 9.6 and 8.1%, respectively. Overall, climate variables accounted for most of the contribution to data’s variance within the first component (i.e., temperature seasonality, relative humidity, and mean annual temperature). From the second component onwards, soil and topographic variables become relevant.
Upon examining the environmental variables and their impact on both TD and PD (Figures 5A, B, respectively), we found that precipitation seasonality is clearly negatively correlated with diversity, regardless of facet and Hill-Chao number. Moreover, both TD and PD reflected an apparent unimodal pattern with annual temperature for Hill-Chao diversity attributes q=1 and q=2. Interestingly, for annual precipitation, we detected an apparent unimodal pattern irrespective of Hill-Chao numbers for TD, whereas, for PD, the same patterns were true for only attributes q=1 and q=2.
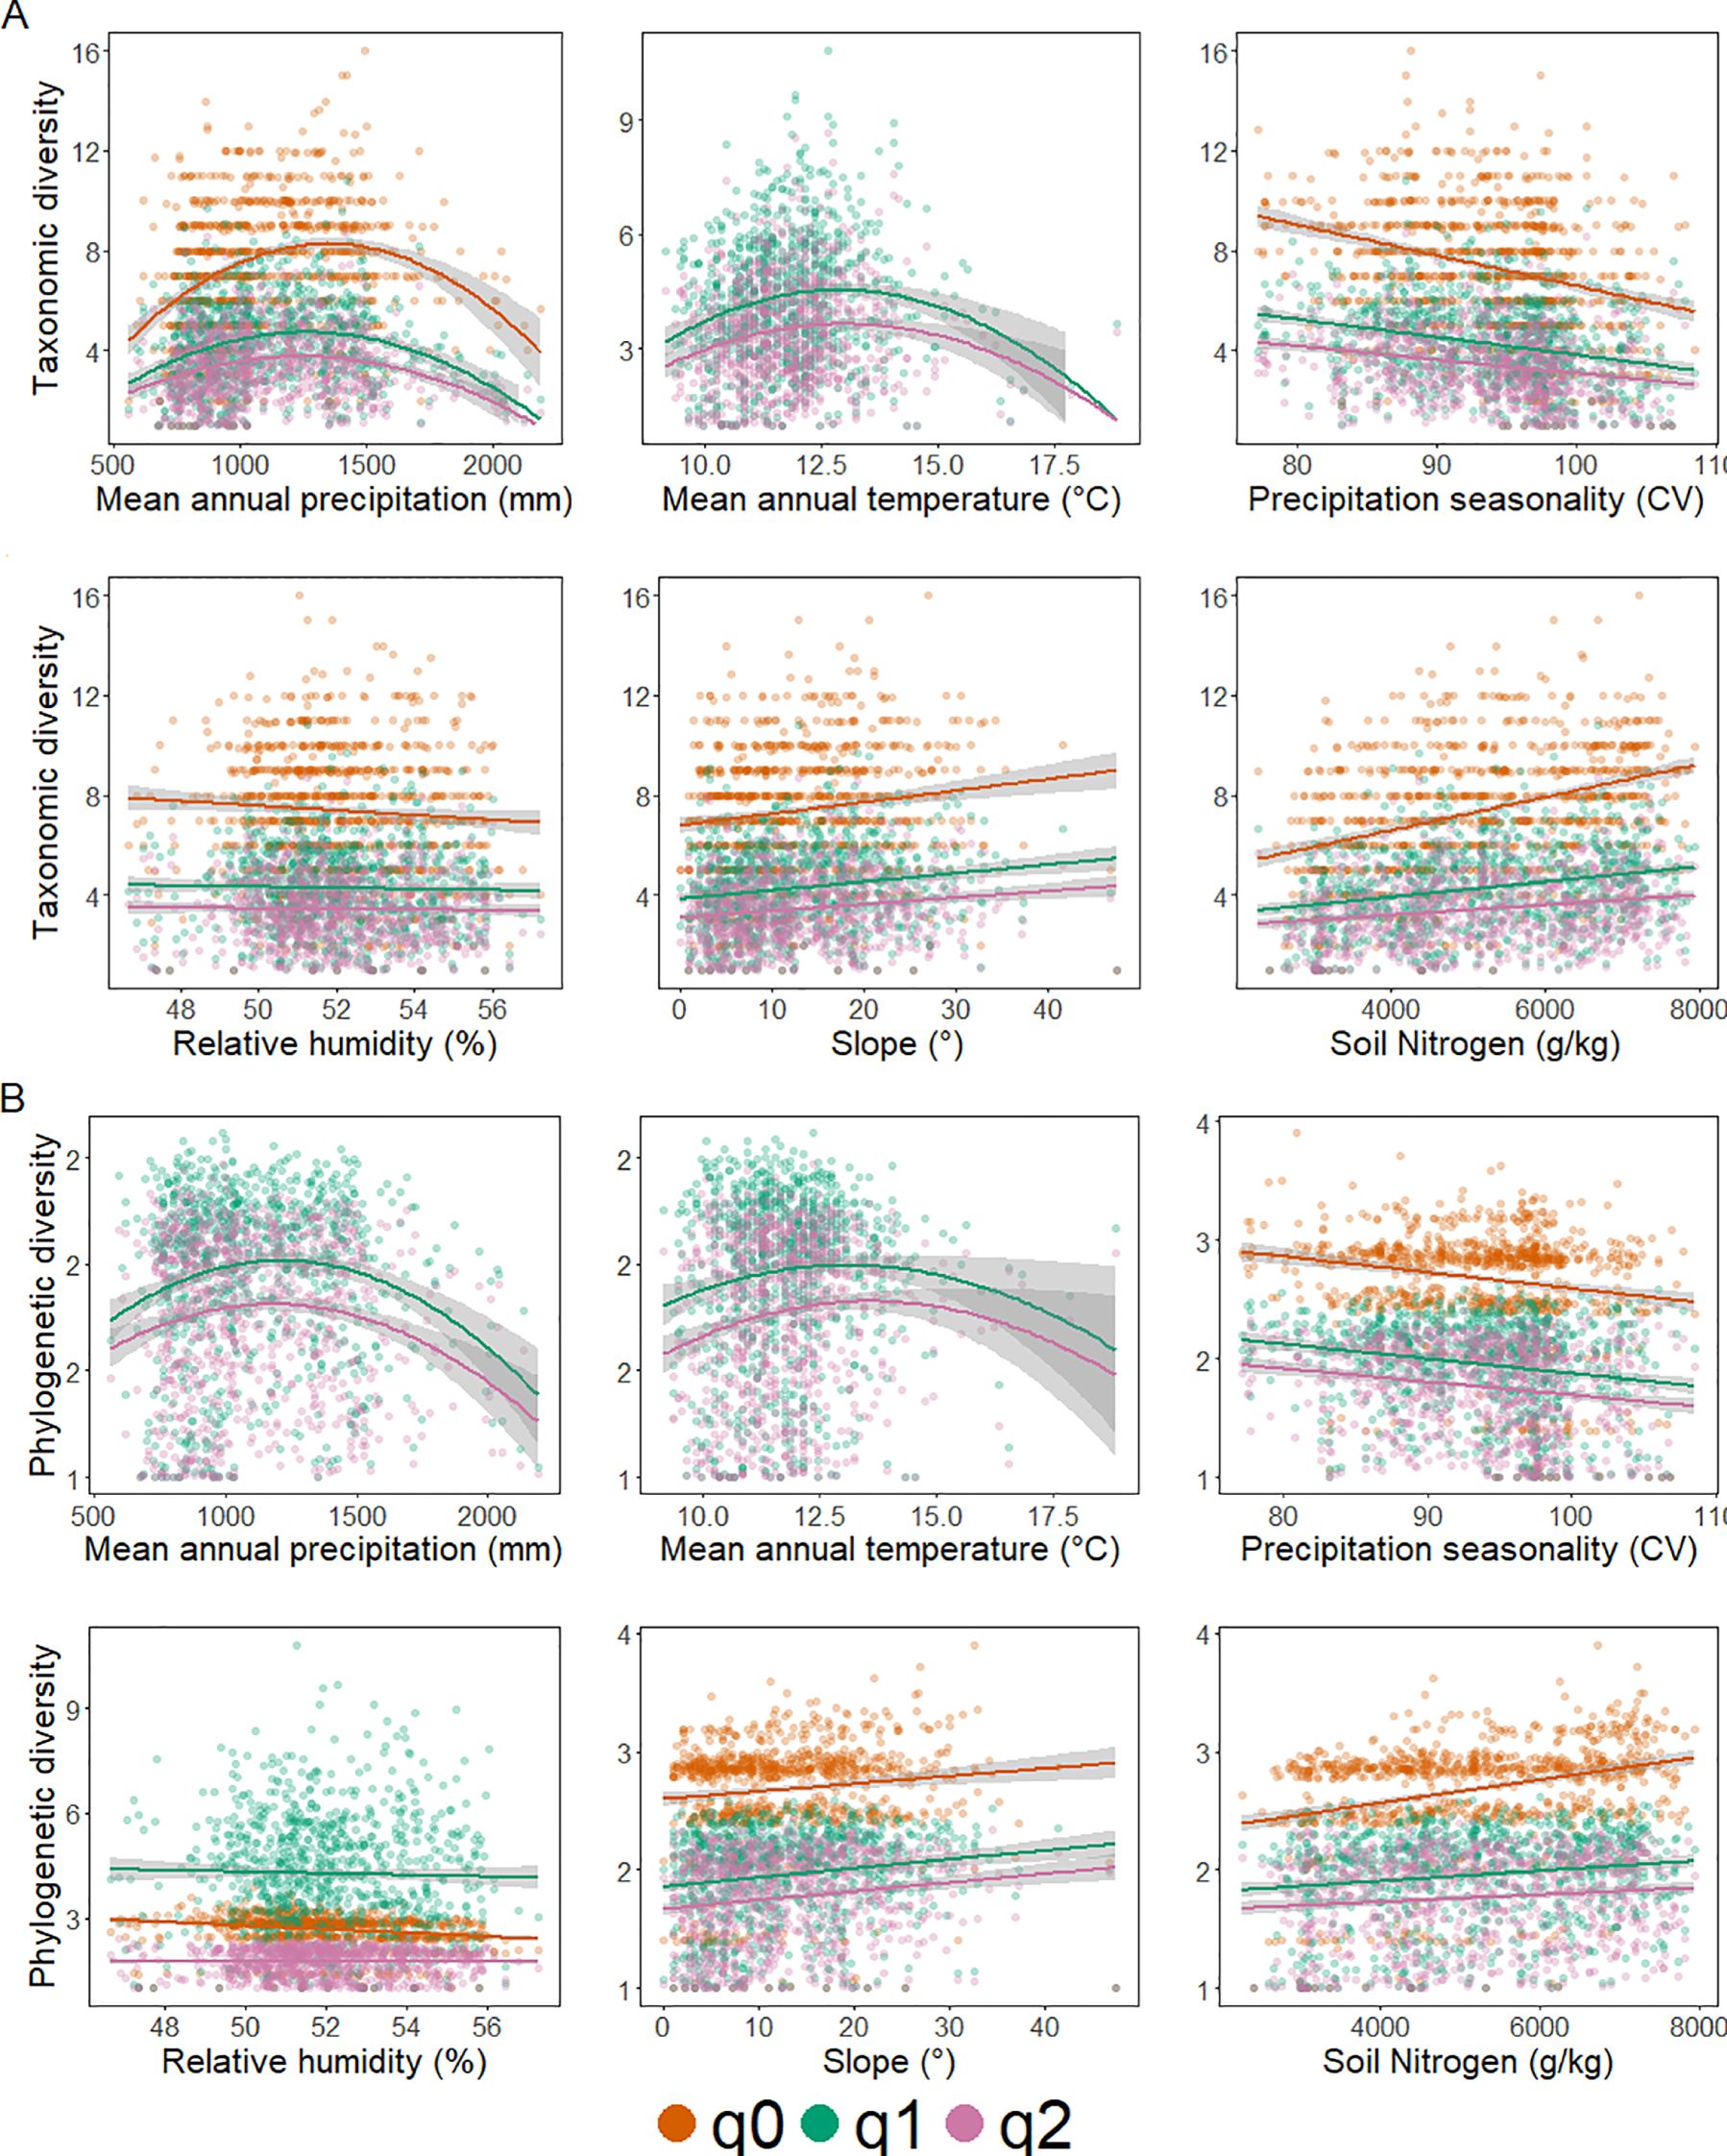
Figure 5. Scatter plots of the best-fit generalized linear models (GLMs) for each facet of diversity: (A) taxonomic diversity and (B) phylogenetic diversity. Hill-Chao numbers are shown in different colors: q = 0 (orange), q = 1 (green), and q = 2 (purple). Mean annual precipitation (mm), mean annual temperature (°C), precipitation seasonality (CV), relative humidity (%), slope (°), and soil Nitrogen content (g/Kg) represent the most relevant variables in the best-fit global models. Shaded envelopes represent the 95% confidence interval of the regression lines.
Discussion
We investigated diversity patterns along a gradient of elevation by modeling climate, soil, and topographic variables using an extensive array of permanent inventory plots as the primary database. Taxonomic diversity (TD) and phylogenetic diversity (PD) are positively correlated with each other for each of the diversity metrics (i.e., Hill-Chao numbers) used (Supplementary Figure S2). Such a relationship can be used to further explore the role and ecosystem function of species that tend to share similar habitats. Furthermore, we found similar patterns in TD and PD along the gradient of elevation. These patterns are not attributed to elevation itself but rather to changing climatic conditions along the elevational gradient. Finally, TD and PD were strongly correlated with climate-based variables, implying the relevance of environmental filtering within the area.
Phylogenetic and taxonomic diversity patterns along the elevational gradient
Across the elevational gradient of the Sierra Madre Occidental (SMO), both taxonomic diversity (TD) and phylogenetic diversity (PD) exhibited a unimodal pattern, with higher values at mid-elevations (Figure 3). This finding aligns with the Water-Energy Dynamics (WED) model, which predicts that diversity peaks at mid-elevations due to the interplay of water availability and energy inputs (Hawkins et al., 2003; O’Brien, 1998). Our results support this model and are consistent with other studies reporting similar unimodal diversity trends along elevation gradients in mountain regions (Bhatta et al., 2021; Nogués-Bravo et al., 2008; Vetaas et al., 2019).
At medium elevations, we observed the highest co-occurrence of angiosperms and gymnosperms, primarily represented by widespread pine-oak associations (Figure 2). The SMO is a recognized global hotspot and a major center of diversity for Quercus, Arbutus, and Pinus (González-Elizondo et al., 2012), and it is at these mid-elevations where these genera likely find the most favorable conditions. This convergence of contrasting lineages (angiosperms and gymnosperms) from potentially different origins (lowlands vs. highlands) may contribute to the elevated PD values observed at mid-elevations (Figure 3B) (Culmsee and Leuschner, 2013).
Towards higher elevations, however, we observed evidence of phylogenetic clustering. This refers to the tendency for closely related species to co-occur due to similar functional traits (Bryant et al., 2008; Webb et al., 2002). In our study, this clustering is likely driven by the increasing dominance of gymnosperms, particularly Pinus, at higher altitudes. These species are well-adapted to colder, harsher conditions, representing a strong environmental filter that selects for specific lineages (González-Elizondo et al., 2012). This explains the lower PD values associated with dominance (q=2) at higher elevations, as a few closely related species become increasingly prevalent (Figure 3B).
While both TD and PD showed significant correlations with elevation, the variance explained by elevation alone was relatively low (Supplementary Table S2). This suggests that other environmental factors contribute to the observed diversity patterns. Indeed, while unimodal elevational patterns are common, contrasting trends have also been documented, highlighting the complex interplay of environmental conditions, historical and evolutionary processes, sampling intensity, and anthropogenic disturbances (Brambach et al., 2017; Monge-González et al., 2021; Vetaas, 2021).
The plant communities within our study site appear to share a common evolutionary history, exhibiting similar functional traits and adaptability, suggesting that climate-based factors have shaped forest structure and diversity patterns through evolutionary adaptations. Although our study design broadly represents the forested areas of Durango and encompasses a significant elevational gradient, it does not explicitly isolate elevation as the sole driver of diversity. Furthermore, forest management in this region typically promotes biodiversity maintenance through irregular, mixed stands (Padilla-Martínez et al., 2020; Wehenkel et al., 2011), mirroring the natural structure of these woodlands. While we cannot completely rule out anthropogenic influences (potentially introducing confounding factors), the robust TD-PD correlation (Supplementary Figure S2) and the known phylogenetic relationships within these forests strongly suggest that shared evolutionary history and adaptation to climate-based factors are major contributors to the observed diversity patterns. Further research that explicitly controls for management history would provide valuable insights into disentangling these interacting influences.
Environmental drivers of diversity: climate, topography, and soil interactions
Our findings underscore the significant role of climate as a selective force, or environmental filter, shaping both taxonomic diversity (TD) and phylogenetic diversity (PD) along the elevational gradient. Global model selection and PCA confirmed that climatic variables are the primary drivers of diversity (Table 2; Figure 5), with four climatic variables consistently present in the best-fit models for both TD and PD: annual precipitation, annual temperature, precipitation seasonality, and relative humidity (Figures 5A, B; Table 2; Your article contains Supplementary Table S3). Topographic (slope) and edaphic (soil nitrogen content) variables also contributed significantly to the models.

Table 2. The 'best' models selected for Hill-Chao numbers of taxonomic diversity (TD) and phylogenetic diversity (PD), based on climate, soil, and topographic variables, are highlighted in bold.
Both TD and PD exhibited unimodal responses to annual precipitation and temperature, reflecting the importance of water-energy dynamics, as emphasized by the Water-Energy Dynamics (WED) model. This model posits that diversity peaks at mid-elevations, where a balance between water availability and energy inputs creates favorable conditions for plant establishment and coexistence (Hawkins et al., 2003; O’Brien, 1998). While the specific limiting factor (water or energy) can vary geographically, our findings suggest that both total annual precipitation and its seasonality are crucial drivers in the Sierra Madre Occidental. The unimodal pattern aligns with the idea that at lower elevations, higher evapotranspiration may limit diversity, while at higher elevations, frost can be a constraint (McCain and Grytnes, 2010).
Precipitation seasonality showed a negative correlation with both TD and PD. This highlights the importance of consistent water availability throughout the year for maintaining high diversity. The SMO, with its distinct dry and wet seasons, experiences significant fluctuations in water availability, and this seasonality likely acts as a strong environmental filter, restricting the distribution of species that cannot tolerate prolonged drought.
For PD, the unimodal patterns in response to annual precipitation and temperature were particularly evident for attributes q=1 and q=2 (Figure 5B). This aligns with the concept of environmental filtering influencing not just species richness but also the phylogenetic structure of communities. As environmental harshness increases (e.g., towards higher elevations with lower temperatures and greater seasonality), phylogenetic clustering is expected to increase (Bryant et al., 2008; Qian, 2014; Webb et al., 2002). This is because only species with specific adaptations, often shared among close relatives, can persist under these conditions. This is consistent with our observations of increased gymnosperm dominance at higher elevations, as discussed in the previous section. Furthermore, this pattern can be attributed to water availability and the degree of seasonal variation in precipitation and temperature across the SMO (González-Elizondo et al., 2012).
Beyond climatic factors, slope and soil nitrogen content also emerged as significant predictors of both taxonomic diversity (TD) and phylogenetic diversity (PD). Slope, in particular, influences diversity by creating microclimatic variation. Differences in sunlight exposure, temperature, and water availability across varying slopes lead to increased habitat heterogeneity, which, in turn, promotes species richness (Baldeck et al., 2016; Molina et al., 2024). Furthermore, hillslopes often provide deeper, better-drained soils, creating suitable conditions for a wider range of plant species. Soil nitrogen, a key indicator of soil quality and nutrient availability, plays a crucial role in forest dynamics. It interacts with soil organic carbon to influence forest productivity and stability (Bañares-de-Dios et al., 2022; de la Cruz-Amo et al., 2020; Ramesh et al., 2019), directly impacting the types of species that can thrive.
While our models revealed significant relationships between these environmental factors and tree diversity, the proportion of variance explained was relatively low. This scale dependence on environmental influences is a common challenge in ecological studies (Rahbek, 1995; Willig et al., 2003). The global-scale environmental data used in our study might not have fully captured the fine-scale variations in climate, topography, and soil conditions that occur within the forests of Durango. Furthermore, our study did not explicitly incorporate the potential influence of forest management practices, land-use intensity, and the limited availability of inventory data at lower elevations, which also restricts our ability to fully characterize diversity patterns across the entire elevational gradient.
Future research could benefit from incorporating higher-resolution environmental data, explicitly accounting for forest management practices and land use intensity, and including additional factors such as biotic interactions and historical events.
Conclusions
This study focus on the understanding of tree diversity patterns along elevational gradients in the Sierra Madre Occidental by demonstrating the interconnected roles of climate, evolutionary history, and phylogenetic structure. We conclude that elevation’s influence on diversity is indirect, primarily mediated by climatic factors – particularly water-energy dynamics (reflected in the unimodal TD pattern consistent with the WED model) and precipitation seasonality – which act as crucial environmental filters shaping both taxonomic and phylogenetic diversity.
Furthermore, our findings reveal a strong interplay between ecological and evolutionary processes. The robust positive correlation between TD and PD, coupled with evidence of phylogenetic clustering at higher elevations (driven by environmental filtering favoring specific lineages like Pinus) and the prevalence of widespread, phylogenetically related pine-oak associations, underscores that community assembly in this region reflects both shared environmental tolerances and common evolutionary trajectories (González-Elizondo et al., 2012). Simply examining species richness is insufficient; phylogenetic structure provides critical insights into the underlying mechanisms shaping these montane forests.
These conclusions have direct implications for forest management and conservation in Durango. The identification of mid-elevation zones as hotspots for both TD and PD highlights their priority for conservation efforts aimed at protecting unique species assemblages and evolutionary distinctiveness. Management strategies should consider promoting structural and compositional heterogeneity, particularly at mid-elevations, to maintain high diversity. While our findings provide valuable insights, the relatively low variance explained by the environmental models suggests that factors operating at finer scales or unmeasured variables (e.g., specific management interventions, biotic interactions, historical disturbances) also influence diversity patterns. Future research incorporating higher-resolution environmental data, explicitly accounting for detailed forest management histories, and potentially exploring functional trait diversity could further elucidate the complex drivers of diversity in this region. Ultimately, this study provides a crucial baseline and a more nuanced framework for predicting and managing forest biodiversity in the face of ongoing environmental change.
Data availability statement
The original contributions presented in the study are included in the article/supplementary material. The plot-level data utilized in this study is available upon request from the corresponding author/s. The data is part of the Red de Sitios Permanentes de Investigación Forestal y de Suelos, Monitoreo Nacional Forestal, http://fcfposgrado.ujed.mx/monafor/inicio/.
Author contributions
ND-A: Conceptualization, Data curation, Formal analysis, Investigation, Methodology, Visualization, Writing – original draft, Writing – review & editing. FB: Conceptualization, Methodology, Supervision, Validation, Visualization, Writing – review & editing. JC-R: Data curation, Resources, Validation, Writing – review & editing. ME: Conceptualization, Funding acquisition, Investigation, Project administration, Supervision, Validation, Visualization, Writing – review & editing.
Funding
The author(s) declare that financial support was received for the research and/or publication of this article. This research was possible thanks to continuous funding from the Katolische Akademische Ausländer Dienst (KAAD) through a PhD scholarship program 2. Likewise, the Silviculture and Forest Ecology of the Temperate Zones department at the University of Göttingen supported this research financially in its early stages. We acknowledge support from the Open Access Publication Funds of Göttingen University.
Acknowledgments
We express our sincere gratitude to Prof. Dr. Christian Ammer and Prof. Dr. Holger Kreft for their guidance in conceiving the research framework and continuous support throughout this study. We are also grateful to Dr. Javier Corral-Rivas and the inventory team from the Faculty of Forest Sciences at the Universidad Juárez del Estado de Durango for conducting the fieldwork and providing the database. We thank Dr. González-Elizondo for providing the vectorial data on the recent forest classification in the Sierra Madre Occidental. We also acknowledge the valuable contributions of Maria Laura Tolmos, Nathaly Guerrero, and Gustavo Paterno during the early stages of this research. We especially thank Mary Mulligan for her support with geospatial analysis. Finally, we gratefully acknowledge the financial support and assistance provided by the Katholische Akademische Ausländer Dienst (KAAD) and the Katolische Hochschulgemeinde Göttingen (KHG) throughout Domínguez-Amaya’s studies. Thank you to everyone for your contributions to this research.
Conflict of interest
The authors declare that the research was conducted in the absence of any commercial or financial relationships that could be construed as a potential conflict of interest.
Generative AI statement
The author(s) declare that no Generative AI was used in the creation of this manuscript.
Publisher’s note
All claims expressed in this article are solely those of the authors and do not necessarily represent those of their affiliated organizations, or those of the publisher, the editors and the reviewers. Any product that may be evaluated in this article, or claim that may be made by its manufacturer, is not guaranteed or endorsed by the publisher.
Supplementary material
The Supplementary Material for this article can be found online at: https://www.frontiersin.org/articles/10.3389/fevo.2025.1562841/full#supplementary-material
References
Abbass K., Qasim M. Z., Song H., Murshed M., Mahmood H., and Younis I. (2022). A review of the global climate change impacts, adaptation, and sustainable mitigation measures. Environ. Sci. pollut. Res. 29, 42539–42559. doi: 10.1007/s11356-022-19718-6
Ashton P. S. (2003). Floristic zonation of tree communities on wet tropical mountains revisited. Perspect. Plant Ecology Evol. Systematics 6, 87–104. doi: 10.1078/1433-8319-00044
Asner G. P., Knapp D. E., Martin R. E., Tupayachi R., Anderson C. B., Mascaro J., et al. (2014). Targeted carbon conservation at national scales with high-resolution monitoring. Proc. Natl. Acad. Sci. 111, E5016–E5022. doi: 10.1073/pnas.1419550111
Baldeck C. A., Tupayachi R., Sinca F., Jaramillo N., and Asner G. P. (2016). Environmental drivers of tree community turnover in western Amazonian forests. Ecography 39, 1089–1099. doi: 10.1111/ecog.01575
Bañares-de-Dios G., Macía M. J., de Carvalho G. M., Arellano G., and Cayuela L. (2022). Soil and climate drive floristic composition in tropical forests: A literature review. Front. Ecol. Evol. 10. doi: 10.3389/fevo.2022.866905
Bartoń K. (2023). MuMIn: multi-model inference tools for model selection and averaging. R package version 1. Available online at: https://CRAN.R-project.org/package=MuMIn (Accessed May 6, 2024).
Ben Saadi C., Cayuela L., Bañares de Dios G., de Aledo J. G., Matas-Granados L., Salinas N., et al. (2022). Latitudinal patterns and environmental drivers of taxonomic, functional, and phylogenetic diversity of woody plants in western Amazonian terra firme forests. Front. Plant Sci. 13. doi: 10.3389/fpls.2022.978299
Bertuzzo E., Carrara F., Mari L., Altermatt F., Rodriguez-Iturbe I., and Rinaldo A. (2016). Geomorphic controls on elevational gradients of species richness. Proc. Natl. Acad. Sci. 113, 1737–1742. doi: 10.1073/pnas.1518922113
Bhatta K. P., Robson B. A., Suwal M. K., and Vetaas O. R. (2021). A pan-Himalayan test of predictions on plant species richness based on primary production and water-energy dynamics. Front. Biogeography 13. doi: 10.21425/F5FBG49459
Boyle B., Hopkins N., Lu Z., Raygoza Garay J. A., Mozzherin D., Rees T., et al. (2013). The taxonomic name resolution service: An online tool for automated standardization of plant names. BMC Bioinf. 14, 16. doi: 10.1186/1471-2105-14-16
Brambach F., Leuschner C., Tjoa A., and Culmsee H. (2017). Diversity, endemism, and composition of tropical mountain forest communities in Sulawesi, Indonesia, in relation to elevation and soil properties. Perspect. Plant Ecology Evol. Systematics 27, 68–79. doi: 10.1016/j.ppees.2017.06.003
Brown J. H. (2014). Why are there so many species in the tropics? J. Biogeography 41, 8–22. doi: 10.1111/jbi.12228
Bryant J. A., Lamanna C., Morlon H., Kerkhoff A. J., Enquist B. J., and Green J. L. (2008). Microbes on mountainsides: Contrasting elevational patterns of bacterial and plant diversity. Proc. Natl. Acad. Sci. 105, 11505–11511. doi: 10.1073/pnas.0801920105
Chao A., Chiu C.-H., and Jost L. (2014a). Unifying species diversity, phylogenetic diversity, functional diversity, and related similarity and differentiation measures through hill numbers. Annu. Rev. Ecology Evolution Systematics 45, 297–324. doi: 10.1146/annurev-ecolsys-120213-091540
Chao A., Gotelli N. J., Hsieh T. C., Sander E. L., Ma K. H., Colwell R. K., et al. (2014b). Rarefaction and extrapolation with Hill numbers: a framework for sampling and estimation in species diversity studies. Ecol. Monogr. 84, 45–67. doi: 10.1890/13-0133.1
Chao A., Henderson P. A., Chiu C.-H., Moyes F., Hu K.-H., Dornelas M., et al. (2021). Measuring temporal change in alpha diversity: A framework integrating taxonomic, phylogenetic and functional diversity and the iNEXT.3D standardization. Methods Ecol. Evol. 12, 1926–1940. doi: 10.1111/2041-210X.13682
Chao A. and Hu K.-H. (2023). The iNEXT.3D package: interpolation and extrapolation for three dimensions of biodiversity. R package available from CRAN. GitHub - KaiHsiangHu/iNEXT.3D: Interpolation and Extrapolation for three dimensions of biodiversity. (Accessed March 1, 2025).
Chao A. and Jost L. (2012). Coverage-based rarefaction and extrapolation: standardizing samples by completeness rather than size. Ecology 93, 2533–2547. doi: 10.1890/11-1952.1
Chávez-Flores G. A., Corral-Rivas J. J., Vega-Nieva J. D., López-Serrano P. M., Rubio-Camacho E. A., Chávez-Flores G. A., et al. (2020). Estructura espacial de los bosques mixtos e irregulares en el estado de Durango. Rev. mexicana Cienc. forestales 11, 141–162. doi: 10.29298/rmcf.v11i59.614
Chu C., Lutz J. A., Král K., Vrška T., Yin X., Myers J. A., et al. (2019). Direct and indirect effects of climate on richness drive the latitudinal diversity gradient in forest trees. Ecol. Lett. 22, 245–255. doi: 10.1111/ele.13175
Corral-Rivas J. J., Larreta B., Wehenkel C., Aguirre Calderon O. A., J.G. Á., and Rojo-Alboreca A. (2009). Guía para el establecimiento de sitios de investigación forestal y de suelos en bosques del Estado de Durango. Available at: https://www.scribd.com/document/568217075/Guia-Para-El-Establecimiento-de-Parcelas (Accessed March 1, 2025).
Costa F. V., Viana-Júnior A. B., Aguilar R., Silveira F. A. O., and Cornelissen T. G. (2023). Biodiversity and elevation gradients: Insights on sampling biases across worldwide mountains. J. Biogeography 50, 1879–1889. doi: 10.1111/jbi.14696
Crecente-Campo F., Corral-Rivas J. J., Vargas-Larreta B., and Wehenkel C. (2014). Can random components explain differences in the height–diameter relationship in mixed uneven-aged stands? Ann. For. Sci. 71, 51–70. doi: 10.1007/s13595-013-0332-6
Culmsee H. and Leuschner C. (2013). Consistent patterns of elevational change in tree taxonomic and phylogenetic diversity across Malesian mountain forests. J. Biogeography 40, 1997–2010. doi: 10.1111/jbi.12138
Davies T. J. and Buckley L. B. (2011). Phylogenetic diversity as a window into the evolutionary and biogeographic histories of present-day richness gradients for mammals. Phil. Trans. R. Soc B 366, 2414–2425. doi: 10.1098/rstb.2011.0058
de la Cruz-Amo L., Bañares-de-Dios G., Cala V., Granzow-de la Cerda Í., Espinosa C. I., Ledo A., et al. (2020). Trade-offs among aboveground, belowground, and soil organic carbon stocks along altitudinal gradients in andean tropical montane forests. Front. Plant Sci. 11. doi: 10.3389/fpls.2020.00106
Dormann C. F., Elith J., Bacher S., Buchmann C., Carl G., Carré G., et al. (2013). Collinearity: a review of methods to deal with it and a simulation study evaluating their performance. Ecography 36, 27–46. doi: 10.1111/j.1600-0587.2012.07348.x
Faith D. P. (1992). Conservation evaluation and phylogenetic diversity. Biol. Conserv. 61, 1–10. doi: 10.1016/0006-3207(92)91201-3
Field R., Hawkins B. A., Cornell H. V., Currie D. J., Diniz-Filho J. A. F., Guégan J.-F., et al. (2009). Spatial species-richness gradients across scales: a meta-analysis. J. Biogeography 36, 132–147. doi: 10.1111/j.1365-2699.2008.01963.x
Flores-Morales E. A., Aguirre-Calderón O. A., Treviño-Garza E. J., González-Tagle M. A., Alanís-Rodríguez E., Angeles-Pérez G., et al. (2022). Diversidad y estructura arbórea de un bosque templado bajo manejo en el municipio de pueblo nuevo, Durango, México. Polibotánica, 11–26. doi: 10.18387/polibotanica.54.2
González-Elizondo M. S., González-Elizondo M., Tena-Flores J. A., Ruacho-González L., and López-Enríquez I. L. (2012). Vegetación de la Sierra Madre Occidental, México: una síntesis. Acta botánica mexicana, 351–403. http://www.scielo.org.mx/scielo.php?script=sci_abstract&pid=S0187-71512012000300012&lng=en&nrm=iso&tlng=es
Gorelick N., Hancher M., Dixon M., Ilyushchenko S., and Thau D. (2017). Google Earth Engine: A planetary-scale geospatial analysis platform. Remote Sens. Environ. 202, 18–27. doi: 10.1016/j.rse.2017.06.031
Gotelli N. J. and Colwell R. K. (2001). Quantifying biodiversity: procedures and pitfalls in the measurement and comparison of species richness. Ecol. Lett. 4, 379–391. doi: 10.1046/j.1461-0248.2001.00230.x
Grytnes J. A. and Romdal T. S. (2008). Using museum collections to estimate diversity patterns along geographical gradients. Folia Geobotanica 43, 357–359. doi: 10.1007/s12224-008-9017-6
Guo Q., Kelt D. A., Sun Z., Liu H., Hu L., Ren H., et al. (2013). Global variation in elevational diversity patterns. Sci. Rep. 3, 3007. doi: 10.1038/srep03007
Hassler M. (2025). World Plants. Synonymic Checklist and Distribution of the World Flora. Version 25.04; last update April 17t. Available online at: www.worldplants.de (Accessed March 1, 2025).
Hawkins B. A., Field R., Cornell H. V., Currie D. J., Guégan J.-F., Kaufman D. M., et al. (2003). Energy, water, and broad-scale geographic patterns of species richness. Ecology 84, 3105–3117. doi: 10.1890/03-8006
Hill M. O. (1973). Diversity and evenness: A unifying notation and its consequences. Ecology 54, 427–432. doi: 10.2307/1934352
Jin Y. and Qian H. (2019). V.PhyloMaker: an R package that can generate very large phylogenies for vascular plants. Ecography 42, 1353–1359. doi: 10.1111/ecog.04434
Jin Y. and Qian H. (2022). V.PhyloMaker2: An updated and enlarged R package that can generate very large phylogenies for vascular plants. Plant Diversity 44, 335–339. doi: 10.1016/j.pld.2022.05.005
Karger D. N., Conrad O., Böhner J., Kawohl T., Kreft H., Soria-Auza R. W., et al. (2017). Climatologies at high resolution for the earth’s land surface areas. Sci. Data 4, 170122. doi: 10.1038/sdata.2017.122
Kassambara A. and Mundt F. (2020). FactoExtra: extract and visualize the results of multivariate data analyses. R package version 1.0.7. Available online at: https://CRAN.R-project.org/package=factoextra (Accessed February 6, 2024).
Körner C. (2007). The use of ‘altitude’ in ecological research. Trends Ecol. Evol. 22, 569–574. doi: 10.1016/j.tree.2007.09.006
Lê S., Josse J., and Husson F. (2008). FactoMineR: an R package for multivariate analysis. J. Stat. Software 25, 1–18. doi: 10.18637/jss.v025.i01
López Serrano P., Domínguez J., Corral-Rivas J. J., Jiménez E., López-Sánchez C., and Vega-Nieva D. (2019). Modeling of aboveground biomass with landsat 8 OLI and machine learning in temperate forests. Forests 11, 18. doi: 10.3390/f11010011
Lüdecke D., Ben-Shachar M. S., Patil I., Waggoner P., and Makowski D. (2021). Performance: an R package for assessment, comparison and testing of statistical models. J. Open Source Software 6, 3139. doi: 10.21105/joss.03139
McCain C. M. (2007). Area and mammalian elevational diversity. Ecology 88, 76–86. doi: 10.1890/0012-9658(2007)88[76:AAMED]2.0.CO;2
McCain C. M. and Grytnes J.-A. (2010). Elevational gradients in species richness. doi: 10.1002/9780470015902.a0022548
Molina A., Vanacker V., Chadwick O., Zhiminaicela S., Corre M., and Veldkamp E. (2024). Vegetation patterns associated with nutrient availability and supply in high-elevation tropical Andean ecosystems. Biogeosciences 21, 3075–3091. doi: 10.5194/bg-21-3075-2024
Monge-González M. L., Guerrero-Ramírez N., Krömer T., Kreft H., and Craven D. (2021). Functional diversity and redundancy of tropical forests shift with elevation and forest-use intensity. J. Appl. Ecol. 58, 1827–1837. doi: 10.1111/1365-2664.13955
NASA (2024). Shuttle radar topography mission (SRTM): digital elevation model. Available online at: https://www.earthdata.nasa.gov/topics/land-surface/digital-elevation-terrain-model-dem/data-access-tools (Accessed June 6, 2024).
Nogués-Bravo D., Araújo M. B., Romdal T., and Rahbek C. (2008). Scale effects and human impact on the elevational species richness gradients. Nature 453, 216–219. doi: 10.1038/nature06812
O’Brien E. M. (1998). Water-energy dynamics, climate, and prediction of woody plant species richness: an interim general model. J. Biogeography 25, 379–398. https://www.jstor.org/stable/2846224
Padilla-Martínez J. R., Corral-Rivas J. J., Briseño-Reyes J., Paul C., López-Serrano P. M., and v. Gadow K. (2020). Patterns of density and production in the community forests of the sierra madre occidental, Mexico. Forests 11, 307. doi: 10.3390/f11030307
Paúl M. J., Rosauer D., Tarroso P., Velo-Antón G., and Carvalho S. B. (2023). Environmental and topographic drivers of amphibian phylogenetic diversity and endemism in the Iberian Peninsula. Ecol. Evol. 13, e9666. doi: 10.1002/ece3.9666
Peters M. K., Hemp A., Appelhans T., Behler C., Classen A., Detsch F., et al. (2016). Predictors of elevational biodiversity gradients change from single taxa to the multi-taxa community level. Nat. Commun. 7, 13736. doi: 10.1038/ncomms13736
Poggio L., de Sousa L. M., Batjes N. H., Heuvelink G. B. M., Kempen B., Ribeiro E., et al. (2021). SoilGrids 2.0: producing soil information for the globe with quantified spatial uncertainty. SOIL 7, 217–240. doi: 10.5194/soil-7-217-2021
Qian H. (2014). Contrasting relationships between clade age and temperature along latitudinal versus elevational gradients for woody angiosperms in forests of South America. Journal of Vegetation Science 25 (5), 1208–1215. doi: 10.1111/jvs.12175
Qian H. and Ricklefs R. E. (2016). Out of the tropical lowlands: latitude versus elevation. Trends Ecol. Evol. 31, 738–741. doi: 10.1016/j.tree.2016.07.012
Rahbek C. (1995). The elevational gradient of species richness: a uniform pattern? Ecography 18, 200–205. doi: 10.1111/j.1600-0587.1995.tb00341.x
Rahbek C., Borregaard M. K., Antonelli A., Colwell R. K., Holt B. G., Nogues-Bravo D., et al. (2019). Building mountain biodiversity: Geological and evolutionary processes. Science 365, 1114–1119. doi: 10.1126/science.aax0151
Ramesh T., Bolan N. S., Kirkham M. B., Wijesekara H., Kanchikerimath M., Srinivasa Rao C., et al. (2019). Chapter One - Soil organic carbon dynamics: Impact of land use changes and management practices: A review, in: Sparks, D.L. (Ed.) Adv. Agronomy. Acad. Press pp, 1–107. doi: 10.1016/bs.agron.2019.02.001
R Core Team (2023). R: A language and environment for statistical computing (Vienna: R Foundation for Statistical Computing).
Roswell M., Dushoff J., and Winfree R. (2021). A conceptual guide to measuring species diversity. Oikos 130, 321–338. doi: 10.1111/oik.07202
Salinas N., Cosio E. G., Silman M., Meir P., Nottingham A. T., Roman-Cuesta R. M., et al. (2021). Editorial: tropical montane forests in a changing environment. Front. Plant Sci. 12. doi: 10.3389/fpls.2021.712748
Schall P., Gossner M. M., Heinrichs S., Fischer M., Boch S., Prati D., et al. (2018). The impact of even-aged and uneven-aged forest management on regional biodiversity of multiple taxa in European beech forests. J. Appl. Ecol. 55, 267–278. doi: 10.1111/1365-2664.12950
Silva García J. E., Aguirre Calderón O. A., Alanís Rodríguez E., Jurado Ybarra E., Jiménez Pérez J., Vargas Larreta B., et al. (2021). Estructura y diversidad de especies arbóreas en un Bosque templado del Noroeste de México. Polibotánica, 89–102. doi: 10.18387/polibotanica.52.7
Tolmos M. L., Kreft H., Ramirez J., Ospina R., and Craven D. (2022). Water and energy availability mediate biodiversity patterns along an elevational gradient in the tropical Andes. J. Biogeography 49, 712–726. doi: 10.1111/jbi.14332
Vetaas O. (2021). Mountain biodiversity and elevational gradients. Front. Biogeography 13. doi: 10.21425/F5FBG54146
Vetaas O. R., Paudel K. P., and Christensen M. (2019). Principal factors controlling biodiversity along an elevation gradient: Water, energy and their interaction. J. Biogeography 46, 1652–1663. doi: 10.1111/jbi.13564
Webb C. O., Ackerly D. D., McPeek M. A., and Donoghue M. J. (2002). Phylogenies and community ecology. Annu. Rev. Ecol. Systematics 33, 475–505. doi: 10.1146/annurev.ecolsys.33.010802.150448
Wehenkel C., Corral-Rivas J. J., Hernandez-Díaz J., and Gadow K. (2011). Estimating balanced structure areas in multi-species forests on the Sierra Madre Occidental, Mexico. Ann. For. Sci. 68, 385–394. doi: 10.1007/s13595-011-0027-9
Keywords: taxonomic diversity, phylogenetic diversity, Hill-Chao numbers, elevational gradient, diversity patterns, environmental drivers
Citation: Domínguez-Amaya N, Brambach F, Corral-Rivas JJ and Ehbrecht M (2025) Tree diversity patterns along an elevational gradient in Durango, Mexico. Front. Ecol. Evol. 13:1562841. doi: 10.3389/fevo.2025.1562841
Received: 18 January 2025; Accepted: 05 May 2025;
Published: 02 June 2025.
Edited by:
Francesco Cerasoli, University of L’Aquila, ItalyReviewed by:
László Erdős, Hungarian Academy of Science, HungaryJie Zheng, Southwest University, China
Copyright © 2025 Domínguez-Amaya, Brambach, Corral-Rivas and Ehbrecht. This is an open-access article distributed under the terms of the Creative Commons Attribution License (CC BY). The use, distribution or reproduction in other forums is permitted, provided the original author(s) and the copyright owner(s) are credited and that the original publication in this journal is cited, in accordance with accepted academic practice. No use, distribution or reproduction is permitted which does not comply with these terms.
*Correspondence: Norberto Domínguez-Amaya, bm9yYmVydG9fZGFAb3V0bG9vay5jb20=