 Caitlin K. Brett
 Anna R. Mehner
 John H. Young Jr.
 Sarah E. Lehnen
 Richard J. Kline
- 1School of Earth, Environmental, and Marine Sciences, University of Texas Rio Grande Valley, Brownsville, TX, United States
- 2Texas Department of Transportation, Austin, TX, United States
- 3Division of Biological Sciences, U.S. Fish and Wildlife Service, Albuquerque, NM, United States
Roads can negatively impact the wildlife communities they transect. Road mortalities from wildlife-vehicle collisions are one direct effect, but roads may also indirectly affect wildlife behavior, movement, or local distribution. Quantifying the spatial extent of these road-effects is important for understanding how roads indirectly affect species of concern, identifying potential sources of disturbance, and for estimating the effectiveness of road mitigation structures. Farm-to-Market Road (FM)106, which transects part of the Laguna Atascosa National Wildlife Refuge in Cameron County, Texas, has been identified as a potential source of wildlife road mortalities, particularly for one of the two remaining breeding populations of ocelots (Leopardus pardalis) in the United States. Wildlife crossing structures (WCS) have been constructed on FM106 to mitigate these losses, however, the indirect effects of FM106 on wildlife have not yet been investigated. This study used camera trap arrays to quantify activity surrounding FM106 for four mammal species. Within each species, activity patterns were compared at roadside versus habitat reference sites to identify if proximity to the road significantly impacted the temporal distribution of target species throughout a typical day-night cycle. Temporal road avoidance, quantified as shifts towards more nocturnal activity at roadside sites, was seen for bobcat (Lynx rufus; p=0.04), coyote (Canis latrans; p=0.01), and white-tailed deer (Odocoileus virginianus; p<0.001), but not for striped skunk (Mephitis mephitis). Spatial distribution was also quantified for each of these species by modeling detection data at varying distances to FM106 while also considering the influence of vegetation and other landscape factors. Bobcats and coyotes displayed a limited degree of attractance to the roadside whereas white-tailed deer and skunks seemed unaffected by proximity to the road. These results indicate that while there may be advantages to accessing roadside sites (e.g., scavenging, hunting, or travel opportunities), certain species tend to modify their daily movement behavior to selectively use these areas at times when vehicular traffic is at its lowest.
1 Introduction
Anthropogenic, linear infrastructure features (e.g. roads, fencing, and railroads) have long impacted the landscapes they transect (van der Ree et al., 2015; Jakes et al., 2018). The ubiquity and pace of modern construction projects far outmatch that of potential evolutionary adaptation, thereby challenging biotic communities in a way that comparable natural landscape features (e.g., rivers, canyons) do not (Fahrig, 2007). Rural roads and highways make up less than 1% of land in the continental U.S (Bigelow and Borchers, 2017). However, given that over 80% of that same area is located within a kilometer or less of a road (Riitters and Wickham, 2003), the potentially negative and interdependent effects of roads may have an outsized impact on the biotic communities they transect.
In addition to direct effects on wildlife, such as mortalities from vehicle collisions, the indirect effects of roads can include habitat fragmentation and sensory (i.e. traffic noise, light) disturbance. These in turn may lead to degraded habitat availability (de Molenaar et al., 2006), altered trophic interactions (Clevenger and Waltho, 2000; Ditmer et al., 2021), behavioral or phenological changes (Reijnen et al., 1995; McClure et al., 2013), species introductions (Hansen and Clevenger, 2005), long-term decline of population persistence, and genetic isolation (Jaeger and Fahrig, 2004; Jaeger et al., 2005; van der Ree et al., 2015; Janečka et al., 2011). These effects vary depending on the behavior (i.e. degree of road avoidance) and biology (i.e. movement capability, home range size, life span, reproductive rate) of the species or population in question (Jaeger et al., 2005; Fahrig and Rytwinski, 2009). Even seemingly positive effects that roads may have on individual species, such as lessened predation risk, access to areas for thermoregulation, or foraging opportunities (Morelli et al., 2014; Fahrig and Rytwinski, 2009) may actually represent the decoupling of important trophic relationships to the deficit of the overall biotic community (Clevenger and Waltho, 2005).
This cumulative “road-effect zone” has been shown in previous research to extend anywhere from tens to thousands of meters into the surrounding landscape (Forman and Alexander, 1998; Forman and Deblinger, 2000; Reijnen et al., 1995; Benítez-López et al., 2010; Hansen and Clevenger, 2005). Effect-distances are commonly based on observed changes in the relative abundance or density of a species with increasing distance to a roadway, but more recent studies have also considered wildlife movement, activity indices, or diel activity (i.e. activity within a typical 24-hour period) to assess how roads and other forms of human disturbance may alter wildlife behavioral patterns (Barrueto et al., 2014; Andis et al., 2017; Gaynor et al., 2018a; Watabe and Saito, 2021). Wildlife diel activity was previously quantified on an adjacent South Texas mitigation corridor (Yamashita, 2020), though this study was limited to within 150 m of the highway and focused on the influence of human activity detected at camera trap sites rather than the influence of roadway traffic. Identifying road or traffic avoidance specifically may be important because such behaviors can have negative long-term implications for mitigation structure performance. Gagnon et al. (2011) suggested that the likelihood of WCS habituation and use will increase with increased encounters with mitigation structures.
The primary objective of this study was to quantify the spatiotemporal extent of the road-effect zone for four South Texas mammal species by quantifying how proximity to FM106 may alter species detections across the study area and the temporal distribution of target species activity across a day-night cycle. The study used 10 months of camera trap data to quantify target species detections and diel activity patterns up to 1 km away from the roadway and to directly compare these activity curves with similarly recorded vehicular traffic patterns. Data were used to test whether target species detections increased with increased distance to the road, and whether target species’ temporal activity patterns shifted significantly to avoid overlap with traffic on FM106.
Data collection for this research was part of an ongoing effort to document ocelot responses to wildlife underpass crossing structures on FM106. In lieu of often scarce ocelot detection data, bobcats have previously been used as surrogates for assessing road mortality risk for ocelots (Schmidt et al., 2020). Bobcats may also display similar habitat selection patterns (Lombardi et al., 2020a), though some studies suggest that these species exhibit temporal partitioning where their ranges overlap in South Texas (Leonard et al., 2020). Due to the low number of anticipated ocelot detections, target species for this study were limited to four more-commonly observed mammal species: bobcat (Lynx rufus), coyote (Canis latrans), striped skunk (Mephitis mephitis), and white-tailed deer (Odocoileus virginianus). These were chosen due to adequate sample sizes for analysis, and to represent a variety of potential responses to vehicular traffic on FM106. Our objectives with this study were to determine the effect of distance to road on spatial and temporal patterns of use for our four target species.
2 Materials and methods
2.1 Study area
The study area was located in Cameron County, TX, which is bordered by the Gulf of Mexico to the east and the U.S.-Mexico border (the Rio Grande/Río Bravo) to the south. The county had a population of over 421,000 as of 2020 (US Census Bureau, 2020), largely concentrated in the Brownsville-Harlingen metropolitan complex. The area has a semi-arid subtropical climate with an average annual temperature of 23 ° C (74 ° F) and average annual precipitation of 62.2 cm (24.5 in) (NOAA, 2021). It is situated at the interface of three ecoregions: a) the Laguna Madre Barrier Islands and Coastal Marshes, b) the Lower Rio Grande Alluvial Floodplain, and c) the Lower Rio Grande Valley (EPA, 2013).
FM106 is a two-lane rural highway with a posted speed limit of 97 km/hr (60 mph) and a right-of-way ranging from 24 to 36 m in total width. The FM106 mitigation corridor spanned a 16 km segment of the roadway and extended 1 km perpendicular to the road in each direction. Agricultural use (i.e. cotton, sorghum crops) comprised almost a third of the study area. The corridor intersected minor residential developments along San Roman, Ted Hunt, and Schafer roads, recreational areas available for public access as part of the Laguna Atascosa National Wildlife Refuge, and access roads to the Port Isabel Detention Center (a U.S. Immigration and Customs Enforcement facility) and the Port Isabel-Cameron County airport (Figure 1).
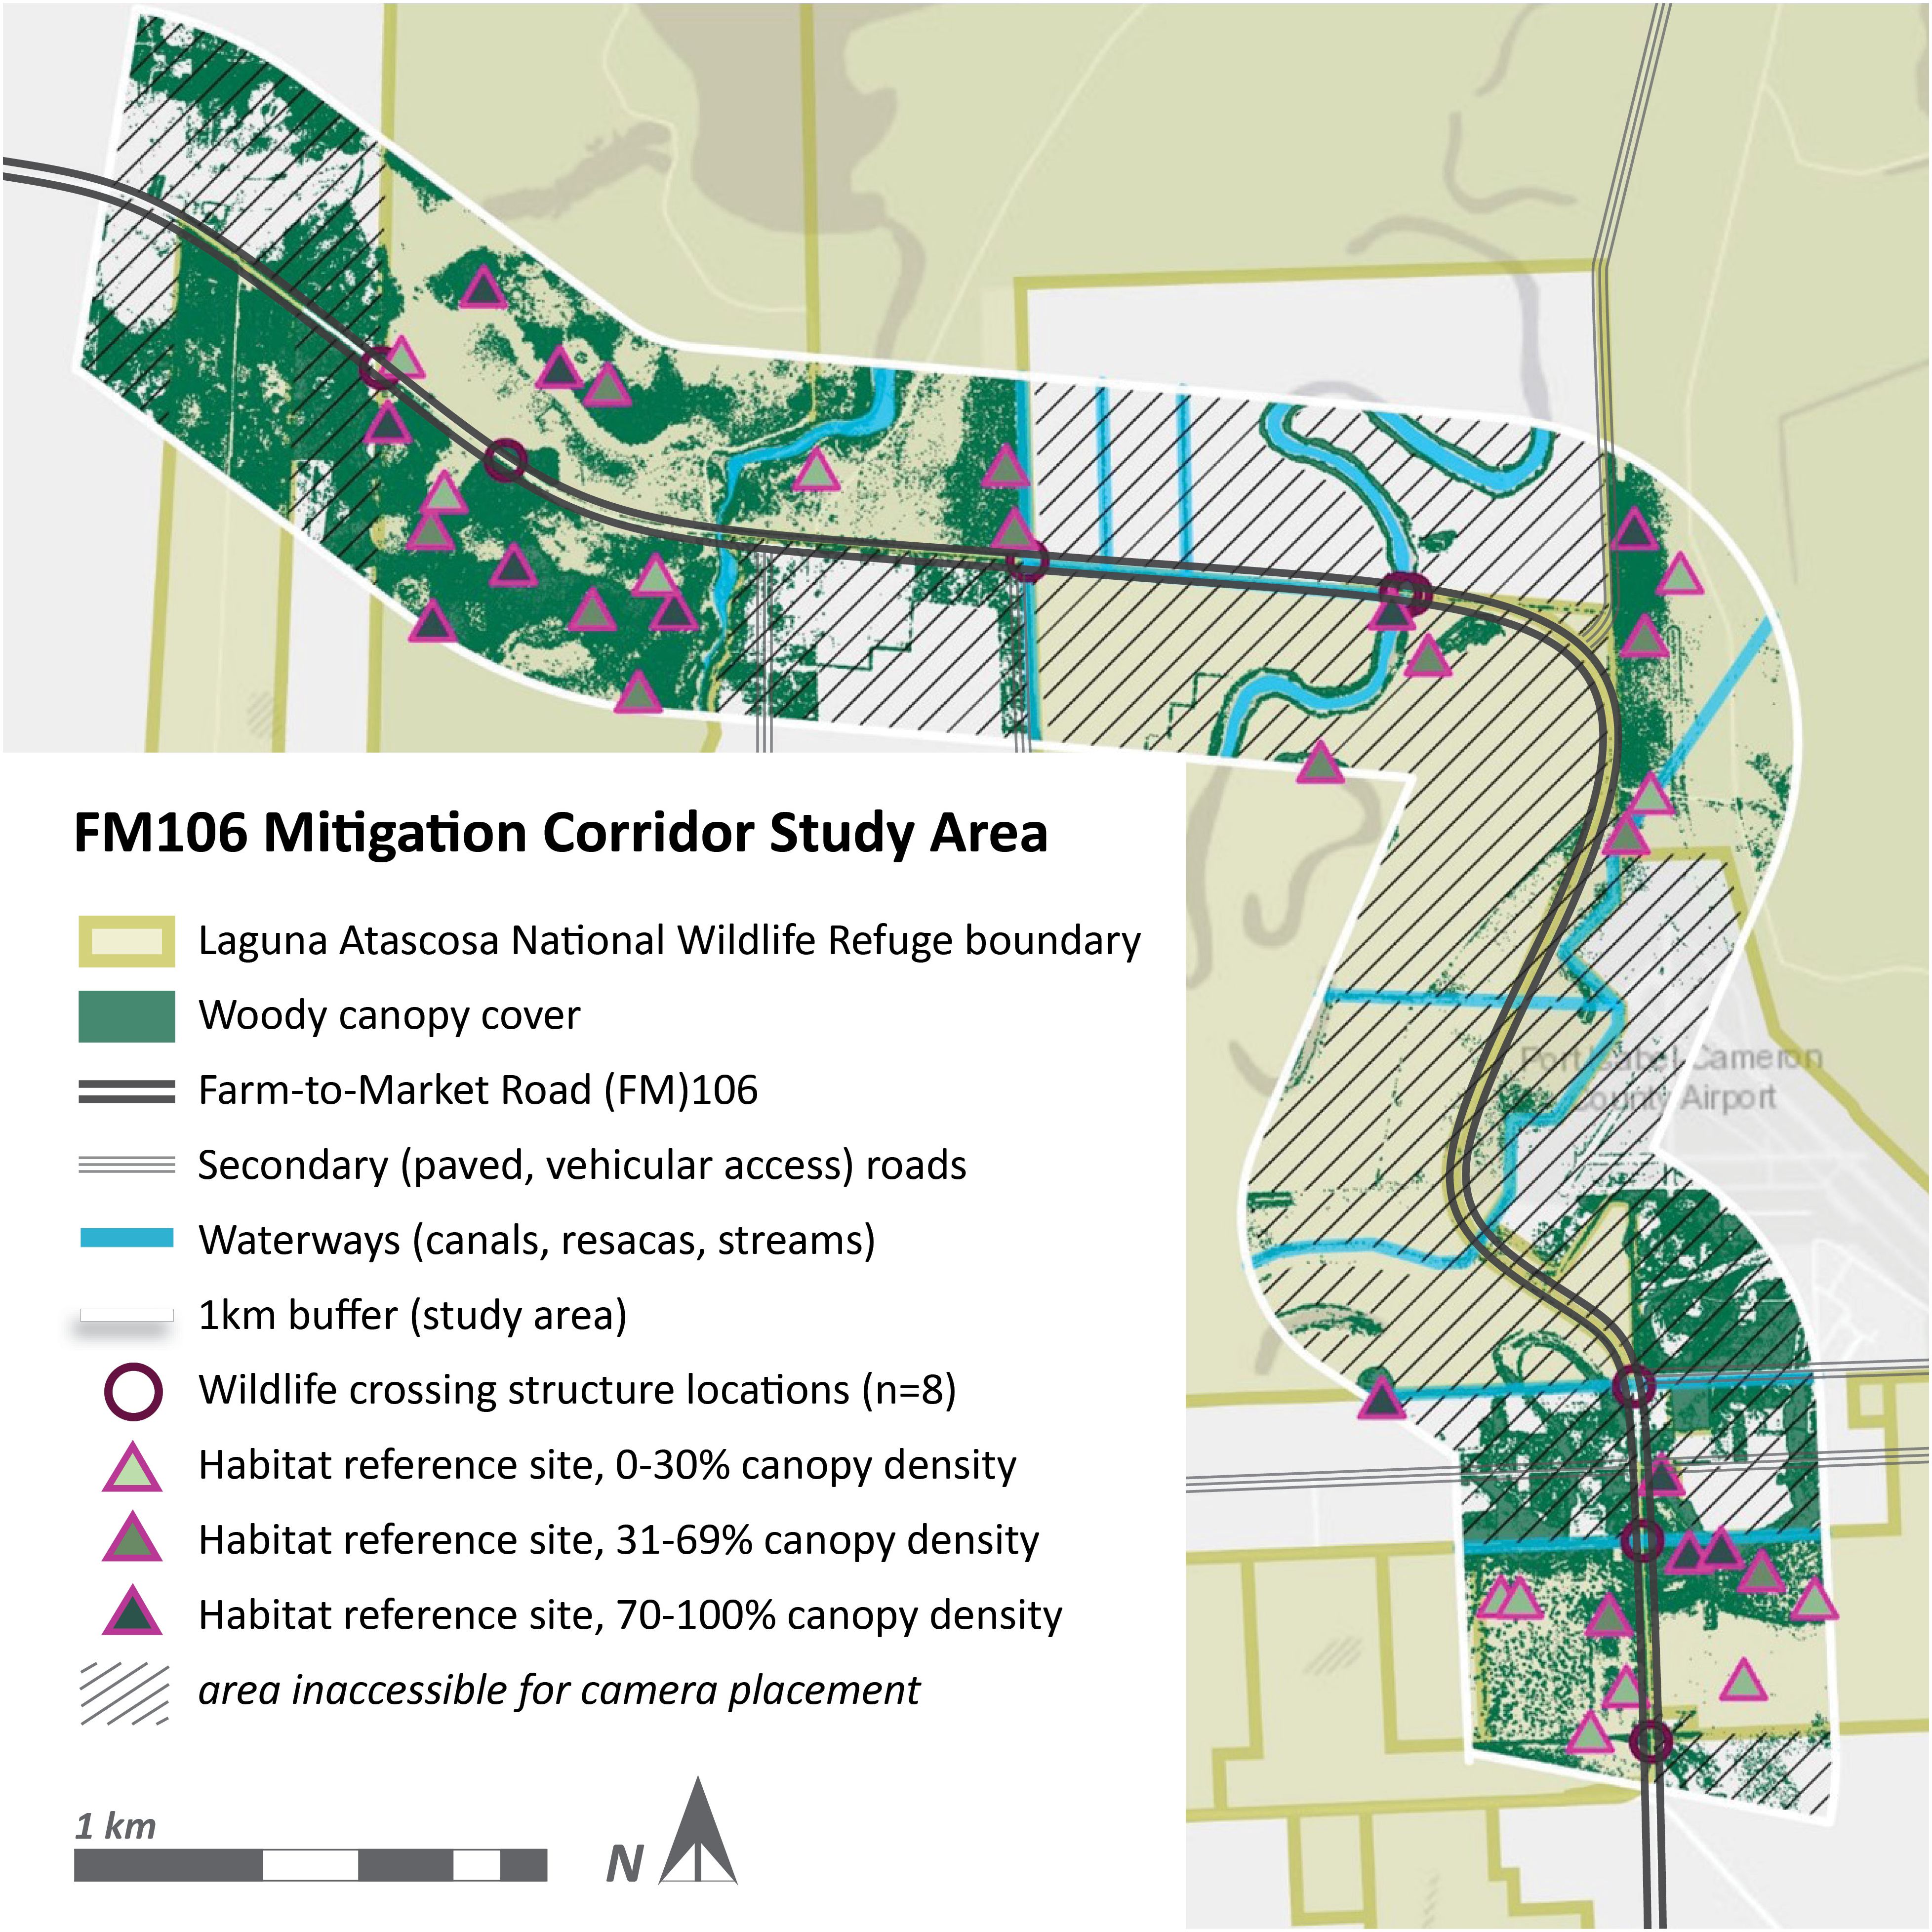
Figure 1. Habitat reference sites for the FM106 mitigation corridor in Cameron County, TX were determined by categorizing sites by estimated canopy cover density. Site selection across the corridor was limited to land managed by LANWR but also restricted by ongoing agricultural use and management plans. Resaca de los Cuates and several drainage ditches intersected the corridor and were closely associated with remnant thornscrub growth as well as WCS placement on the FM106 mitigation corridor in Cameron County, TX.
2.2 Study design
A control-impact study design (van der Ree et al., 2015) was used to compare wildlife activity at habitat reference sites (n=36 cameras, placed across 3 distance strata from 21–1000 m from FM106) versus roadside sites (n=12 cameras, placed within 20 m of FM106). Both camera trap arrays were evenly distributed across the east and west sides of FM106 and across three established vegetation classes (n=16 cameras each) to control for the potential effects of varying habitat structure. Previous research has established that canopy cover density is an important predictor of quality felid habitat in this region (Lombardi et al., 2020b; Lehnen et al., 2021; Hopkins, 2020) and should be considered alongside proximity to road in exploring the indirect effects of FM106. For initial site selection, vegetation classes were estimated by referencing the woody cover from the land cover map generated in Yamashita et al. (2021). However, these vegetation classifications were ground-truthed with 5-point canopy cover surveys at each site prior to final camera placement or selection.
Camera sites were determined using a stratified-random selection process with vegetation class (Open = 0-30%; Mixed = 31-69%; Dense = 70-100% woody canopy cover), distance to road (roadside = 0–20 m, average distance = 4.8 m; habitat bin 1 = 21–300 m, average distance = 190.0 m; habitat bin 2 = 301–600 m, average distance = 454.8 m; habitat bin 3 = 601–1000 m, average distance = 808.1 m), and side of road (north/east and south/west) as stratifying factors. Potential habitat sites were designated with a 50x50 m fishnet grid in ArcGIS Pro (ESRI, 2021), numbered, and randomly selected until each stratum was evenly represented. Roadside sites for this study were selected from a larger array of cameras used for ongoing monitoring of FM106 but were subsampled using a similar stratified-random process to evenly represent each vegetation class and side of road. Sites were limited to land managed by Laguna Atascosa National Wildlife Refuge up to 1 km from FM106, or roadside right of way land managed by the Texas Department of Transportation. Sites needed to be regularly accessible for data collection and camera maintenance, and had a minimum of 100 m spacing from each other in order to limit autocorrelation between cameras (Parsons et al., 2017; Kays et al., 2010). Site placement was also constrained by the fragmentation of thornscrub in this area, which meant that camera sites were not evenly distributed across the entire 1 km buffer area (Figure 1). The final combined roadside and habitat arrays (Figure 2) included 48 total camera sites, distributed across three vegetation classes (n=16 each), four distance bins (n=12 each), and east/west sides of FM106 (n=24 each).
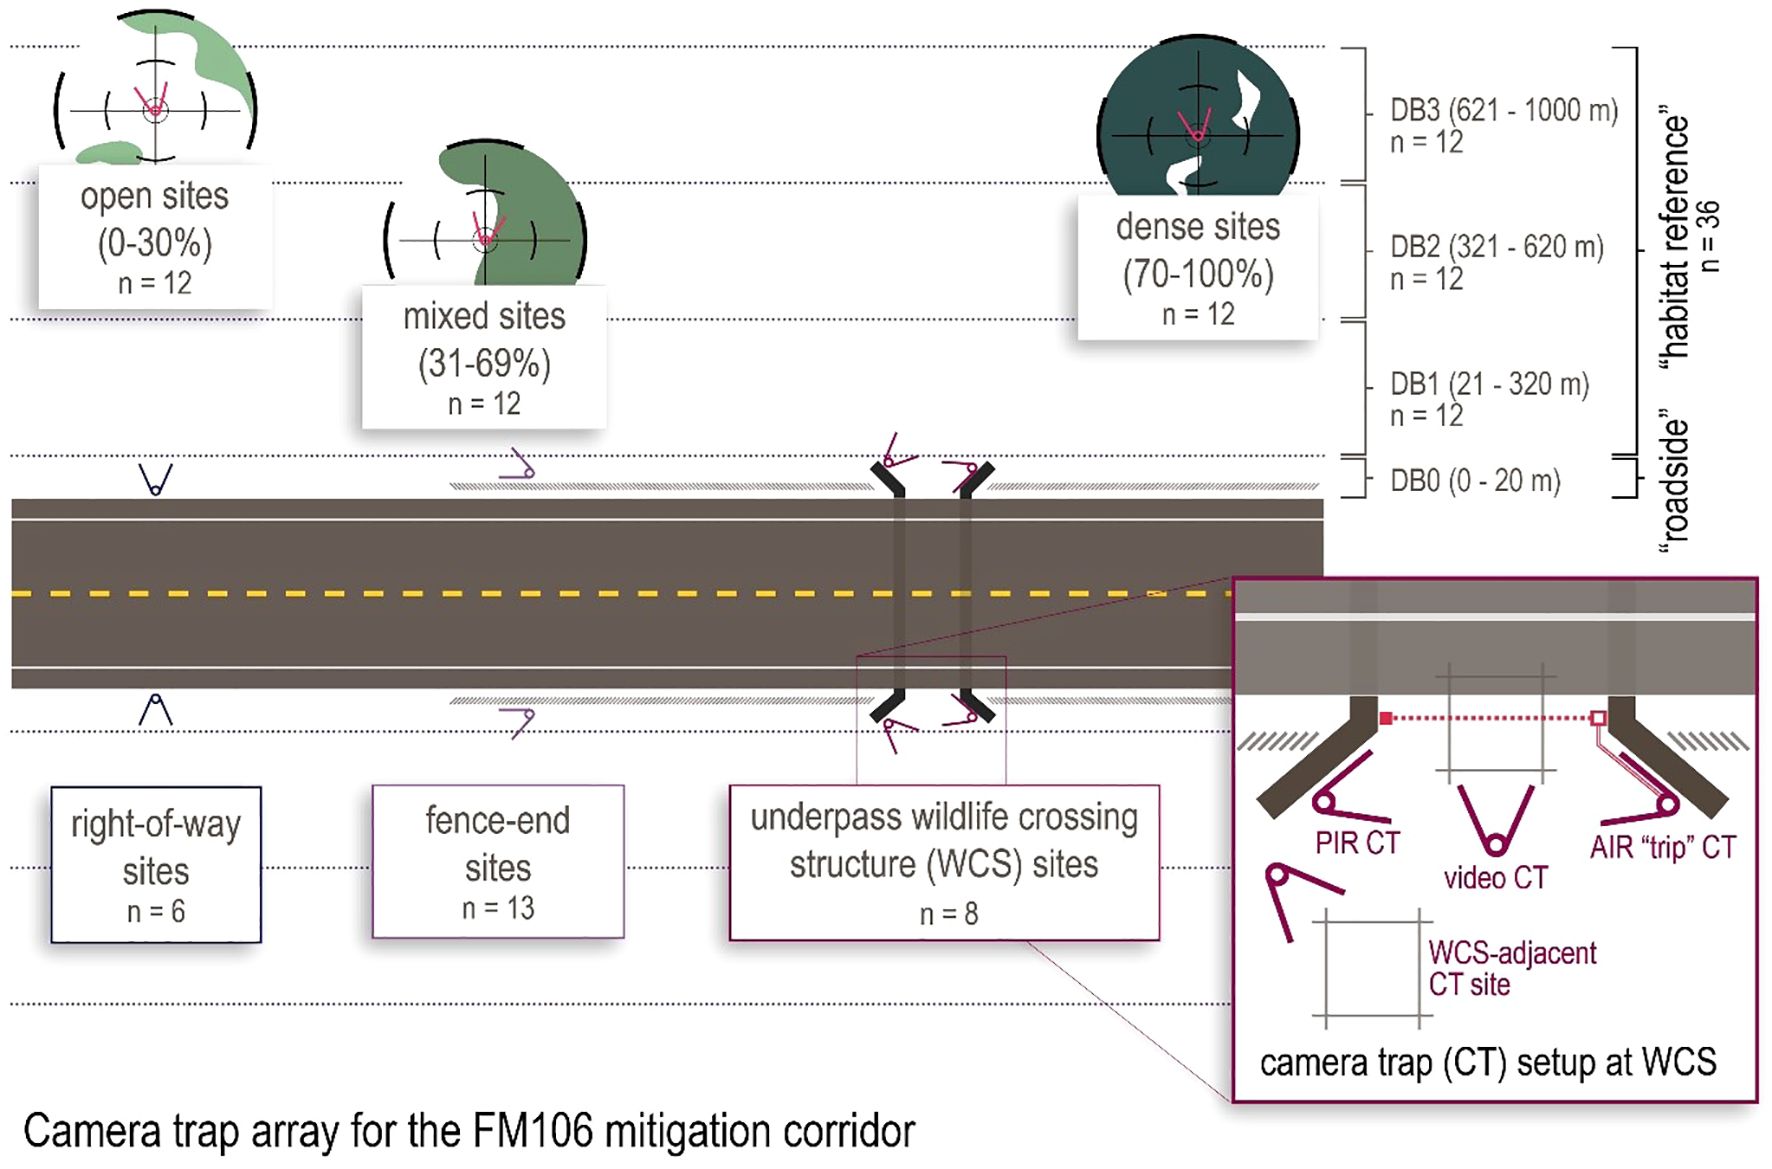
Figure 2. The camera trap (CT) arrays on the FM106 mitigation corridor include 27 roadside sites and 36 habitat reference sites. Roadside sites include WCS underpasses (8 CT each), mitigation fence-ends (2 CT each), and unmitigated right-of-way sites (2 CT each), all located within 20 m of the road surface. Habitat reference sites monitor up to 1000 m from the road surface; sites were randomly selected but evenly distributed across three vegetation classes (open = 0-30%, mixed = 31-69%, and dense = 70-100% woody canopy cover) and three distance bins (DB1 = 20–320 m, DB2 = 321–620 m, DB3 = 621–1000 m) from each side of the road.
GIS measurements and vegetation surveys were conducted to quantify additional environmental variables across both camera arrays. Canopy cover surveys were also used to verify vegetation classes prior to camera site selection. Percentage canopy cover was measured at the center point of each site and at 5 m in each cardinal direction, taken from camera height (50 cm off the ground) using a GRS Densitometer (Geographic Resource Solutions, Arcata, CA) and verified with photo documentation (Lombardi et al., 2020b). Groundcover surveys were conducted in March 2022 using a 0.5 m quadrat 2.5 m from the center point in each cardinal direction, and quantified vegetation growing at or below camera height. Groundcover at the base of the camera was not included because this area was regularly cleared for camera visibility and to prevent the camera being triggered by blowing vegetation. Groundcover was categorized into one of 10 groups: bare/litter, cordgrass (Spartina spp.), shoregrass (Distichlis littoralis), other graminoids, herbaceous forb, woody forb, woody shrub, cactus, yucca (Yucca spp.), and halophytic succulent. Herbaceous forb and other graminoids were later grouped into a broader “herbaceous forage” groundcover category. Groundcover percentages were then averaged across the four survey points at each site. GIS measurements were taken using the classified NAIP imagery (Yamashita et al., 2021) to quantify distances from each camera site to water sources, woody cover patches, and primary (FM106) and secondary (San Roman, Ted Hunt, Buena Vista, Veterans Airport, FM510, or Schafer) roads.
Both roadside and habitat reference sites included a single unbaited Reconyx (Holmen, WI, USA) Hyperfire 2 camera trap, set to record at least one photograph per motion detection, with no delay between triggers and all cameras set to high sensitivity. Cameras were triggered by a passive infrared mechanism, which detected changes in radiated heat across portions of its field of view (e.g. when an animal moved in front of the camera). To control for variation in maximum detection distances across vegetation classes, a physical marker was placed 3 m in front of each camera, and only detections observed within this distance were counted for analyses. Habitat cameras were placed facing north (+/- 45 degrees; to avoid any obstructions or sun glare) and facing into at least 2 m of clear or maintainable vegetation to avoid false triggers by plant material. Half of the roadside sites were located adjacent to a wildlife crossing structure but were positioned facing away from the structures themselves to decrease bias and ensure comparable detection rates across all cameras. The other half of the roadside sites were located along the right-of-way at least 100 m away from any mitigation structure or fencing, facing directly away from the road. In high-visibility areas where camera theft was a concern, U-posts were set into a buried cinder block with poured concrete and partially obscured in a locking plastic pedestal box. All other cameras were locked in metal security boxes (Reconyx model #HF2HDSE) and bolted to U-posts (Everbilt model #901154EB) at 50–55 cm from the ground.
Cameras were deployed from July 2021 through May 2022 for a total of 334 possible camera trap nights per site. Sites were visited every 2–4 weeks to exchange SD cards, ensure all equipment was functioning properly, and clear vegetation as necessary (up to 3 m ahead of each camera) to prevent false detection triggers. Any gaps in data collection (typically due to camera malfunction or inclement field conditions) were recorded so that detection data could be weighted as needed based on the number of available camera trap nights per site.
Photos were processed using the program ReNamer, which identifies and names each photo based on the date and time it was recorded (Harris et al., 2010; Sanderson and Harris, 2013). Photos were manually sorted according to the species detected in each image and sequences of images were automatically grouped into a single detection event if the same species was observed at the same site within a certain window of time. Ridout and Linkie (2009) suggest a 30-minute threshold to increase independence of detections but other authors (Shamoon et al., 2018) use a threshold as little as 1-minute to more accurately represent fine-scale species activity, regardless of individual independence. For spatial analysis, the 30-minute threshold was selected to increase the likelihood of independent detections of individuals. For temporal analysis, a 5-minute threshold was selected as a compromise between these approaches, particularly because repeat use of a site (even by the same individual) may still be biologically significant for analysis of activity patterns over time.
Vehicular traffic was monitored during this period using two camera traps stationed on either end of the FM106 mitigation corridor, with an active infrared trip mechanism positioned to trigger a photo each time a vehicle crossed each location on the road. In-person traffic counts and photo reviews were conducted periodically to verify that the camera count of traffic was accurate to the number of vehicles observed. Data for this study were collected from July 2021 through May 2022, as part of a concurrent study on traffic volume and impacts of noise on the surrounding wildlife community (Mehner, 2024). Days when cameras were not fully functional were eliminated from the dataset. This resulted in over 600,000 roadway detections pooled across the two monitoring sites. Detections were randomly down-sampled to 1 of every 60 detections to facilitate data analysis and processing, such that approximately 10,000 total detections were used in the final vehicular traffic pattern estimate over a day-night cycle.
2.3 Statistical analysis
Plots were generated to visualize potential multicollinearity among environmental variables and identify whether any should be eliminated from the model based on Pearson correlation coefficients (>|0.6|) (Clarke and Gorley, 2001). Variables considered included: distance to water source, distance to FM106, distance to nearest secondary road, percent woody canopy cover within 15 m of site, percent woody canopy cover within 300 m of site, percent herbaceous groundcover within 5 m of site, percent bare groundcover within 2.5 m of site, and distance to large (>1000 sq m) patches of woody cover. The preliminary model included three metrics of vegetation structure, two measures of distance to road, and distance to nearest water source. Target species detections were tested for spatial autocorrelation. The Spatial Autocorrelation Tool in ArcGIS Pro was used to calculate the Moran’s I index score for each species. For species which showed significant spatial autocorrelation as indicated by a Moran’s I score of <0.05 site coordinates were also included.
Target species detections from July 2021 through May 2022 were modeled with a generalized linear model with a negative binomial distribution, using the “glm.nb” function from the “MASS” package (Venables and Ripley, 2002) in program R (Version 4.2.2, R Core Team, 2023). For this analysis the number of detections for each species per 100 camera trap nights per site was the response variable. We used an offset to standardize detection data based on survey effort (i.e. number of operational camera trap nights per site). AICc model dredging was used to help identify and compare significant factors in predicting spatial distribution of detections, using the “dredge” function from the “MuMIn” package (Barton, 2012). We took this approach because our main goal was to examine the relationship of detections for each species relative to distance from FM106, but the number of variables considered was too large to use a pre-defined model selection approach. The variables we included were considered important habitat factors for the species of interest to account for variation that may have otherwise obscured the effect of distance.
In addition to modeling individual species’ spatial responses to FM106, a community analysis was conducted using a permutational analysis of variance (PERMANOVA; Primer v.7) to identify how distance bin, side of road, and vegetation class may have influenced species’ presence and relative abundance across the study area. A three-factor PERMANOVA design (type III sums of squares, 9999 permutations) was run based off of a Bray-Curtis resemblance matrix (Anderson, 2017; Anderson et al., 2008). A bootstrapped non-metric MDS plot was used to visualize and check the validity of any significant results. The SIMPER routine was also run to determine how much each species accounts for differences in the wildlife community across vegetation classes and roadside versus habitat groups (Clarke and Gorley, 2001).The community dataset was square root transformed prior to analysis in order to more evenly represent variation across all taxa, as observed using a 3D plot of the distributions.
We used the “compareCkern” function from the “activity” package (Rowcliffe, 2016) to first identify if there were significant differences between roadside versus habitat activity for target species, as represented by kernel density distributions. The overlap estimator Δˆ4 (Rowcliffe, 2016; Meredith, 2021) was used to determine if the activity curve generated from vehicular traffic detections overlapped less with roadside activity than with habitat activity (with n=999 bootstrapped 95% confidence intervals) for each target species. Square-root transformed traffic data was analyzed with ANOVA to identify possible weekly or seasonal variation in estimated traffic volume. Season was defined as three-month periods: January-March, April-June, July-September, and October-December.
Wildlife detection data for diel activity analyses were generated by converting the times of all photos taken to radians and applying the 5-minute independence rule to group consecutive photos into detection events. All species had a minimum of 100 detection events per subgroup (i.e. roadside or habitat) for analysis and Δˆ4 was selected as the appropriate overlap estimator for these relatively large (n>50) sample sizes, as recommended in Ridout and Linkie (2009). Because ocelots were detected infrequently within this study period, they were not included in the comparative analyses of diel activity; however, ocelot detections from the broader FM106 post-construction monitoring period (January 2020 – May 2022, n=42 detections, n=4 individuals) were used to estimate and visualize ocelot diel activity as compared to that of the bobcat.
3 Results
Bobcats were detected at 39 of 48 camera sites, (n=330 total detections per 100 camera trap nights) and were not found to be spatially autocorrelated based on a Moran’s I score (0.39) calculated in ArcGIS. The model with the lowest AICc value for bobcats (R2 = 0.33) indicated that bobcat detections increased with percent canopy cover density (0-85%) at 15 m (by a factor of 2.53) and decreased with distance from FM106 (by a factor of 0.002). Each of these factors was identified as significant (p=0.0001, p=0.007, respectively) in the model summary and were both included in the three models with a ΔAICc ≤2.0.
Coyotes were detected at 46 of 48 camera sites (n=165 total detections per 100 camera trap nights) and were not found to be spatially autocorrelated based on a Moran’s I score (0.05) calculated in ArcGIS. The model with the lowest AIC value for coyotes (R2 = 0.35) indicated that coyote detections increased with increased herbaceous groundcover (by a factor of 0.02), increased with increased distance from secondary roads (by a factor of 0.0006), and decreased with increased distance from FM106 (by a factor of 0.001). Some combination of these factors (each with p<0.05) was included in each of the thirteen models with a ΔAIC ≤2.0.
White-tailed deer were detected at 46 of 48 camera sites (n=954 total detections per 100 camera trap nights) and were found to be spatially autocorrelated based on a Moran’s I score (<0.001) calculated in ArcGIS. The model with the lowest AIC for white-tailed deer (R2 = 0.40) indicated that deer detections increased towards the east end of the corridor (by a factor of 0.0002). Along with x coordinates (p=0.045), herbaceous groundcover was also included in the two models with ΔAIC ≤2.0 but exceeded the p-value threshold for significance (p=0.09).
Striped skunks were detected at 39 of 48 camera sites (n=127 total detections per 100 camera trap nights) and were not found to be spatially autocorrelated based on a Moran’s I score (0.76) calculated in ArcGIS. The model with the lowest AIC for striped skunk (R2 = 0.32) indicated that skunk detections decreased with increased woody canopy cover density (0-57%) within 300 m of the site (by a factor of 4.37) and increased with increased herbaceous groundcover (by a factor of 0.02). These two factors (both p=0.02) were included in the majority of the sixteen models with ΔAIC ≤2.0.
Distance to FM106 was identified as a significant predictor of bobcat and coyote detections, with each of these species’ detections increasing with increased proximity to FM106. Distance to nearest secondary road was also identified as significant for coyotes, but here detections decreased with increased proximity to secondary roads. Deer and skunk detections were unaffected by distance to primary or secondary roads.
At the community scale, distance to the road was identified as a significant predictor of community variation at roadside versus habitat sites (p<0.05), though this was only seen within 20 m of the road. No distinction between communities was identified amongst habitat sites of increasing distance to FM106. Vegetation class was also identified as significant across all levels (p<0.05), but side of road was not significant. ANOVA indicated that traffic volume did not significantly vary across day of week (p=0.294) or by season (p=0.088; defined as January-March, April-June, July-September, and October-December).
Diel activity analyses showed significant differences between roadside versus habitat activity for bobcat (p=0.04; Figure 3), coyote (p=0.01; Figure 4), and white-tailed deer (p<0.001; Figure 5). In each of these cases, activity shifted towards more nocturnal behavior at roadside sites, demonstrated by less roadside activity overlap with vehicular traffic as compared to habitat activity overlap with traffic. Differences in overlap estimates were calculated to express the magnitude of temporal road avoidance (Table 1). Avoidance was strongest for white-tailed deer (Δ overlap = 0.28) but was also apparent for coyotes (Δ overlap = 0.13) and bobcats (Δ overlap = 0.06) to a lesser extent. Striped skunk did not show a significant difference or directional shift in activity between roadside and habitat sites (p=0.35; Figure 6).
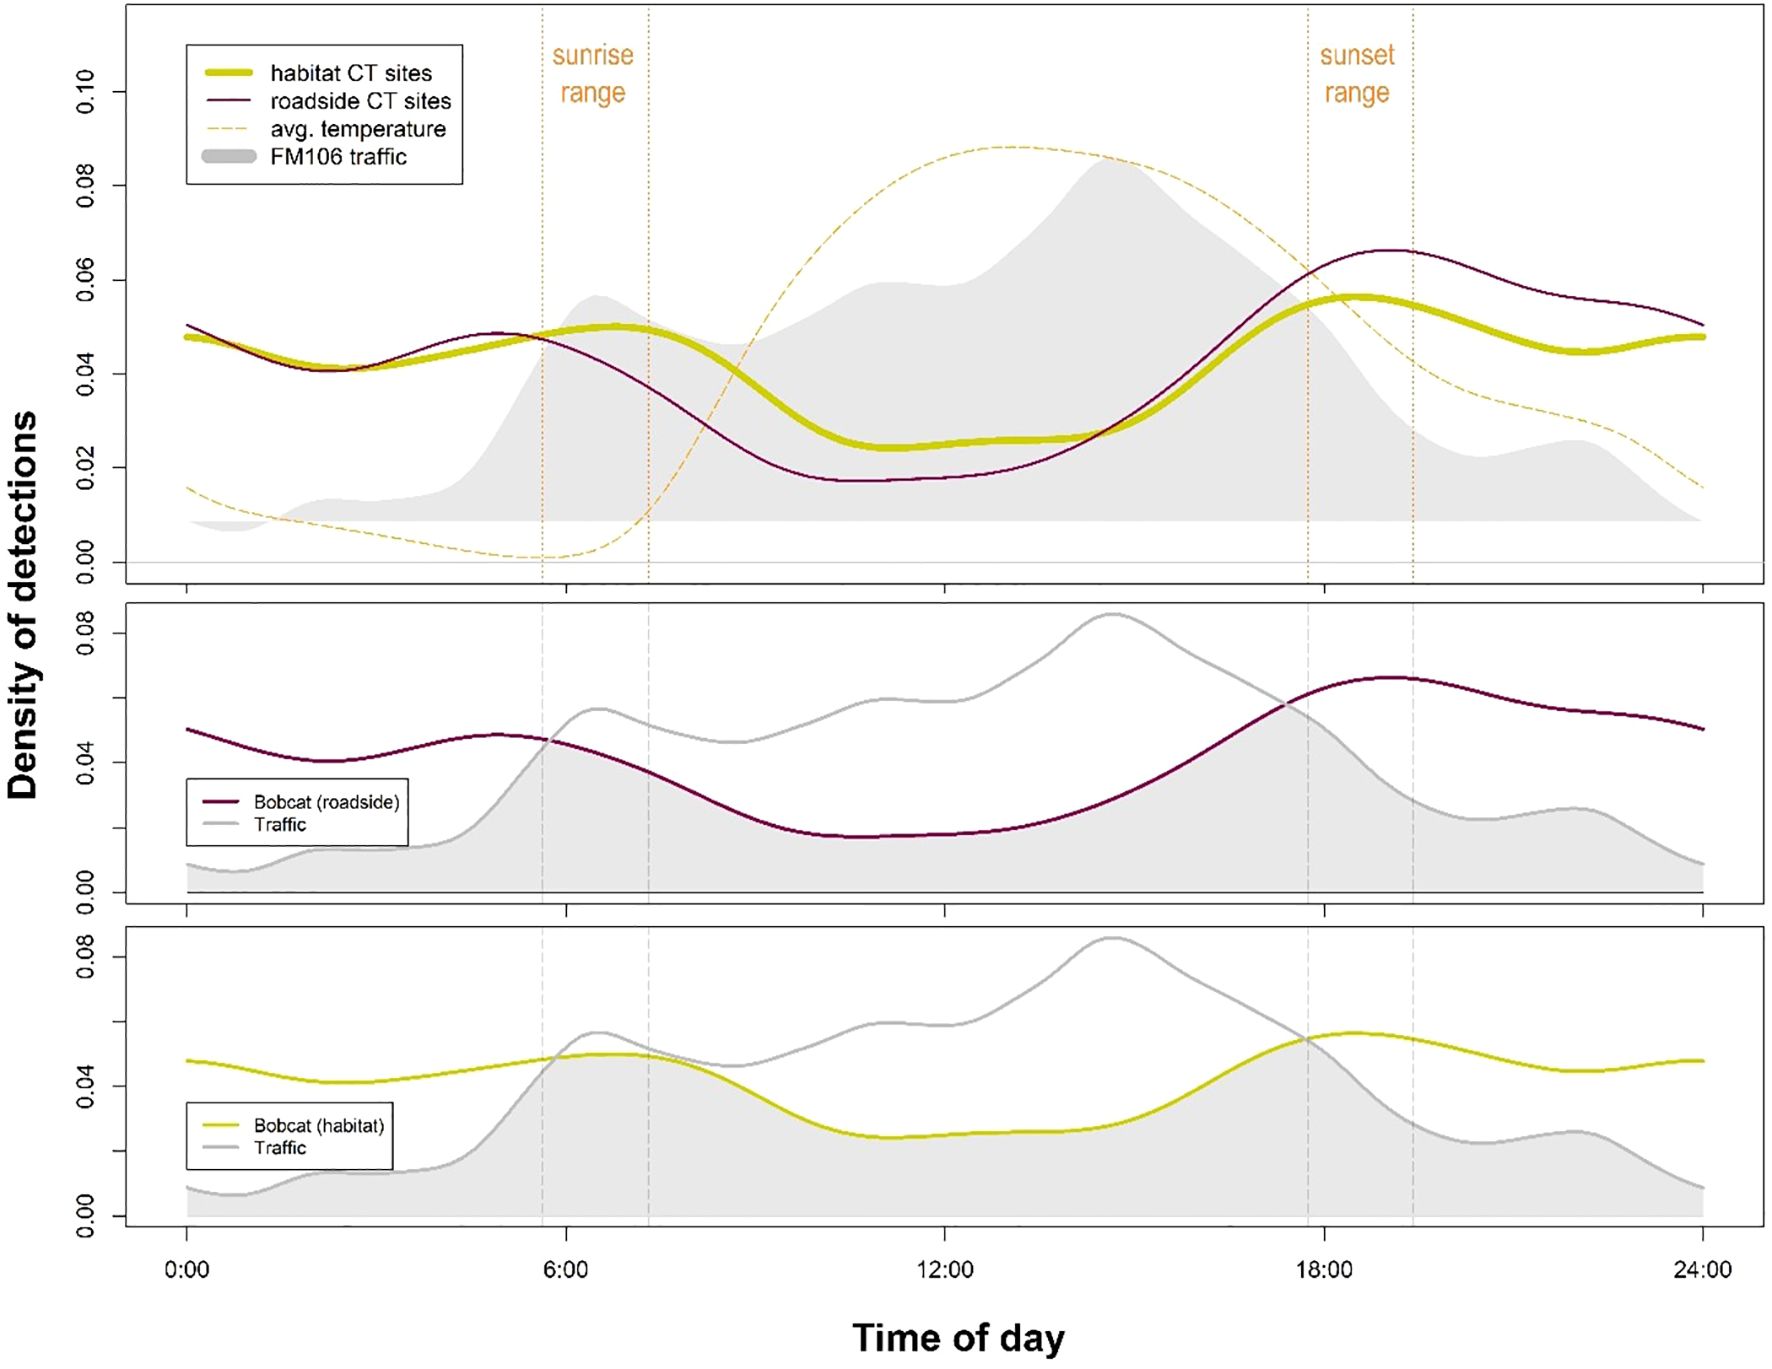
Figure 3. Bobcat (Lynx rufus) activity at roadside camera trap (CT) sites was significantly distinct from activity at habitat sites (p = 0.04) on the FM106 mitigation corridor in Cameron County, TX from July 2021 – May 2022. Traffic activity showed less overlap with bobcat activity at roadside sites versus habitat sites; bobcats may be exhibiting temporal avoidance at times of high human use.
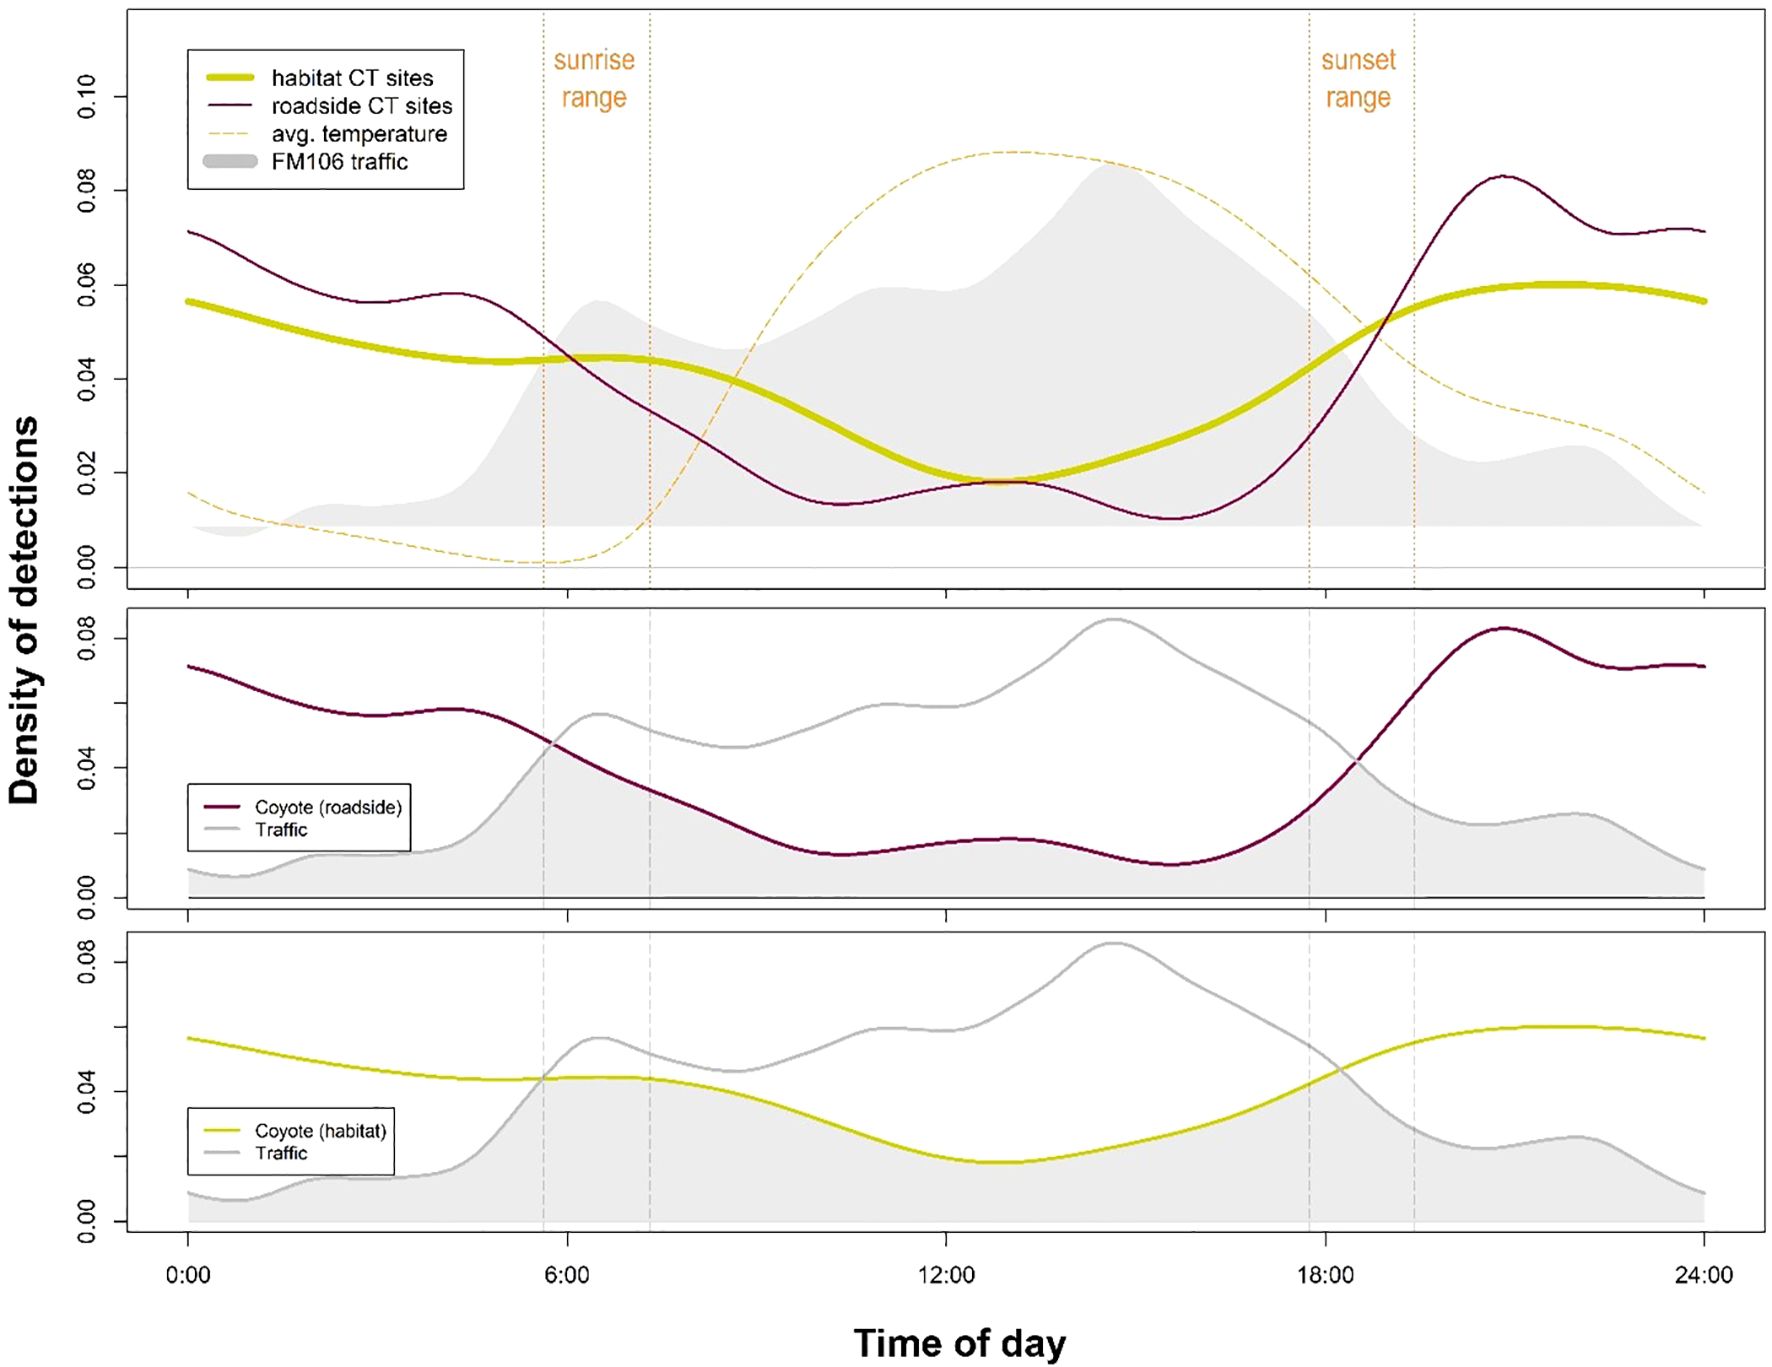
Figure 4. Coyote (Canis latrans) activity at roadside (WCS and ROW) sites was significantly distinct from activity at habitat sites (p = 0.01) according to a statistical comparison of kernel density distributions. Activity at roadside sites showed significantly less overlap with daily traffic patterns than coyote activity at habitat sites, indicating that this species is likely exhibiting temporal avoidance at times of high human use on the FM106 mitigation corridor in Cameron County, TX.
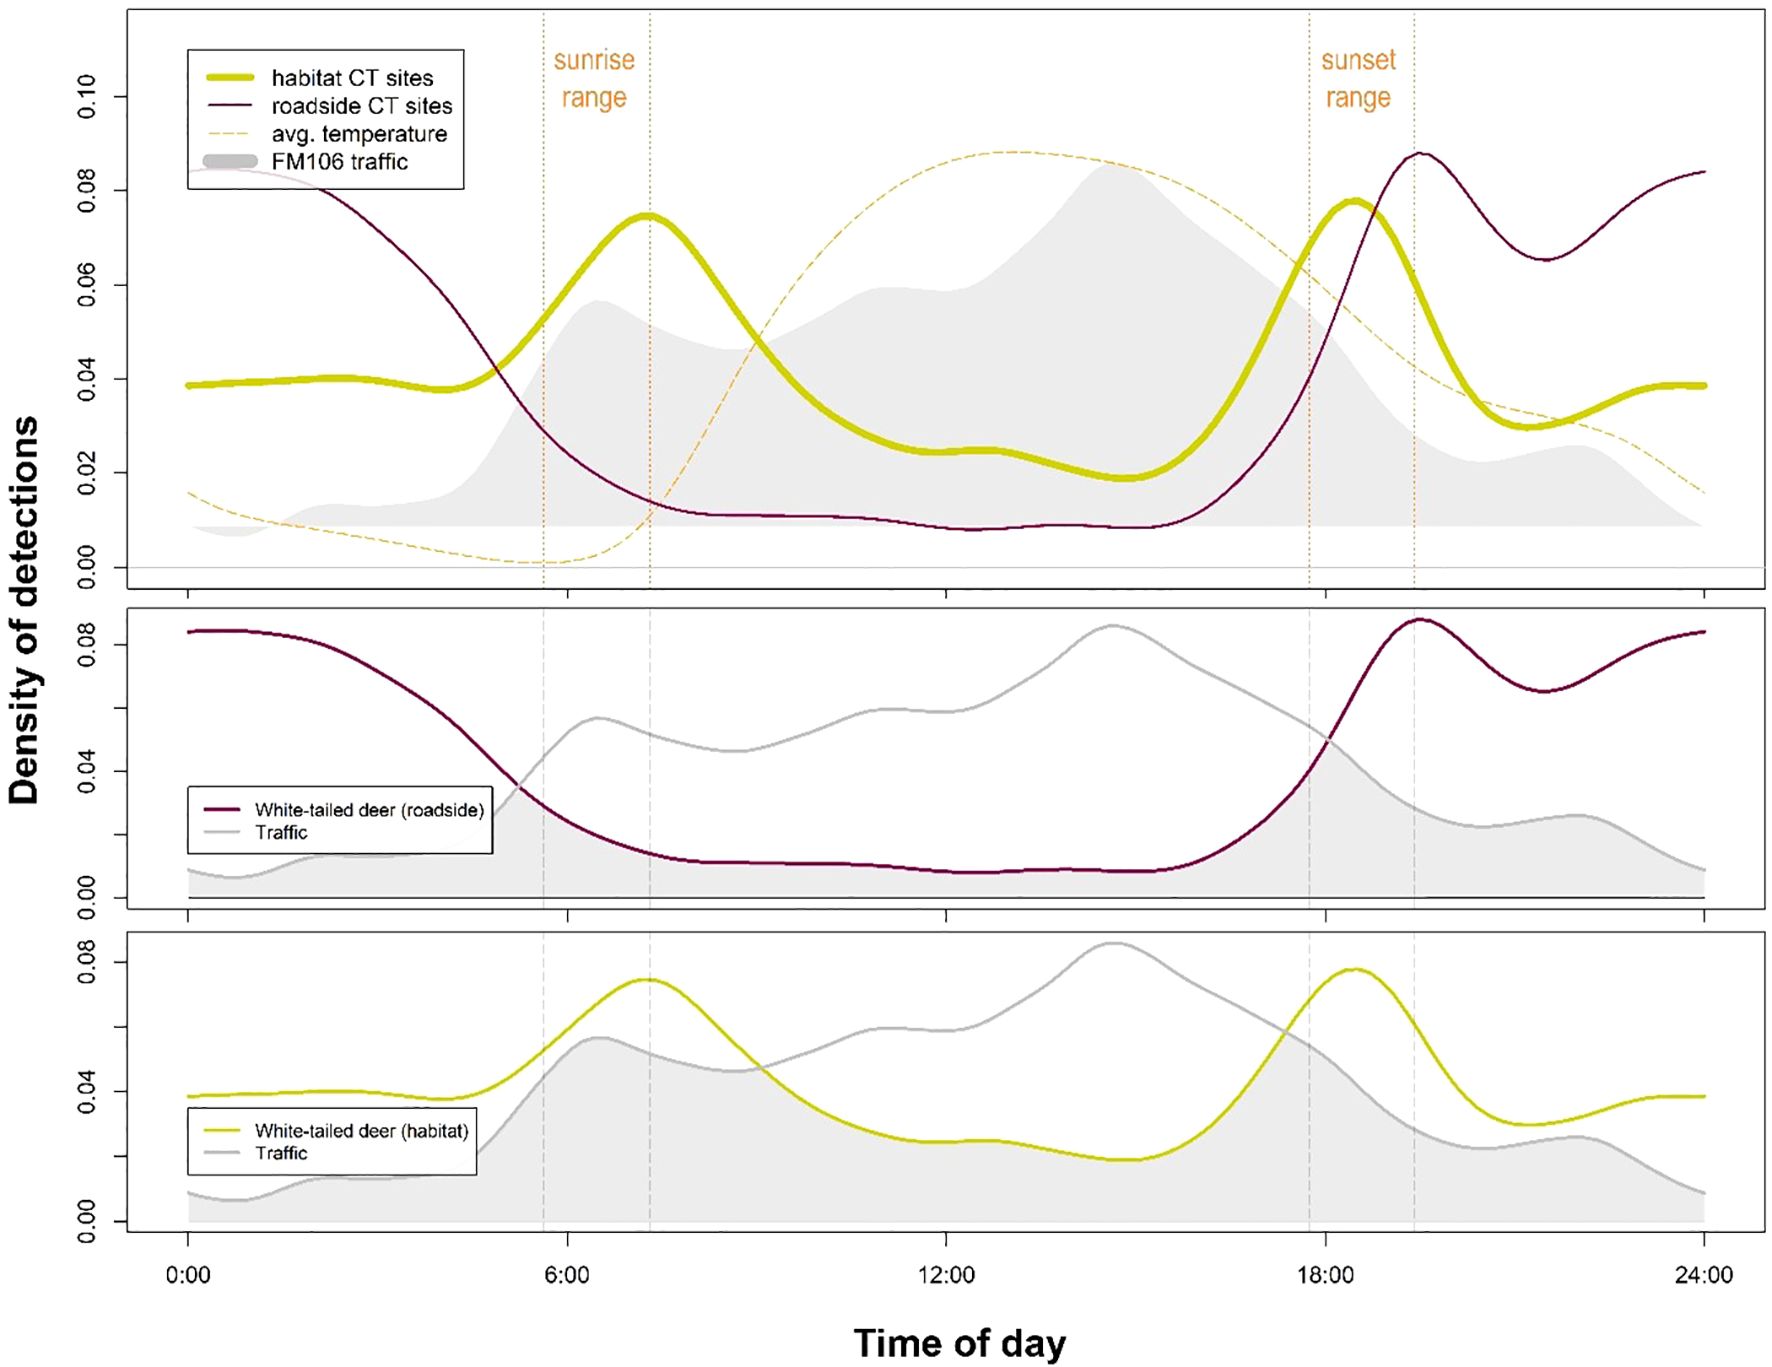
Figure 5. White-tailed deer (Odocoileus virginianus) activity at roadside (WCS and ROW) sites was significantly distinct from activity at habitat sites (p < 0.001) according to a statistical comparison of kernel density distributions. Daily traffic patterns showed significantly less overlap with white-tailed deer activity at roadside sites than at habitat sites, indicating that this species is likely exhibiting temporal avoidance at times of high human use on the FM106 mitigation corridor in Cameron County, TX.
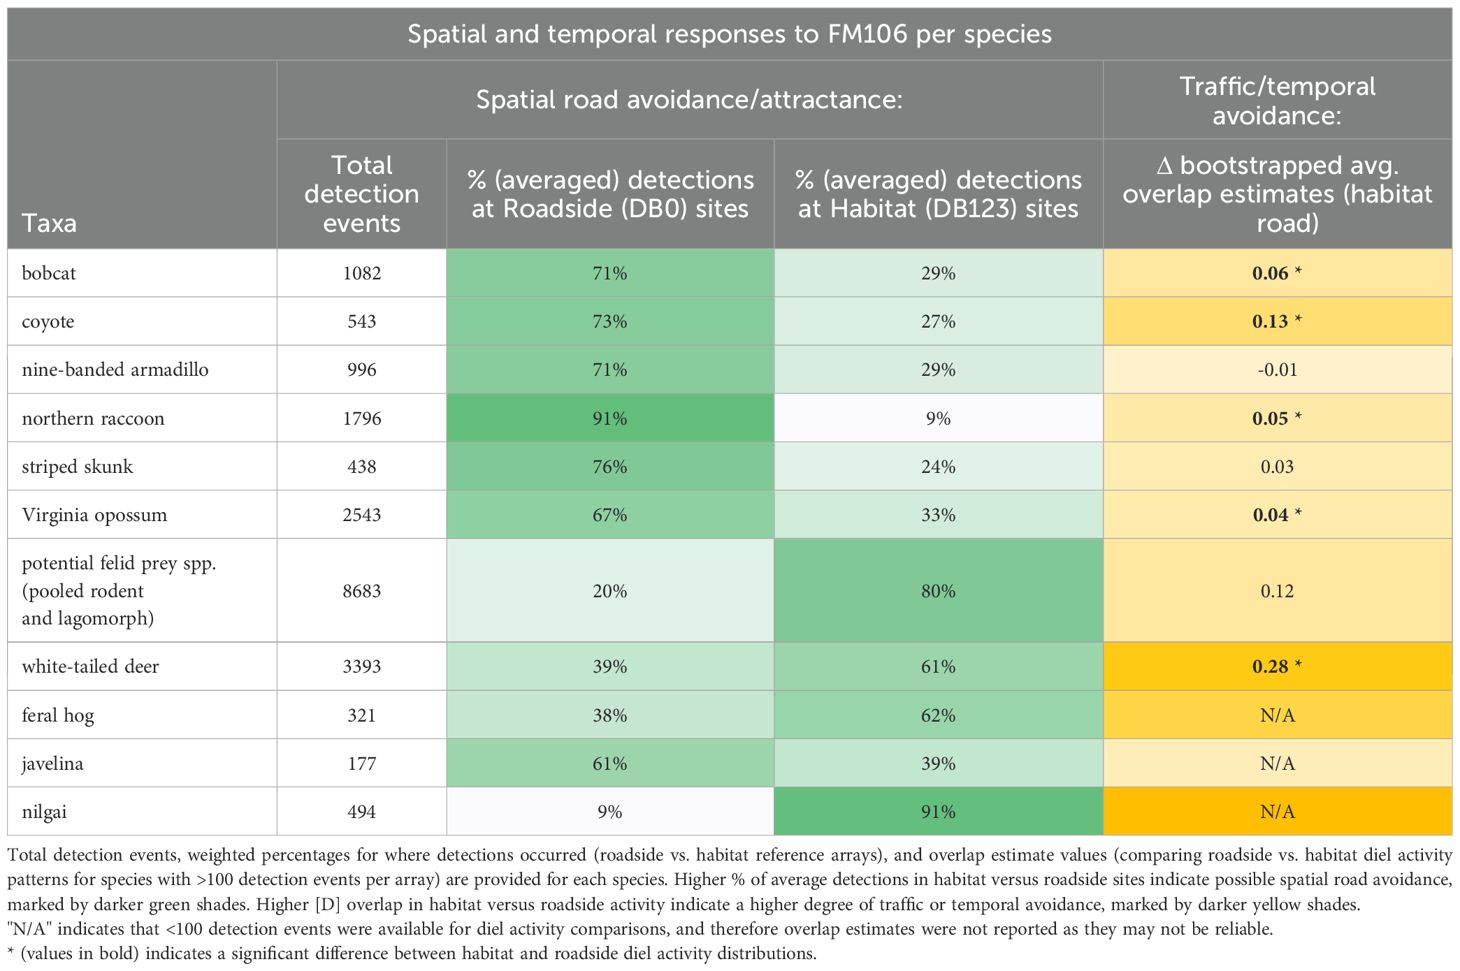
Table 1. Summary of wildlife activity at roadside vs. habitat reference sites on the FM106 mitigation corridor in Cameron County, TX from July 2021 - May 2022.
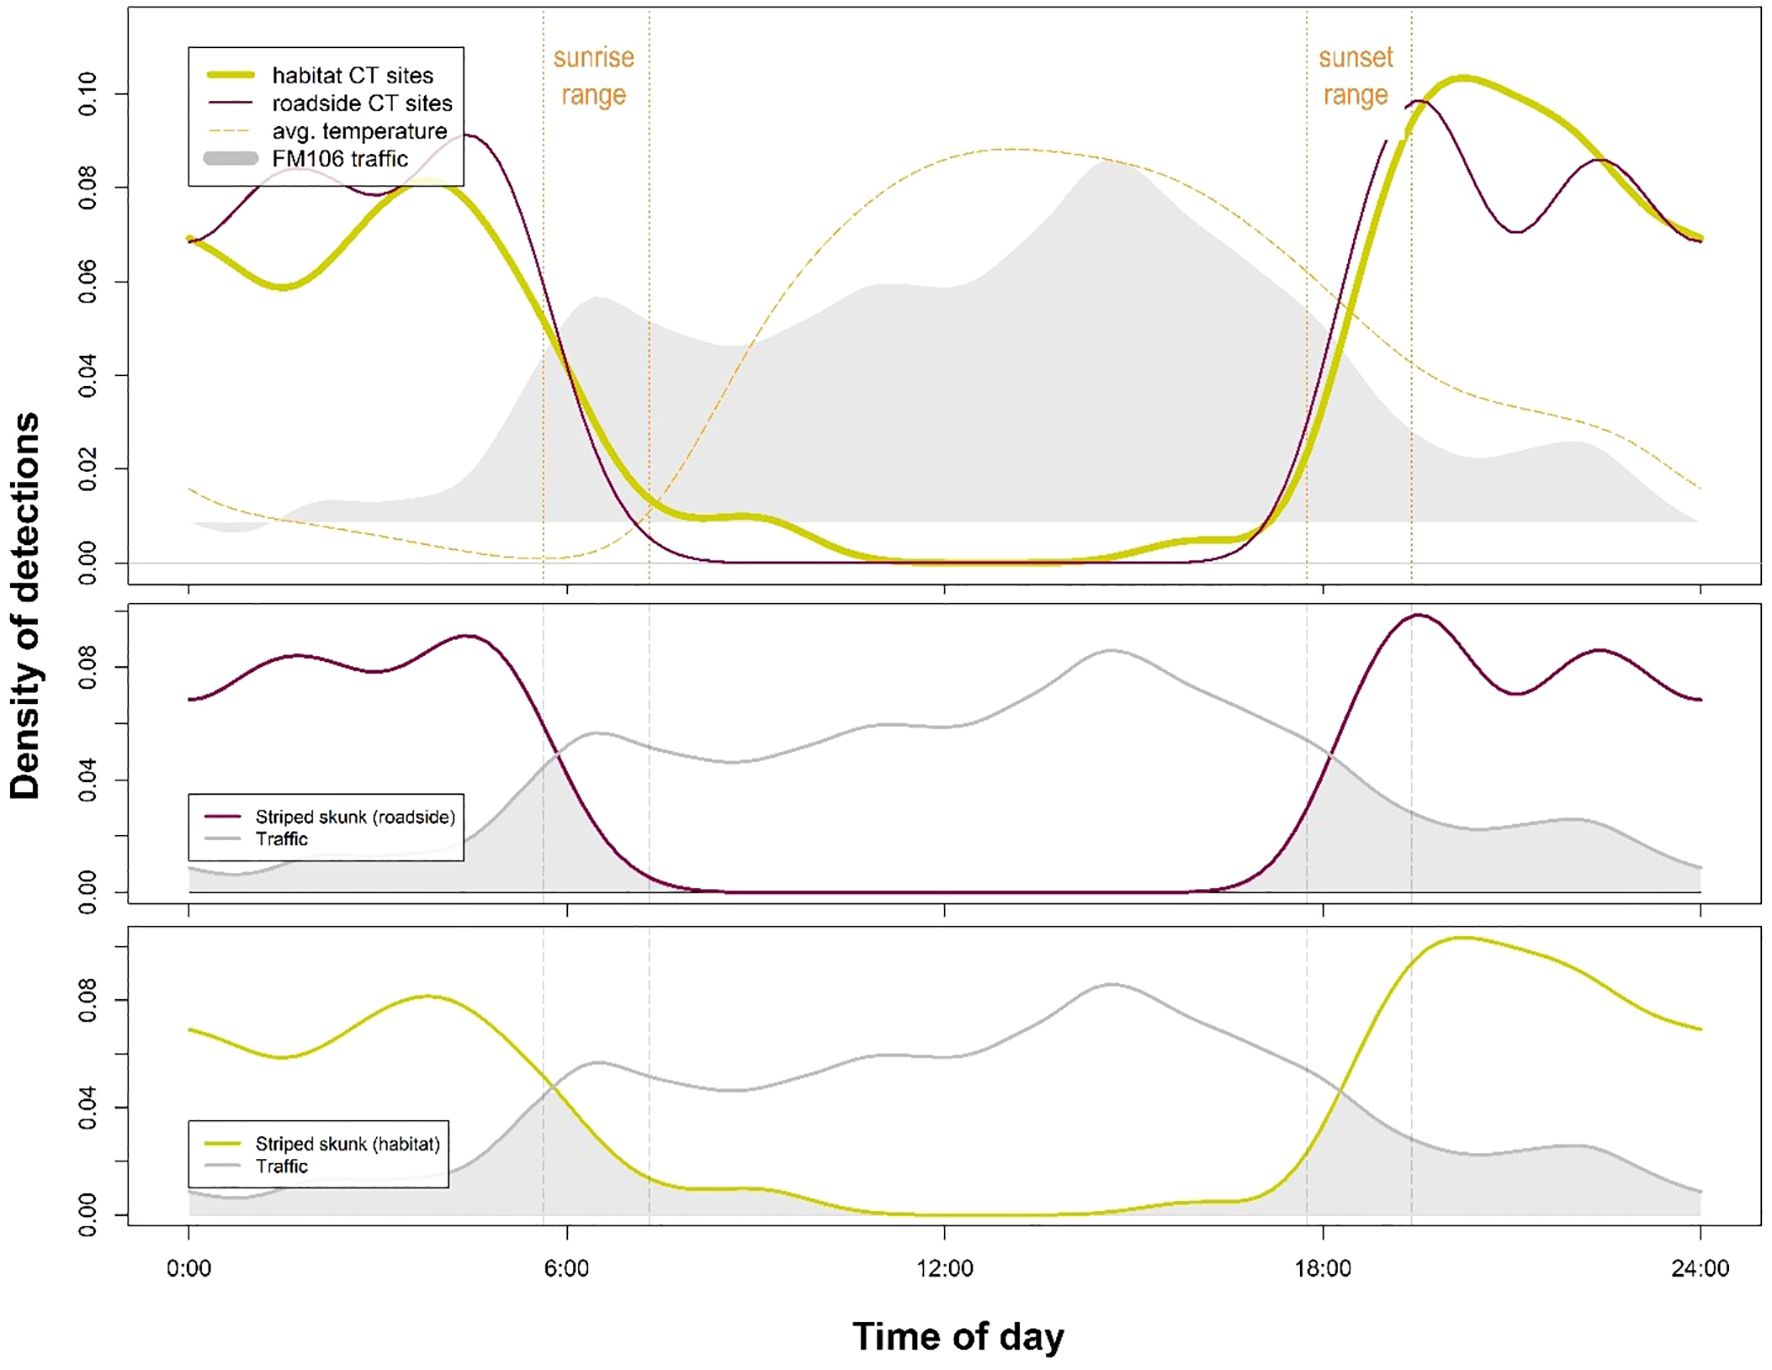
Figure 6. Striped skunk (Mephitis mephitis) activity at roadside (WCS and ROW) sites was not significantly distinct from activity at habitat sites (p = 0.35) according to a statistical comparison of kernel density distributions. This species does not appear to be altering its daily activity patterns based on traffic on the FM106 mitigation corridor in Cameron County, TX.
Ocelot activity was estimated from over two years of monitoring on the FM106 corridor (December 2019 – May 2022). This dataset included 42 total detection events of four male ocelots, with 31 (74%) occurring in dense habitat and 11 (26%) occurring in mixed habitat. All detections occurred at roadside sites (habitat monitoring was restricted to July 2021 through May 2022) and at or adjacent to resacas or ephemerally flooded drainage ditches. Ocelot diel activity was primarily nocturnal (Figure 7).
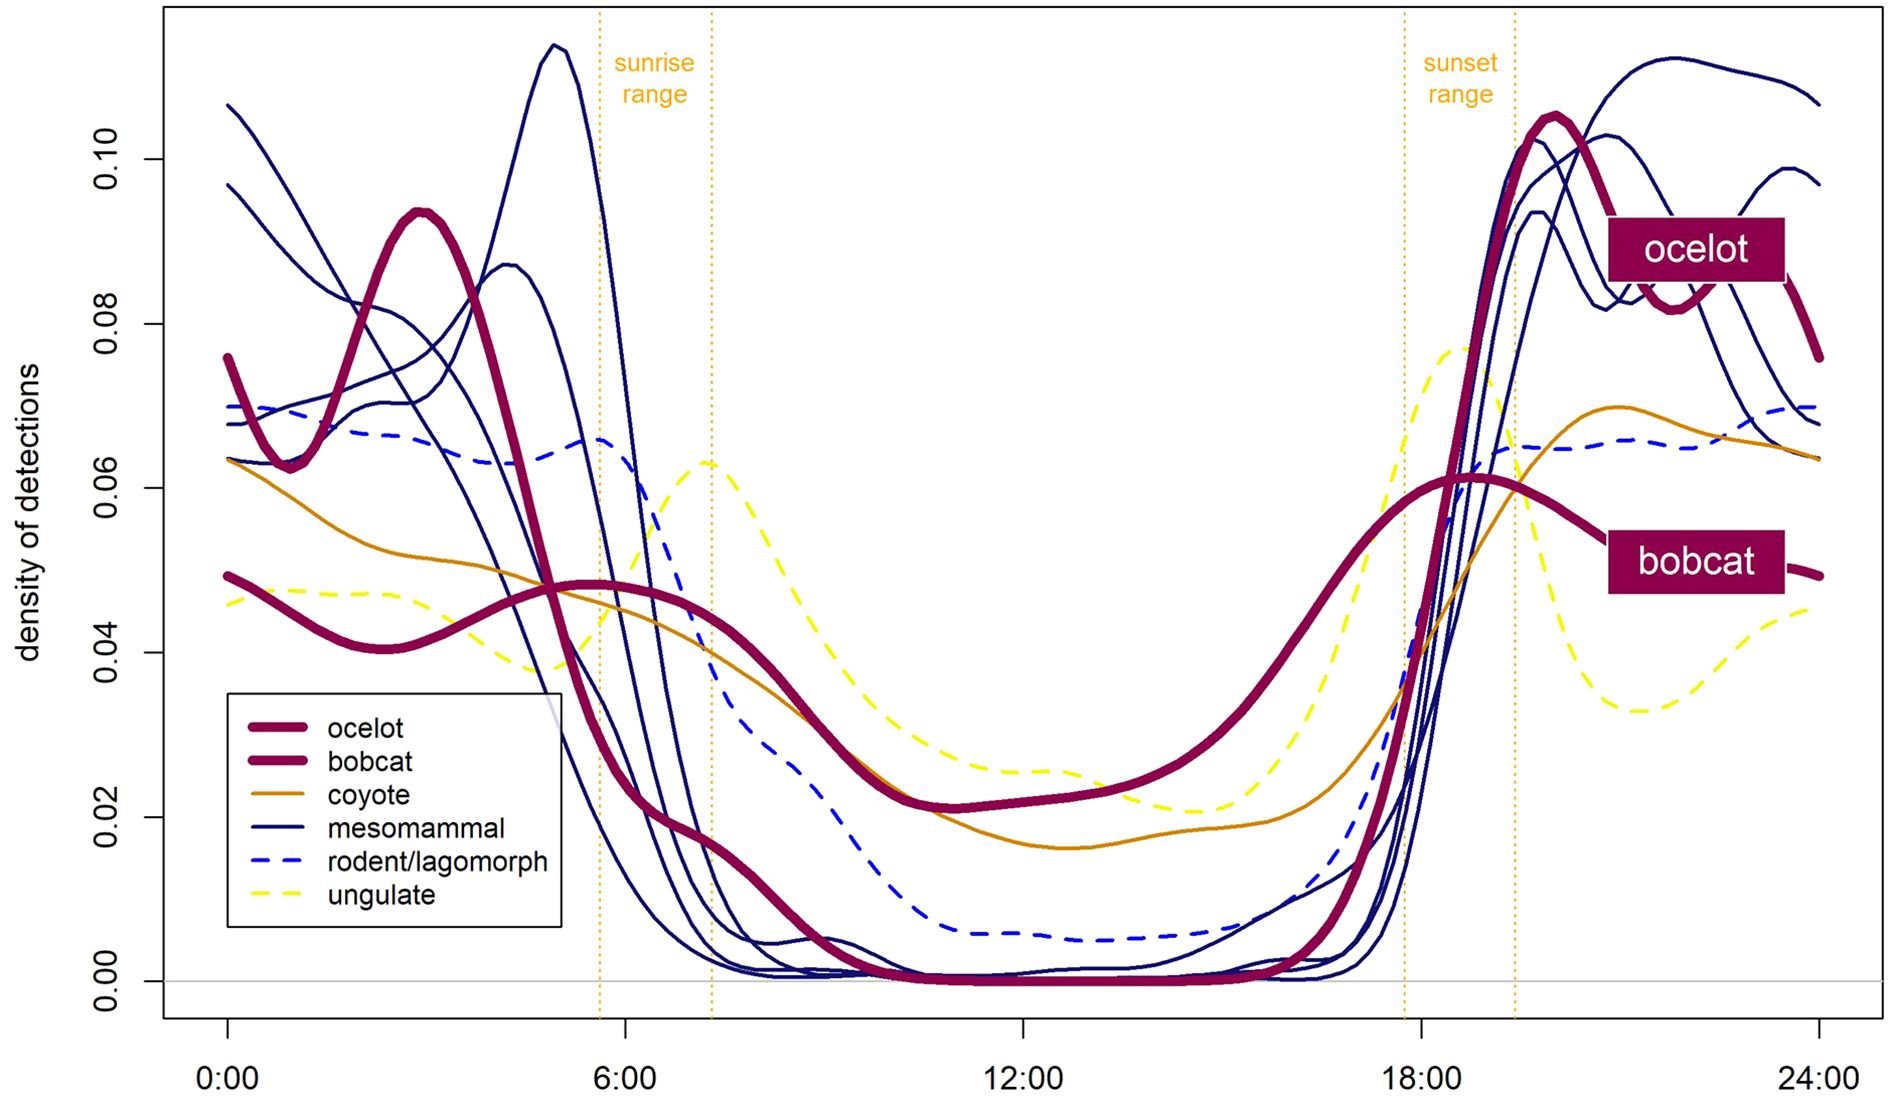
Figure 7. Circular probability distribution plots representing diel activity patterns for groups of species commonly detected on the FM106 mitigation corridor in Cameron County, TX. Ocelot detections (n=42) from over 2 years of post-construction roadside monitoring were used to estimate a diel activity curve; all other species activity curves were developed from habitat and select roadside camera trap detections between July 2021 and May 2022.
4 Discussion
While proximity to the major road in our study, FM106, did not negatively impact the relative abundance of species we studied as determined by detection on cameras, quantifying behavioral responses over a temporal scale provided a more comprehensive picture of potential road impact. We found that while target species did not exhibit spatial avoidance of the road – and bobcats and coyotes actually showed higher relative abundance closer to FM106 – three of the four species did exhibit temporal avoidance of vehicular traffic. These results indicate that while roadside sites may offer various resources or competitive advantages, certain species restrict their use of these areas to times when the risk of encountering traffic is at its lowest. Altering activity patterns may be more necessary for species (deer, bobcat, coyote) which are somewhat more active during daytime hours when traffic is high on FM106, but less relevant for species like the striped skunk which exhibit strictly nocturnal activity patterns and are already less likely to encounter traffic during a typical day-night cycle. These findings are generally consistent with previous studies documenting shifts in wildlife activity to avoid anthropogenic disturbances (Shamoon et al., 2018; Watabe and Saito, 2021; Kautz et al., 2021; Gaynor et al., 2018b).
Bobcats and coyotes were both detected more frequently with increased proximity to FM106 and demonstrated minor temporal avoidance of traffic. Skunks showed no significant response to either proximity to the road or to elevated levels of traffic over time. Carnivores have been documented using roads as travel corridors and territory boundary markers, for hunting or scavenging for roadkill, or as possible areas of release from the threat of competition or predation from other species (Ruiz-Capillas et al., 2021; Bradley and Fagre, 1988; Mata et al., 2017; Silva et al., 2019; Barrientos and Bolonio, 2009). These potential uses of roads by mesocarnivores may therefore outweigh any perceived or actual risks, especially when habitat is fragmented or not readily available (Shamoon et al., 2018). Fahrig (2007) contended that when landscape changes outpace the capacity of wildlife to evolve movement responses, certain species may rely on maladaptive cues for decision making in altered habitat, which may ultimately result in non-optimal movement behavior or, in this case, wildlife-vehicle collisions. While it is potentially costly to significantly alter movement behavior to avoid the perceived threat of vehicular traffic (Fehlmann et al., 2021; Cleveland et al., 2012), it may also be costly for mesocarnivore individuals which show a lesser degree of avoidance and fail to recognize vehicular traffic as a threat (Jaeger et al., 2005; Fahrig, 2007). In the case of bobcats and coyotes in this study, it appears that FM106 provides some combination of hunting, scavenging, or travel opportunities for these groups (or individuals within each group seeking lessened intraspecific competition). These potential advantages of using roadside corridors seem to outweigh the perceived risks of the road, especially at times with less traffic activity.
For certain species, temporal activity shifts may be an effective strategy to avoid traffic-related disturbances while still accessing local resources. Deer showed the strongest temporal avoidance of FM106, which may be indicative of both their response to traffic and to the increased mesocarnivore activity in roadside areas. However, the differential impacts of roads on different species may lead to the decoupling of important trophic interactions within the community (Clevenger and Waltho, 2005). These findings may also be influenced by the rarity or absence of native carnivore species (e.g. puma; Puma concolor, jaguar; Panthera onca, jaguarundi; Puma yagouaroundi, gray fox; Urocyon cinereoargenteus, American badger; Taxidea taxus) on the landscape. The predator-prey interactions, activity, or spatial distribution of species observed in this study may be influenced by limited intraguild competition, potential mesopredator release, or a lessened landscape of fear effect in the effective absence of historic predator species (Crooks and Soulé, 1999; Prugh et al., 2009; Soulé et al., 1988; Terborgh et al., 2001; Brown et al., 1999; Grigione et al., 2009; Wang et al., 2015; Kautz et al., 2021; Rodriguez et al., 2021).
Bobcat and ocelot have both been found in previous research to closely associate with dense thornscrub in South Texas (Harveson et al., 2004; Lombardi et al., 2020a; Laack, 1991), though bobcats may be less selective than ocelots when it comes to the level of canopy density (Horne et al., 2009). Previous work by Lombardi et al. (2020a) considered distance to road as a negative factor in modeling felid abundance and activity but, in that case, distance from the nearest road was conflated with greater woody cover availability and possibly less fragmented thornscrub habitat. Research from the adjacent SH100 mitigation corridor (also in Cameron County, TX) considered road distance as well, but was limited to monitoring sites within 150 m of the roadway (Hopkins, 2020; Yamashita, 2020). By contrast, this study sampled equally from sites across open, mixed, and dense vegetation structure, and evenly represented these groups at four levels of distance up to 1 km from the roadway. Results from FM106 indicated that bobcats may in fact increase their use of sites with increased proximity to the road, but the question remains whether ocelots can be expected to respond to this roadway in similar ways. However, ocelots have been found to avoid high-traffic roads within their home ranges in South Texas (Veals et al., 2022).
Bobcats have been cited as an appropriate surrogate species for predicting road mortality risk or habitat selection preferences when data on the ocelot is limited or unavailable (Schmidt et al., 2020; Lombardi et al., 2020a). It is also possible that their relatively similar size, trophic niche, and behavioral tendencies (Leonard et al., 2020) make them likely to respond in similar ways to novel stimuli on the landscape (e.g. wildlife crossing structures). Ocelot activity on FM106 was limited to roadside detections (n=42) across a relatively small (n=4) number of individuals. Nonetheless, patterns observed here aligned with previous research on South Texas felid activity which found bobcats to exhibit more diurnal and crepuscular behavior than the more nocturnal ocelot (Lehnen et al., 2024; Leonard et al., 2020; Laack, 1991). This distinction may be important when considering the indirect pressures posed by roads and vehicular traffic that intersect remaining ocelot habitat. Further research would be required to say whether ocelots respond to road proximity similarly to bobcats in this study (slight spatial attractance but temporal avoidance) or if their more nocturnal diel pattern and preference for extremely dense cover predetermine any response they may have to traffic on FM106.
Previous estimates of the road-effect zone have ranged from less than a few hundred meters (Forman and Deblinger, 2000; Hansen and Clevenger, 2005; Benítez-López et al., 2010; Forman and Alexander, 1998; Reijnen et al., 1995), to over 5 kilometers (Benítez-López et al., 2010; Forman and Alexander, 1998; Reijnen et al., 1995) for various taxa. The results of the present study suggest that the impact of FM106 on the spatiotemporal distribution of target species was largely limited to the areas immediately adjacent to the road. These findings do not rule out larger scale impacts on individual species or effects which extend beyond the 1 km cross-section that was quantified here (Forman and Alexander, 1998) and potential interactions between distance to primary and secondary roads, as well as spatial dependencies, may not have been fully captured in our analyses. A limitation of this study was the restriction to existing monitoring sites within the FM106 right-of-way < 20 m away or on refuge land up to 1 km away from FM106, as permitted by USFWS. However, given that 80% of the continental U.S. is located within a kilometer of a roadway (Riitters and Wickham, 2003), and the likelihood of encountering conflicting disturbances beyond this point (e.g. other roadways, resource extraction projects, urbanization), larger road-effects may not be feasible to quantify using this type of comparative study, even with access permitted to a larger cross-section of the landscape. Stratifying site selection by vegetation classes and distance bins was intended to represent possible land cover variation. However, this approach may not have captured other important factors influencing species utilization and movement through the corridor. Additionally, given the number of biologically plausible variables considered, we employed a data dredging approach in our analyses. While this allowed for broader exploration, testing a large number of relationships with limited preselection may increase the risk of spurious findings (Ioannidis, 2005).
At the time of this study, FM106 experienced primarily daytime and relatively light traffic (1,222 vehicles averaged between 2019-2023) compared to other major South Texas roadways, and the road has been present on the landscape for over 30 years (Statewide Traffic Analysis and Reporting System; TXDOT, 2022). Continued wildlife management around this road corridor will largely hinge upon the effectiveness of mitigation strategies keeping pace with increasing traffic volume and activity. Behavioral strategies observed in this study may change or become less effective for certain species if, for example, vehicular traffic began to affect a broader portion of the day-night cycle or increased in its intensity (Jacobson et al., 2016). One important possibility to consider in the event of increasing traffic on FM106, is that bobcats and coyotes might continue to shift their diel activity towards increasingly nocturnal activity to further avoid daytime traffic activity. This may in turn increase competition and pressure on the more-nocturnal ocelots that persist near such roadways. Previous studies in the region have suggested that fine-scale niche partitioning presently allows these species to co-exist despite similar spatial requirements and prey sources (Leonard et al., 2016; Lombardi et al., 2020a). The possibility of temporal encroachment by bobcat and coyote activity towards more nocturnal behavior could present yet another threat to the persistence of the South Texas ocelot.
Data availability statement
The original contributions presented in the study are included in the article/supplementary material. Further inquiries can be directed to the corresponding author.
Ethics statement
Ethical approval was not required for the study involving animals in accordance with the local legislation and institutional requirements because this study is based on observational data from remote cameras only.
Author contributions
CB: Conceptualization, Formal analysis, Investigation, Methodology, Visualization, Writing – original draft. AM: Investigation, Writing – review & editing. JY: Project administration, Resources, Writing – review & editing. SL: Formal analysis, Validation, Writing – review & editing. RK: Conceptualization, Funding acquisition, Methodology, Project administration, Supervision, Writing – original draft, Writing – review & editing.
Funding
The author(s) declare that financial support was received for the research and/or publication of this article. This study was supported by funding from the Texas Department of Transportation (grant number 57-3XXIA002) to Dr. Richard J. Kline.
Conflict of interest
The authors declare that the research was conducted in the absence of any commercial or financial relationships that could be construed as a potential conflict of interest.
Generative AI statement
The author(s) declare that no Generative AI was used in the creation of this manuscript.
Publisher’s note
All claims expressed in this article are solely those of the authors and do not necessarily represent those of their affiliated organizations, or those of the publisher, the editors and the reviewers. Any product that may be evaluated in this article, or claim that may be made by its manufacturer, is not guaranteed or endorsed by the publisher.
References
Anderson M. J. (2017). Permutational Multivariate Analysis of Variance (PERMANOVA). Wiley StatsRef: Statistics Reference Online doi: 10.1002/9781118445112.stat07841
Anderson M. J., Gorley R. N., and Clarke K. R. (2008). PERMANOVA+ for PRIMER: guide to software and statistical methods (Auckland, New Zealand: Primer-E Limited).
Andis A., Huijser M. P., and Broberg L. (2017). Performance of arch-style road crossing structures from relative movement rates of large mammals. Front. Ecol. Evol. 5, 122. doi: 10.3389/fevo.2017.00122
Barrientos R. and Bolonio L. (2009). The presence of rabbits adjacent to roads increases polecat road mortality. Biodiversity Conserv. 18, 405–418. doi: 10.1007/s10531-008-9499-9
Barrueto M., Ford A. T., and Clevenger A. P. (2014). Anthropogenic effects on activity patterns of wildlife at crossing structures. Ecosphere 5, 1–19. doi: 10.1890/ES13-00382.1
Barton K. (2012). MuMIn: Multi-model inference. R package version 1.7. 2. Available online at: http://CRAN.R-project.org/package=MuMIn (Accessed October 15, 2022).
Benítez-López A., Alkemade R., and Verweij P. A. (2010). The impacts of roads and other infrastructure on mammal and bird populations: a meta-analysis. Biol. Conserv. 143, 1307–1316. doi: 10.1016/j.biocon.2010.02.009
Bigelow D. and Borchers A. (2017). Major uses of land in the United States EIB-178, U.S. Department of Agriculture, Economic Research Service.
Bradley L. C. and Fagre D. B. (1988). Coyote and bobcat responses to integrated ranch management practices in south Texas. Rangeland Ecol. Management/Journal Range Manage. Arch. 41, 322–327. doi: 10.2307/3899388
Brown J. S., Laundré J. W., and Gurung M. (1999). The ecology of fear: optimal foraging, game theory, and trophic interactions. J. mammalogy 80, 385–399. doi: 10.2307/1383287
Clarke K. and Gorley R. (2001). PRIMER user manual: Plymouth routines in multivariate ecological research (Plymouth, UK: Plymouth Marine Laboratory).
Cleveland S. M., Hebblewhite M., Thompson M., and Henderson R. (2012). Linking elk movement and resource selection to hunting pressure in a heterogeneous landscape. Wildlife Soc. Bull. 36, 658–668. doi: 10.1002/wsb.182
Clevenger A. P. and Waltho N. (2000). Factors influencing the effectiveness of wildlife underpasses in Banff National Park, Alberta, Canada. Conserv. Biol. 14, 47–56. doi: 10.1046/j.1523-1739.2000.00099-085.x
Clevenger A. P. and Waltho N. (2005). Performance indices to identify attributes of highway crossing structures facilitating movement of large mammals. Biol. Conserv. 121, 453–464. doi: 10.1016/j.biocon.2004.04.025
Crooks K. R. and Soulé M. E. (1999). Mesopredator release and avifaunal extinctions in a fragmented system. Nature 400, 563–566. doi: 10.1038/23028
de Molenaar J. G., Sanders M. E., and Jonkers D. A. (2006). Road lighting and grassland birds: local influence of road lighting on a black-tailed godwit population. Ecol. consequences Artif. night lighting, (Washington, DC: Island Press) 114–138. doi: 10.1007/s00267-001-0065-4
Ditmer M. A., Stoner D. C., Francis C. D., Barber J. R., Forester J. D., Choate D. M., et al. (2021). Artificial nightlight alters the predator–prey dynamics of an apex carnivore. Ecography 44, 149–161. doi: 10.1111/ecog.05251
EPA (2013). Level III and IV ecoregions of the continental United States, map scale 1:3,000,000 (Corvallis, Oregon: U.S. EPA, U.S. Environmental Protection Agency, National Health and Environmental Effects Research Laboratory).
Fahrig L. (2007). Non-optimal animal movement in human-altered landscapes. Funct. Ecol. 21, 1003–1015. doi: 10.1111/j.1365-2435.2007.01326.x
Fahrig L. and Rytwinski T. (2009). Effects of roads on animal abundance: an empirical review and synthesis. Ecol. Soc. 14, 21. doi: 10.5751/ES-02815-140121
Fehlmann G., O’riain M. J., Fürtbauer I., and King A. J. (2021). Behavioral causes, ecological consequences, and management challenges associated with wildlife foraging in human-modified landscapes. BioScience 71, 40–54. doi: 10.1093/biosci/biaa129
Forman R. T. and Alexander L. E. (1998). Roads and their major ecological effects. Annu. Rev. Ecol. systematics 29, 207–231. doi: 10.1146/annurev.ecolsys.29.1.207
Forman R. T. and Deblinger R. D. (2000). The ecological road-effect zone of a Massachusetts (USA) suburban highway. Conserv. Biol. 14, 36–46. doi: 10.1046/j.1523-1739.2000.99088.x
Gagnon J. W., Dodd N. L., Ogren K. S., and Schweinsburg R. E. (2011). Factors associated with use of wildlife underpasses and importance of long-term monitoring. J. Wildl. Manage. 75, 1477–1487. doi: 10.1002/jwmg.160
Gaynor K. M., Branco P. S., Long R. A., Gonçalves D. D., Granli P. K., and Poole J. H. (2018a). Effects of human settlement and roads on diel activity patterns of elephants (Loxodonta africana). Afr. J. Ecol. 56, 872–881. doi: 10.1111/aje.12552
Gaynor K. M., Hojnowski C. E., Carter N. H., and Brashares J. S. (2018b). The influence of human disturbance on wildlife nocturnality. Science 360, 1232–1235. doi: 10.1126/science.aar7121
Grigione M., Menke K., López-González C., List R., Banda A., Carrera J., et al. (2009). Identifying potential conservation areas for felids in the USA and Mexico: integrating reliable knowledge across an international border. Oryx 43, 78–86. doi: 10.1017/S0030605308002019
Hansen M. J. and Clevenger A. P. (2005). The influence of disturbance and habitat on the presence of non-native plant species along transport corridors. Biol. Conserv. 125, 249–259. doi: 10.1016/j.biocon.2005.03.024
Harris G., Thompson R., Childs J. L., and Sanderson J. G. (2010). Automatic storage and analysis of camera trap data. Bull. Ecol. Soc. America 91, 352–360. doi: 10.1890/0012-9623-91.3.352
Harveson P. M., Tewes M. E., Anderson G. L., and Laack L. L. (2004). Habitat use by ocelots in south Texas: implications for restoration. Wildlife Soc. Bull. 32, 948–954. doi: 10.2193/0091-7648(2004)032[0948:HUBOIS]2.0.CO;2
Hopkins T. M. (2020). “Influence of landscape factors on wildlife presence and road mitigation structure performance,” in Master’s of Biology Master of Science (Brownsville, TX, USA: The University of Texas Rio Grande Valley).
Horne J. S., Haines A. M., Tewes M. E., and Laack L. L. (2009). Habitat partitioning by sympatric ocelots and bobcats: implications for recovery of ocelots in southern Texas. Southwestern Nat. 54, 119–126. doi: 10.1894/PS-49.1
Ioannidis J. P. A. (2005). Why most published research finding are false. PloS Med. 19, e1004085. doi: 10.1371/journal.pmed.1004085
Jacobson S. L., Bliss-Ketchum L. L., De Rivera C. E., and Smith W. P. (2016). A behavior-based framework for assessing barrier effects to wildlife from vehicle traffic volume. Ecosphere 7, e01345. doi: 10.1002/ecs2.1345
Jaeger J. A., Bowman J., Brennan J., Fahrig L., Bert D., Bouchard J., et al. (2005). Predicting when animal populations are at risk from roads: an interactive model of road avoidance behavior. Ecol. Model. 185, 329–348. doi: 10.1016/j.ecolmodel.2004.12.015
Jaeger J. A. and Fahrig L. (2004). Effects of road fencing on population persistence. Conserv. Biol. 18, 1651–1657. doi: 10.1111/j.1523-1739.2004.00304.x
Jakes A. F., Jones P. F., Paige L. C., Seidler R. G., and Huijser M. P. (2018). A fence runs through it: A call for greater attention to the influence of fences on wildlife and ecosystems. Biol. Conserv. 227, 310–318. doi: 10.1016/j.biocon.2018.09.026
Janečka J., Tewes M., Laack L., Caso A., Grassman J., Li, et al. (2011). Reduced genetic diversity and isolation of remnant ocelot populations occupying a severely fragmented landscape in southern Texas. Anim. Conserv. 14, 608–619. doi: 10.1111/j.1469-1795.2011.00475.x
Kautz T. M., Fowler N. L., Petroelje T. R., Beyer D. E., Svoboda N. J., and Belant J. L. (2021). Large carnivore response to human road use suggests a landscape of coexistence. Global Ecol. Conserv. 30, e01772. doi: 10.1016/j.gecco.2021.e01772
Kays R., Tilak S., Kranstauber B., Jansen P. A., Carbone C., Rowcliffe M. J., et al. (2010). Monitoring wild animal communities with arrays of motion sensitive camera traps. arXiv preprint arXiv:1009.5718. doi: 10.48550/arXiv.1009.5718
Laack L. L. (1991). Ecology of the ocelot (Felis pardalis) in south Texas (Kingsville, TX, USA: Texas A&I University).
Lehnen S. E., Sternberg M. A., Swarts H. M., and Sesnie S. E. (2021). Evaluating population connectivity and targeting conservation action for an endangered cat. Ecosphere 12, e03367. doi: 10.1002/ecs2.3367
Lehnen S.e., Sternberg M.a., Swarts H.m., Young J.h. Jr, Hanley V., and Kline R. J. (2024). Highway crossing rates of wild felids before, during, and after wildlife crossing structure installation. Ecol. Evol. 14, e70703. doi: 10.1002/ece3.70703
Leonard J. P. (2016). Home range characteristics, activity patterns, and resource selection of sympatric ocelots (Leopardus pardalis) and bobcats (Lynx rufus) and major histocompatibility complex variation in ocelots. PhD dissertation, Texas A&M University-Kingsville
Leonard J. P., Tewes M. E., Lombardi J. V., Wester D. W., and Campbell T. A. (2020). Effects of sun angle, lunar illumination, and diurnal temperature on temporal movement rates of sympatric ocelots and bobcats in South Texas. PloS One 15, e0231732. doi: 10.1371/journal.pone.0231732
Lombardi J. V., Mackenzie D. I., Tewes M. E., Perotto-Baldivieso H. L., Mata J. M., and Campbell T. A. (2020a). Co-occurrence of bobcats, coyotes, and ocelots in Texas. Ecol. Evol. 10, 4903–4917. doi: 10.1002/ece3.6242
Lombardi J. V., Tewes M. E., Perotto-Baldivieso H. L., Mata J. M., and Campbell T. A. (2020b). Spatial structure of woody cover affects habitat use patterns of ocelots in Texas. Mammal Res. 65, 555–563. doi: 10.1007/s13364-020-00501-2
Mata C., Ruiz-Capillas P., and Malo J. E. (2017). Small-scale alterations in carnivore activity patterns close to motorways. Eur. J. Wildlife Res. 63, 1–12. doi: 10.1007/s10344-017-1118-1
McClure C. J., Ware H. E., Carlisle J., Kaltenecker G., and Barber J. R. (2013). An experimental investigation into the effects of traffic noise on distributions of birds: avoiding the phantom road. Proc. R. Soc. B: Biol. Sci. 280, 20132290. doi: 10.1098/rspb.2013.2290
Mehner A. R. (2024). Understanding the Influence of Traffic and Noise on the Wildlife Community Surrounding FM106 and SH100 in South Texas (Brownsville, TX, USA: Master’s thesis, The University of Texas Rio Grande Valley).
Meredith M. (2021). overlap: Estimates of Coefficient of Overlapping for Animal Activity Patterns. Ed. Ridout M. Available online at: https://CRAN.R-project.org/package=overlap.
Morelli F., Beim M., Jerzak L., Jones D., and Tryjanowski P. (2014). Can roads, railways and related structures have positive effects on birds?–A review. Transportation Res. Part D: Transport Environ. 30, 21–31. doi: 10.1016/j.trd.2014.05.006
NOAA (2021). Climate at a Glance: County Time Series (National Centers for Environmental information). Available online at: https://www.ncdc.noaa.gov/cag/.
Parsons A. W., Forrester T., Mcshea W. J., Baker-Whatton M. C., Millspaugh J. J., and Kays R. (2017). Do occupancy or detection rates from camera traps reflect deer density? J. Mammalogy 98, 1547–1557. doi: 10.1093/jmammal/gyx128
Prugh L. R., Stoner C. J., Epps C. W., Bean W. T., Ripple W. J., Laliberte A. S., et al. (2009). The rise of the mesopredator. Bioscience 59, 779–791. doi: 10.1525/bio.2009.59.9.9
R Core Team (2023). R: A language and environment for statistical computing (Vienna, Austria: R Foundation for Statistical Computing).
Reijnen R., Foppen R., Braak C. T., and Thissen J. (1995). The effects of car traffic on breeding bird populations in woodland. III. Reduction of density in relation to the proximity of main roads. J. Appl. Ecol. 32, 187–202. doi: 10.2307/2404428
Ridout M. S. and Linkie M. (2009). Estimating overlap of daily activity patterns from camera trap data. J. Agricultural Biological Environ. Stat 14, 322–337. doi: 10.1198/jabes.2009.08038
Riitters K. H. and Wickham J. D. (2003). How far to the nearest road? Front. Ecol. Environ. 1, 125–129. doi: 10.1890/1540-9295(2003)001[0125:HFTTNR]2.0.CO;2
Rodriguez J. T., Lesmeister D. B., and Levi T. (2021). Mesocarnivore landscape use along a gradient of urban, rural, and forest cover. PeerJ 9, e11083. doi: 10.7717/peerj.11083
Rowcliffe M. (2016). Package ‘activity’. Animal activity statistics R Package Version. Available online at: https://CRAN.R-project.org/package=activity.
Ruiz-Capillas P., Mata C., Fernández B., Fernandes C., and Malo J. E. (2021). Do roads alter the trophic behavior of the mesocarnivore community living close to them? Diversity 13, 173. doi: 10.3390/d13040173
Sanderson J. and Harris G. (2013). Automatic data organization, storage, and analysis of camera trap pictures. J. Indonesian Natural History 1, 11–19. doi: 10.1890/0012-9623-91.3.352
Schmidt G. M., Lewison R. L., and Swarts H. M. (2020). Identifying landscape predictors of ocelot road mortality. Landscape Ecol. 35, 1651–1666. doi: 10.1007/s10980-020-01042-4
Shamoon H., Maor R., Saltz D., and Dayan T. (2018). Increased mammal nocturnality in agricultural landscapes results in fragmentation due to cascading effects. Biol. Conserv. 226, 32–41. doi: 10.1016/j.biocon.2018.07.028
Silva C., Simões M. P., Mira A., and Santos S. M. (2019). Factors influencing predator roadkills: The availability of prey in road verges. J. Environ. Manage. 247, 644–650. doi: 10.1016/j.jenvman.2019.06.083
Soulé M. E., Bolger D. T., Alberts A. C., Wrights J., Sorice M., and Hill S. (1988). Reconstructed dynamics of rapid extinctions of chaparral-requiring birds in urban habitat islands. Conserv. Biol. 2, 75–92. doi: 10.1111/j.1523-1739.1988.tb00337.x
Terborgh J., Lopez L., Nuñez P., Rao M., Shahabuddin G., Orihuela G., et al. (2001). Ecological meltdown in predator-free forest fragments. Science 294, 1923–1926. doi: 10.1126/science.1064397
TXDOT (2022). Highway Designation File - FARM TO MARKET ROAD NO. 106. Available online at: https://www.dot.state.tx.us/tpp/hwy/FM/FM0106.htm (Accessed September 15 2022).
U.S. Census Bureau (2020). QuickFacts: Cameron County. Texas, United States. https://data.census.gov/
van der Ree R., Smith D. J., and Grilo C. (2015). Handbook of road ecology (Hoboken, NJ, USA: John Wiley & Sons).
Veals A. M., Holbrook J. D., Blackburn A., Anderson C. J., Deyoung R. W., Campbell T. A., et al. (2022). Multiscale habitat relationships of a habitat specicalist over time: The case of ocelots in Texas from 1982 to 2017. Ecosphere 13, e4204. doi: 10.1002/ecs2.4204
Venables W. N. and Ripley B. D. (2002). Modern applied statistics with S 4th ed. (New York: Springer). https://www.stats.ox.ac.uk/pub/MASS4/
Wang Y., Allen M. L., and Wilmers C. C. (2015). Mesopredator spatial and temporal responses to large predators and human development in the Santa Cruz Mountains of California. Biol. Conserv. 190, 23–33. doi: 10.1016/j.biocon.2015.05.007
Watabe R. and Saito M. U. (2021). Effects of vehicle-passing frequency on forest roads on the activity patterns of carnivores. Landscape Ecol. Eng. 17, 225–231. doi: 10.1007/s11355-020-00434-7
Yamashita T. J. (2020). The influence of human disturbance on wildlife use of a highway in South Texas (Brownsville, TX, USA: Master of Science, The University of Texas Rio Grande Valley).
Keywords: mammal diel activity, road ecology, wildlife crossing structures, road-effect zone, South Texas
Citation: Brett CK, Mehner AR, Young JH Jr., Lehnen SE and Kline RJ (2025) Spatiotemporal responses to a rural highway by four mammal species. Front. Ecol. Evol. 13:1566882. doi: 10.3389/fevo.2025.1566882
Received: 26 January 2025; Accepted: 16 June 2025;
Published: 18 July 2025.
Edited by:
Hanxi Wang, Harbin Normal University, ChinaReviewed by:
Heliot Zarza, Metropolitan Autonomous University, MexicoCecilia Calabuig, Federal University Rural Semi-Arid, Brazil
Copyright © 2025 Brett, Mehner, Young, Lehnen and Kline. This is an open-access article distributed under the terms of the Creative Commons Attribution License (CC BY). The use, distribution or reproduction in other forums is permitted, provided the original author(s) and the copyright owner(s) are credited and that the original publication in this journal is cited, in accordance with accepted academic practice. No use, distribution or reproduction is permitted which does not comply with these terms.
*Correspondence: Richard J. Kline, cmljaGFyZC5rbGluZUB1dHJndi5lZHU=; Caitlin K. Brett, Y2FpdGxpbi5icmV0dEBuY3dpbGRsaWZlLmdvdg==