 Abdisalam Hassan Muse1*†
 Maysaa Elmahi Abd Elwahab2†
- 1Research and Innovation Centre, Amoud University, Borama, Somalia
- 2Department of Mathematical Sciences, College of Science, Princess Nourah bint Abdulrahman University, Riyadh, Saudi Arabia
Introduction: This study aimed to predict the spatial distribution of Corvus edithae (Somali crow) in Somaliland and explore its relationship with climatic covariates.
Methods: We applied a log-Gaussian Cox process model, utilizing the R-INLA package. The model integrated spatial climatic covariates (mean annual temperature, precipitation, temperature extremes, solar radiation, wind speed) alongside structured and unstructured random effects to address spatial autocorrelation and unexplained variability.
Results: Posterior mean estimates for climatic covariates showed wide 95% credible intervals encompassing zero, indicating substantial uncertainty regarding their specific effects. Conversely, the model revealed highly influential and statistically significant spatially structured (autocorrelation) and unstructured random effects. Model predictions indicated generally low occurrence intensities, with coastal areas exhibiting the highest expected densities, suggesting their importance as potential core habitats. Convergence diagnostics indicated model reliability.
Discussion: The findings underscore that unmeasured spatial factors and environmental heterogeneity are dominant drivers of Corvus edithae distribution, outweighing the influence of the broad-scale climate variables tested. This study provides a robust Bayesian spatial point process framework for conservation ecology, particularly where spatial patterns are prominent and data may be uncertain.
Highlights
● Advanced Spatial Modeling Applied: Successfully implemented a Bayesian log-Gaussian Cox process model (via R-INLA) to analyze the spatial distribution of the Somali Crow (Corvus edithae) in Somaliland.
● Spatial Structure Dominates: Revealed that unmeasured spatial factors, including significant spatial autocorrelation and local heterogeneity (captured by random effects), are dominant drivers of the crow’s distribution, outweighing the clear influence of the broad-scale climate variables tested.
● Climate Influence Uncertain: While exploring associations with key climate variables (temperature, precipitation, solar radiation, wind), the model indicated considerable uncertainty regarding their specific effects at the scale analyzed.
● Coastal Habitats Identified: Predicted occurrence intensity maps identified coastal regions as areas with the highest expected densities, suggesting their potential importance as core habitats for the Somali Crow.
● Guides Future Research: Underscores the critical need for future studies to incorporate finer-scale environmental data, investigate specific habitat features, and consider other potential drivers beyond regional climate to fully understand the species’ distribution patterns.
1 Introduction
Spatial point process models are increasingly recognized as essential tools for understanding complex ecological distribution patterns and informing effective conservation strategies (Moraga, 2019, 2021, 2023; Moraga and Montes, 2011). These models extend beyond simple presence-absence data, enabling researchers to analyze the spatial intensity of ecological phenomena, identify patterns in observed locations, and estimate correlations between locations and spatial covariates (Diggle, 2013; Moraga, 2021). This is particularly crucial in the context of rapidly changing environments, where understanding the drivers of species distribution is paramount for effective conservation planning and management (Elith et al., 2006; Guisan and Thuiller, 2005). In this context, the log-Gaussian Cox process model emerges as a robust approach for modeling environmentally driven phenomena, offering flexibility through its capacity to incorporate spatial explanatory variables and random effects to account for spatial autocorrelation and unexplained variability (Brix and Diggle, 2001; Dovers et al., 2024; Li et al., 2012; Teng et al., 2017). This is particularly relevant for elucidating the complex distribution patterns of generalist species, such as those within the Corvus genus, which frequently exhibit wide ranges and intricate interactions with their environment (Moraga, 2021; Ovaskainen et al., 2016).
Species distribution models (SDMs), of which spatial point process models are a subset, constitute fundamental tools in ecology for predicting and understanding spatial patterns, assessing the influence of climatic and environmental factors on species occurrence, and identifying rare and endangered species (Elith et al., 2006; Guisan and Thuiller, 2005; Hosseini et al., 2024; Keith et al., 2008). These models are essential for developing effective strategies to protect species and their environments. However, SDMs face numerous technical challenges, including data retrieval at an appropriate scale, correct data processing, and the selection of appropriate statistical techniques (Franklin, 2023; Moraga, 2021; Woodin et al., 2013). Issues such as spatial sampling biases, spatial autocorrelation, and algorithmic complexity and uncertainties must be addressed to obtain reliable predictions (Crase et al., 2012; Miller, 2010, 2012). The log-Gaussian Cox process model, as a type of spatial point process model, offers a particularly valuable framework for addressing these challenges, as it explicitly accounts for spatial autocorrelation and allows for the inclusion of environmental covariates (Diggle, 2013). This is particularly relevant for modeling the distributions of Corvus species, which often exhibit complex spatial dynamics and responses to environmental gradients (Jokimäki et al., 2022; Ndimuligo et al., 2022).
Methodologically, this study employs a log-Gaussian Cox process model, a type of spatial point process model, which is fitted using the R-INLA package (Bivand et al., 2015; Li et al., 2012; Moraga, 2019; Van Niekerk et al., 2021). This Bayesian modeling approach allows for the incorporation of both fixed effects, representing the influence of environmental covariates, and random effects, capturing spatial autocorrelation and unexplained variability. The R-INLA package, renowned for its efficient implementation of integrated nested Laplace approximations, is particularly well-suited for complex spatial models (Rue et al., 2009). The model’s mathematical formulation builds upon the basic Poisson process, wherein the number of events in a given region is Poisson-distributed. The log-intensity of this Poisson process is subsequently modeled as a function of environmental covariates and random effects, facilitating a flexible and nuanced representation of species distribution patterns. The posterior distribution of the model parameters, including the intercept and coefficients of the covariates, are estimated using Bayesian inference. The prior distributions for the fixed effects are typically assumed to be Gaussian with a mean of and a large variance, expressing a lack of prior knowledge. The prior for the structured spatial random effect is a conditional autoregressive (CAR) model, which posits that the value at a location is dependent on the values at neighboring locations (Moraga, 2021). The prior for the unstructured random effect is typically a Gaussian distribution with a mean of 0 and a variance that is estimated from the data.
This study focuses on the Corvus genus, a group of highly adaptable and widely distributed birds that includes crows and ravens. Corvus species are known for their ecological flexibility, occupying diverse habitats from urban environments to remote wilderness areas (Jokimäki et al., 2022; Ndimuligo et al., 2022). This adaptability, coupled with their complex social behaviors and cognitive abilities, makes them an excellent model group for studying the impacts of environmental change on species distribution (Sol, 2009; Lefebvre et al., 2004). This study specifically examines the Somali crow (Corvus edithae), a species endemic to the Horn of Africa, which is approximately the size of the carrion crow, Corvus corone, but possesses a longer bill and a somewhat more brownish cast to the feathers. The Somali crow is found primarily in Somalia, Djibouti, the Ogaden, and the Northern Frontier District of Kenya, and is distinguished from the larger brown-necked raven (Corvus ruficollis) by its call, appearance, and behavior (Stevenson and Fanshawe, 2004). The study area encompasses Somaliland, a region in the Horn of Africa, characterized by arid to semi-arid conditions and a high degree of environmental variability. This region is particularly susceptible to climate change impacts, making it a crucial area for understanding how species may respond to changing environmental conditions. The occurrence data for Corvus edithae were obtained from the Global Biodiversity Information Facility (GBIF) using the spocc R package (Chamberlain et al., 2018), and spatial climate variables were acquired using the geodata R package (Hijmans, 2024). These publicly available datasets enable a transparent and reproducible approach to modeling species distributions. The inclusion of additional climatic covariates, such as minimum temperature, maximum temperature, and humidity, alongside mean annual temperature and precipitation, allows for a more comprehensive assessment of the environmental factors influencing Corvus edithae distribution.
Despite the expanding corpus of research on the impacts of climate change on species distribution, several knowledge gaps persist (Austin and Van Niel, 2011; Hosseini et al., 2024; Lezama-Ochoa et al., 2024; Pipoly et al., 2022; Van de ven et al., 2020; Van der Putten et al., 2010). Firstly, there is a necessity for additional studies that concentrate on the impacts of climate change in specific regions, particularly in developing countries such as Somaliland, where avian research remains in its nascent stages. Secondly, there is a requirement for further studies that explicitly account for spatial autocorrelation and other spatial dependencies in species distribution data. Thirdly, there is a need for additional studies that explore the utilization of spatial point process models, which offer a more nuanced and flexible approach to modeling species distributions compared to traditional SDMs. Lastly, there is a necessity for studies that provide practical guidance for researchers interested in applying these techniques to their own data. The extant studies on Corvus species have focused on other species and other regions, and there is a paucity of research that focuses on the Somali crow.
This study addresses these research gaps by demonstrating the application of a log-Gaussian Cox process model to analyze the distribution of the Somali crow (Corvus edithae) in Somaliland, explicitly accounting for spatial autocorrelation and incorporating multiple climatic covariates. This research question is significant as it contributes to a more comprehensive understanding of how climate change may affect the distribution of a unique and endemic avian species in a region that is particularly vulnerable to climate change impacts. The investigation also provides a methodological framework for researchers interested in applying spatial point process models to analyze species distribution data, and emphasizes the importance of considering both climatic and non-climatic factors when assessing species vulnerability to climate change. This approach directly addresses the need for more robust and nuanced methodologies for modeling species distributions in the context of climate change.
The objective of this paper is to provide a methodological framework for analyzing species occurrence data utilizing spatial point process models with advanced statistical techniques in R. For this purpose, we have assumed that the data collection methods are without error and that the analyzed spatial pattern represents the true process generating the locations. In empirical research, it is imperative to comprehend the sampling mechanism employed and evaluate potential data biases, such as overrepresentation of certain areas, which may influence the conclusions. In subsequent studies, it is crucial to employ well-defined sampling schemes and develop models that can account for data biases to draw meaningful inferences. Moreover, expert knowledge is essential for developing appropriate models by incorporating significant predictive covariates and random effects that account for various types of variability. This research aligns with the United Nations Sustainable Development Goals (SDGs), particularly SDG 13 (Climate Action) by addressing the impact of climate change on species distribution and SDG 15 (Life on Land) by contributing towards conservation efforts through the identification of areas that may be prioritized in Somaliland. Furthermore, this study contributes to SDG 14 (Life Below Water) through the examination of Corvus edithae, which are dependent on aquatic ecosystems. By providing a robust and reproducible methodology, this study enables researchers and conservation practitioners to better understand and manage the impacts of climate change on biodiversity.
2 Methodology
This investigation employed a quantitative approach utilizing spatial point process modeling to predict the distribution of Corvus edithae in Somaliland under current and future climate conditions. The methodology encompassed several key steps, including data acquisition, data preparation, model formulation, model fitting, and model evaluation.
2.1 Study area
This study was carried out in Somaliland, a self-declared independent state in northwestern Somalia. It is bordered by Ethiopia, Djibouti, and the Gulf of Aden. The region’s coastal and interior landscapes function as critical ecosystems for numerous avian species, including Corvus edithae. Somaliland’s topography is diverse, encompassing coastal lowlands, mountain ranges, and high plateaus. The region is characterized by an arid to semi-arid climate, distinguished by limited and erratic precipitation, elevated temperatures, and frequent periods of drought. These environmental conditions render the area particularly vulnerable to the impacts of climate change. Consequently, elucidating the geographical distribution of species such as Corvus edithae is imperative for the implementation of effective conservation strategies (Abdikarim et al., 2024; Ali et al., 2025; Hassan et al., 2024).
2.2 Study design
The research employed a retrospective observational approach, utilizing existing Corvus edithae occurrence records and publicly accessible climate data. To predict the density of Corvus edithae occurrences across Somaliland, a spatial point process model was implemented, incorporating spatial covariates and random effects. The R-INLA package, which applies Bayesian inference for latent Gaussian models, was employed to fit the model. The investigation aimed to examine the relationship between climate variables and Corvus edithae distribution, as well as project future distributions under various climate change scenarios (Moraga, 2019, 2023; Taylor and Diggle, 2014).
2.3 Data sources
The research utilized two primary data sources: Distribution Records - Data occurrence of edithae in Somaliland were obtained from eBird (www.ebird.org) (Johnston et al., 2021; Walker and Taylor, 2017), a comprehensive online database of avian observations contributed by citizen scientists. Geographic Climate Variables - Climatic environmental data were accessed through the geodata R package (Hijmans, 2024; Lovelace et al., 2019; Pebesma and Bivand, 2023). This software facilitates the acquisition of information from the WorldClim database, which provides high-resolution climatic data for various global regions (Moraga, 2023; Pebesma and Bivand, 2023).
2.4 Data selection and preparation
2.4.1 Occurrence data
To obtain Corvus edithae occurrence data in Somaliland, researchers employed the occ() function from the spocc package to query eBird records. The search parameters were established to encompass data from July 21, 2009, to December 31, 2023, exclusively selecting entries with geographical coordinates and limiting the results to 1000 records. The retrieved information was subsequently converted into a data frame for further analysis utilizing the occ2df() function.
The researchers acknowledged that potential biases in eBird data collection might influence the study’s outcomes (Walker and Taylor, 2017).
A summary of the data is shown in Table 1.
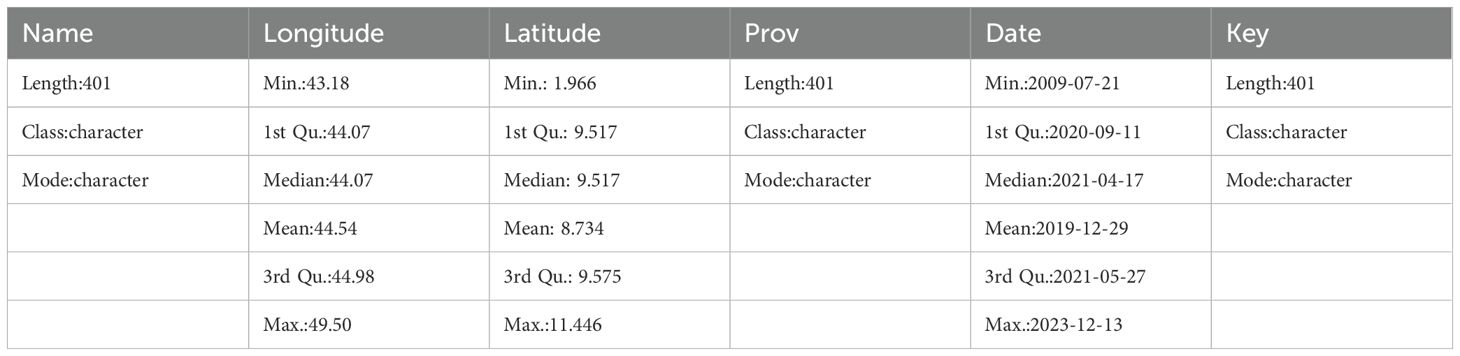
Table 1. Summary of corvus edithae occurrence data.
Utilizing tmap, we mapped the geographical positions of the identified Corvus edithae specimens. Initially, we employed the st_as_sf() function from the sf package to generate an sf object designated as dpts, which encompassed the coordinate data for the Corvus edithae locations.
Figure 1 presents an interactive map illustrating the observed locations of Corvus edithae. The tmap package facilitates the generation of both static and interactive maps through the utilization of tmap_mode(“plot”) and tmap_mode(“view”) functions, respectively.
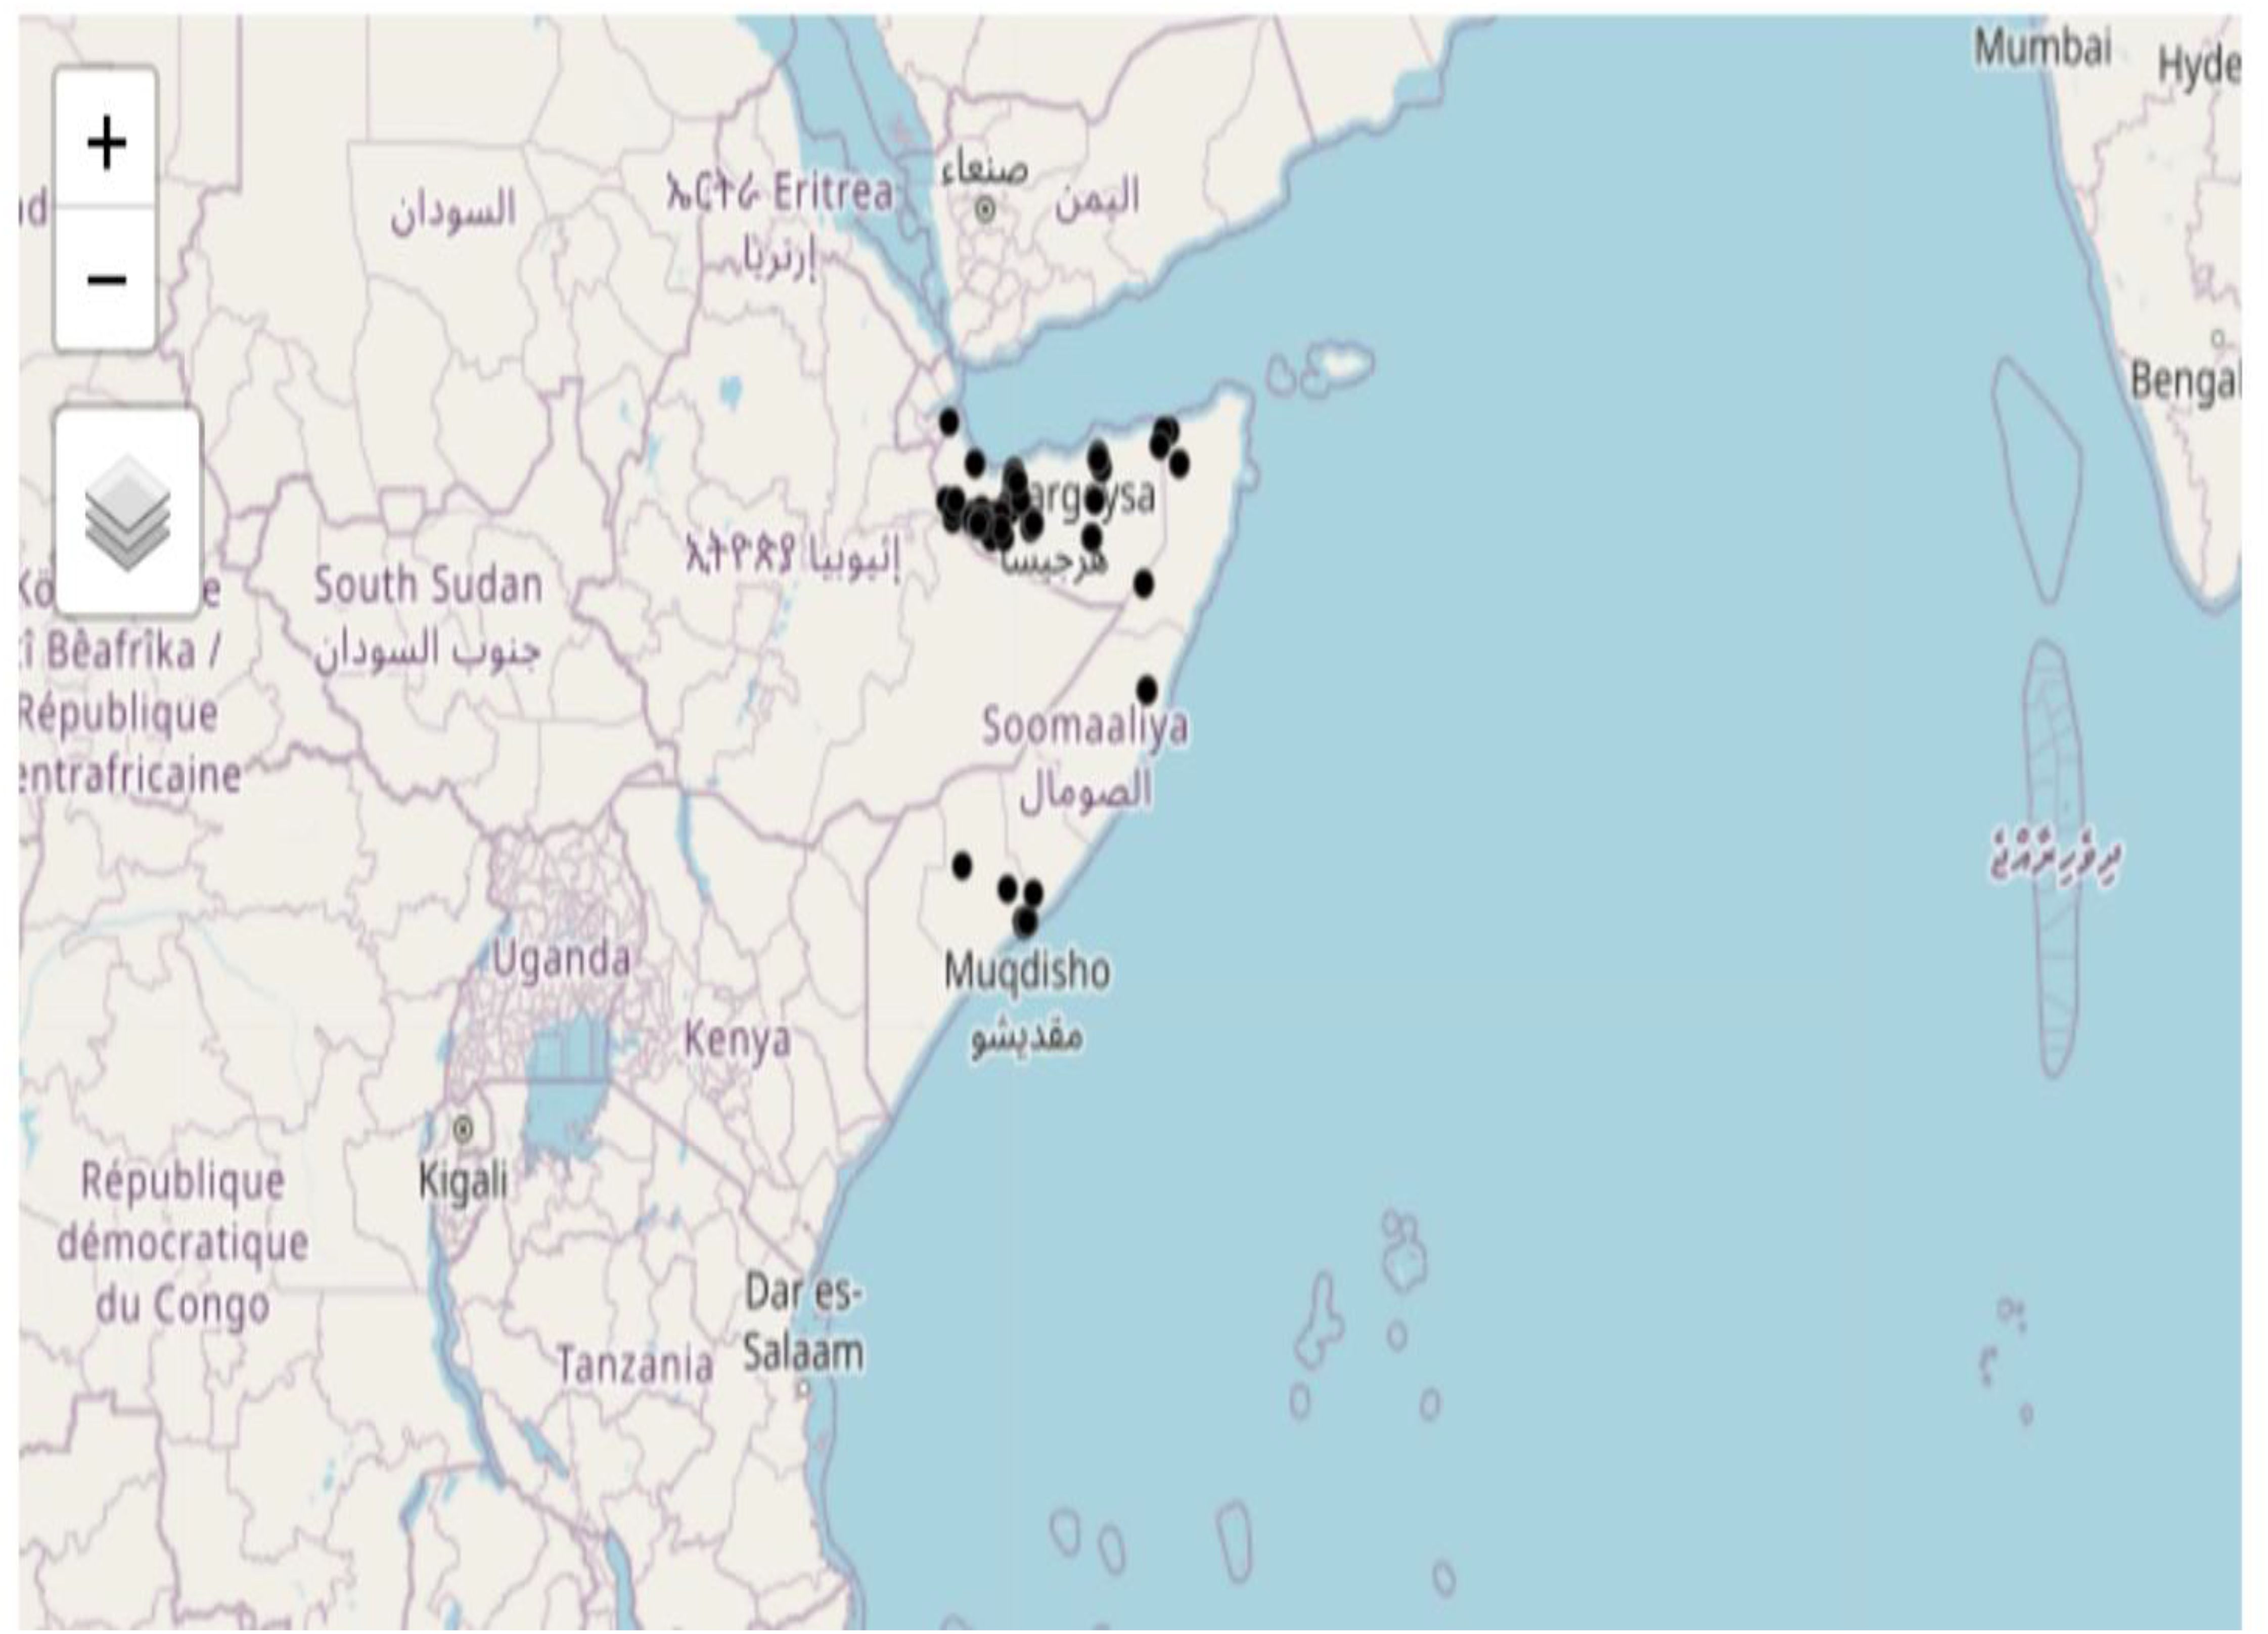
Figure 1. Map of C. edithae occurrences in Somaliland.
The spatial distribution of C. edithae observations on the map exhibits a heterogeneous pattern (Figure 1), with concentrations in specific regions throughout Somaliland. To analyze this distribution, we employ a log-Gaussian Cox point process model, which facilitates the estimation of the intensity of the process generating these observation locations (Dovers et al., 2024; Moraga, 2021). Furthermore, this model enables the evaluation of potential influences of climatic variables on the observed distribution patterns of C. edithae Somali crow Figure 2 (Moraga, 2023).
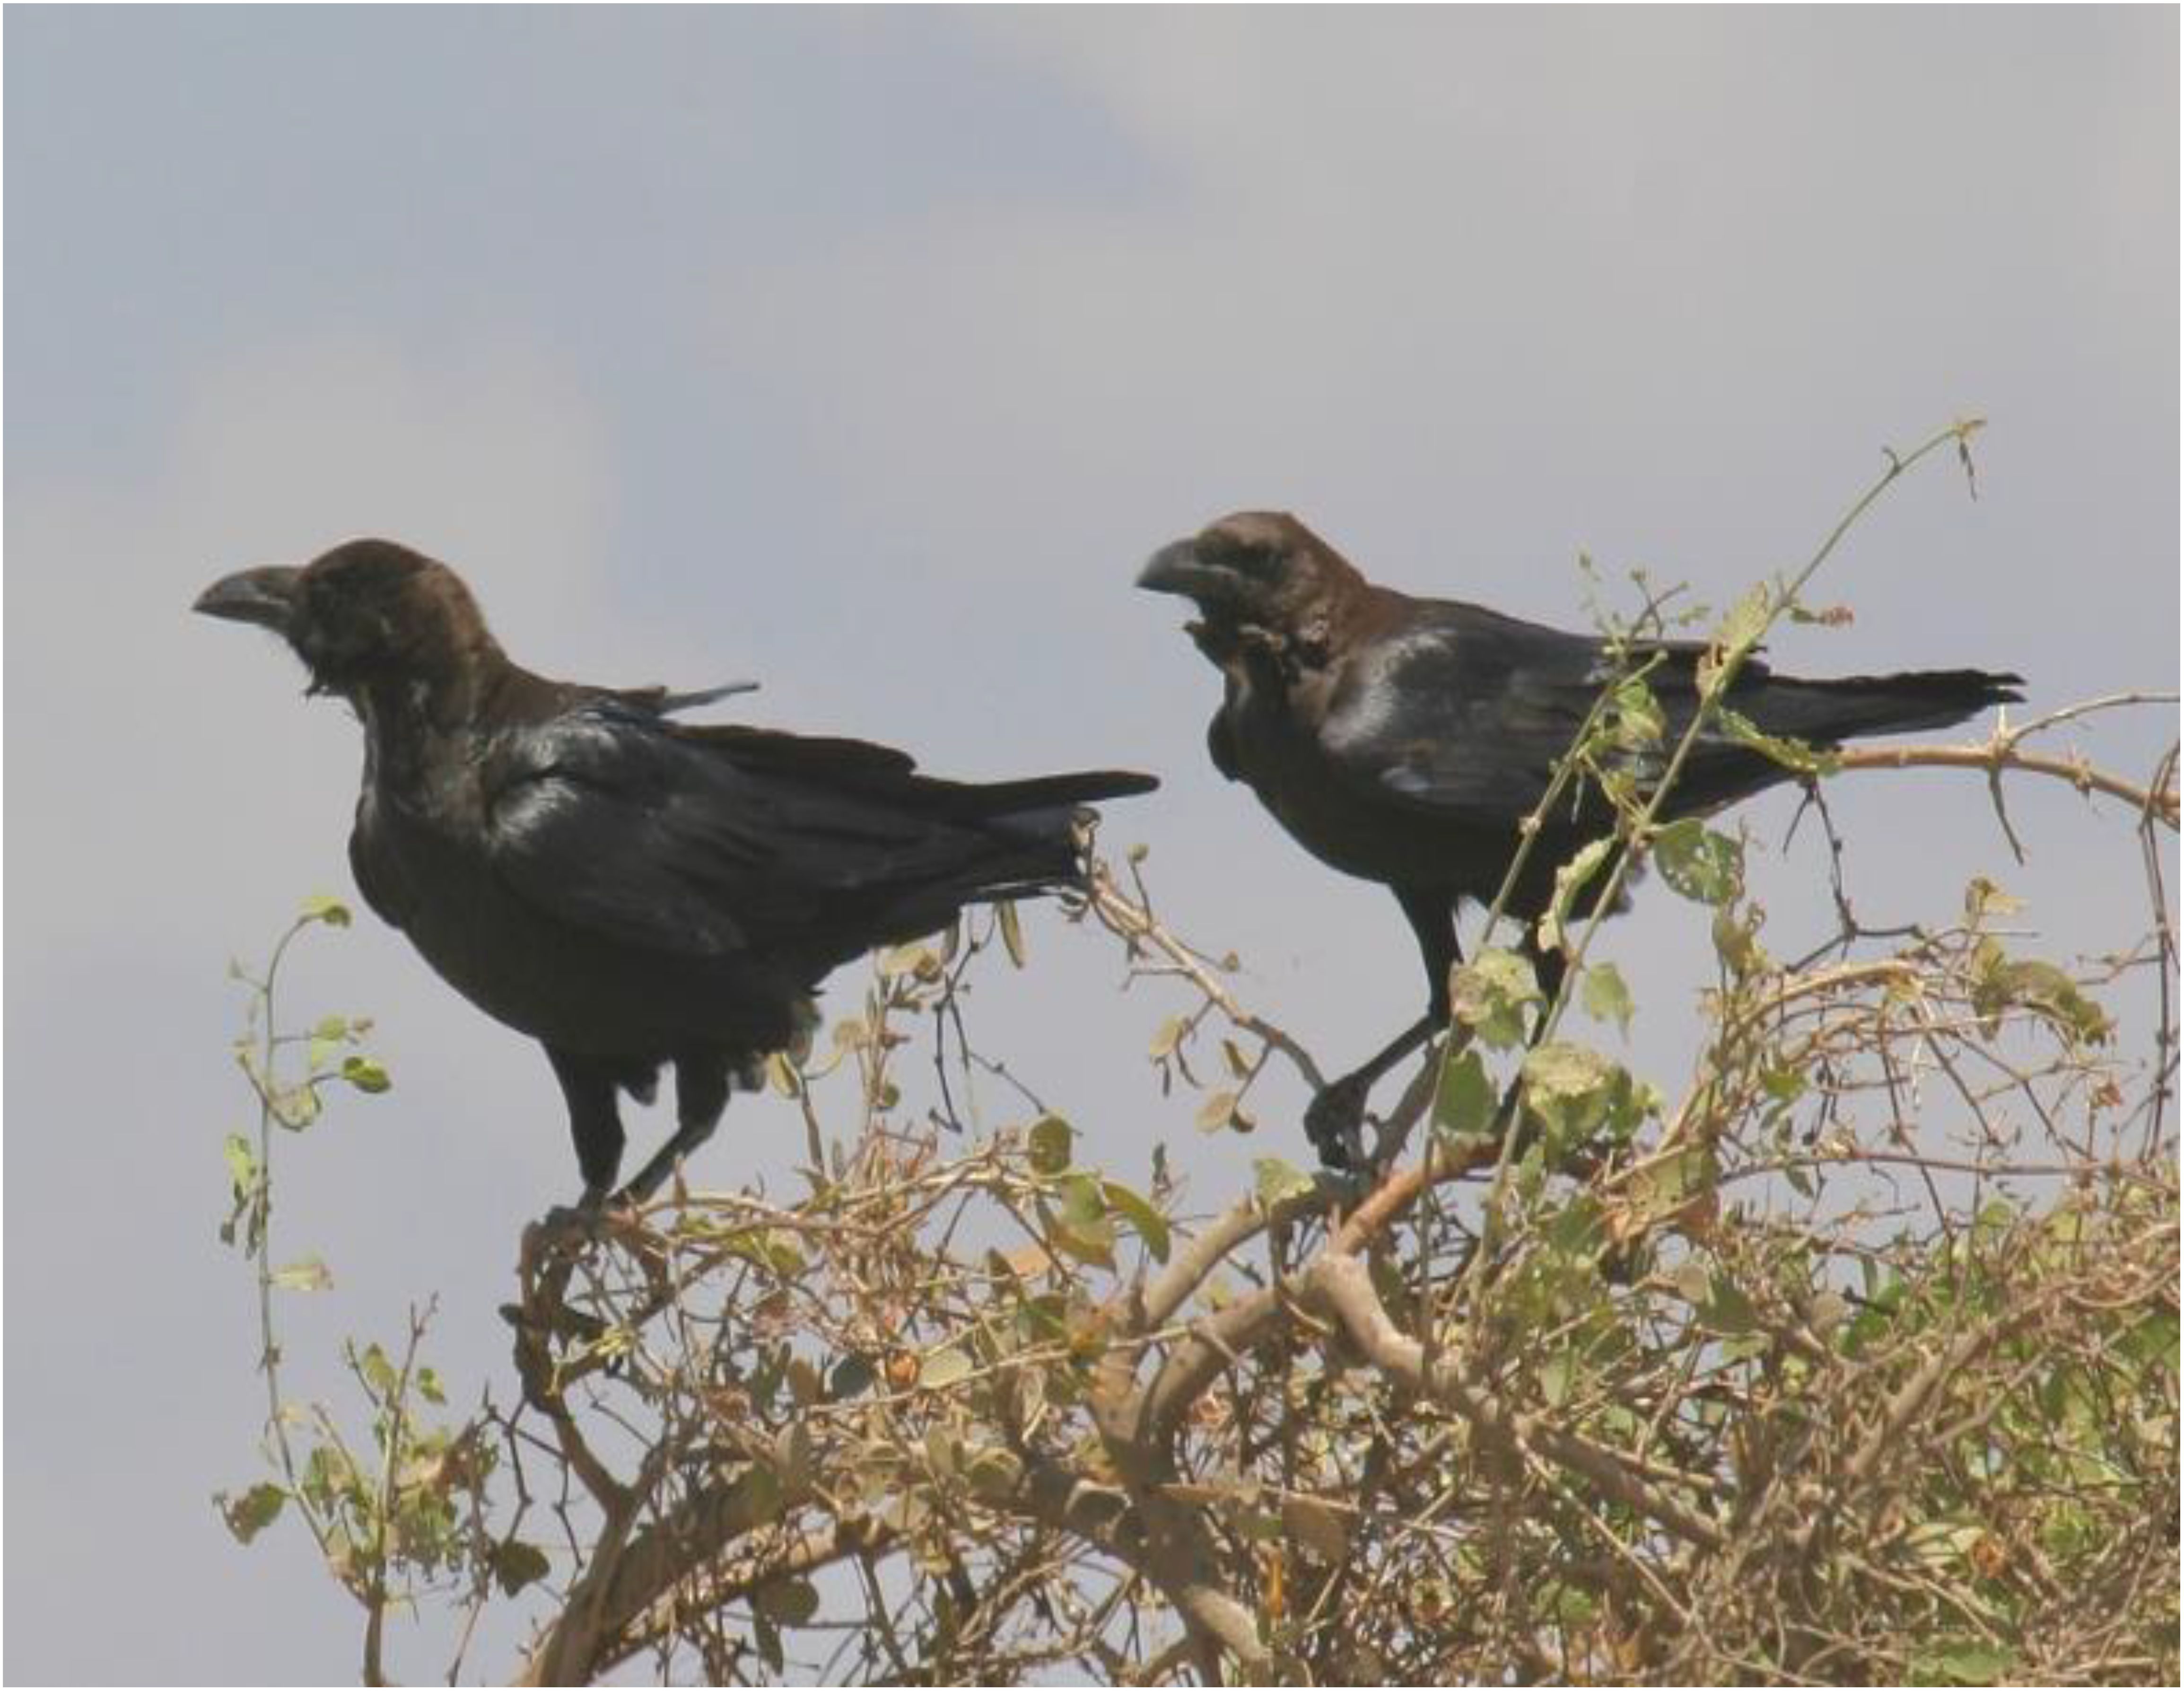
Figure 2. Somali Crow (C. edithae).
2.4.2 Spatial climatic covariates
The model incorporated various spatial explanatory factors that potentially influence the presence of C. edithae. These factors encompassed annual averages of temperature, precipitation, temperature extremes (minimum and maximum), solar radiation, and wind speed within the study area. These variables were selected based on their established or hypothesized ecological relevance for avian species, particularly C. edithae within the arid/semi-arid context of Somaliland. Mean annual temperature and precipitation are fundamental drivers influencing avian physiology, behavior, and resource availability across landscapes (Guisan and Thuiller, 2005). Minimum and maximum temperatures represent potential thermal stress factors that can limit distribution (Williams and Tieleman, 2005). Solar radiation is a critical factor for thermoregulation, especially in high-insolation environments and for dark-plumaged birds like the Somali crow, influencing activity patterns and microhabitat use (Ndimuligo et al., 2022; Ovaskainen et al., 2016; Wolf et al., 1996). Wind speed can affect flight energetics, foraging efficiency, and convective heat loss (Moraga, 2023; Ndimuligo et al., 2022; Qi et al., 2023). Together, these variables represent key climatic dimensions expected to shape the species’ distribution at the regional scale.
We obtained these variables from the WorldClim database version 2.1 utilizing the geodata package (Hijmans, 2024). Specifically, we employed the worldclim_country() function, inputting the country code “SO” for Somalia, the desired variable names (“tavg”, “prec”, “tmin”, “tmax”, “srad”, and “wind”), and a spatial resolution of 10 arc-minutes. This resolution was chosen as a pragmatic balance between capturing broad regional climatic patterns across Somaliland and maintaining computational feasibility for the complex log-Gaussian Cox process model fitting using INLA.
The worldclim_country() function generates a SpatRaster containing monthly mean temperature and precipitation data. To derive annual averages, we calculated the mean values across the SpatRaster, resulting in a single raster layer representing the yearly average for each environmental variable: mean temperature, precipitation, minimum and maximum temperatures, solar radiation, and wind speed as presented in Supplementary Material File B.
The aggregation of monthly data into annual values are presented in (Figures 3–5).
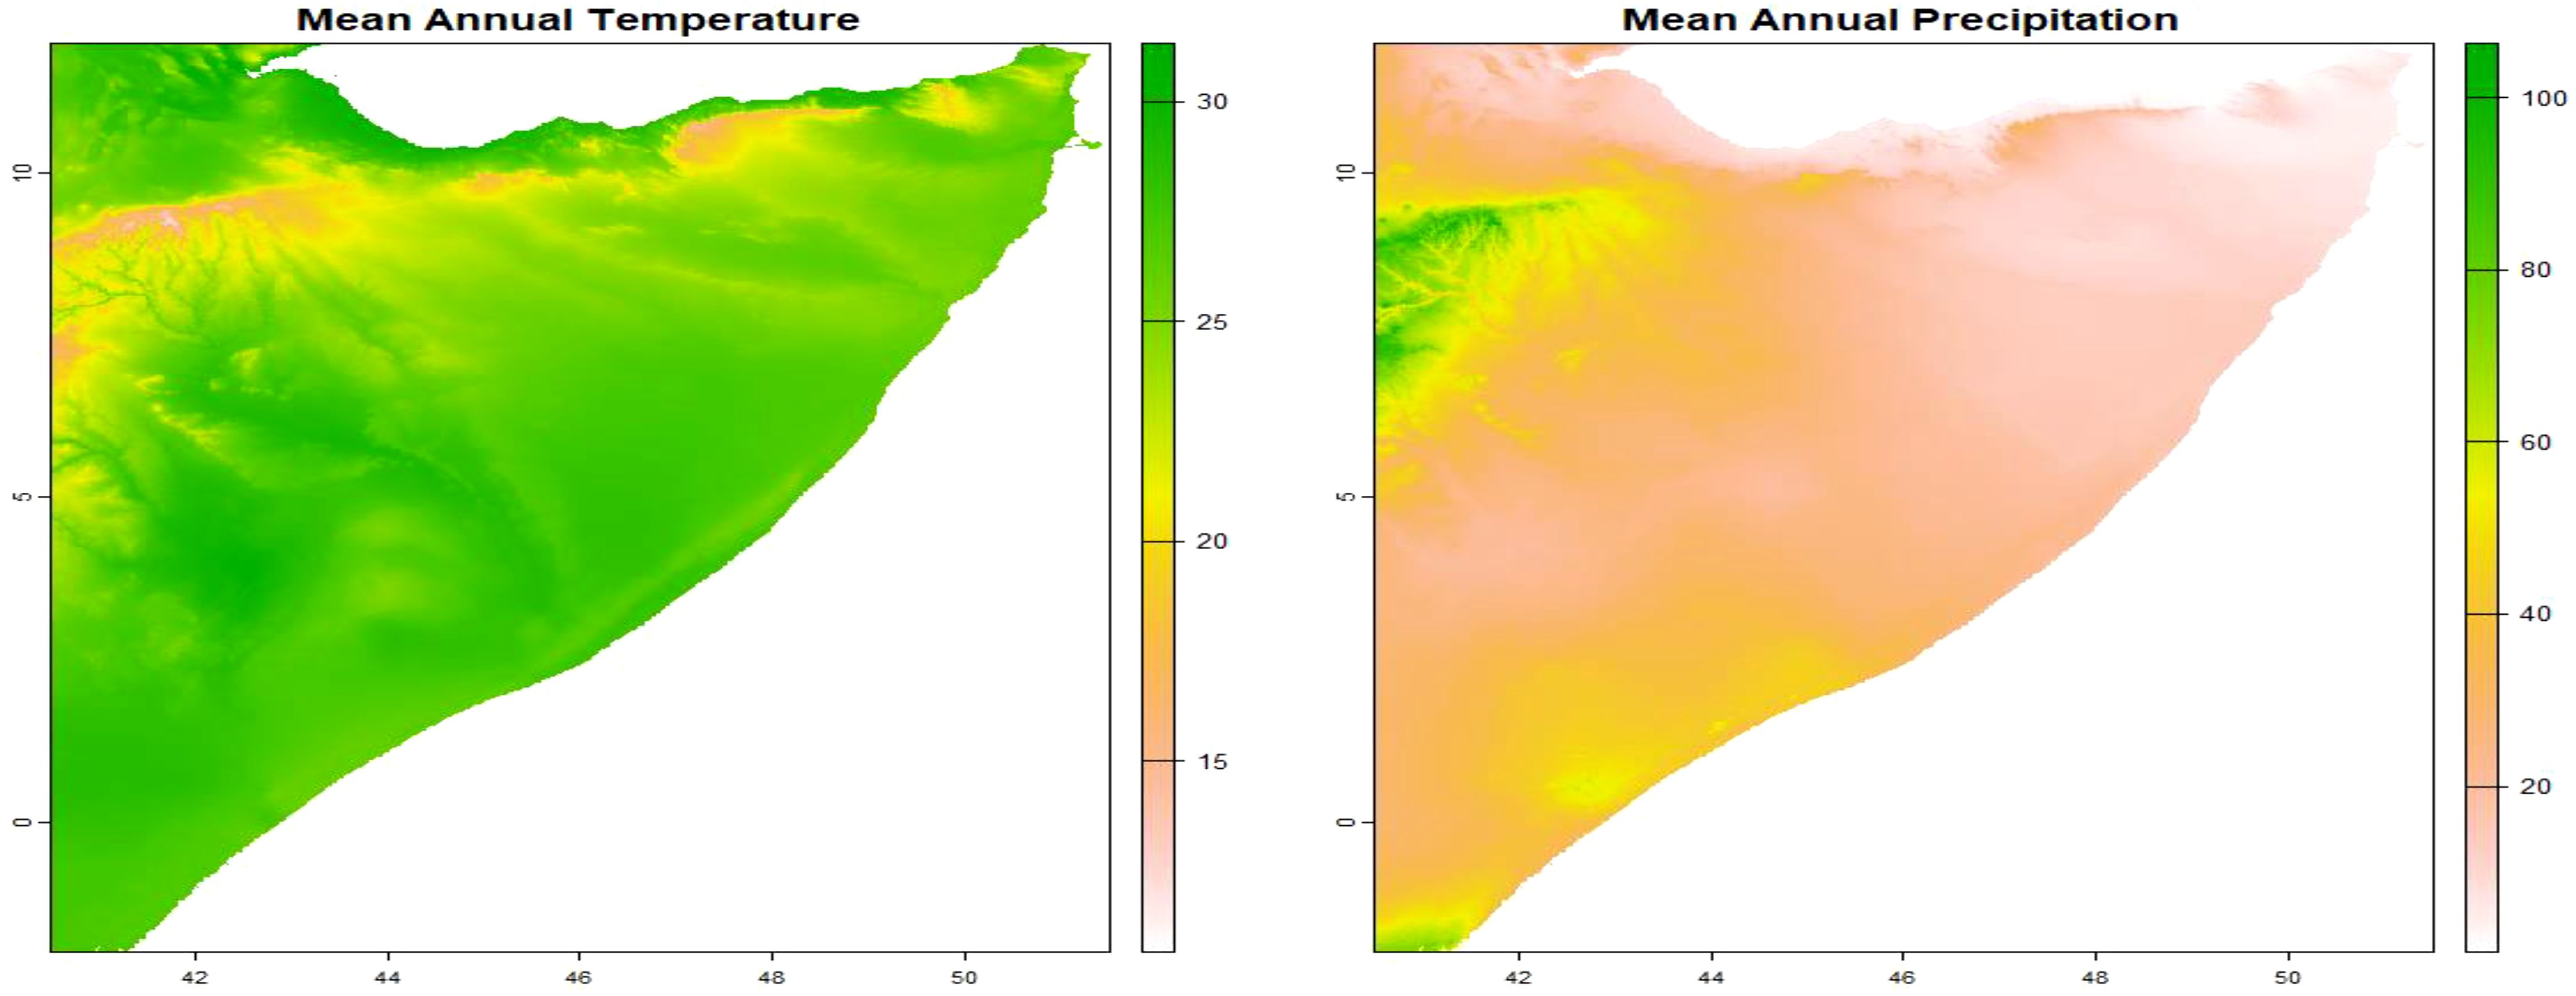
Figure 3. Mean annual temperature and precipitation covariates.
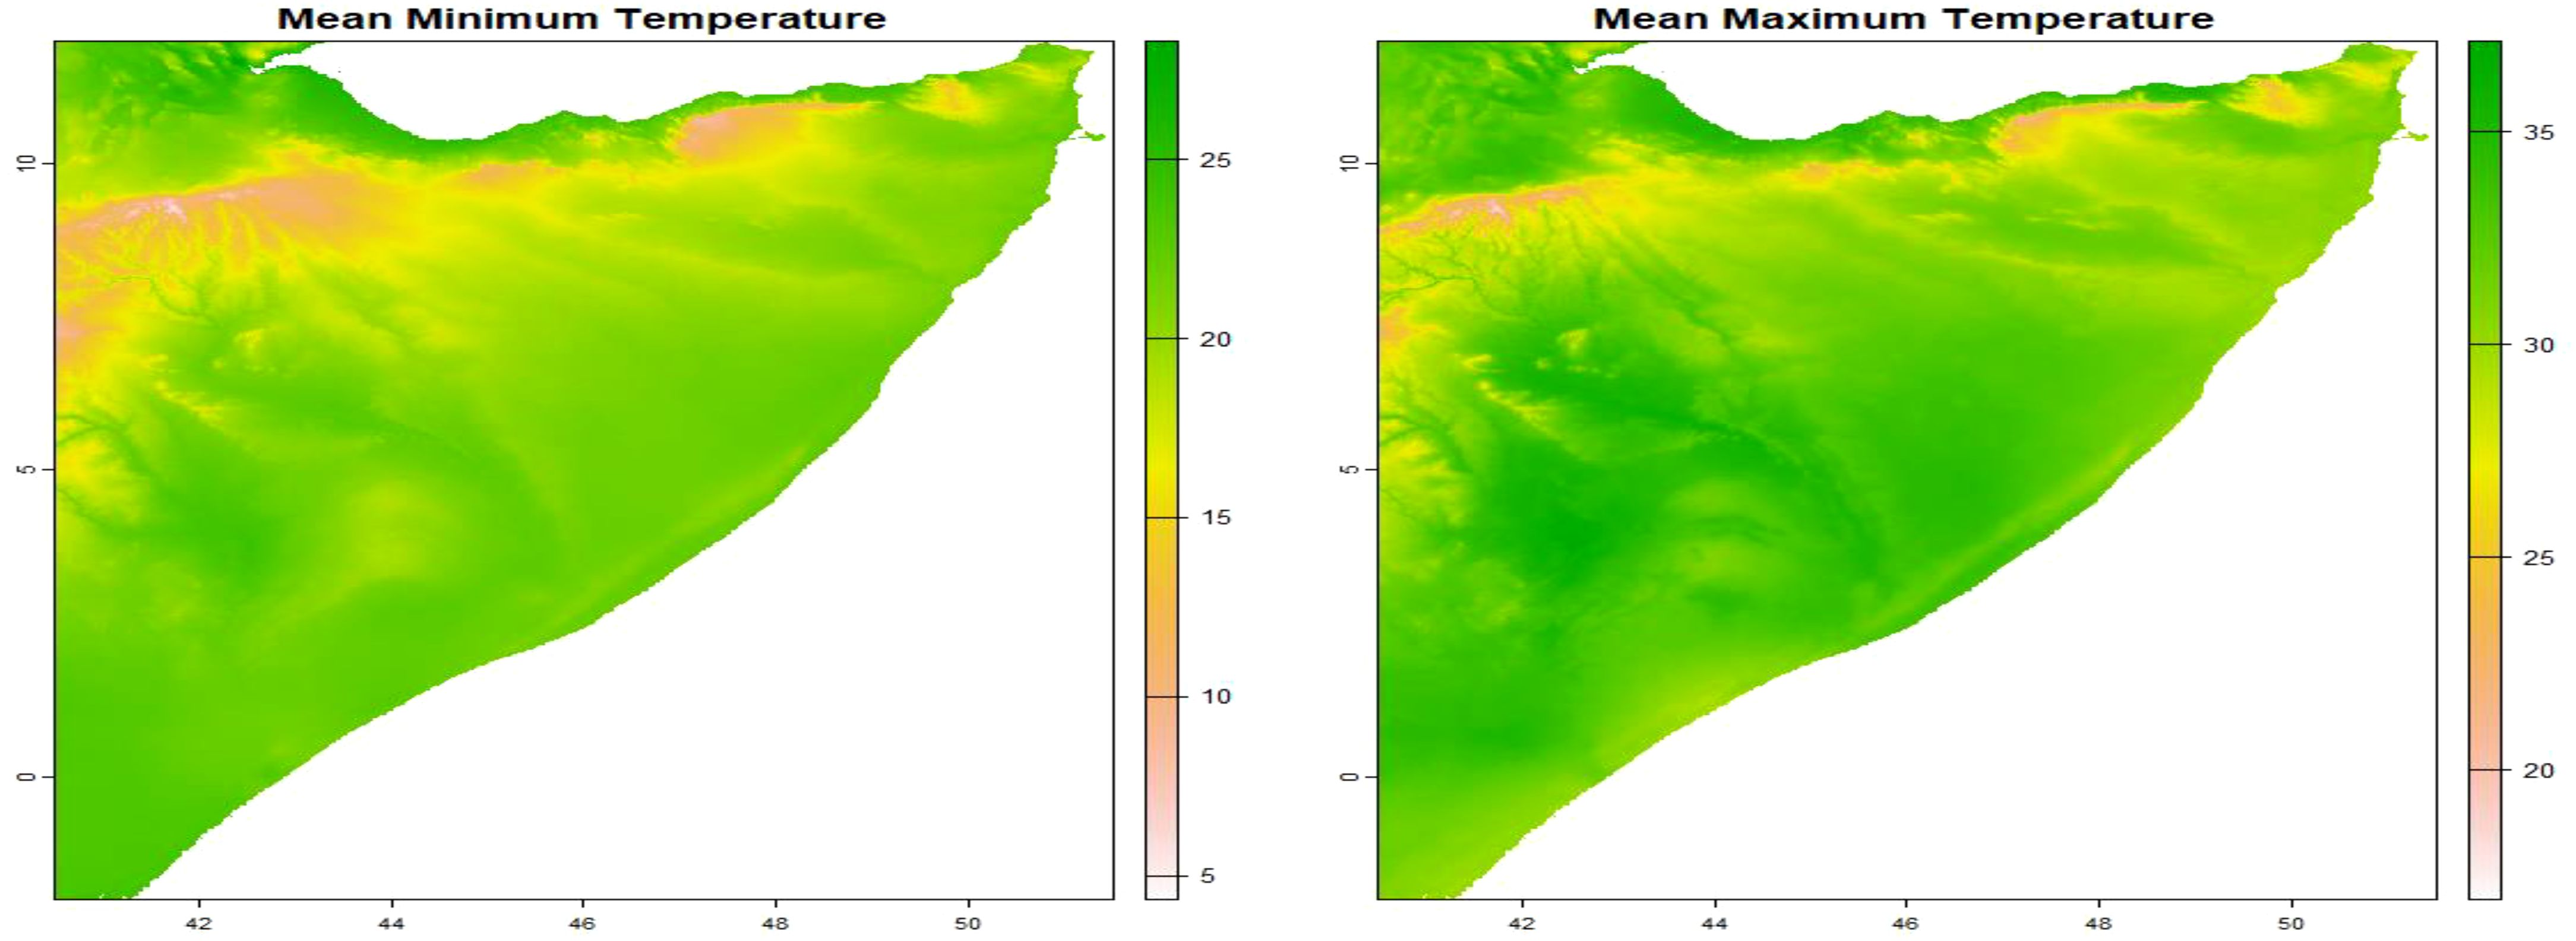
Figure 4. Mean annual minimum and maximum temperature covariates.
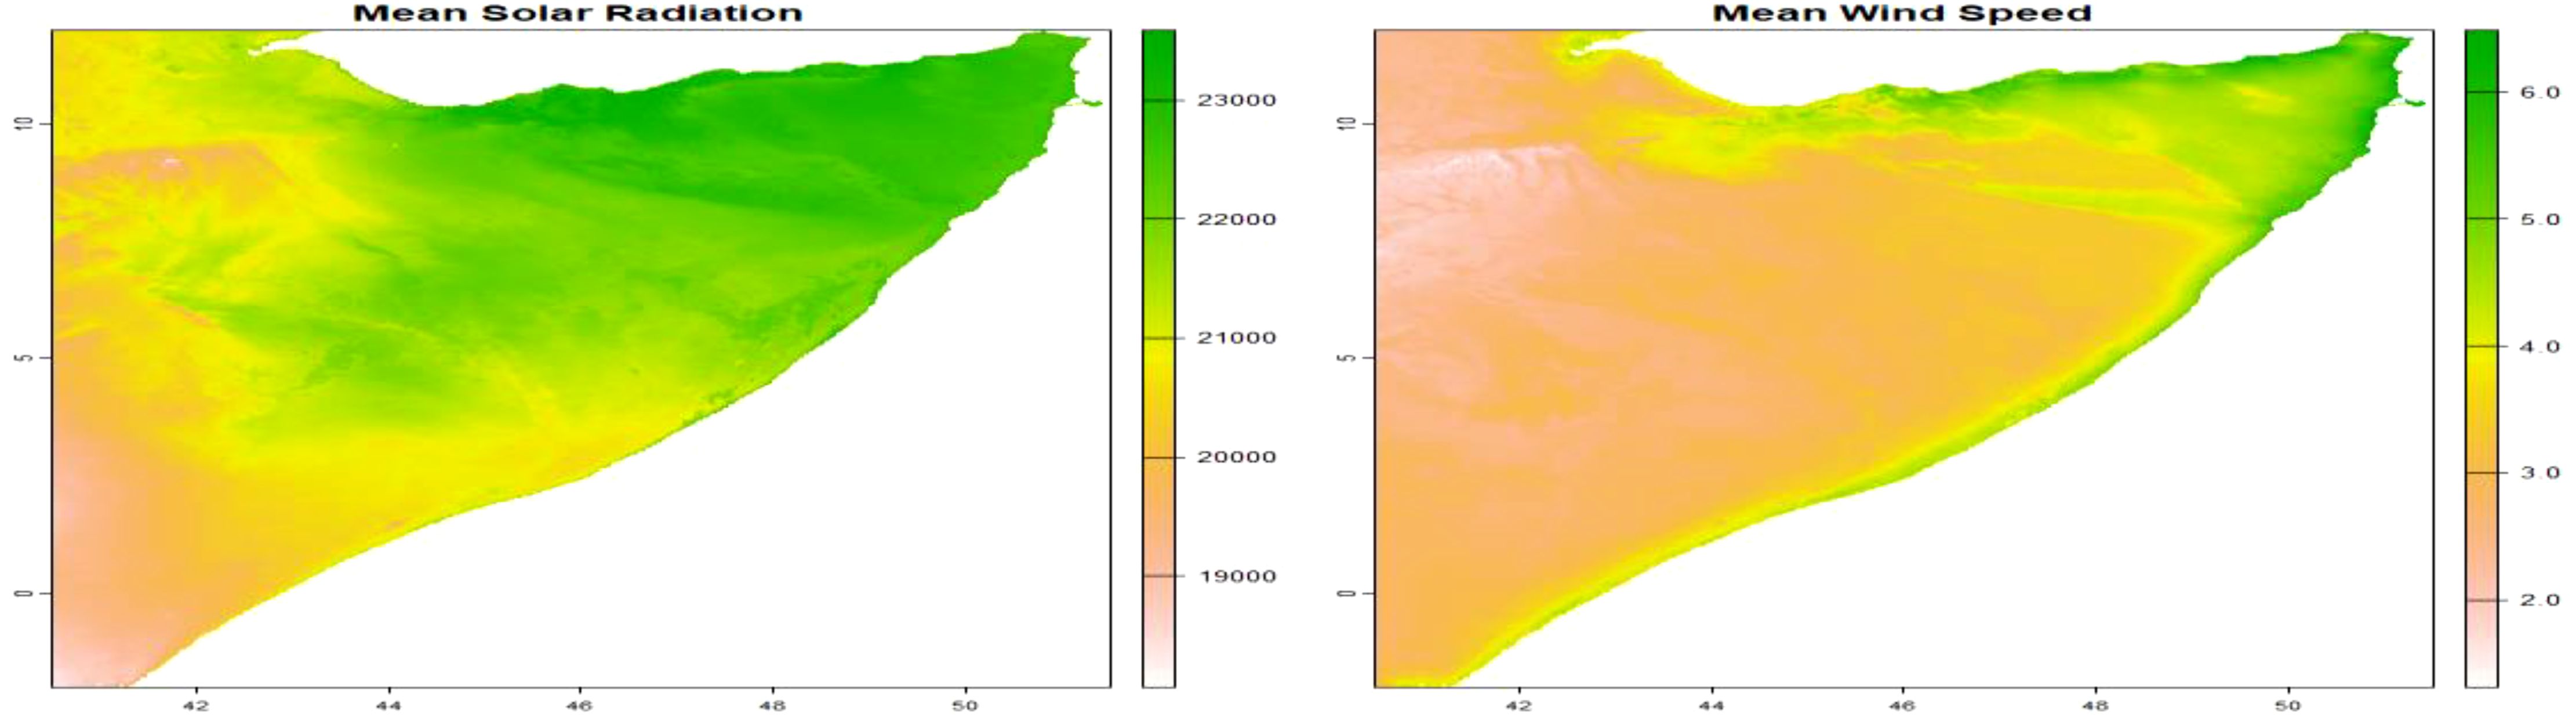
Figure 5. Annual solar radiation and wind speed covariates.
2.5 Implementing and fitting the spatial point process model
2.5.1 Log-gaussian cox process model
We assume the spatial point pattern of C. edithae locations in Somaliland, denoted as , was generated as a realization of a log-Gaussian Cox process with intensity given by . This model can be fitted by approximating it with a latent Gaussian model using a gridding approach (Illian et al., 2008). First, we discretized the study region into a grid with cells , where and . In the log-Gaussian Cox process, the mean number of events in cell is given by the integral of the intensity over the cell, . This integral can be approximated by , where is the area of cell . Then, conditional on the latent field , the observed number of locations in grid cell , , are independent and Poisson distributed as follows:
The posterior distribution of given the observed data is described using Bayes’ theorem:
where is the likelihood function (Poisson distribution) and is the prior distribution for the latent field. In our example, we modeled the log-intensity of the Poisson process as:
These equations (Equations 1–3) form the core of our log-Gaussian Cox process model.
Where:
● is the intercept.
● , , , , , and represent the mean annual temperature, mean annual precipitation, minimum temperature, maximum temperature, solar radiation, and wind speed at cell , respectively, and , , , , , and are their corresponding coefficients.
● is a spatially structured random effect reflecting unexplained variability that can be specified as a second-order two-dimensional CAR-model on a regular lattice.
● is an unstructured random effect reflecting independent variability in cell .
The prior distributions for the fixed effects (, , , , , , and ) are typically assumed to be Gaussian with a mean of 0 and a large variance, expressing our lack of prior knowledge (Al-Aziz et al., 2022; Muse et al., 2025; Muse et al., 2022a, b, c). The prior for the structured spatial random effect is a conditional autoregressive (CAR) model, which assumes that the value at a location is dependent on the values at neighboring locations. The prior for the unstructured random effect is typically a Gaussian distribution with a mean of 0 and a variance that is estimated from the data.
This segment delineates the fundamental aspects of our modeling strategy. We employ a log-Gaussian Cox process model to analyze the frequency of C. edithae sightings as a function of environmental factors and random effects. The Poisson distribution is appropriate for analyzing count data, while the log-link function ensures non-negative intensity predictions. By incorporating both structured and unstructured random effects, we address spatial autocorrelation and unexplained variation, respectively. This approach enables us to account for various factors influencing the distribution of C. edithae in the study area.
2.5.2 Computational grid
To fit the model, we created a regular grid that covered the region of Somaliland as presented in Figure 6. First, we obtained a map of Somaliland using the ne_countries() function from the rnaturalearth package (South, 2017). We set type = “countries”, country = “Somaliland”, and scale = “medium” for the map (Figure 6).
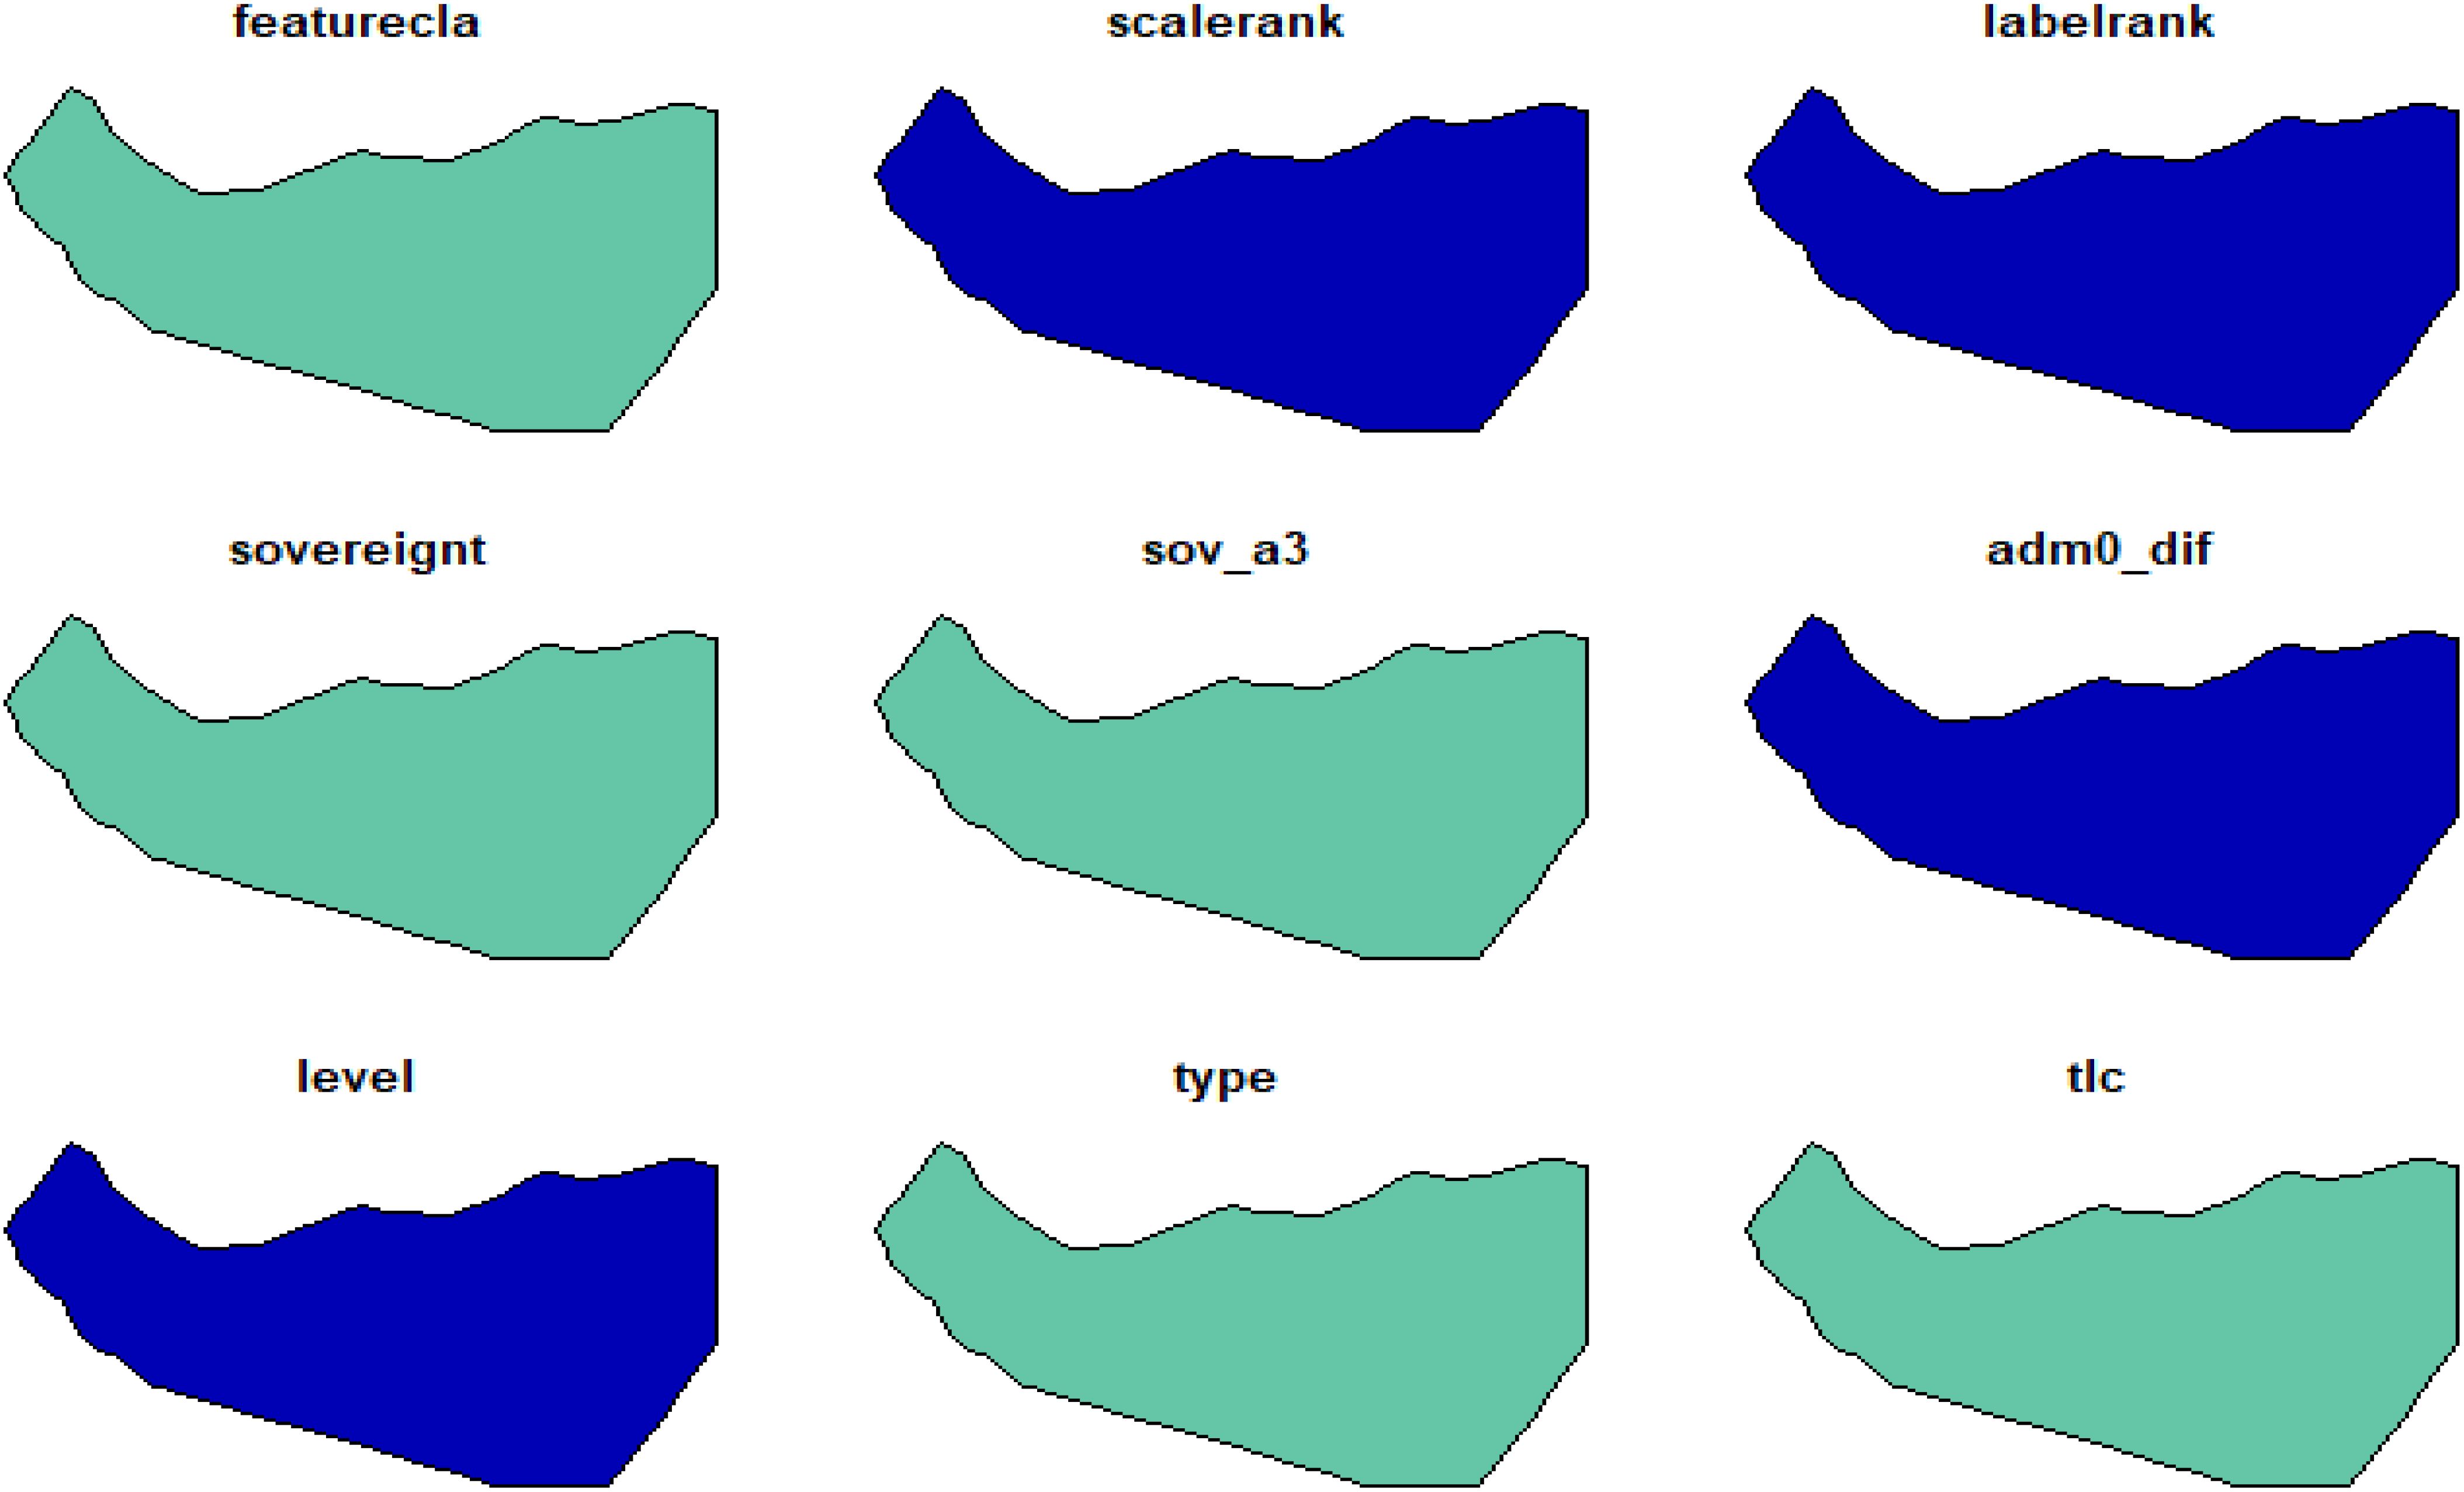
Figure 6. Regular grid map for the study area.
Then, we created a raster that covered Somaliland using terra::rast(), providing the map of Somaliland and setting resolution = 0.1 to create cells with a size of 0.1 decimal degrees.
We initially set the values of all the raster cells to 0 using r[]<- 0. Then, we used cellFromXY() to obtain the number of C. edithae occurrences in each cell (Figures 7, 8) and assigned these counts to the corresponding cells in the raster.
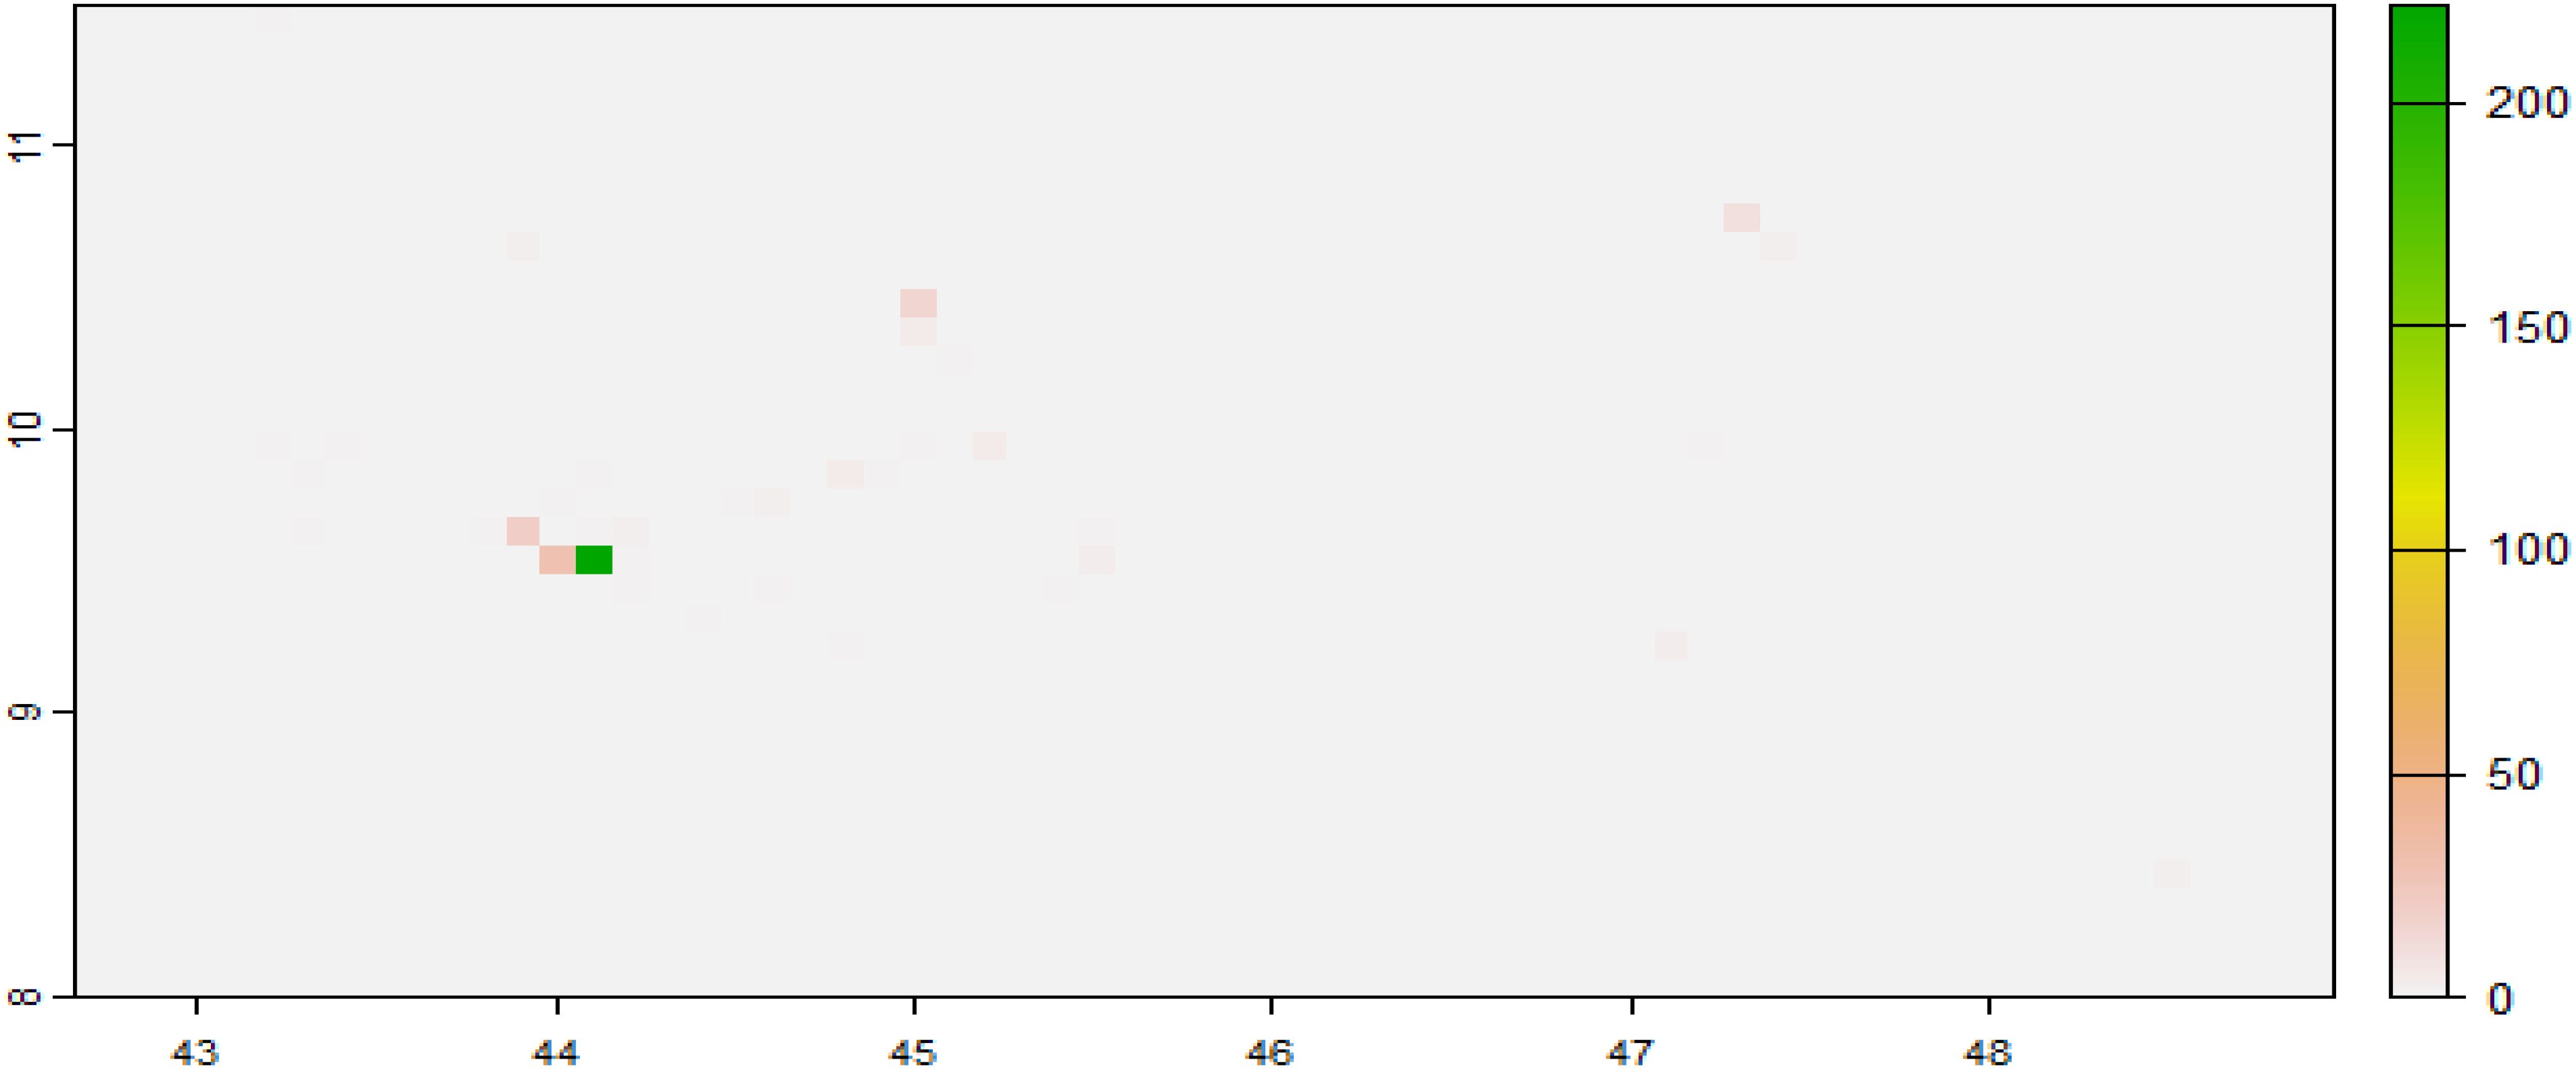
Figure 7. Mapping for the number of C. edithae occurrences in each cell.
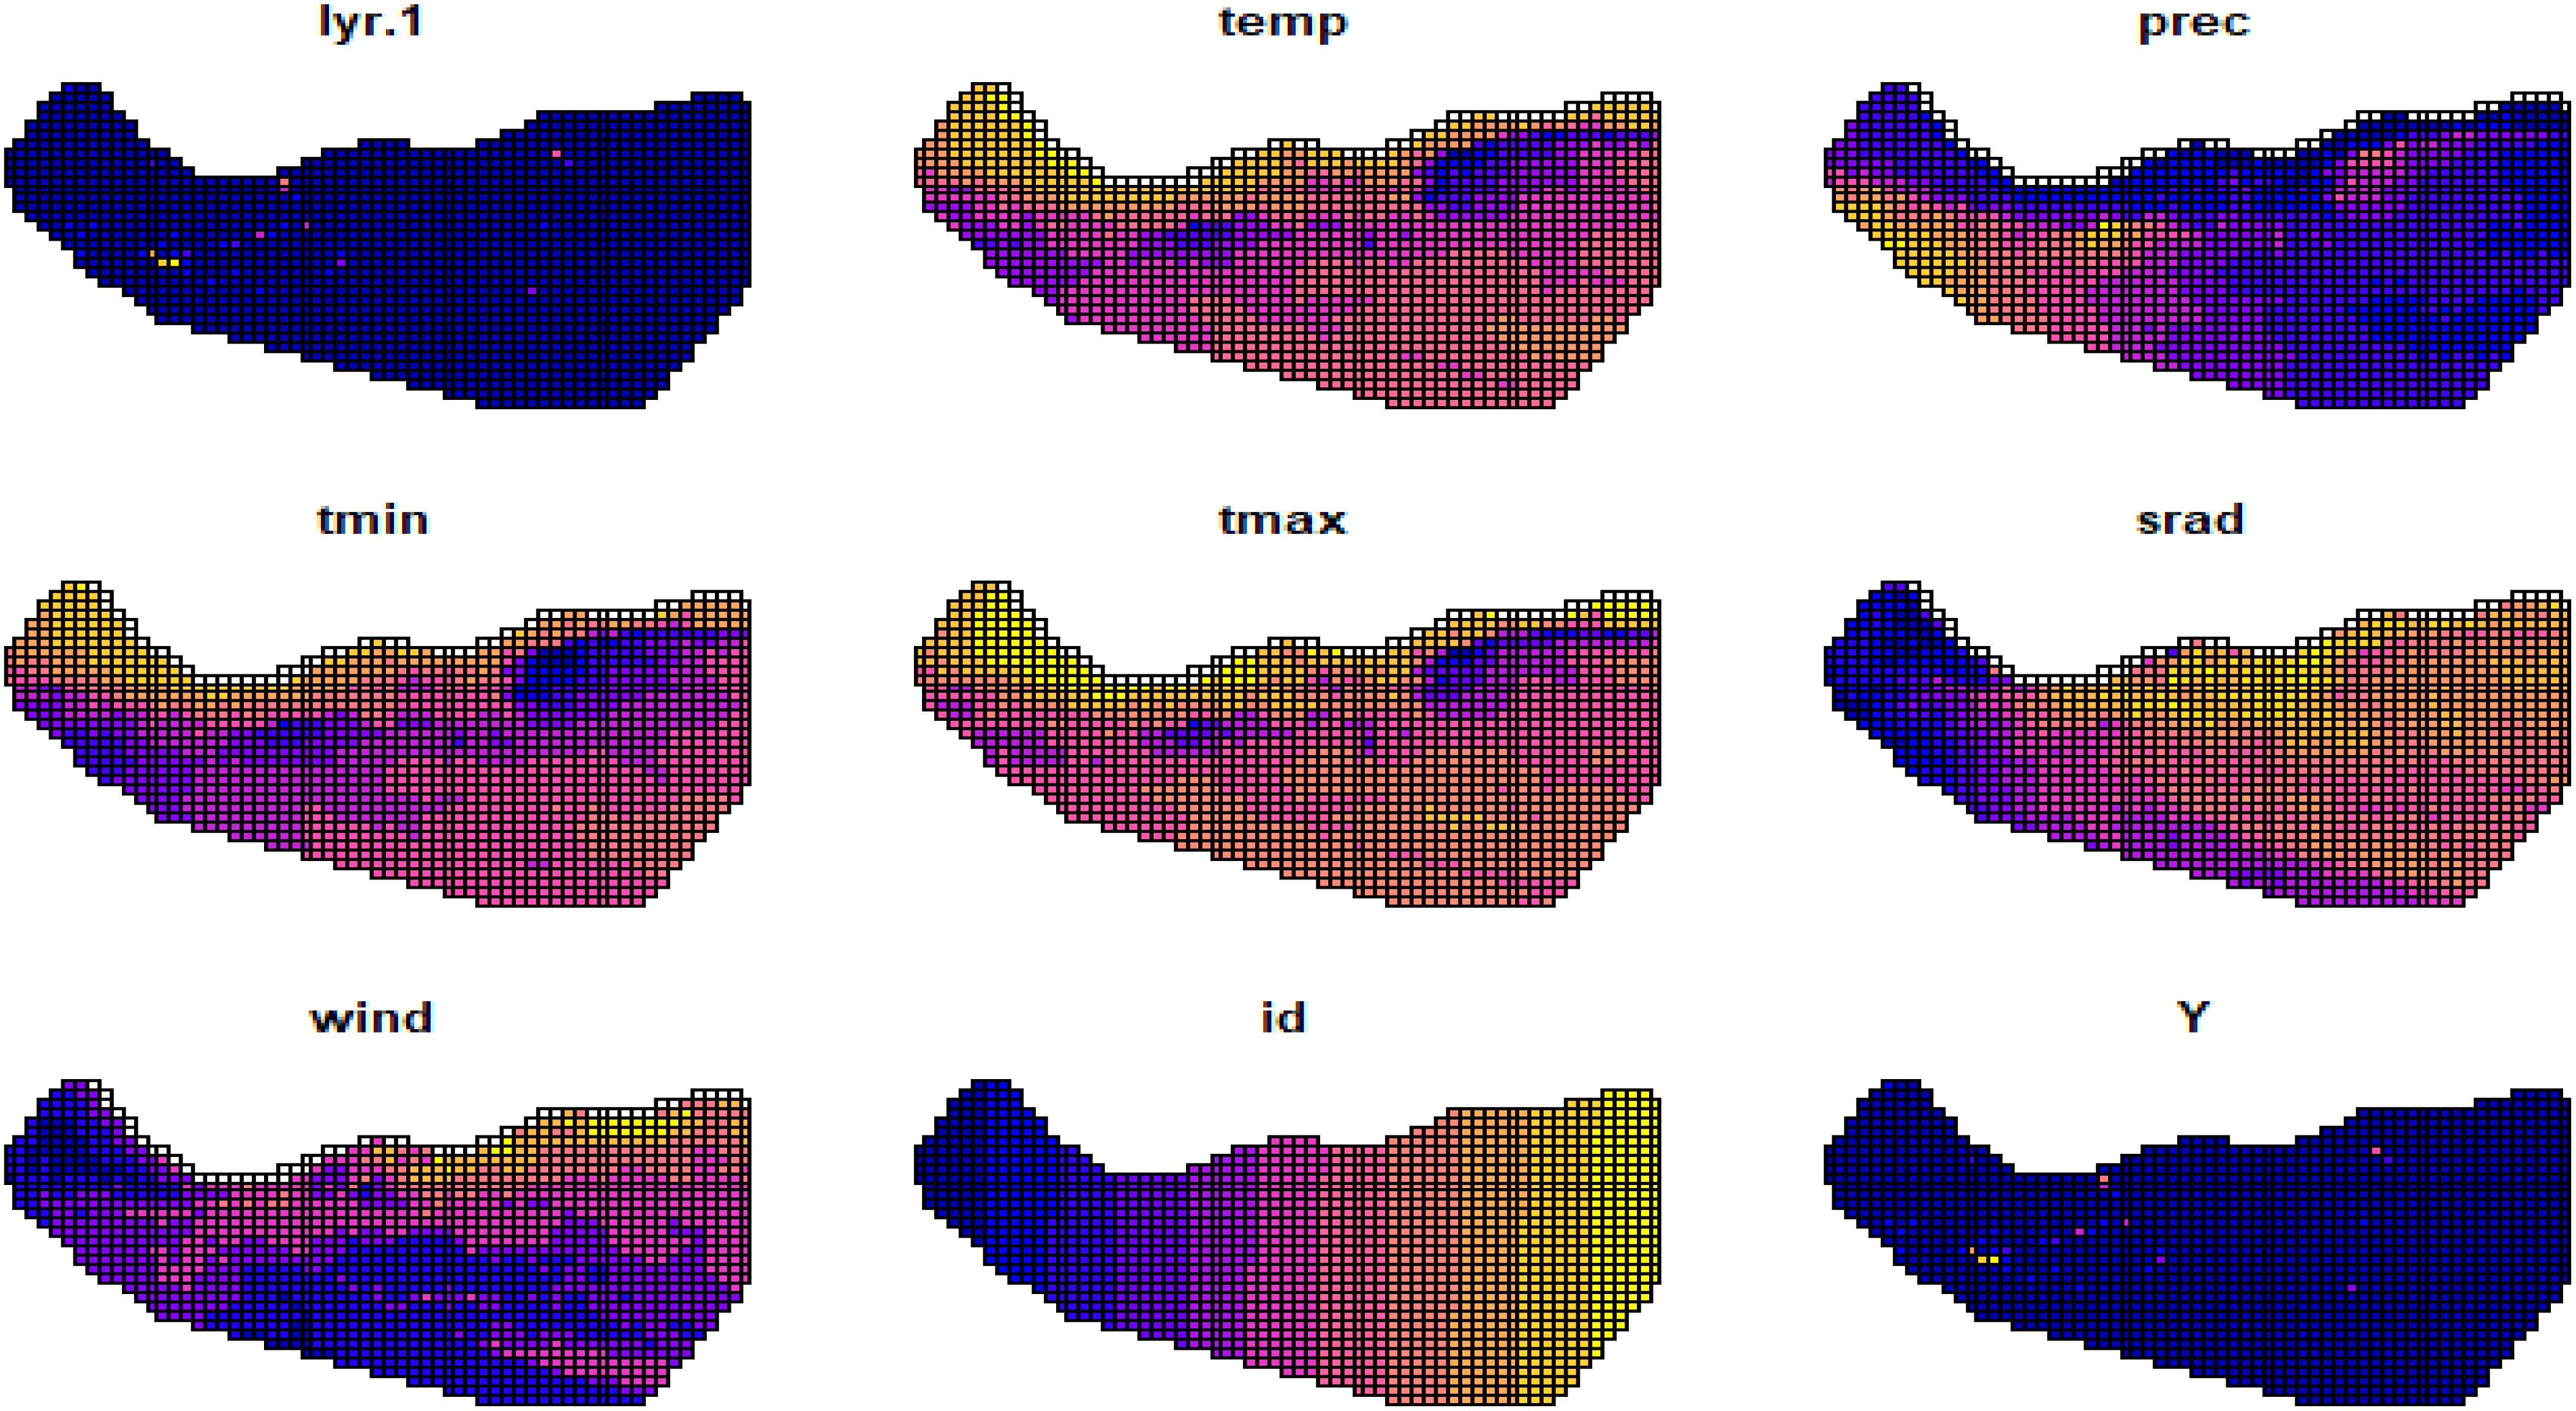
Figure 8. Spatial data for the occurrence datasets.
We converted the raster r to an sf object called grid using terra::as.polygons() with aggregate = FALSE, and then sf::st_as_sf(). This grid will be used to fit the model with the R-INLA package. Finally, we added variables temp, prec, tmin, tmax, and vapr with the corresponding covariate values in each cell using the extract() function of terra. This step creates the spatial framework for our analysis. The regular grid allows us to discretize the study area and approximate the continuous spatial process with a discrete representation. The resolution of 0.1 decimal degrees provides a balance between spatial detail and computational feasibility.
2.5.3 Data preparation
We prepared the data in the sf object grid for modeling in R-INLA. Since the spatial model in R-INLA assumes data are sorted by columns, we transposed grid. We added the following variables:
● id: The cell identifier.
● Y: The number of C. edithae occurrences.
● cellarea: The area of each cell.
We deleted cells of grid that fell outside Somaliland using sf::st_intersection() to identify cells within the map, and then subsetted the grid object (Figure 8).
A summary of the prepared data is shown in Table 2.
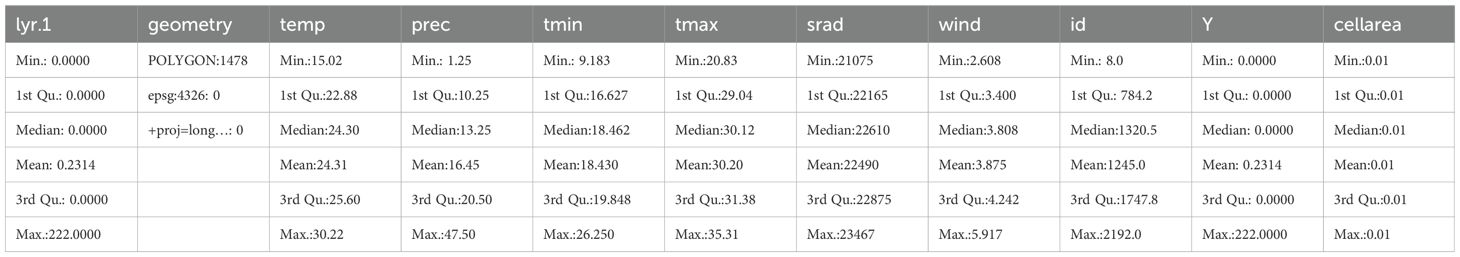
Table 2. Summary of prepared grid data.
We observed that the covariates had some missing values, which we imputed with the mean of the non-missing values as shown in Table 2. Figure 9 displays maps of outcome variable (Y), temp, prec, tmin, tmax, srad, and vapr, using tm_facets(ncol = 2) to display the maps side-by-side and tm_legend() to display legends.
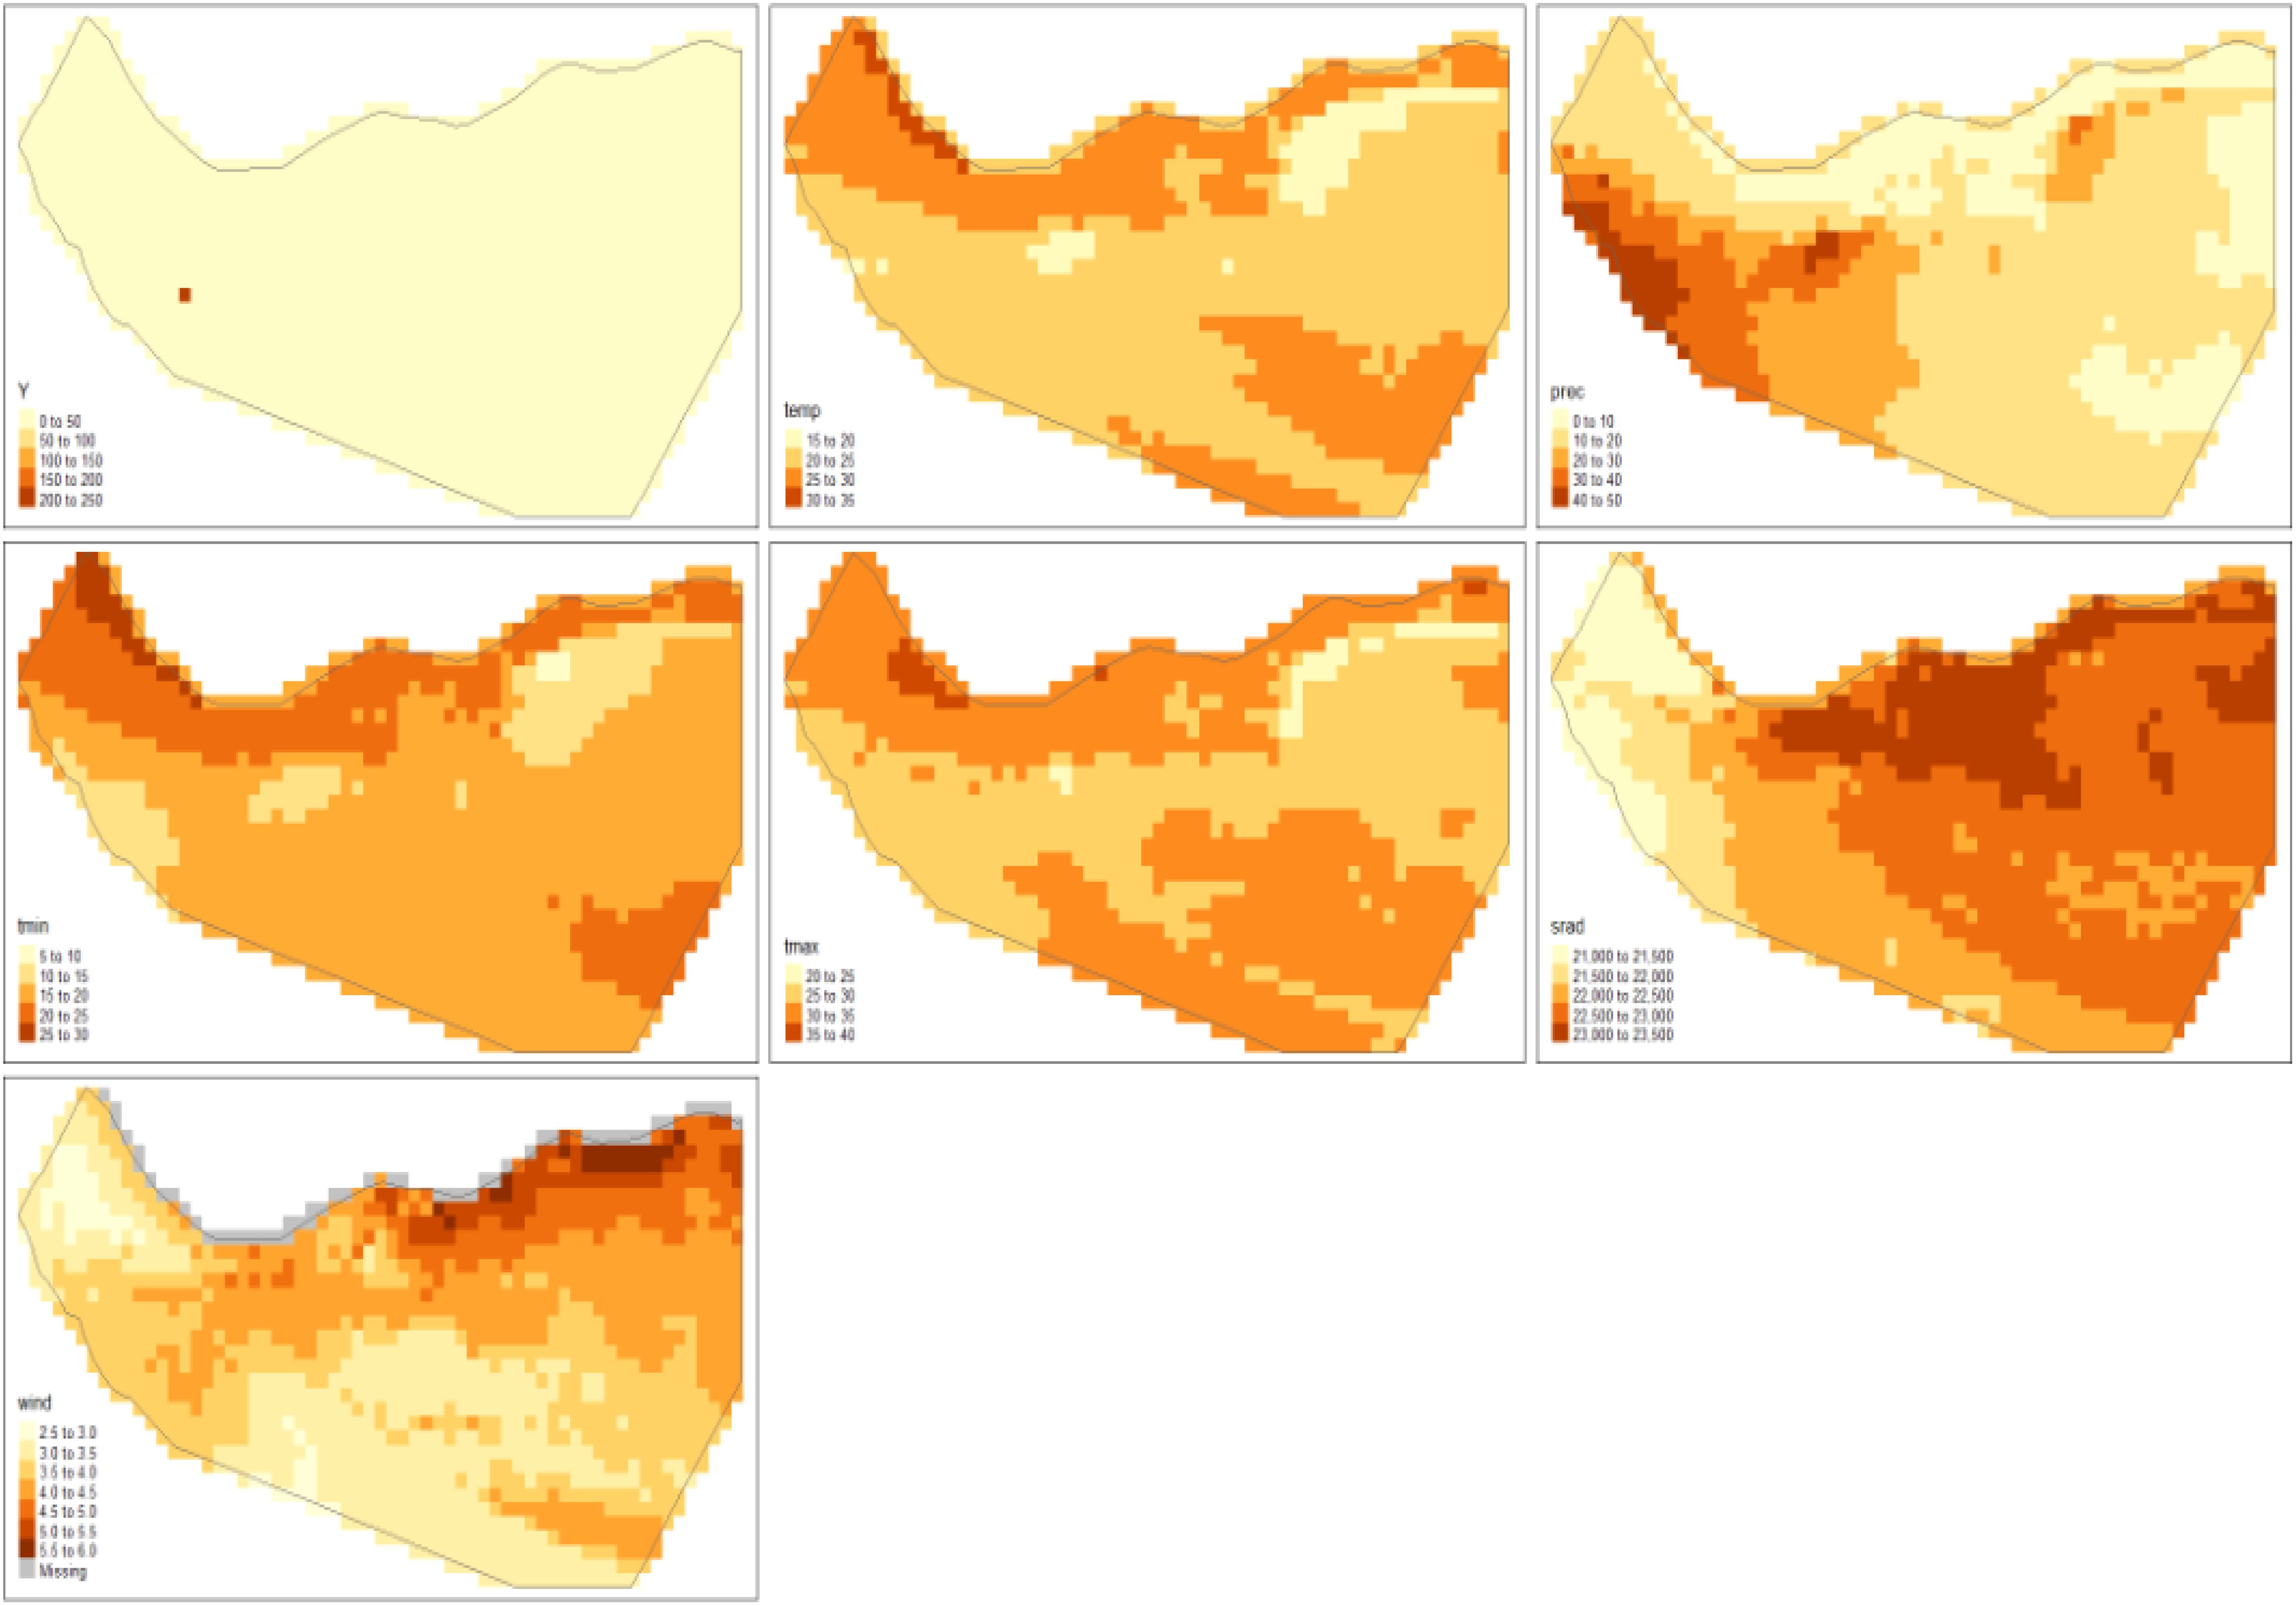
Figure 9. Maps of response and covariate data.
This step prepares the data for analysis in R-INLA. Transposing the grid ensures that the data is in the correct format for the spatial model. Adding the cell identifier, number of occurrences, and cell area provides the necessary information for the model. Removing cells outside of Somaliland ensures that the analysis is focused on the study area.
2.6 Model assumptions
The log-Gaussian Cox process model relies on several assumptions:
● Poisson Distribution: The number of events in each grid cell follows a Poisson distribution, conditional on the latent field.
● Independence: The number of events in different grid cells are independent, conditional on the latent field.
● Gaussian Process: The latent field is assumed to be a Gaussian process, allowing for spatial autocorrelation.
● Linearity: The relationship between the log-intensity and the covariates is assumed to be linear.
● Stationarity: The spatial structure of the random effects is assumed to be stationary, meaning that the spatial dependence is the same across the study area.
These assumptions are important to consider when interpreting the results of the model. The Poisson distribution is appropriate for count data, and the Gaussian process allows for spatial autocorrelation. The linearity assumption is a simplification, and the stationarity assumption may not hold in all cases.
2.7 Fitting the Model Using INLA
We fitted the log-Gaussian Cox process model using the R-INLA package. This package implements the integrated nested Laplace approximation (INLA) for Bayesian inference in latent Gaussian models (Rue et al., 2009; Moraga, 2019). The R-INLA package is not available on CRAN because it uses external C libraries. Installation requires specifying the URL of the R-INLA repository.
To fit the model using INLA, we specified a formula that included the linear predictor, and then called the inla() function, providing the formula, family, data, and other options. The formula is written with the outcome variable, then the ~ symbol, followed by fixed and random effects separated by + symbols. By default, the formula includes an intercept. The outcome variable is Y, and the covariates are temp, prec, tmin, tmax, srad, and wind.
The random effects are specified using the f() function, which takes an index vector specifying which elements of the random effect apply to each observation, along with the model name and other options. We used grid$id for the spatially structured effect and created an index vector grid$id2 (with the same values as grid$id) for the unstructured random effect.
The spatial structure was modeled using a second-order random walk model (rw2d) with index vector id, and the unstructured random effect was modeled with an independent and identically distributed effect (iid) with index vector id2.
Finally, we called inla() with the formula, family “poisson,” the prepared data in the grid, and added E = cellarea to denote that the expected values in each cell are in the cellarea variable of the data. We also included control.predictor = list(compute = TRUE) to calculate the marginal densities for the linear predictor.
This section describes the implementation of the model using R-INLA. The use of INLA allows for efficient Bayesian inference in complex spatial models. The formula specifies the relationship between the outcome variable and the covariates and random effects. The control.predictor argument is used to calculate the marginal densities for the linear predictor, which are used for prediction. All analyses were conducted using R version 4.5.0 and the codes for the analysis are available Supplementary File S1 (R Core Team, 2024).
3 Results
3.1 Model summary
Utilizing the R-INLA package to model the log-Gaussian Cox process yielded comprehensive insights into how C. edithae is spatially distributed across Somaliland. The analysis produced posterior estimates for crucial model components, including fixed effects representing climatic covariates and random effects capturing spatial structure and heterogeneity.
The fixed effects component of the model explored the potential association between C. edithae occurrence intensity and the selected climatic variables (Table 3). The posterior mean estimates suggested potential positive trends with mean annual temperature (β = 5.74), mean annual precipitation (β = 0.06), and wind speed (β = 0.18), while suggesting potential negative trends with minimum temperature (β = -2.93), maximum temperature (β = -2.95), and solar radiation (β = -0.001). However, a critical finding is the substantial uncertainty associated with these estimates. As shown by the wide 95% credible intervals which all encompass zero (Table 3), the model does not provide strong evidence to conclude that these specific broad-scale climatic variables have a non-zero effect on occurrence intensity at the scale analyzed. The model’s intercept (β ≈ 19.91) indicates the baseline log-intensity, though interpretation requires caution given covariate centering.
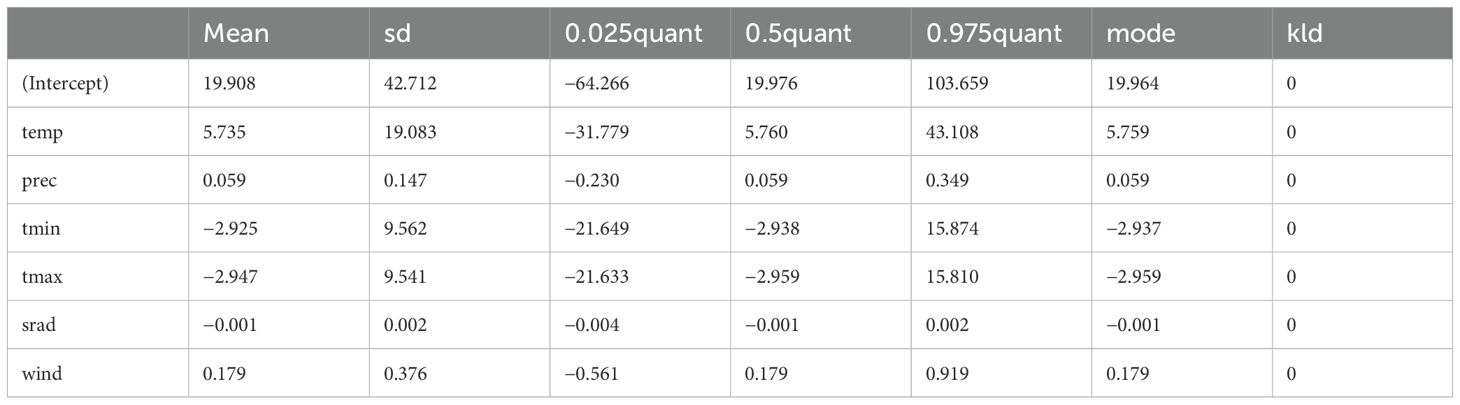
Table 3. Summary of posterior distributions for fixed effects in the log-gaussian cox process model predicting somali crow (C. edithae) occurrence.
The posterior distributions for the fixed effect coefficients, visualized in Figure 10, graphically confirm this uncertainty. While the distributions are centered near the mean estimates reported in Table 3, they are broad, and the 95% credible intervals (implicitly represented by the distribution’s spread) clearly overlap zero for all climatic covariates.
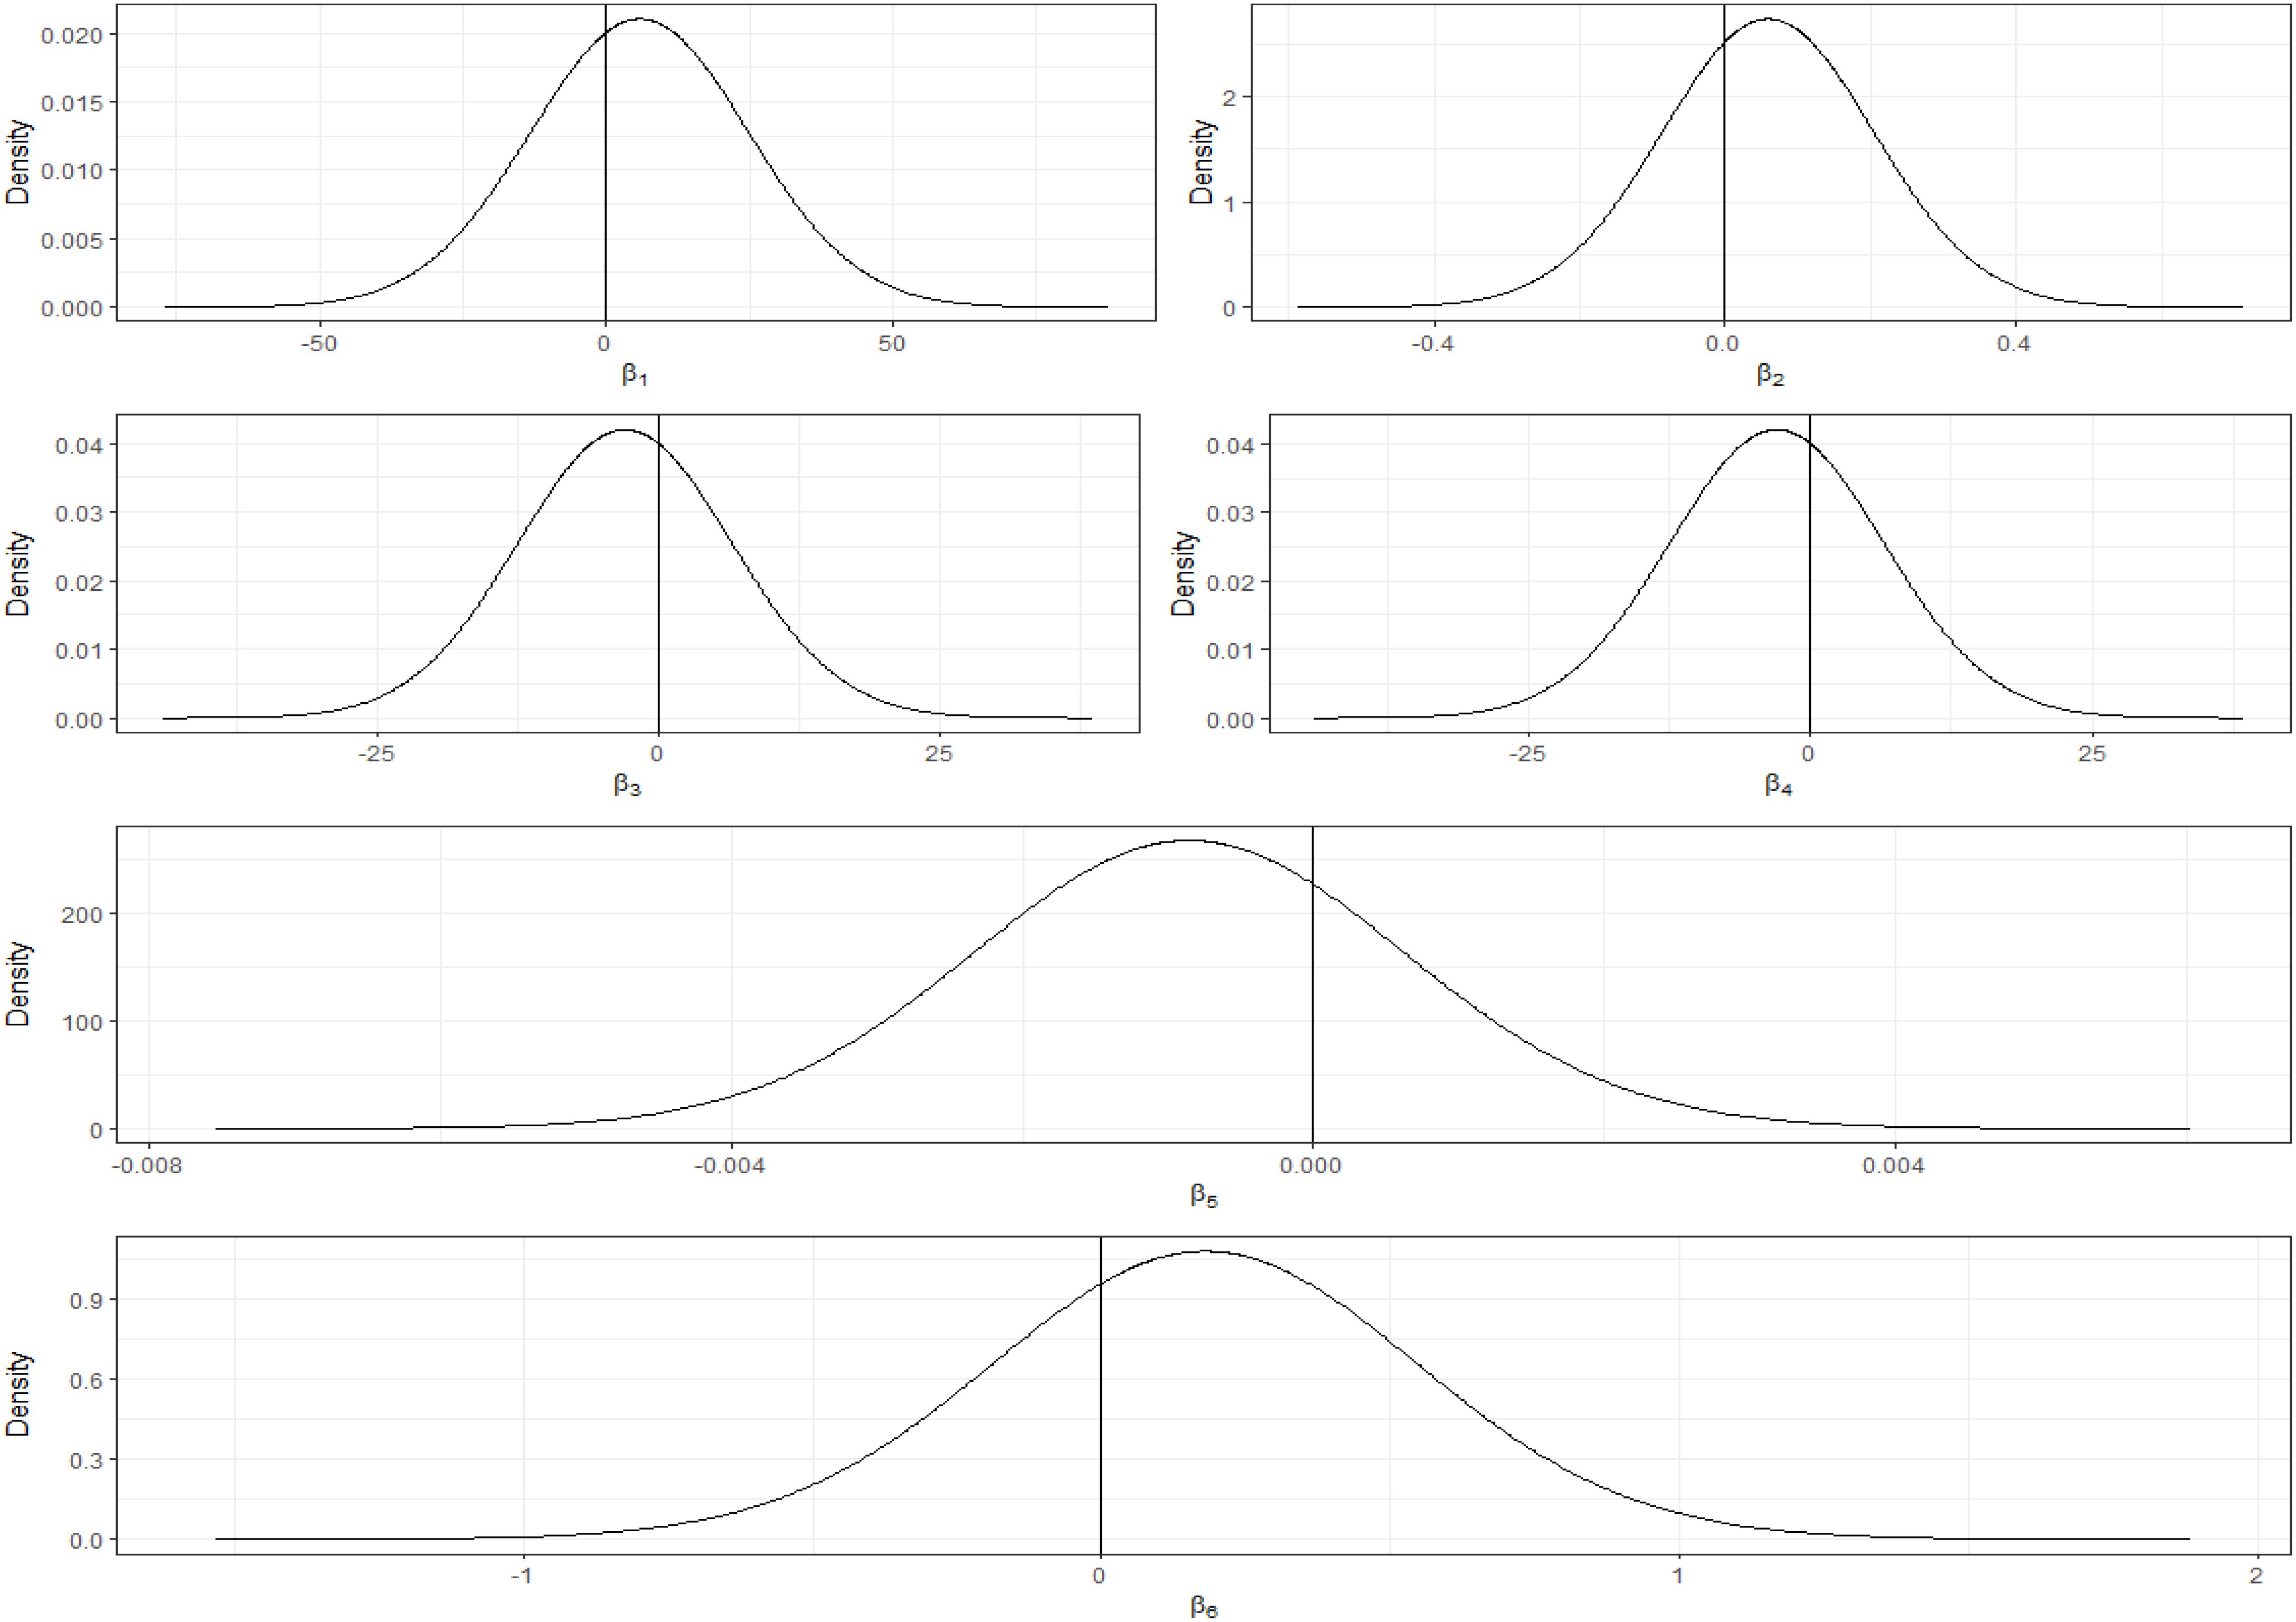
Figure 10. Posterior distributions of fixed effect coefficients (temperature, precipitation, minimum temperature, maximum temperature, solar radiation, and wind speed).
In stark contrast to the uncertainty surrounding the fixed effects, the analysis revealed highly significant contributions from both random effect components (Table 4). Table 4 details the estimated hyperparameters for these random effects, included to account for spatial dependencies and unexplained variability. The structured spatial random effect (id), modeled using an intrinsic CAR structure (RW2D), and captures spatial autocorrelation. The unstructured random effect (id2), modeled as IID Gaussian noise, accounts for non-spatial heterogeneity. The estimated mean precision (τ) was substantially higher for the structured effect (τ ≈ 6.34) than the unstructured effect (τ ≈ 0.09), indicating considerably larger variance attributed to the unstructured component (σ² ≈ 11.1) compared to the spatially structured component (σ² ≈ 0.16). Crucially, the 95% credible intervals for the precision of both random effects are well above zero (Table 4), confirming their significant contribution to the model fit. This strongly suggests that unmeasured factors, exhibiting both spatial correlation and site-specific randomness, are primary drivers influencing the observed distribution patterns of C. edithae.
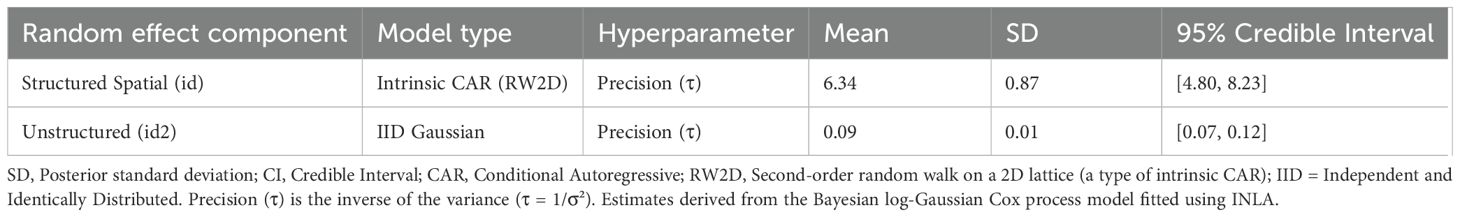
Table 4. Summary of posterior distributions for random effect hyperparameters in the log-gaussian cox process model.
3.2 Convergence diagnostics
To validate the reliability of our model and the soundness of our findings, we generated diagnostic visualizations, including plots of marginal posterior distribution densities and quantile graphs. The density plots (Figure 11) for various climate variables - temperature, precipitation, minimum and maximum temperatures, solar radiation, and wind speed - demonstrate well-formed Gaussian-like distributions. These plots, in conjunction with the 95% credible intervals, elucidate the uncertainty surrounding the estimated parameters. These results indicate that the INLA sampler has achieved convergence, thus lending credibility to the model’s estimates.
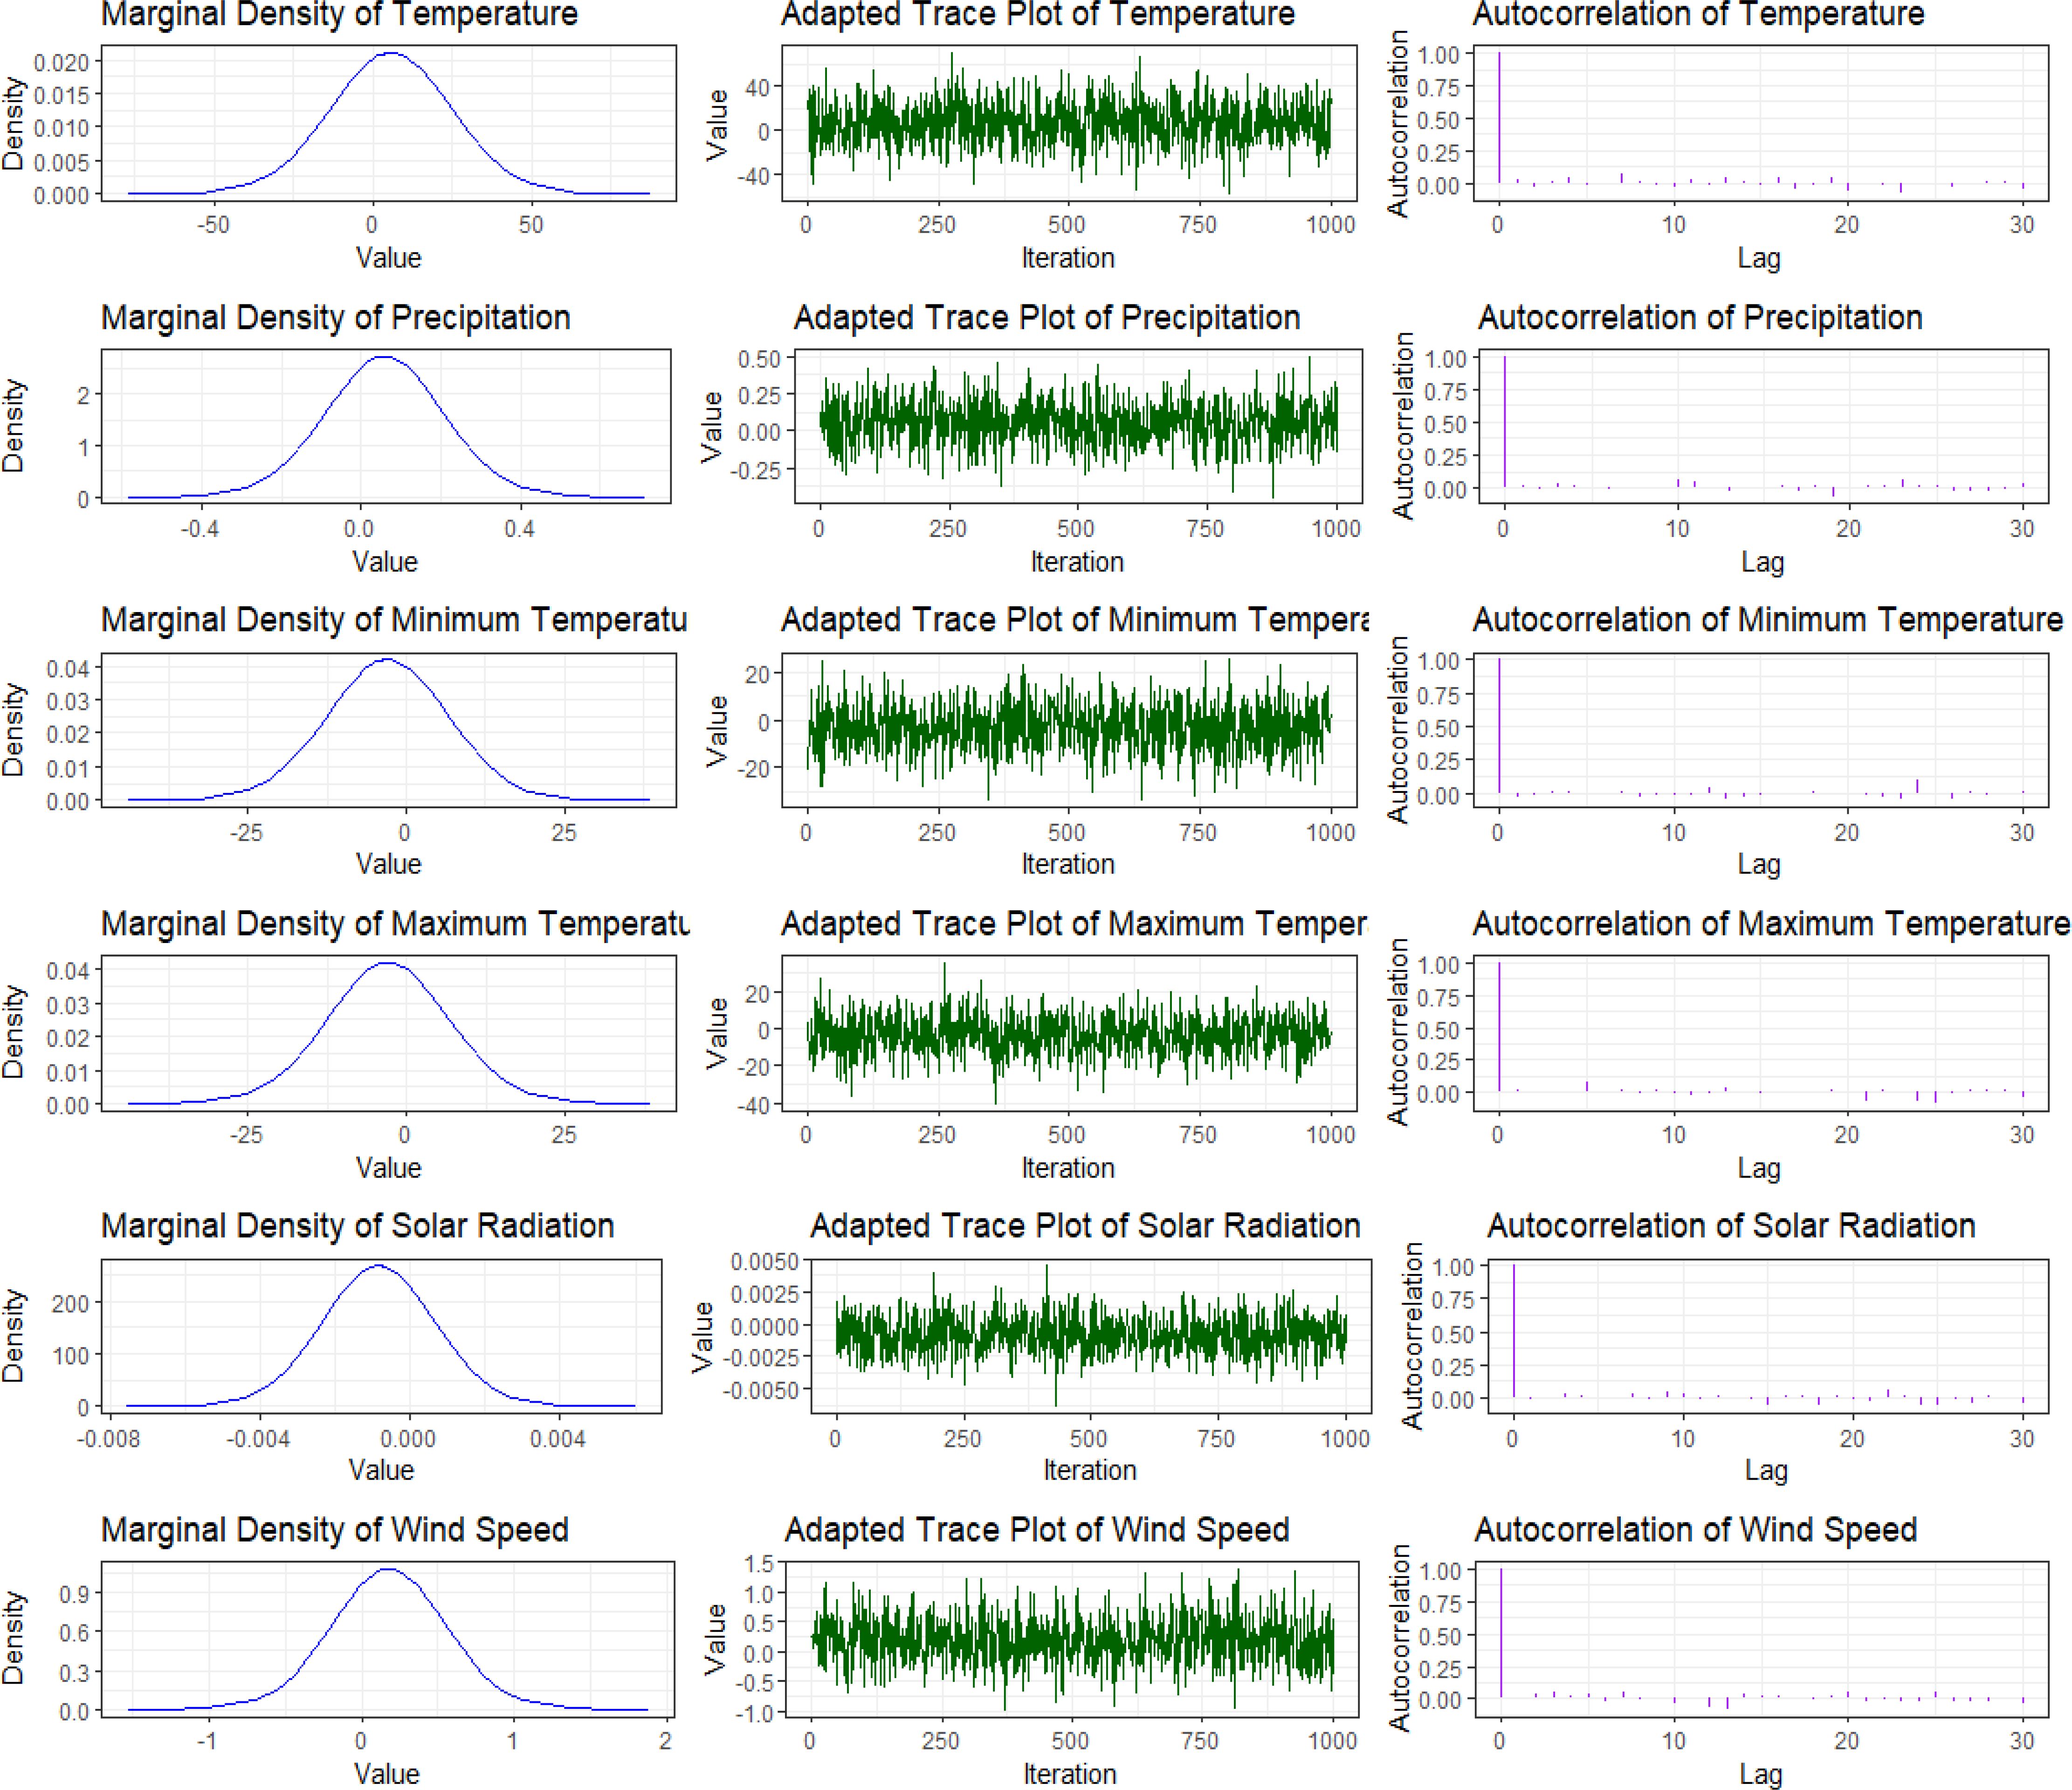
Figure 11. Convergence diagnostics for fixed effect posterior distributions.
The parameter sample progression exhibited in the trace plots (Figure 11) during Integrated laplace approximation (INLA) iterations demonstrates relatively consistent patterns and mixing, indicating convergence and parameter stability. Furthermore, the autocorrelation plots in Figure 11 reveal minimal correlation between consecutive samples, suggesting that the sampling chain effectively explored the parameter space. Collectively, these diagnostic evaluations support the reliability of the model.
3.3 Predicted intensity maps
The estimated average number of Corvus edithae occurrences per grid cell (NE) is depicted in the forecasted intensity maps, along with the 95% credible interval’s lower (LL) and upper (UL) boundaries (Figure 12). In general, Corvus edithae presence was sparse, with the majority of grid cells expected to contain fewer than 10 individuals, particularly in interior areas. Coastal regions were predicted to exhibit the highest concentration (Figure 12), indicating that these areas constitute critical habitats for Corvus edithae in Somaliland. The LL and UL maps illustrate variations in model uncertainty across the study region, with wider credible intervals observed in locations where fewer observations were recorded.
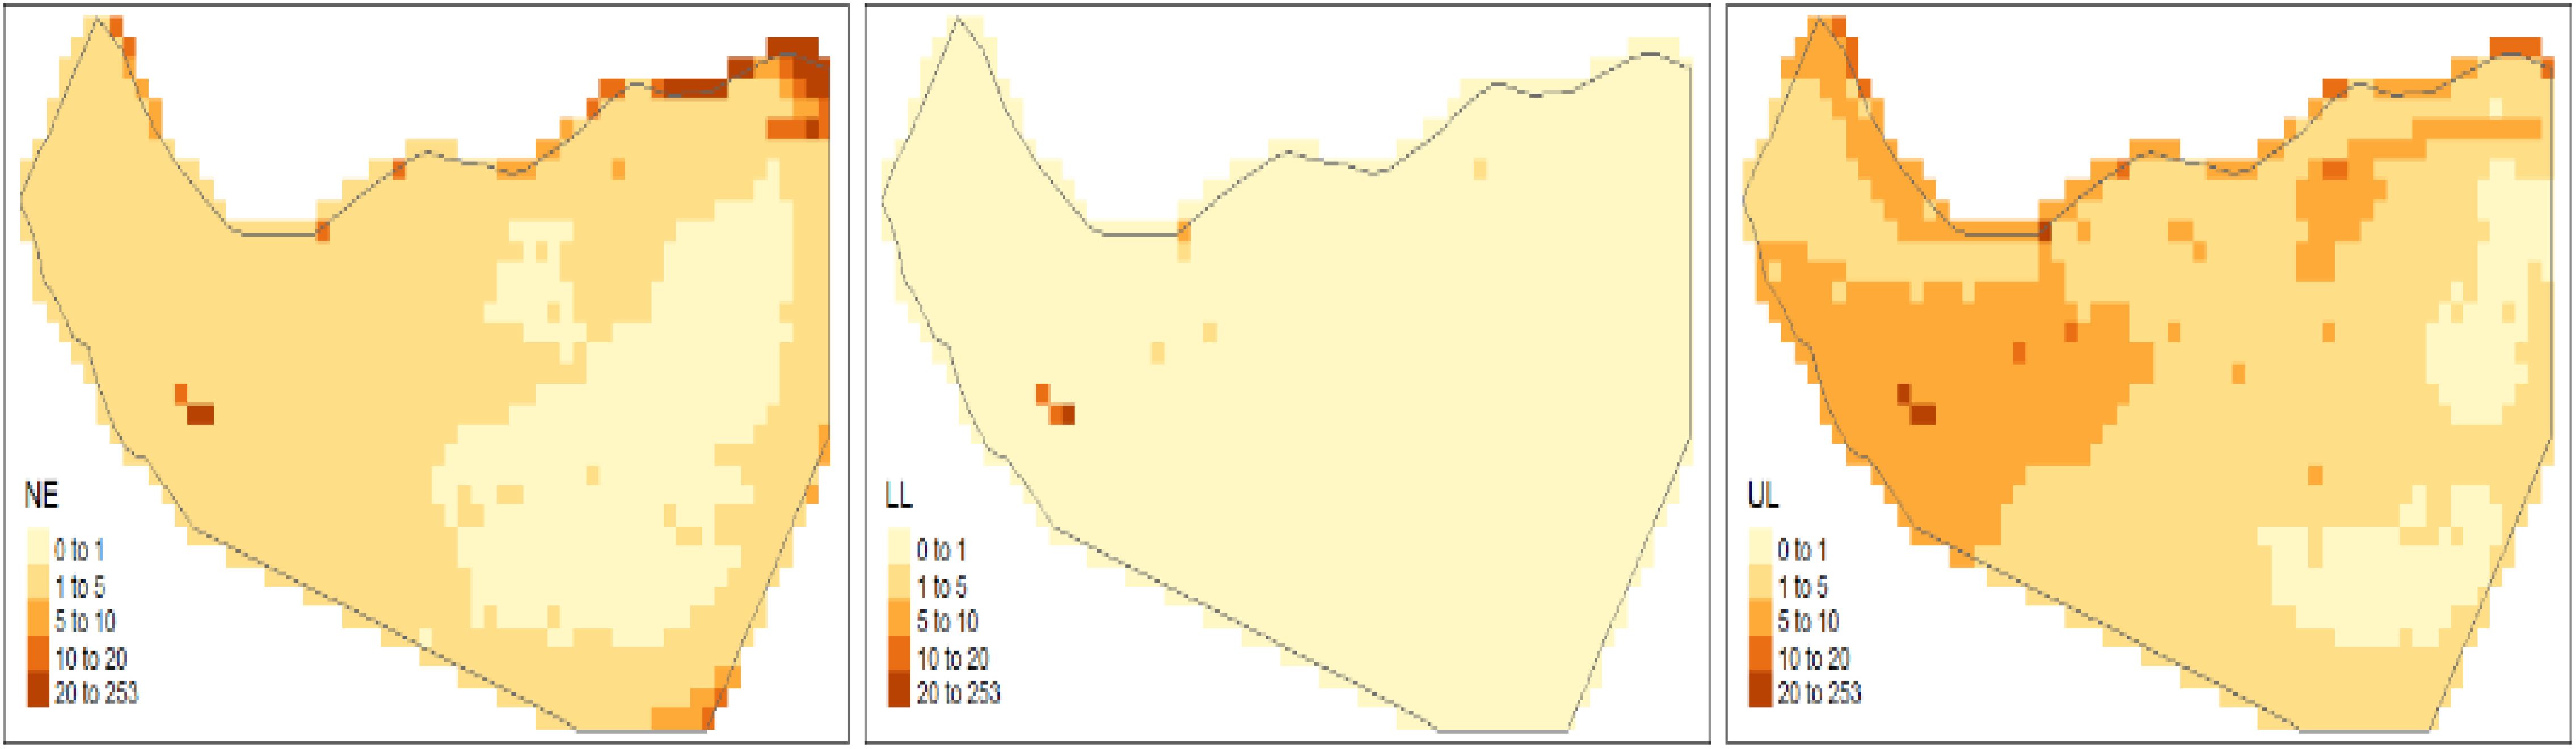
Figure 12. Predicted occurrence intensity maps (mean NE, lower 95% CI LL, Upper 95% CI UL).
The spatial arrangement of random effects (Figure 13) indicates the presence of spatial elements not accounted for by the fixed covariates. Both the structured (spatial autocorrelation) and unstructured (independent variability) random effects suggest the existence of additional unexplained spatial factors influencing the distribution of Corvus edithae. This observation implies that the species’ distribution is also affected by unmeasured environmental variables or biological mechanisms not incorporated into the current model.
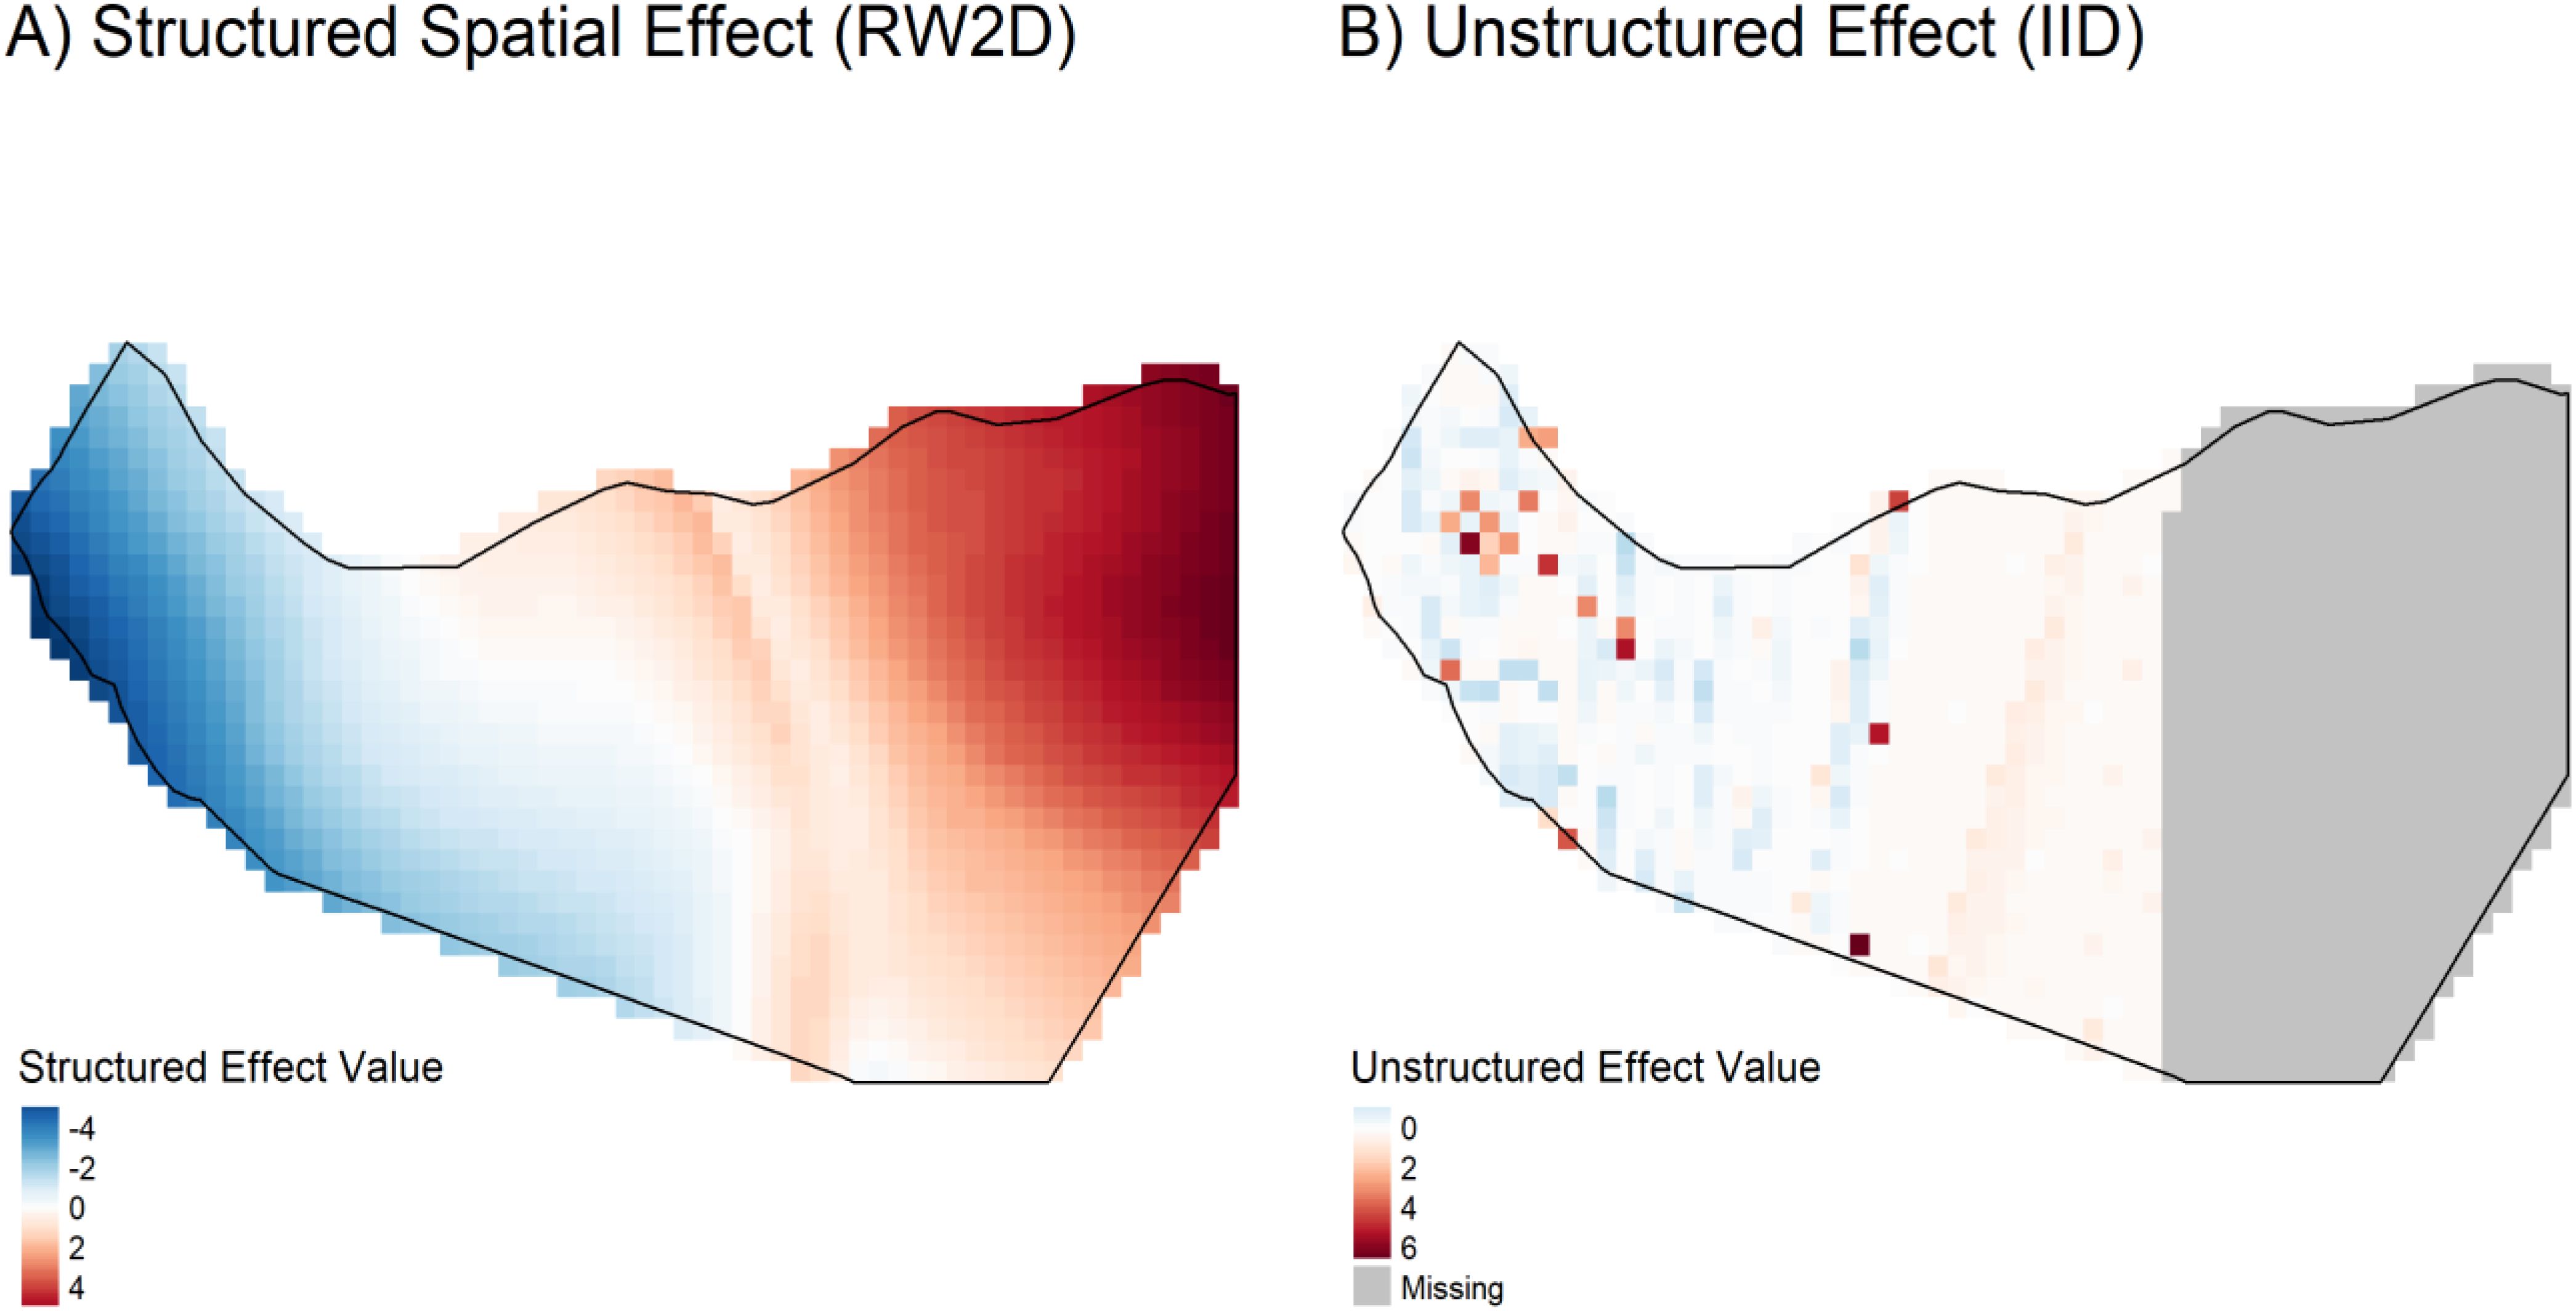
Figure 13. Spatial visualization of estimated random effects (structured and unstructured components).
The spatial arrangement of the estimated random effects further illuminates the distribution patterns (Figure 13). Visualizing the structured (spatial autocorrelation) and unstructured (independent variability) components reveals clear spatial patterns not accounted for by the fixed covariates alone. The significance of these components, as quantified in Table 4, underscores the influence of additional unexplained spatial factors – such as fine-scale habitat variations, resource distribution, or human influences – on the distribution of Corvus edithae.
Figure 13 visually confirms the significant influence of spatial factors on C. edithae distribution, complementing the statistical findings in Table 4. Panel A, depicting the structured random effect (RW2D), reveals a clear, smooth spatial gradient across Somaliland, transitioning from negative values (blue, indicating lower-than-expected intensity due to spatial factors) in the west/northwest to positive values (red, indicating higher-than-expected intensity) in the east/southeast. This strong pattern indicates significant spatial autocorrelation, suggesting that large-scale environmental gradients, historical processes, or other spatially correlated factors not captured by the included climatic covariates play a crucial role in shaping occurrence patterns. In contrast, Panel B illustrates the unstructured random effect (IID), showing a much patchier pattern of localized deviations. While many areas exhibit values close to zero (white), scattered cells show notable positive (red) or negative (blue) effects, representing fine-scale heterogeneity, unmeasured local factors (e.g., microhabitat, resource patches), or stochasticity not explained by the fixed effects or the broad spatial trend. The presence of both strong structured patterns and localized unstructured variation underscores the complexity of the drivers of C. edithae distribution and highlights the critical importance of accounting for spatial dependencies and unmeasured variables in ecological modeling for this species.
4 Discussion
This study successfully employed a spatial point process modelling approach, specifically the log-Gaussian Cox process implemented via R-INLA, to investigate the spatial distribution of the Somali crow (C. edithae) in Somaliland and its relationship with key climatic variables. By leveraging publicly accessible occurrence data (eBird) and climate data (WorldClim), we generated insights into the environmental factors shaping this species’ range and demonstrated the utility of this Bayesian framework for ecological research, particularly in data-scarce regions relevant to conservation planning (Diggle, 2013; Moraga, 2019, 2023). While we explored the relationship between C. edithae distribution and key climatic variables, our findings primarily highlight the critical importance of underlying spatial structure and heterogeneity, as revealed through the modeling process. The study demonstrates the utility of this Bayesian framework for ecological research, particularly in identifying dominant spatial patterns even when specific covariate effects are uncertain, providing a baseline for conservation planning and future investigation.
The model explored potential associations between C. edithae occurrence intensity and several climatic factors (Table 3). Posterior mean estimates suggested potential positive trends with mean annual temperature, mean annual precipitation, and wind speed. Ecologically, this could imply a preference for generally warmer and relatively moister areas within the Somaliland context, or potential benefits from wind for foraging or thermal relief. However, it is crucial to note that the 95% credible intervals for all these climatic covariates were wide and encompassed zero (Table 3). This indicates substantial uncertainty surrounding these potential relationships at the scale analyzed; the observed data and model do not provide strong evidence to distinguish these effects from zero. While the mean trends align broadly with established knowledge that temperature and precipitation are fundamental drivers (Cooper, 2021; Elith et al., 2006; Guisan and Thuiller, 2005; Ndimuligo et al., 2022), their direct, measurable influence in this specific context appears weak or obscured by other factors.”
Conversely, mean estimates suggested potential negative associations with minimum and maximum temperatures. While a positive mean effect for mean annual temperature might suggest adaptation to high average temperatures, the negative mean effects for extremes could hypothetically indicate sensitivity to temperature variability or avoidance of the absolute hottest and coldest conditions, perhaps reflecting physiological constraints or indirect effects (Hosseini et al., 2024; Ndimuligo et al., 2022; Sarkar et al., 2024). Again, the substantial uncertainty indicated by the wide credible intervals overlapping zero (Table 3) means these interpretations remain speculative.”
Intriguingly, solar radiation also showed a slightly negative mean association, though like the other climate variables, this effect was highly uncertain (Table 3). The ecological interpretation is discussed further below (Section 4.2). Despite the uncertainty surrounding the specific climatic drivers, the model’s overall prediction pointed to generally low occurrence intensities across much of Somaliland, but with notable concentrations in coastal regions (Figure 12). This spatial pattern itself is a key finding, suggesting these coastal areas represent suitable, potentially critical, habitats, likely due to a combination of factors not fully resolved by the broad-scale climate variables alone.”
The model’s finding regarding solar radiation requires careful consideration within the broader context of avian ecophysiology. High solar radiation loads, particularly in arid and semi-arid environments like Somaliland, pose significant thermoregulatory challenges for birds (De Klerk et al., 2002; Ndimuligo et al., 2022; Villén-Pérez et al., 2014; Williams and Tieleman, 2005; Wolf et al., 1996). Birds must balance heat gain from the environment with metabolic heat production and evaporative water loss. Excessive solar radiation can lead to hyperthermia, dehydration, and necessitate behavioral adjustments that may conflict with other essential activities like foraging and breeding (Angilletta et al., 2010).
To cope with high solar radiation, birds employ various strategies. Behaviourally, they may seek shade, reduce activity during peak radiation periods, alter foraging times (e.g., crepuscular activity), or orient their bodies to minimize exposure (Smit et al., 2016; Pattinson et al., 2022). Physiologically, adaptations can include plumage characteristics that reflect solar radiation or specialized mechanisms for heat dissipation (e.g., panting, gular fluttering), though these often incur water costs (McKechnie & Wolf, 2019). Breeding can also be affected, with nest site selection favoring shaded locations and incubation patterns potentially altered to avoid overheating eggs or nestlings (du Plessis et al., 2012).
While Corvus species are often considered adaptable generalists, the Somali crow’s dark plumage could potentially increase heat absorption from solar radiation compared to lighter-colored birds (Stuart-Fox et al., 2017). Therefore, the slightly negative association observed in our model, despite its uncertainty, might reflect behavioral avoidance of the most intensely irradiated areas or times, or selection for microhabitats offering thermal refugia (e.g., cliffs, taller vegetation, human structures providing shade) that are not captured by the coarse resolution (10 arc-minute) of the WorldClim solar radiation data. It is also possible that the direct physiological impact of solar radiation is less limiting than its indirect effects mediated through vegetation structure, prey availability, or water sources, which are correlated with other climatic variables in the model. Further research incorporating finer-scale microclimate data and behavioral observations would be invaluable to disentangle these effects and clarify the precise ecological role of solar radiation in shaping Corvus edithae’s distribution and behavior. Comparing its thermal tolerance and behavioral responses to those of other sympatric bird species facing similar environmental pressures could also yield significant insights.
The analysis highlighted the significant contribution of both spatially structured (autocorrelation) and unstructured random effects. Crucially, the posterior distributions for the precision hyperparameters of both the structured (RW2D) and unstructured (IID) random effects indicated high certainty, with 95% credible intervals clearly excluding zero (Table 4). This contrasts sharply with the uncertainty surrounding the fixed climatic effects and statistically confirms the vital role of spatial structure and unexplained heterogeneity. The estimated variance was notably larger for the unstructured component compared to the structured component (based on inverse precisions, Table 4), suggesting significant site-specific variation beyond broader spatial clustering.
This underscores that the included climatic covariates alone do not fully explain the observed distribution of Corvus edithae. The structured random effect suggests the influence of spatially clustered factors not explicitly included in the model, such as fine-scale habitat features (e.g., specific vegetation types, availability of nesting cliffs or trees), topography influencing microclimates, resource distribution (water sources, food patches), or even historical factors influencing colonization patterns (Diggle, 2013). The unstructured random effect points towards localized variations or stochasticity not captured by either the fixed effects or the spatial correlation structure. Recognizing these unmeasured spatial influences is crucial for a complete understanding and accurate prediction of species distributions.
Our findings contribute to the growing body of research using SDMs to understand climate impacts on species distributions (Elith et al., 2006; Guisan and Thuiller, 2005; Moraga, 2019, 2021, 2023). The vulnerability of avian species, particularly in arid and tropical regions, to climate change is increasingly recognized (Austin and Van Niel, 2011; Hosseini et al., 2024; Ndimuligo et al., 2022; Van der Putten et al., 2010; Walker and Taylor, 2017; Woodin et al., 2013). This study provides a species-specific case study within the Horn of Africa, a region identified as important for avian endemism and potentially vulnerable to environmental change (Ndimuligo et al., 2022).
Placing our results in a broader biogeographic context is essential. Studies like De Klerk et al. (2002) mapped patterns of endemism for Afrotropical birds, highlighting centers of richness and transition zones. While Corvus edithae has a relatively restricted range within the Horn of Africa, understanding how its distribution relates to these broader patterns can inform conservation priorities. Furthermore, research on Afromontane avian communities, such as Cooper (2021), emphasizes the role of historical climate fluctuations and ecological factors in shaping community structure across elevation gradients. Although Somaliland encompasses varied topography, understanding these broader regional dynamics helps contextualize the potential drivers influencing Corvus edithae populations. Additionally, phylogeographic studies, like Perktaş et al. (2020) on turacos, reveal complex histories of diversification and population connectivity across Africa. While our study focuses on current distribution, integrating such historical perspectives and potential genetic structure would be crucial for comprehensive conservation planning for Corvus edithae in the future. Our use of a log-Gaussian Cox process model aligns with methodological advancements demonstrating the value of explicitly handling spatial dependencies and stochasticity in ecological point pattern data (Diggle, 2013; Moraga, 2019).
4.1 Limitations
This research is subject to several limitations inherent in the data and modeling approach. Firstly, occurrence data sourced from citizen science platforms like eBird via GBIF can exhibit spatial sampling bias, potentially overrepresenting easily accessible areas or locations popular with observers (Isaac et al., 2014). While we acknowledge this, explicit bias correction techniques were not implemented in this study but are recommended for future work. Secondly, the WorldClim climate data, while widely used, represents interpolated data at a relatively coarse resolution (10 arc-minutes), which may not capture fine-scale microclimatic variations crucial for species distributions, particularly in topographically complex regions like parts of Somaliland. This coarse resolution of environmental data is a likely contributor to the uncertainty observed in the fixed effect estimates (Table 3), as it may average out important microclimatic variations or fail to capture fine-scale habitat features that strongly influence local occurrence.
This limitation is particularly relevant when interpreting the effects of variables like solar radiation and temperature extremes. Thirdly, the log-Gaussian Cox process model assumes linearity between the transformed response (log-intensity) and covariates, and stationarity in the spatial random effects, which may be simplifications of complex ecological reality. Fourthly, the model is static and does not explicitly account for temporal dynamics in climate or species populations, nor does it incorporate potentially important non-climatic factors like land use change, specific habitat structure, interspecific interactions, or resource availability, which are constrained by data availability. Finally, the dataset itself may contain errors or incomplete information that could influence the results.
4.2 Management and policy implications
Despite limitations, our findings offer valuable insights for conservation management and policy in Somaliland. The prediction maps identifying coastal regions as areas of higher occurrence density suggest these zones may represent core habitats requiring focused conservation attention. These maps can serve as a baseline for assessing potential range shifts under future climate change scenarios by projecting distributions using climate model outputs for temperature, precipitation, solar radiation, and wind speed variations. Understanding that the species appears sensitive to temperature extremes and potentially high solar radiation, while favoring relatively warmer and moister conditions, can help anticipate vulnerabilities. Identifying high-concentration areas is a crucial first step for designating conservation zones or implementing targeted management strategies. Furthermore, the results underscore the need for policies that integrate climate change adaptation measures into biodiversity conservation planning in the region.
4.3 Future work
The framework established here provides a foundation for several avenues of future research. Incorporating additional covariates, such as detailed land cover data, vegetation indices (e.g., NDVI), proximity to water sources, human population density, or measures of anthropogenic disturbance, could improve model explanatory power. Expanding the model to explicitly incorporate temporal dynamics, analyzing changes in distribution over time using historical data if available, would provide crucial insights into population trends and climate change responses. Validating the model’s predictive capacity using independent datasets is an essential next step. Applying this modelling approach to other species of interest within Somaliland and the broader Horn of Africa region could provide a more comprehensive understanding of regional biodiversity patterns and vulnerabilities. Finally, exploring more complex modelling approaches, potentially incorporating mechanistic physiological constraints related to factors like solar radiation and temperature, or explicitly addressing sampling bias and finer-scale environmental heterogeneity, represents important future directions. Integrating phylogeographic data (sensu Perktaş et al., 2020) could also refine conservation unit definition.
5 Conclusion
This study successfully applied log-Gaussian Cox process modelling via R-INLA to investigate the spatial distribution of the Somali crow (C. edithae) in Somaliland. By integrating climatic covariates with both structured and unstructured random effects, our approach provided valuable insights into the factors shaping its occurrence patterns. While the analysis explored potential associations with broad-scale climate variables, the results highlighted considerable uncertainty surrounding their specific influence at the resolution studied. Critically, the model revealed that unmeasured spatial factors, captured through highly significant spatial random effects (autocorrelation and heterogeneity), are dominant drivers of the observed distribution. This underscores that spatial dependencies and local environmental variations play a crucial role, potentially more so than the specific regional climatic gradients examined here.
Despite the uncertainty in specific climate drivers, the model identified coastal regions as areas of higher predicted occurrence intensity, suggesting their potential importance for conservation focus. The study demonstrates the utility of this Bayesian spatial point process framework for ecological analysis, particularly in revealing the importance of spatial structure even when covariate effects are uncertain. It provides a reproducible methodology applicable to other species and regions, especially where spatial data exhibit complex dependencies. Ultimately, this work emphasizes that effective conservation planning for C. edithae in Somaliland must consider the significant spatial patterns and heterogeneity identified, prompting future research to investigate the underlying fine-scale environmental or anthropogenic factors driving these patterns.
Data availability statement
The original contributions presented in the study are included in the article/Supplementary Material. Further inquiries can be directed to the corresponding author.
Author contributions
AM: Conceptualization, Data curation, Formal analysis, Funding acquisition, Investigation, Methodology, Project administration, Resources, Software, Supervision, Validation, Visualization, Writing – original draft, Writing – review & editing. MA: Conceptualization, Data curation, Formal analysis, Funding acquisition, Investigation, Methodology, Project administration, Resources, Software, Supervision, Validation, Visualization, Writing – original draft, Writing – review & editing.
Funding
The author(s) declare that no financial support was received for the research and/or publication of this article.
Acknowledgments
The authors express their gratitude to Princess Nourah bint Abdulrahman University Researchers Supporting Project number (PNURSP2025R913), Princess Nourah bint Abdulrahman University, Riyadh, Saudi Arabia.
Conflict of interest
The authors declare that the research was conducted in the absence of any commercial or financial relationships that could be construed as a potential conflict of interest.
Generative AI statement
The author(s) declare that no Generative AI was used in the creation of this manuscript.
Publisher’s note
All claims expressed in this article are solely those of the authors and do not necessarily represent those of their affiliated organizations, or those of the publisher, the editors and the reviewers. Any product that may be evaluated in this article, or claim that may be made by its manufacturer, is not guaranteed or endorsed by the publisher.
Supplementary material
The Supplementary Material for this article can be found online at: https://www.frontiersin.org/articles/10.3389/fevo.2025.1573807/full#supplementary-material
References
Abdikarim H., Ali M. A., Abokor A. H., Farih O. A., Abdillahi A. M., Yousuf A. M., et al. (2024). Prevalence and determinants of heart disease in Somaliland: an analysis of the 2020 Somaliland demographic and health survey (SLDHS). Curr. Problems Cardiol. 50, 102885. doi: 10.1016/j.cpcardiol.2024.102885, PMID: 39442741
Al-Aziz S. N., Muse A. H., Jawad T. M., Sayed-Ahmed N., Aldallal R., and Yusuf M. (2022). Bayesian inference in a generalized log-logistic proportional hazards model for the analysis of competing risk data: An application to stem-cell transplanted patients data. Alexandria Eng. J. 61, 13035–13050. doi: 10.1016/j.aej.2022.06.051
Ali M. A., Abokor A. H., Adam Farih O., Abdikarim H., Yousuf A. M., and Muse A. H. (2025). Household solid fuel use and associated factors in Somaliland: A multilevel analysis of data from 2020 Somaliland demographic and health survey. Environ. Health Insights 19, 11786302251315892. doi: 10.1177/11786302251315893, PMID: 39896061
Angilletta M. J., Cooper B. S., Schuler M. S., and Boyles J. G. (2010). The evolution of thermal physiology in endotherms. Front. Biosci. E. 2, 861–881., PMID: 20515760
Austin M. P. and Van Niel K. P. (2011). “Improving species distribution models for climate change studies: variable selection and scale,” in Journal of biogeography, vol. 38. (Hoboken, NJ: Wiley Online Library), 1–8.
Bivand R., Gómez-Rubio V., and Rue H. (2015). Spatial data analysis with R-INLA with some extensions. J. Stat. Software 63, 1–31. doi: 10.18637/jss.v063.i20
Brix A. and Diggle P. J. (2001). Spatiotemporal prediction for log-Gaussian Cox processes. J. R. Stat. Society: Ser. B (Statistical Methodology) 63, 823–841. doi: 10.1111/1467-9868.00315
Chamberlain S., Ram K., and Hart T. (2018). spocc: Interface to species occurrence data sources. R package version 0.5.0. Available online at: https://CRAN.R-project.org/package=spocc.
Cooper J. C. (2021). Hierarchical analyses of avian community biogeography in the Afromontane highlands. Front. Biogeography 13, e51310. doi: 10.21425/f5fbg51310, PMID: 36844190
Crase B., Liedloff A. C., and Wintle B. A. (2012). A new method for dealing with residual spatial autocorrelation in species distribution models. Ecography 35, 879–888. doi: 10.1111/j.1600-0587.2011.07138.x
De Klerk H. M., Crowe T. M., Fjeldså J., and Burgess N. D. (2002). Biogeographical patterns of endemic terrestrial Afrotropical birds. Diversity Distributions 8, 147–162. doi: 10.1046/j.1472-4642.2002.00142.x
Diggle P. J. (2013). Statistical analysis of spatial and spatio-temporal point patterns (Boca Raton, FL: CRC press).
Dovers E., Stoklosa J., and Warton D. I. (2024). Fitting log-Gaussian Cox processes using generalized additive model software. Am. Statistician 78, 418–425. doi: 10.1080/00031305.2024.2316725
du Plessis K. L., Martin R. O., Hockey P. A., Cunningham S. J., and Ridley A. R. (2012). The costs of keeping cool in a warming world: implications of high temperatures for foraging, thermoregulation and body condition of an arid‐zone bird. Glob. Change Biol. 18, 3063–3070., PMID: 28741828
Elith J., Graham C. H., Anderson R. P., Dudík M., Ferrier S., Guisan A., et al. (2006). Nordic society oikos. Ecography 29, 129–151. doi: 10.1111/j.2006.0906-7590.04596.x
Franklin J. (2023). Species distribution modelling supports the study of past, present and future biogeographies. J. Biogeography 50, 1533–1545. doi: 10.1111/jbi.14617
Guisan A. and Thuiller W. (2005). Predicting species distribution: offering more than simple habitat models. Ecol. Lett. 8, 993–1009. doi: 10.1111/j.1461-0248.2005.00792.x, PMID: 34517687
Hassan M. A., Muse A. H., and Nadarajah S. (2024). Predicting student dropout rates using supervised machine learning: insights from the 2022 national education accessibility survey in Somaliland. Appl. Sci. 14, 7593. doi: 10.3390/app14177593
Hijmans R. J. (2024). geodata: Download Geographic Data. R package version 0.6-11. Available online at: https://CRAN.R-project.org/package=geodata.
Hosseini N., Ghorbanpour M., and Mostafavi H. (2024). The influence of climate change on the future distribution of two Thymus species in Iran: MaxEnt model-based prediction. BMC Plant Biol. 24, 269. doi: 10.1186/s12870-024-04965-1, PMID: 38605338
Illian J., Penttinen A., Stoyan H., and Stoyan D. (2008). Statistical analysis and modelling of spatial point patterns. John Wiley & Sons.
Isaac N. J., van Strien A. J., August T. A., de Zeeuw M. P., and Roy D. B. (2014). Statistics for citizen science: extracting signals of change from noisy ecological data. Methods Ecol. Evol. 5, 1052–1060.
Johnston A., Hochachka W. M., Strimas-Mackey M. E., Ruiz Gutierrez V., Robinson O. J., Miller E. T., et al. (2021). Analytical guidelines to increase the value of community science data: An example using eBird data to estimate species distributions. Diversity Distributions 27, 1265–1277. doi: 10.1111/ddi.13271
Jokimäki J., Kaisanlahti-Jokimäki M.-L., and Suhonen J. (2022). Long-term winter population trends of corvids in relation to urbanization and climate at northern latitudes. Animals 12, 1820. doi: 10.3390/ani12141820, PMID: 35883367
Keith D. A., Akçakaya H. R., Thuiller W., Midgley G. F., Pearson R. G., Phillips S. J., et al. (2008). Predicting extinction risks under climate change: coupling stochastic population models with dynamic bioclimatic habitat models. Biol. Lett. 4, 560–563. doi: 10.1098/rsbl.2008.0049, PMID: 18664424
Lefebvre L., Reader S. M., and Sol D. (2004). Brains, innovations and evolution in birds and primates. Brain Behav. Evol. 63, 233–246.
Lezama-Ochoa N., Brodie S., Welch H., Jacox M. G., Pozo Buil M., Fiechter J., et al. (2024). Divergent responses of highly migratory species to climate change in the California Current. Diversity Distributions 30, e13800. doi: 10.1111/ddi.13800
Li Y., Brown P., Gesink D. C., and Rue H. (2012). Log Gaussian Cox processes and spatially aggregated disease incidence data. Stat. Methods Med. Res. 21, 479–507. doi: 10.1177/0962280212446326, PMID: 22544855
Lovelace R., Nowosad J., and Muenchow J. (2019). Geocomputation with R (Boca Raton, FL: Chapman and Hall/CRC).
McKechnie A. E. and Wolf B. O. (2019). The physiology of heat tolerance in small endotherms. Physiology 34, 302–313.
Miller J. (2010). Species distribution modeling. Geogr. Compass 4, 490–509. doi: 10.1111/j.1749-8198.2010.00351.x
Miller J. A. (2012). Species distribution models: Spatial autocorrelation and non-stationarity. Prog. Phys. Geogr. 36, 681–692. doi: 10.1177/0309133312442522
Moraga P. (2019). Geospatial health data: Modeling and visualization with R-INLA and shiny (Boca Raton, FL: Chapman and Hall/CRC).
Moraga P. (2021). Species distribution modeling using spatial point processes: a case study of sloth occurrence in Costa Rica. R J. 12, 293–310. doi: 10.32614/RJ-2021-017
Moraga P. (2023). Spatial statistics for data science: theory and practice with R (Boca Raton, FL: CRC Press).
Moraga P. and Montes F. (2011). Detection of spatial disease clusters with LISA functions. Stat Med. 30, 1057–1071. doi: 10.1002/sim.v30.10, PMID: 21484847
Muse A. H., Chesneau C., Ngesa O., and Mwalili S. (2022a). Flexible parametric accelerated hazard model: simulation and application to censored lifetime data with crossing survival curves. Math. Comput. Appl. 27, 104. doi: 10.3390/mca27060104
Muse A. H., Mwalili S., Ngesa O., Alshanbari H. M., Khosa S. K., and Hussam E. (2022b). Bayesian and frequentist approach for the generalized log-logistic accelerated failure time model with applications to larynx-cancer patients. Alexandria Eng. J. 61, 7953–7978. doi: 10.1016/j.aej.2022.01.033
Muse A. H., Mwalili S., Ngesa O., Chesneau C., Al-Bossly A., and El-Morshedy M. (2022c). Bayesian and frequentist approaches for a tractable parametric general class of hazard-based regression models: An application to oncology data. Mathematics 10, 3813. doi: 10.3390/math10203813
Muse A. H., Almohaimeed A., and Alqifari H. N. (2025). Sine-G family of distributions in Bayesian survival modeling: a baseline hazard approach for proportional hazard regression with application to right-censored oncology datasets using R and STAN. PloS One. 20 (3), e0307410., PMID: 40080457
Ndimuligo S. A., Mbwambo B. N., Kavana P. Y., and Nkwabi A. K. (2022). Predicting the impacts of climate change on the potential suitable habitat distribution of house crows (corvus splendens) in Tanzania. Open Access Library J. 9, 1–21. doi: 10.4236/oalib.1109014
Ovaskainen O., Roy D. B., Fox R., and Anderson B. J. (2016). Uncovering hidden spatial structure in species communities with spatially explicit joint species distribution models. Methods Ecol. Evol. 7, 428–436. doi: 10.1111/mee3.2016.7.issue-4
Pattinson N. B., van de Ven T. M., Finnie M. J., Nupen L. J., McKechnie A. E., and Cunningham S. J. (2022). Collapse of breeding success in desert-dwelling hornbills evident within a single decade. Front. Ecol. Evol. 10, 842264.
Pebesma E. and Bivand R. (2023). Spatial data science: With applications in R (Boca Raton, FL: Chapman and Hall/CRC).
Perktaş U., Groth J. G., and Barrowclough G. F. (2020). Phylogeography, species limits, phylogeny, and classification of the turacos (Aves, Musophagidae) based on mitochondrial and nuclear DNA sequences. Am. Mus. Novit. 3949.
Pipoly I., Preiszner B., Sándor K., Sinkovics C., Seress G., Vincze E., et al (2022). Extreme hot weather has stronger impacts on avian reproduction in forests than in cities. Front. Ecol. Evol. 10, 825410.
Qi X., Qian S., Chen K., Li J., Wu X., Wang Z., et al. (2023). Dependence of daily precipitation and wind speed over coastal areas: evidence from China’s coastline. Hydrology Res. 54, 491–507. doi: 10.2166/NH.2023.093
Rue H., Martino S., and Chopin N. (2009). Approximate Bayesian inference for latent Gaussian models by using integrated nested Laplace approximations. J. R. Stat. Soc. Ser. B: Stat. Method. 71, 319–392. doi: 10.1111/j.1467-9868.2008.00700.x
Sarkar D., Jagannivsan H., Debnath A., and Talukdar G. (2024). A systematic review on the potential impact of future climate change on India’s biodiversity using species distribution model (SDM) studies: trends, and data gaps. Biodiversity Conserv. 33, 3399–3415. doi: 10.1007/s10531-024-02785-1
Smit B., Zietsman G., Martin R. O., Cunningham S. J., McKechnie A. E., and Hockey P. A. R. (2016). Behavioural responses to heat in desert birds: implications for predicting vulnerability to climate warming. Clim. Change Responses 3, 9.
Sol D. (2009). Revisiting the cognitive buffer hypothesis for the evolution of large brains. Biol. Lett. 5, 130–133., PMID: 19049952
South A. (2017, November). rnaturalearth: world map data from natural earth. R package version 0.1.0. Available online at: https://CRAN.R-project.org/package=rnaturalearth.
Stevenson T. and Fanshawe J. (2004). Birds of East Africa: Kenya, Tanzania, Uganda, Rwanda, Burundi. A&C Black. Princeton University Press.
Stuart-Fox D., Newton E., and Clusella-Trullas S. (2017). Thermal consequences of colour and near-infrared reflectance. Philos. Trans. R. Soc. B 372, 20160345., PMID: 28533462
Taylor B. M. and Diggle P. J. (2014). INLA or MCMC? A tutorial and comparative evaluation for spatial prediction in log-Gaussian Cox processes. J. Stat. Comput. Simulation 84, 2266–2284. doi: 10.1080/00949655.2013.788653
Teng M., Nathoo F., and Johnson T. D. (2017). Bayesian computation for Log-Gaussian Cox processes: A comparative analysis of methods. J. Stat. Comput. Simulation 87, 2227–2252. doi: 10.1080/00949655.2017.1326117, PMID: 29200537
Van der Putten W. H., Macel M., and Visser M. E. (2010). Predicting species distribution and abundance responses to climate change: why it is essential to include biotic interactions across trophic levels. Philos. Trans. R. Soc. B: Biol. Sci. 365, 2025–2034. doi: 10.1098/rstb.2010.0037, PMID: 20513711
Van de Ven T. M., McKechnie A. E., Er S., and Cunningham S. J. (2020). High temperatures are associated with substantial reductions in breeding success and offspring quality in an arid-zone bird. Oecologia 193, 225–235., PMID: 32296953
Van Niekerk J., Bakka H., Rue H., and Schenk O. (2021). New frontiers in Bayesian modeling using the INLA package in R. J. Stat. Software 100, 1–28. doi: 10.18637/jss.v100.i02
Villén-Pérez S., Carrascal L. M., and Gordo O. (2014). Wintering forest birds roost in areas of higher sun radiation. Eur. J. Wildlife Res. 60, 59–67. doi: 10.1007/s10344-013-0750-7
Walker J. and Taylor P. D. (2017). Using eBird data to model population change of migratory bird species. Avian Conserv. Ecol. 12, 4. doi: 10.5751/ACE-00960-120104
Williams J. B. and Tieleman B. I. (2005). Physiological adaptation in desert birds. Bioscience 55, 416–425. doi: 10.1641/0006-3568(2005)055[0416:PAIDB]2.0.CO;2
Wolf B. O., Wooden K. M., and Walsberg G. E. (1996). The use of thermal refugia by two small desert birds. Condor, 424–428. doi: 10.2307/1369162
Keywords: Somali crow, spatial point process model, species distribution, climate change, Somaliland, spatial analysis
Citation: Muse AH and Abd Elwahab ME (2025) Modeling the impact of climate change on corvus species distribution in Somaliland: Bayesian spatial point process approach for conservation. Front. Ecol. Evol. 13:1573807. doi: 10.3389/fevo.2025.1573807
Received: 20 February 2025; Accepted: 04 June 2025;
Published: 13 August 2025.
Edited by:
Oyetola Oyebanji, Chinese Academy of Sciences (CAS), ChinaReviewed by:
Bashir Bolaji Tiamiyu, University of Ilorin, NigeriaUtku Perktas, American Museum of Natural History, United States
Ali Yusuf Hassan, SIMAD University, Somalia
Copyright © 2025 Muse and Abd Elwahab. This is an open-access article distributed under the terms of the Creative Commons Attribution License (CC BY). The use, distribution or reproduction in other forums is permitted, provided the original author(s) and the copyright owner(s) are credited and that the original publication in this journal is cited, in accordance with accepted academic practice. No use, distribution or reproduction is permitted which does not comply with these terms.
*Correspondence: Abdisalam Hassan Muse, QWJkaXNhbGFtLmhhc3NhbkBhbW91ZC5lZHUuc28=
†ORCID: Abdisalam Hassan Muse, orcid.org/0000-0003-4905-0044
Maysaa Elmahi Abd Elwahab, orcid.org/0009-0000-7059-405X