 Casey L. Brown1*
 Ryan M. Nielson2
 Darren Clark1Ryan Kennedy3Kenneth Loonam4
 Mary M. Rowland3
 Michael J. Wisdom3
- 1Wildlife Research, Oregon Department of Fish and Wildlife, La Grande, OR, United States
- 2Eagle Environmental, Inc., Santa Fe, NM, United States
- 3Pacific Northwest Research Station, Forest Service, United States Department of Agriculture, La Grande, OR, United States
- 4Department of Fisheries Wildlife and Conservation Sciences, Oregon State University, Corvallis, OR, United States
Understanding how indirect effects of climate can interact with density-dependent processes has become increasingly important as variability changes resource availability for wildlife. Both climate and animal density can drive the abundance of vegetation and control the degree of competition for forage between ungulates. Further, climate-density relationships may be more pronounced for females in the population as they may need to compensate nutritionally for the energetic costs of raising young. Quantifying the effects of these relationships on individual animal performance is challenging because it requires long-term data that spans changing densities and climatic patterns to observe the mechanisms in play. Our objectives were to: 1) evaluate differences in fall (Nov–Dec) female elk body condition based on lactation status; 2) assess the relationships between seasonal bottom-up covariates, elk density, and changes in elk body fat; and 3) examine the timing of growing season conditions associated with variation in elk body fat. We used a 20-year dataset of female elk (Cervus canadensis) across varying population densities and seasonal bottom-up patterns to quantify changes in body fat in a semi-arid forested rangeland system in northeastern Oregon, USA. Body fat of lactating elk was negatively associated with severe drought at higher elk densities. Body fat of lactating elk was greater following wet summers with a later green-up date. Higher precipitation during the growing season significantly increased body fat for all groups of elk. These results collectively support the importance of the indirect, bottom-up effects on female elk nutrition. If summer drought continues to increase in duration and intensity in the Pacific Northwest, USA, we expect to see declines in elk body condition with potential impacts to population-level performance.
Introduction
Climate change is a significant risk to biodiversity worldwide, indicating an increasing need to better understand how animals respond to resource fluctuations in rapidly changing environments (Bellard et al., 2012; Hoffmann and Sgrò, 2011). In many temperate ecosystems, one of the greatest effects of climate change is the increase in temperatures during the growing season (Rupp et al., 2017), when nutritional resources are important for a wide range of taxa. High-quality forage for large herbivores is an ephemeral resource, as crude protein and digestibility generally peak early in the growing season and diminish as plants mature (Hobbs, 1996; McArt et al., 2009; Parker et al., 2009). Extreme climate, such as drought, can impact the hydrological conditions associated with understory plant growth and forest productivity (Latta et al., 2010; Kerns et al., 2018), which may alter the peak nutritional window for ungulates. For example, drier than average summer conditions have been linked to a temporal compression of vegetative growth as understory species senesce earlier (Brown et al., 2022) and reduce the overall digestibility of plants (Schuyler et al., 2021). This combination of decreased plant productivity and shifting phenological conditions could ultimately reduce available forage biomass and quality, in turn reducing body condition and overall population performance of large ungulates (Cook et al., 2004; Middleton et al., 2013).
Body condition (e.g., body mass or body fat) of ungulates reflects fluctuations in food availability and energy expenditures and can be used as a key indicator of habitat and weather conditions (Hobbs, 1989; Sæther, 1997; Parker et al., 2009). Increased summer precipitation, as a gauge of summer–autumn nutrition, is positively associated with autumn body fat levels of female elk (Cervus canadensis; Johnson et al., 2019). Because body condition is foundational for individual performance, leading to population growth (Monteith et al., 2014), baseline data from body fat measurements can be directly related to fitness. For example, high levels of body fat have been linked to higher pregnancy rates in moose (Alces alces; Heard et al., 1997; Keech et al., 2000) and caribou (Rangifer tarandus; Gerhart et al., 1996). In female elk, higher levels of body fat are associated with decreased age at first reproduction, increased pregnancy rates, and earlier breeding dates (Cook et al., 2004).
In addition to density-independent factors such as climate, density-dependent factors (e.g., predation, competition) can influence body condition and overall population-level processes in terrestrial mammals (Bonenfant et al., 2009; Albon et al., 2017; Fauteux et al., 2021). Resource availability often decreases as density increases because of intraspecific competition (Chesson, 2000). Thus, individuals in populations near carrying capacity (K) are often in reduced condition which may lead to lower rates of reproduction and survivorship (Bowyer et al., 1999; Kie et al., 2003; Stewart et al., 2005). The interaction between climate and density may also intensify individual effects of these factors by further lowering the nutritional carrying capacity of habitats and exaggerating the impact of high ungulate densities on forage competition. In the face of increasing weather variability and climate change, it is crucial to understand better how growing season conditions and animal density interact to identify and predict their cumulative impacts on nutrition.
In long-lived mammals, accumulation of fat reserves during the growing season is further complicated by the ability of animals to compensate for the energetic demands of lactation. Capital breeders like elk store maternal energy throughout the season before breeding (Morano et al., 2013). This life history strategy reduces the extent to which nutritional conditions control reproductive success during breeding but increases the importance of summer growing season conditions that compensate for the high energetic demands of late-gestation and lactation (Stephens et al., 2014). Before parturition, >90% of daily energy requirements for gestating wild ungulates occurs during the final trimester, and these costs are almost 50% higher for pregnant versus non-pregnant animals during the same period (e.g., Pekins et al., 1998). Following parturition, metabolic rates during lactation are 3–4 times higher than baseline metabolic rates for female elk (Price and White, 1985) and 47 times higher for female mule deer (Moen, 1978). Thus, early season growing conditions (i.e., green-up) are vital for the nutritional ecology of temperate ungulates. Warmer and drier conditions can create phenological mismatches early in the season as the timing of green-up may not align with nutritional demands following parturition (Post and Forchhammer, 2008; Moyes et al., 2011).
Declining elk recruitment over the past four decades in parts of the Pacific Northwest, USA, has led to concern about the effects of habitat conditions on elk populations (Johnson et al., 2013, 2019). Evaluating traits of long-lived mammals that span varying densities and changing climatic conditions requires long-term data to document life-history processes. Our goal was to explore and explain relationships between body condition of female elk (i.e., fat stores) before winter, a critical measure of energetic reserves, and patterns of precipitation and temperature, vegetative growth, and animal densities during the growing season. Few studies have simultaneously evaluated the influence of animal density, environmental conditions, and lactation status on the nutritional status of large ungulates over long time periods (see Simard et al., 2014; Ayotte et al., 2020 as exceptions) We accounted for differences in the ability to accumulate fat reserves because of energetic demands of raising offspring by placing individuals into three groups: 1) lactating (i.e., elk that were still lactating in autumn); 2) non-lactating (i.e., elk that were pregnant but no longer lactating in autumn); and 3) non-pregnant (i.e., elk that were not pregnant the prior winter).
High-quality forage during spring–summer in temperate regions is critical for body fat gain of female elk provisioning for calves (Alldredge et al., 2002; Cook et al., 2004; Proffitt et al., 2016), and other density-dependent processes could exacerbate a limited forage base. We hypothesized that wet, cool conditions during the spring–summer growing season at lower population densities would result in higher body fat for all three groups (H1). Because forage availability declines during periods of extreme temperature and precipitation (i.e., drought), we predicted that density-dependent interactions with drought would be more pronounced for lactating elk (H2). We also hypothesized that body fat of lactating elk would be positively associated with phenological dates representing an earlier green-up (H3) to overlap with the high energetic demands during peak parturition. Alternatively, non-pregnant elk do not have the same energetic demands associated with late-pregnancy and lactation during late spring (Cook et al., 2004). Therefore, we hypothesized that body fat for this group would be positively associated with wet, cool conditions during fall and late-season vegetative growth (H4). Because non-lactating but previously pregnant elk were exposed to the energetic demands of gestation but an unknown period of lactation, we predicted body fat would be positively associated with wet, cool conditions during the growing season, but these relationships would be less pronounced than for elk that lactated until autumn (H5).
Materials and methods
Study area
Our study took place at the Starkey Experimental Forest and Range (Starkey) in northeast Oregon, USA. Starkey is surrounded by a 2.4-m high fence that prevents immigration or emigration of large ungulates and divides the landscape into three separate study areas (Figure 1, Rowland et al., 1997). The Starkey fence encloses an area large enough to allow elk to range freely and establish home ranges similar in size to elk spring–fall ranges in northeast Oregon, but also provides the controls necessary to measure animal responses to specific experimental manipulations (Wisdom, 2005). The largest study area, Main pasture (MAINS; 78 km2), was composed of dry mixed-conifer forests dominated by a mosaic of Douglas fir (Pseudotsuga menziesii), grand fir (Abies grandis), ponderosa pine (Pinus ponderosa), lodgepole pine (P. contorta), and by thin-soiled grasslands that are characteristic of spring and summer ranges for elk in the region (Stewart et al., 2006). The two other study areas, Northeast East pasture (NEEAS; 8.4 km2) and Northeast West pasture (NEWES; 6.1 km2), were divided in 1997 into equal proportions of vegetation types to allow for experimental manipulation of elk population densities to evaluate a variety of population and vegetation responses (Stewart et al., 2005, 2006). The primary drivers for variation in vegetation communities at Starkey were slope, aspect, soil depth, soil type, and elevation. Elevations ranged from 1120–1500 m with rolling uplands and steep canyons. In addition to elk, wild ungulates, including mule deer (Odocoileus hemionus) and white-tailed deer (O. virginianus) were present. Cattle (Bos taurus) were grazed in MAINS, but not NEEAS and NEWES, from Jun 15 to Oct 15 each year. Several carnivores occurred in the study area including mountain lions (Puma concolor), American black bears (Ursus americanus), coyotes (Canis latrans), and bobcats (Lynx rufus). Wolves (Canis lupus), while present in Oregon, did not use Starkey on a regular basis during the study period. Individual wolves were observed using the area adjacent to Starkey from 2016–2019 and the first successfully breeding pack of wolves adjacent to Starkey was documented in 2020 (ODFW, unpublished data). GPS location data indicated these wolves would occasionally utilize Starkey but were primarily using areas outside the fenced area.
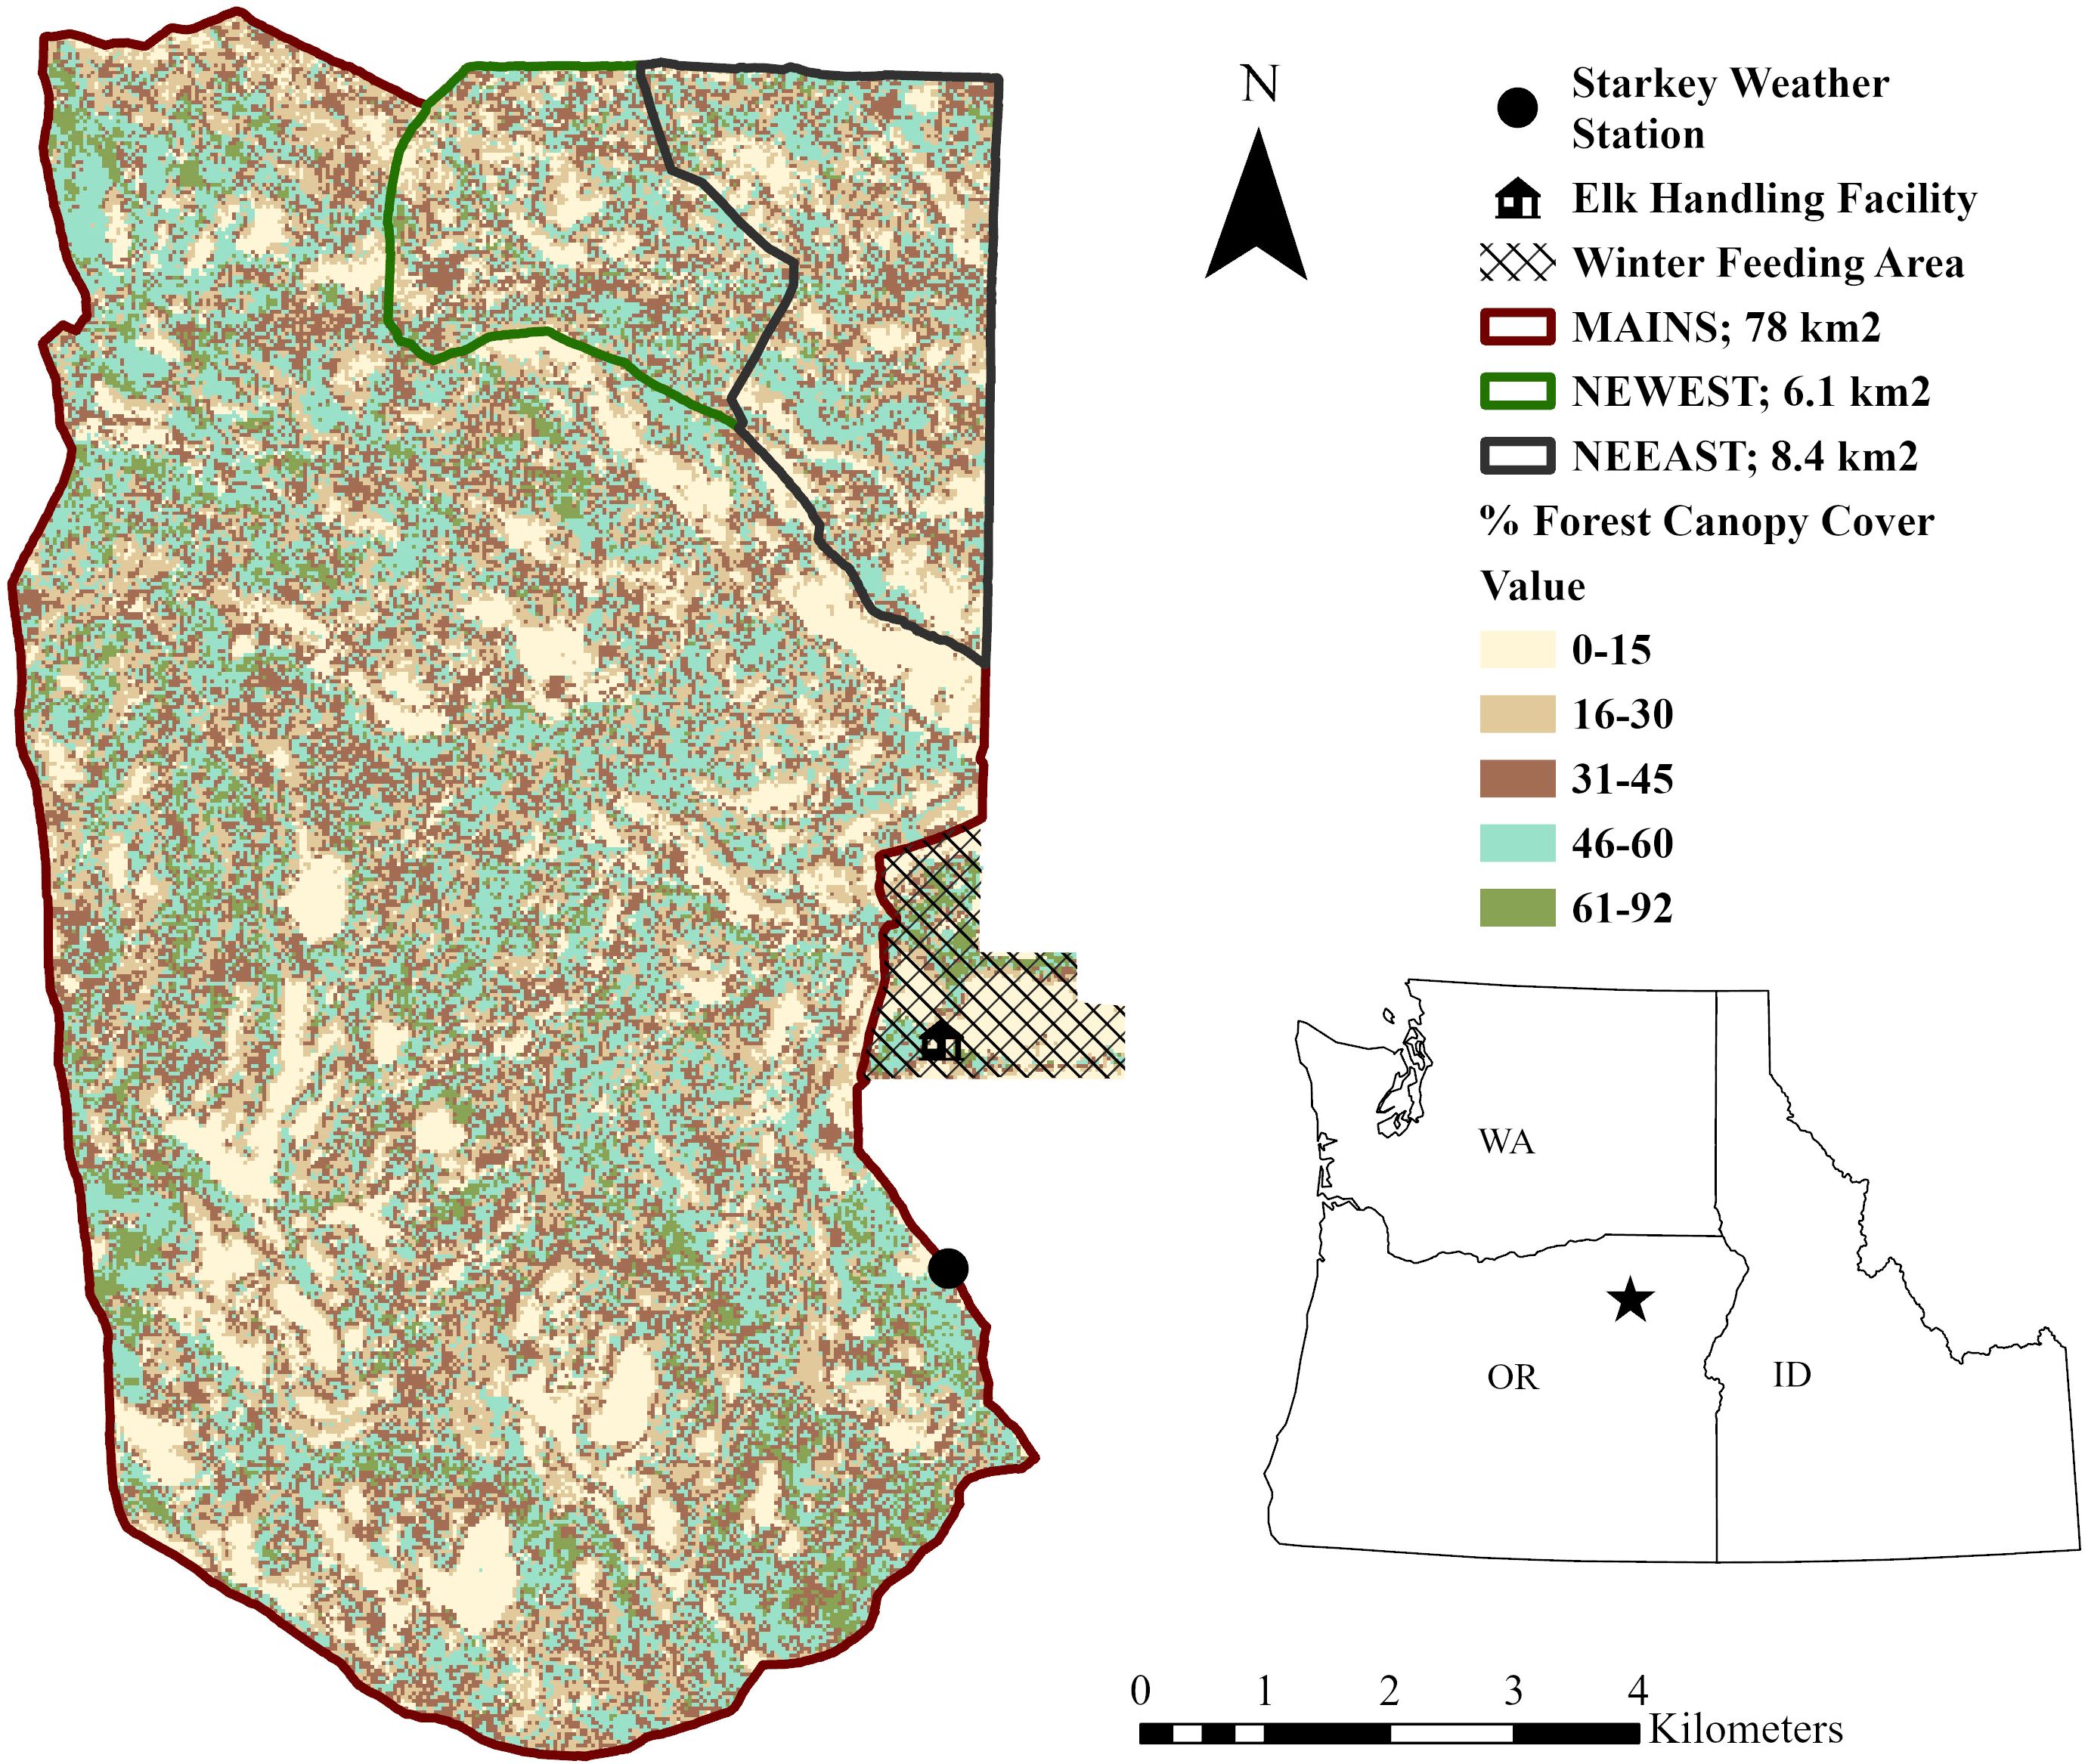
Figure 1. Starkey Experimental Forest and Range, Oregon, USA, is divided into three major study areas: Main pasture (MAINS; 78 km2), northeast east (NEEAS; 8.4 km2), and northeast west (NEWES; 6.1 km2). Solid black lines denote an ungulate-proof fence. Canopy cover and vegetation types were relatively consistent across all three pastures.
Seasonal climate and NDVI measurements
From the weather station and vegetative data sources below, we derived a list of covariates to characterize important forage conditions at specific phases of the growing season (see Table 1 for descriptions). Early season metrics represent a period of peak nutritional quality (Middleton et al., 2013; Mysterud and Austrheim, 2014); peak season metrics represent a period of heightened plant productivity (Pettorelli et al., 2005); and late season metrics represent a period with declining forage quality and quantity (Hurly et al., 2014, Brown et al., 2022). The complexities of these covariates were chosen to parse how specific timing of climate conditions surrounding the growing season may affect elk, as climate change may influence not only the occurrence but also the within-year timing of extreme weather events.
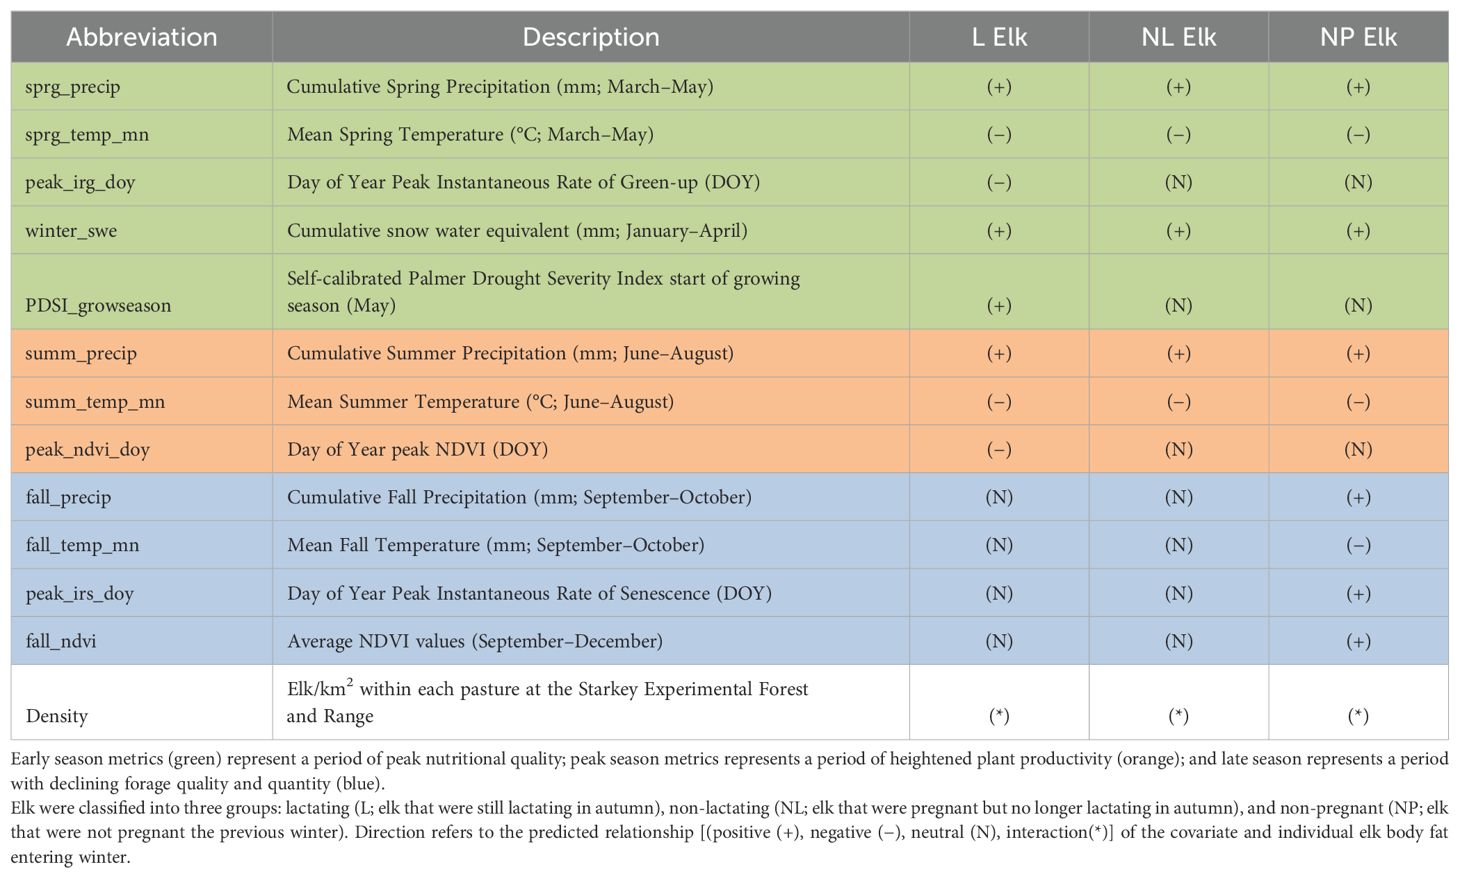
Table 1. Covariates considered in regression models for scaled MAXFAT (scMAXFAT) of elk, along with text abbreviation, description, and predicted direction of relationships on population-scale drivers of elk body fat.
Precipitation and temperature data were recorded at the Starkey Headquarters (STKY-HQ) weather station positioned centrally in the study area (Figure 1). A Snowpack Telemetry Network (SNOTEL (ID- 422); elevation 1482 m) was located 1 km south of MAINS, and a Remote Automatic Weather Station (RAWS (J-Ridge); elevation 1572m) was located 15 km south of MAINS. To fill missing data, we used an autoregression 2 step (AR2) which takes the preceding dates to average missing temperatures. All data were checked for range and pattern including seasonal trend decomposition. We validated temperature data from STKY-HQ with daily temperatures from SNOTEL and RAWS to compare seasonal patterns and trends. We confirmed that STKY-HQ monthly temperatures were highly correlated with datasets from both stations (SNOTEL r=0.98; RAWS r=0.98). We used precipitation data from SNOTEL to calculate cumulative monthly precipitation and snow water equivalent (SWE). Cumulative precipitation included all forms of precipitation (e.g., rain and snow), while SWE approximates the amount of meltwater available as runoff (Li et al., 2017).
Daily mean air temperature (°C) and cumulative precipitation (mm) were recorded and averaged over 3 time periods: spring (Mar–May), summer (Jun–Aug), and fall (Sep–Oct); these periods corresponded to distinctly different periods of forage phenology (Brown et al., 2022). We resampled SWE (mm) to monthly averages and summed across four months (Jan–Apr) to represent the snowpack in late winter through early spring. In addition, we used the self-calibrated Palmer Drought Severity Index (scPDSI; monthly time interval) from the West Wide Drought Tracker to estimate drought intensity (Abatzoglou et al., 2017). The scPDSI was calculated based on temperature, precipitation, available water capacity of the soil, and heat index data (Karl, 1986). Unlike stand-alone temperature and precipitation values, scPDSI estimates the difference between the actual precipitation and the amount of water needed to achieve water balance and has become a commonly used index of drought (Palmer, 1965). Negative numbers represent severe droughts, and above-average moisture is represented by positive numbers. Previous work at Starkey has documented the onset of peak understory green-up between late April and early June (Brown et al., 2022). Thus, we extracted scPDSI values each year for the month associated with peak vegetative growth (May).
We defined forage green-up and senescence as the instantaneous rates of green-up (IRG) and senescence (IRS). In Google Earth Engine, we combined data from moderate resolution imaging spectrometer (MODIS) Terra (MOD13Q1) and Aqua (MYD13Q1), resulting in images 8 d apart and a resolution of 250 m x 250 m. We followed the steps outlined by Bischof et al. (2012), to ensure that the time series were filtered, smoothed, and scaled between 0 and 1, where higher values indicate greener vegetation (Supplementary Data Sheet 1). For each pasture in our study area and each year of our study, we fit a double-logistic curve to the time series of Normalized Difference Vegetation Index (NDVI) values at that location. We calculated IRG by taking the first derivative of the curve that overlapped with spring and calculated the date on which IRG had the highest value. This date represents the day early-season plant growth was changing the fastest within each pasture, thus representing the highest forage resource availability for elk. In addition to peak IRG, we extracted the day of the year when NDVI was at its highest value as a proxy for peak vegetation biomass (Pettorelli et al., 2005) available for elk. To calculate the IRS, we extracted the first derivative of the NDVI curve covering late summer as a direct rate of senescence and calculated the date that IRS had the highest value (Rivrud et al., 2016). We also extracted average NDVI values for each pasture from September 1–November 30 since Starkey is characterized by autumn rains that can promote late-season green-up during some years.
Elk population size and body condition
We used two approaches that accounted for differences in historical management practices to estimate the elk population for each pasture. The NEEAS and NEWES pastures have been managed more intensively than MAINS to allow experimental comparisons of two population densities of elk (Stewart et al., 2005, 2006, 2009). Between 2002–2021, elk in NEEAS were held at high densities (=8.1; standard deviation [SD=1.8] female elk/km2) while elk in NEWES were held at low densities (=3.1; standard deviation [SD=0.5] female elk/km2). Relatively constant elk densities in each pasture could be maintained because elk were baited into the winter-feeding area (IACUC 92-F-0004; Wisdom et al., 1993) during early winter (Nov 1–Jan 31) and released back into their pastures in spring (Mar 1–Mar 30; Rowland et al., 1997). In general, most elk in these two pastures returned to the winter-feeding area, but efforts were made annually to document any elk that remained in these study areas over winter, which were primarily adult males. Age and sex classes were counted for all elk entering the winter feed ground, resulting in counts of three age classes: calves, adult males, and adult females.
Elk in MAINS were also baited into the winter-feeding area. However, the percentage of animals entering the area varied across years and was highly dependent on early winter snow conditions, making winter counts unreliable to estimate population size. Thus, we used an integrated population model (IPM) to estimate the yearly abundance of elk entering the winter area from MAINS (Supplementary Data Sheet 2). In our statistical models, we converted yearly abundance estimates of adult females for MAINS and yearly counts of adult females for NEEAS and NEWES to densities (elk/km2).
To assess body condition, we handled all calves and adult female elk as they entered the winter-feeding area. Elk were first moved through a system of fences into a squeeze chute upon capture and weighed on an electronic platform scale (± 1 kg). For elk handled in prior years, individuals were first identified by their unique ear tags, and the pasture location from the previous summer was recorded, providing individual capture histories each year. For elk that had not previously entered the winter-feeding area, ear tags and the pasture of capture were assigned. We obtained blood samples from each female to determine pregnancy status based on the concentration of pregnancy-specific protein B (Noyes et al., 1997). Following data collection, elk were released into the winter-feeding area where they were provided a maintenance diet of alfalfa (Rowland et al., 1997). This design allowed us to minimize variation in body fat during winter and associate fall body condition with the spring, summer and fall periods.
We quantified animal condition using standard protocols developed for elk, which included measuring maximum subcutaneous rump-fat thickness (MAXFAT; Stephenson et al., 1998) via ultrasonography (Cook et al., 2001) and assigning a rump body condition score via palpation. We allometrically scaled individual rump-fat with body mass, providing a scaled MAXFAT measurement (scMAXFAT; Supplementary Data Sheet 3). In animals with<0.3 cm of rump fat, ultrasound fat measurements become difficult to interpret, thus body-condition scoring has been used to evaluate animals with little to no fat (Cook et al., 2001). Because body condition scoring is prone to error, and our scores have not been validated to estimate ingesta-free body fat (Cook et al., 2010), we evaluated body condition using scMAXFAT conversions. We acknowledge that scMAXFAT for animals with<0.3 cm rump fat lacks precision (Cook et al., 2010), but measurements were taken at the same location on each animal consistently within and across years and should represent the minimum fat measurements of each animal. Additionally, maximum rump fat is linearly correlated across a broad range of total body fat values and has been widely used to predict population-level condition (Keech et al., 2000; Stephenson et al., 2002; Parker et al., 2005; Gustine et al., 2007).
We grouped female elk according to lactation status at the time of early-winter handling and from pregnancy status from the previous year, if known. We only used records for animals handled between Nov 1–Dec 31 to better reflect that year’s growing season conditions on scMAXFAT going into winter. Additionally, since calf elk wean gradually and nursing bouts become less frequent throughout the winter (Flook, 1970), identifying lactation status earlier in winter will likely provide more accurate assessments. Finally, we restricted our sample to only females with high reproductive capacity (3–13 years of age; Trainer, 1971). We classified females as lactating when milk could be extracted from the udder at the time of handling, which indicated that either a female was still nursing a calf or had recently been nursing a calf (Flook, 1970). Non-lactating females included individuals pregnant the previous year but no longer lactating when handled in early winter. Non-lactating females had presumably lost their calves and thus lactated an unknown portion of the current year. Our last group, non-pregnant females, included individuals who were not producing milk at the time of handling and for which pregnancy tests from the previous year’s capture history yielded negative results.
Statistical modeling
We first considered different models to decide how best to address the challenge of analyzing MAXFAT levels recorded at zero, values that represent complete rump fat depletion. However, we encountered a minimal number of these measurements (16 out of 1,937). Thus, we first modeled scMAXFAT values as recorded using normal linear regression. The results clearly demonstrated substantial deviations from the modeling assumptions, specifically overdispersion in the residuals. Consequently, we replaced the 16 values of scMAXFAT = 0 with ½ of the next smallest observed value in our data set to provide a relative value of poor condition and modeled scMAXFAT using gamma regression with a log link (McCulloch et al., 2008). We chose this model because the distribution of the slightly modified scMAXFAT values was strictly positive, continuous, and right-skewed (McCulloch et al., 2008). We fit a list of gamma regression models for each lactation group and ranked models within each group using the Bayesian information criterion (BIC; Burnham and Anderson, 2002). We recognized that we sampled some elk more than once from our 2002–2021 analysis period; thus, we used the total number of unique elk in our sample as n in the calculation of BIC. The model set we developed included models ranging from one bottom-up covariate (Table 1; excluding density) up to a maximum of five uncorrelated (Pearson’s |r|< 0.6; Supplementary Data Sheet 4) bottom-up covariates plus density and the interaction of one bottom-up covariate and density. We chose to limit the size of the models to match our objectives of exploration and explanation rather than maximizing the predictive abilities of the models and risk overfitting based on a data set that is limited in geographic scope.
We used BIC to select interaction terms for inclusion in the list of all possible models for each lactation group (Supplementary Data Sheet 5). To do this, we fit univariate models, two-covariate models (univariate + density), and models with the interaction between the covariate and density (interaction model). We included interaction terms for covariates in the list of all possible models for a lactation group when the BIC (interaction model)< BIC (univariate + density model)< BIC (univariate model; Supplementary Data Sheet 5). We emphasize that fitting an extensive list of models to a set of carefully chosen covariates is not a “shot-gun” attempt to find the best model but an evaluation of a “realistic set of candidate predictors” (Whittingham et al., 2006).
The standard gamma regression model assumes independence between observations (McCulloch et al., 2008). Although we sampled some elk in more than one year, as noted above, the small number of repeated measurements on the same individual over time precluded fitting a random effect for individual elk to account for the lack of independence. Instead, we bootstrapped individual elk 2,000 times for each model and calculated 90% confidence intervals (CIs) for each coefficient using the central 90% of the bootstrap estimates (Manly, 2018). Resampling the individual elk retains the dependent nature of the data and reduces bias in estimates of precision (Deen and de Rooij, 2020). This process has been called cluster or block bootstrapping (Zieffler et al., 2011; Deen and de Rooij, 2020).
We reported the top twenty models fit for each lactation group and the relative proportion of times each covariate was in the top twenty models, compared to random chance. For example, if a covariate was in 15 of the top 20 models based on BIC rankings and in 80 of a total of 200 models, the ratio would be 15/20 ÷ 80/200 = 1.75, whereas a covariate in 3 of the top 20 models and 80 of the 200 models the ratio would be 0.38. A ratio of 1 (e.g., 9 of the top 20 and 80 total) is expected for the number of times a covariate is in the top 20 models by random chance, provided covariates are uncorrelated. Even if some covariates across models were correlated, we viewed these ratios as measures of variable importance among the models considered.
We plotted the marginal effects for covariates in the regression models with the lowest BIC for each lactation group. Marginal plots show the estimated relationship between scMAXFAT and a single covariate while holding all other model covariates constant at their median values. In parallel, we calculated the marginal relationships, or odds ratios (Hosmer et al., 2013), between model covariates and scMAXFAT using [exp(βi)−1]×100%, where βi was the estimated coefficient for covariate Xi. The odds ratios provided the estimated percent change in scMAXFAT with a one-unit change in covariate Xi, holding all other covariates in the model constant. Odds ratios for covariates involved in interaction terms in the model cannot be interpreted, but their effects can be displayed graphically in marginal plots. We calculated 90% CIs for the odds ratios by bootstrapping the individual elk.
We evaluated the goodness-of-fit of each model by comparing observed scMAXFAT values to those predicted by a gamma regression model. We made scMAXFAT predictions for each observation in our data set, and we correlated the average of the predicted values in each year (2002–2021) to the average of the observed values. In addition, we used k-fold cross-validation (Hjorth, 1994), with k being individual years, and refitted the model to compare the average observed and predicted values for the hold-out year. We reported Pearson’s correlation coefficient to describe the degree of association between observed and predicted values.
Results
We sampled 408 unique elk from 2002−2021, providing 1,584 records of scMAXFAT for females aged 3–13. We recorded 685 yearly scMAXFAT measurements from 304 females who were lactating, 663 measurements from 317 non-lactating females, and 236 measurements from 175 females who weren’t pregnant the previous year (Figure 2). We replaced 16 records (0.83% of samples) of scMAXFAT = 0 with a value of 0.02. Strong pairwise correlations (|r| ≥ 0.6) existed between a few of the covariates (Supplementary Data Sheet 6). Due to these multicollinearities, we did not include the following covariate pairs in the same model: PDSI_growseason and sprg_precip (r = 0.77), sprg_temp and summ_temp (r = 0.62), and sprg_temp and peak_irg_doy (r = −0.66). Due to multicollinearity, PDSI_growseason, summ_temp, and summ_precip were never included in the same model.
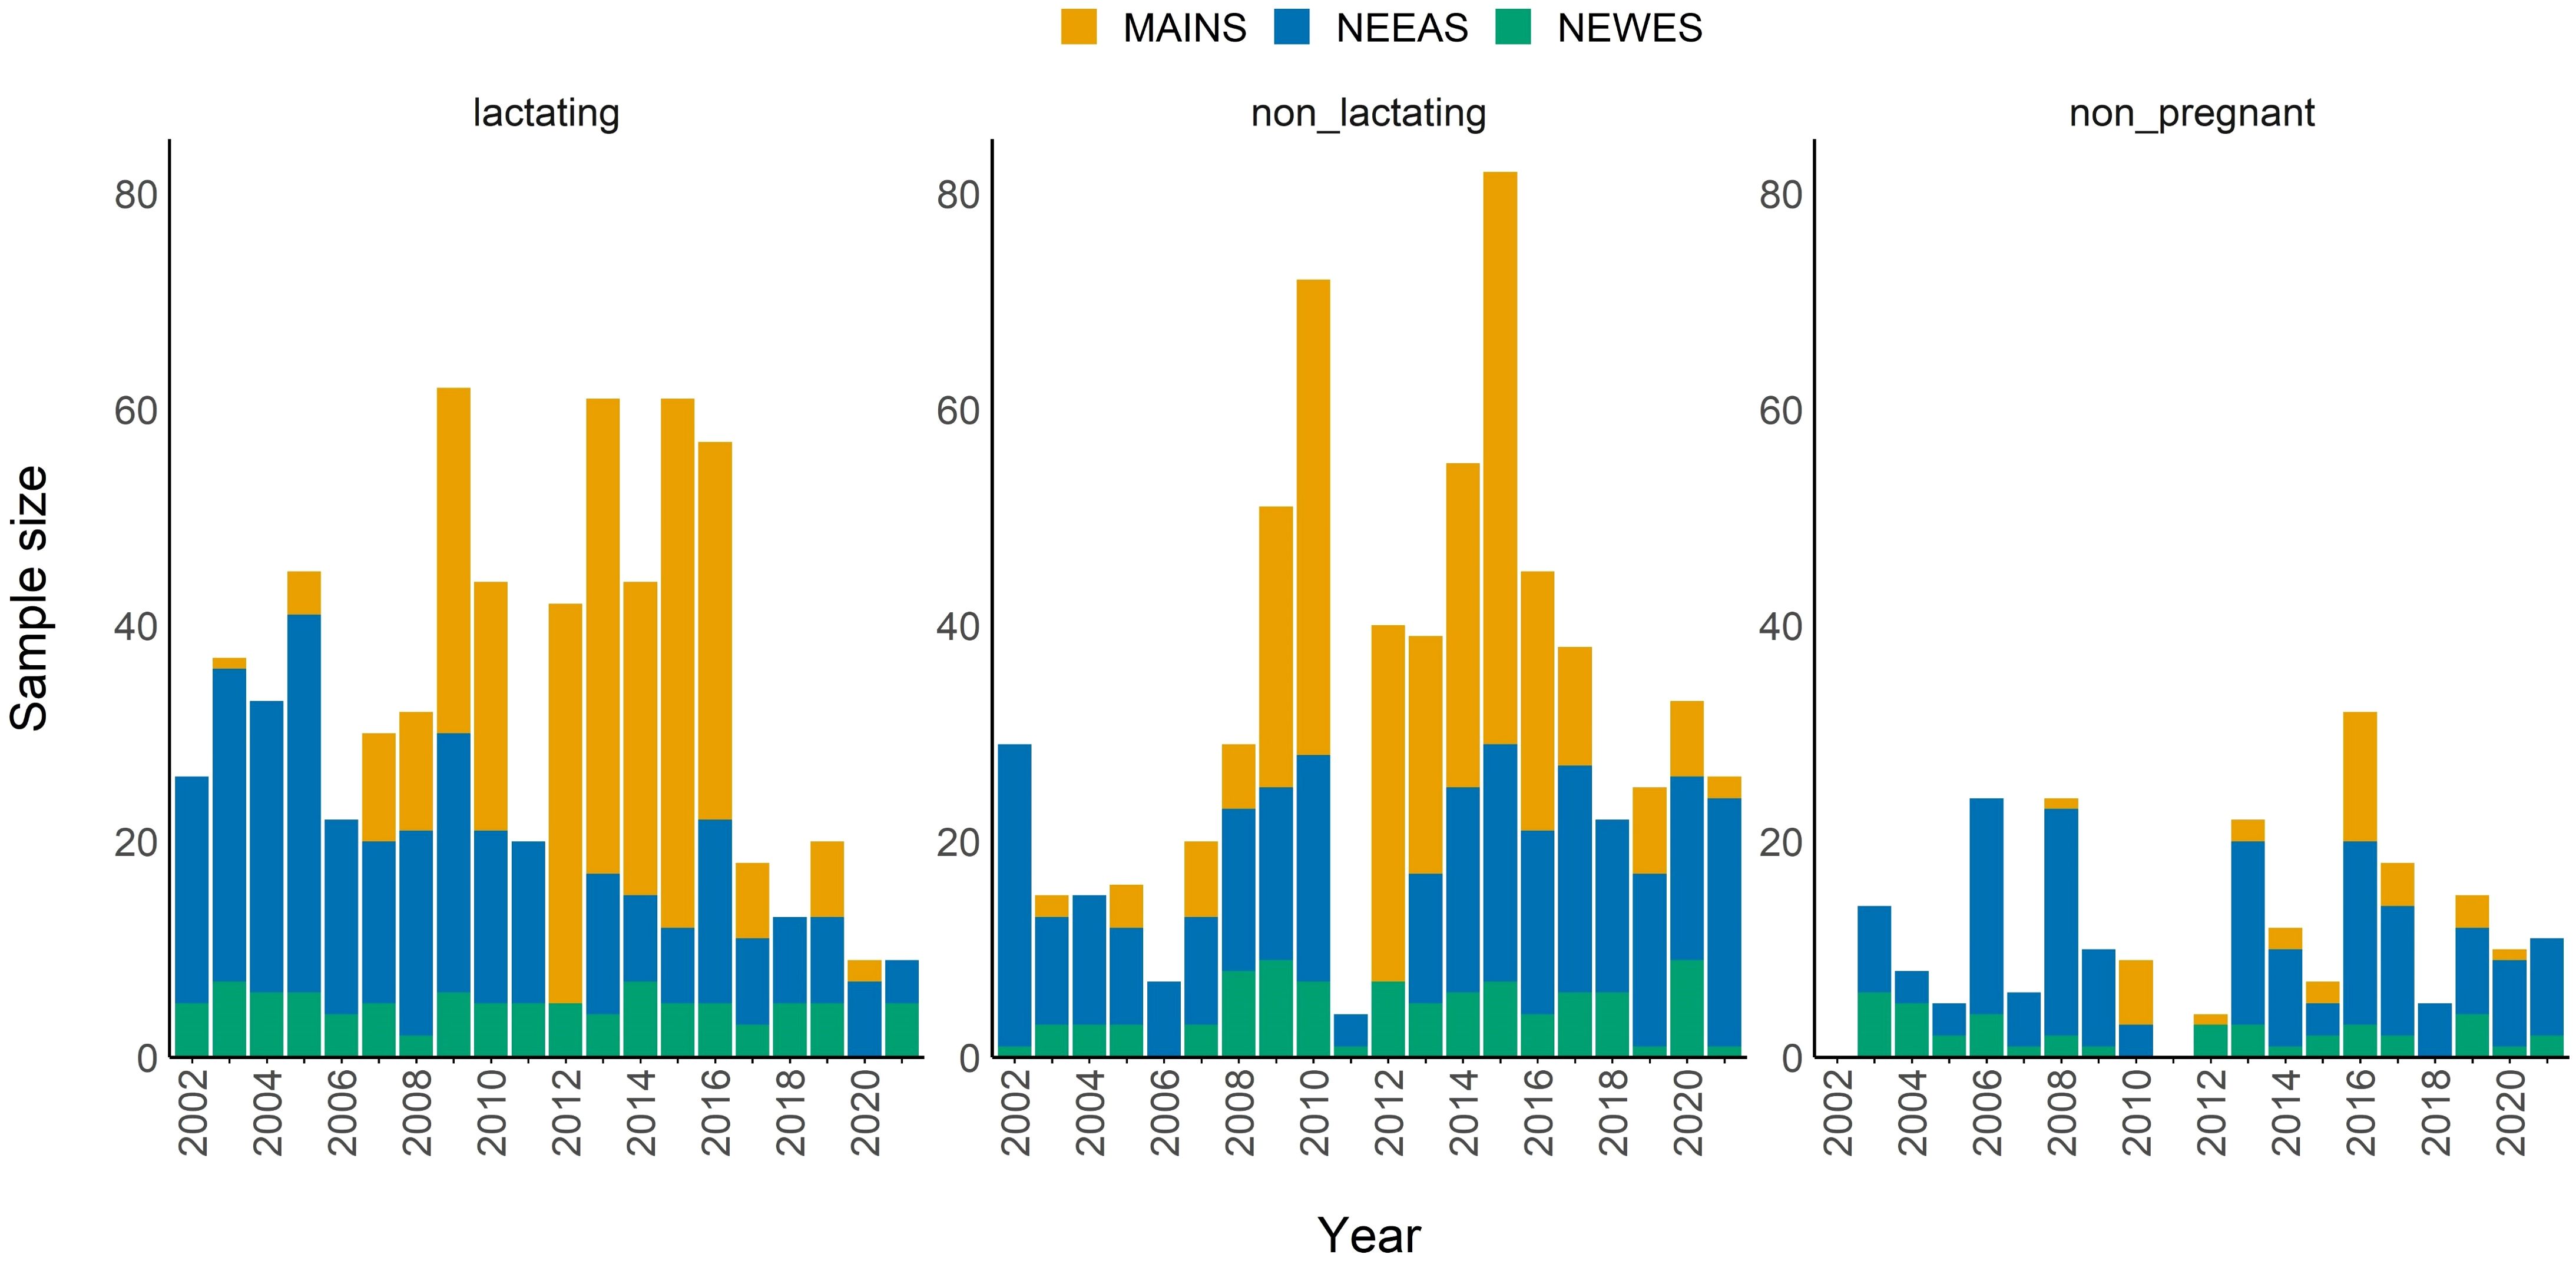
Figure 2. Sample sizes of yearly scaled MAXFAT measurements from female elk who were lactating (n=685), non-lactating (n=663), or non-pregnant (n=236). Colors represent the study areas: Main pasture (MAINS; yellow), northeast east (NEEAS; blue), and northeast west (NEWES; green).
Lactating elk
We included interactions between elk density and sprg_precip, PDSI_growseason, fall_precip, and peak_irs_doy in our list of all possible models for the lactating group, fitting a total of 3,649 models for this group. The top model contained covariates for peak_irg_doy, summ_precip, PDSI_growseason, elk density, and the interaction between PDSI_growseason and density (Table 2). All top twenty models contained the covariates summ_precip, PDSI_growseason, and density (Supplementary Data Sheet 7). The directions of coefficients (+/−) for covariates were consistent across the top 20 models (Supplementary Data Sheet 6), and we consistently estimated that scMAXFAT increased with increasing PDSI_growseason, precipitation (summer or fall), peak_irg_doy, peak_irs_doy, and increased late winter snowpack. The top twenty models also uniformly provided estimates of negative associations between scMAXFAT and increasing fall temperatures or NDVI values (fall_ndvi, peak_ndvi_doy). An interaction between density and PDSI_growseason occurred in twelve of the top twenty models, with the estimated positive relationship between wetter PDSI_growseason and scMAXFAT more pronounced for higher elk densities. The interaction between density and PDSI_growseason ranked highest in variable importance (ratio of proportions=7.52) and was followed by PDSI_growseason (ratio of proportions=3.35), peak_irg_doy (ratio of proportions=3.14) and summ_precip (ratio of proportions=2.81; Supplementary Data Sheet 7).
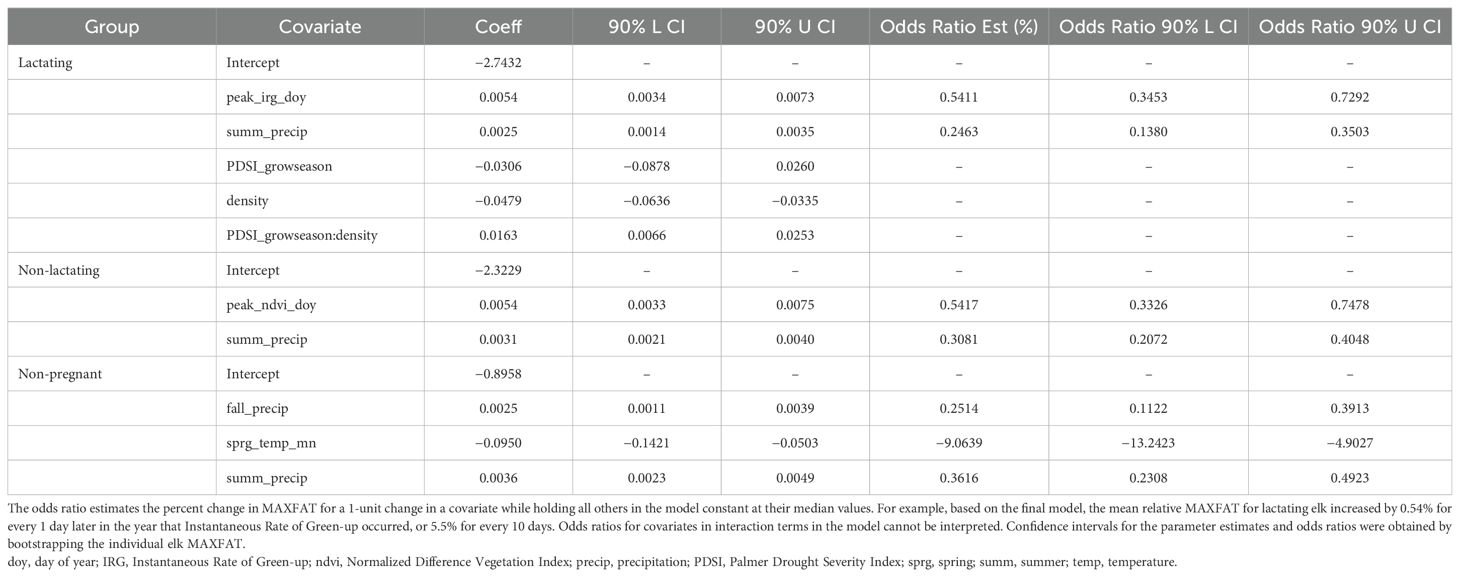
Table 2. Parameter estimates and odds ratios for covariates in the final regression model for scaled MAXFAT of lactating, non-lactating, and non-pregnant elk at Starkey.
The marginal plots for the top model illustrated the clearly positive relationships between peak_irg_doy, summ_prceip, and PDSI_growseason, and that a wetter PDSI_growseason had a stronger effect on scMAXFAT when elk densities were higher (Figure 3). Based on odds ratios in the top model, scMAXFAT would increase by 0.54% for every 1 day later in the year that the peak instantaneous rate of greenup occurred (90% CI from 0.35 to 0.73; every ten days, it would increase by 5.5%: 90% CI from 3.5 to 7.5; Table 2) if holding all other conditions constant at their median values (Figure 3). Similarly, scMAXFAT would increase by 0.25% for every additional mm of summer precipitation (90% CI from 0.14 to 0.35; Table 2). Mean predicted scMAXFAT values for all lactating elk in our data correlated highly with the observed values (r = 0.83; Figure 4). Using k-fold validation, the correlation between the mean observed and predicted scMAXFAT values was 0.72.
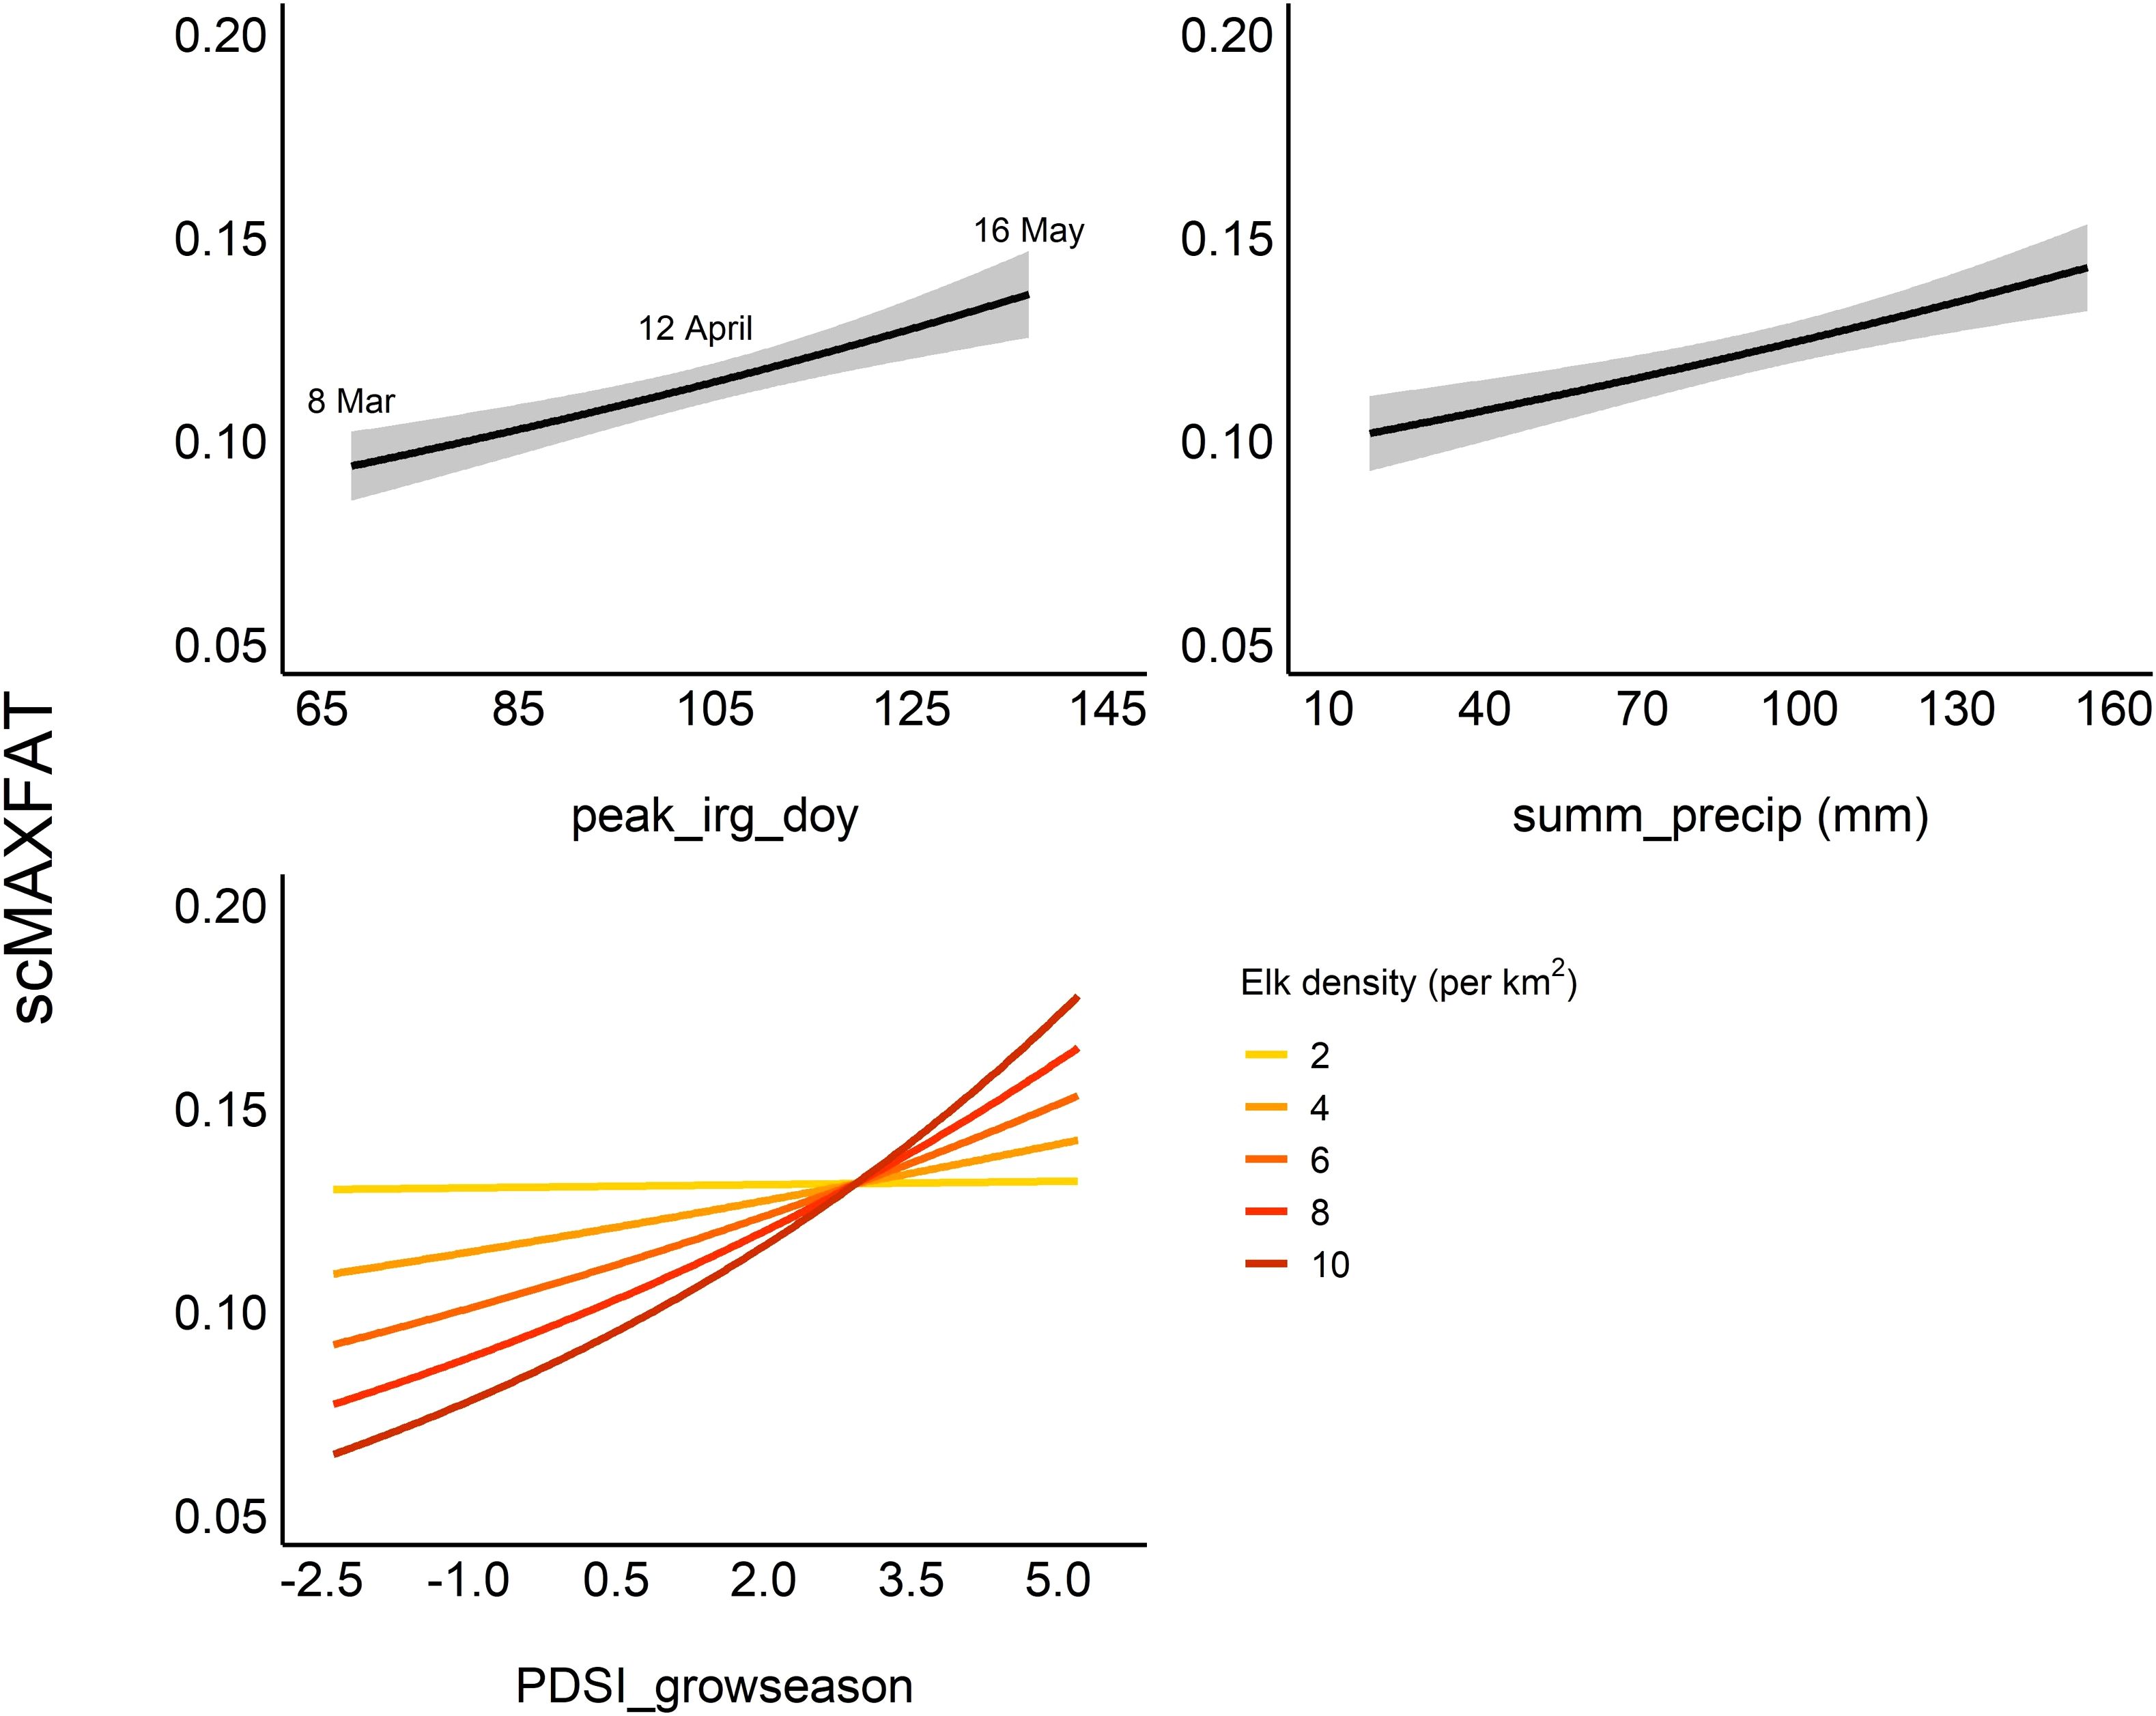
Figure 3. Marginal plots for covariates in the top model for scaled MAXFAT (scMAXFAT) of lactating elk. Each plot shows the estimated relationship between scMAXFAT and a single covariate while holding all other model covariates constant at their median values. The top model contained an interaction between elk density and the Palmer drought severity index for the growing season (PDSI_growseason; bottom left). Summ_precip refers to cumulative summer (Jun–Aug) precipitation (mm), and peak_irg_doy refers to the day of the year with the peak instantaneous rate of green-up.
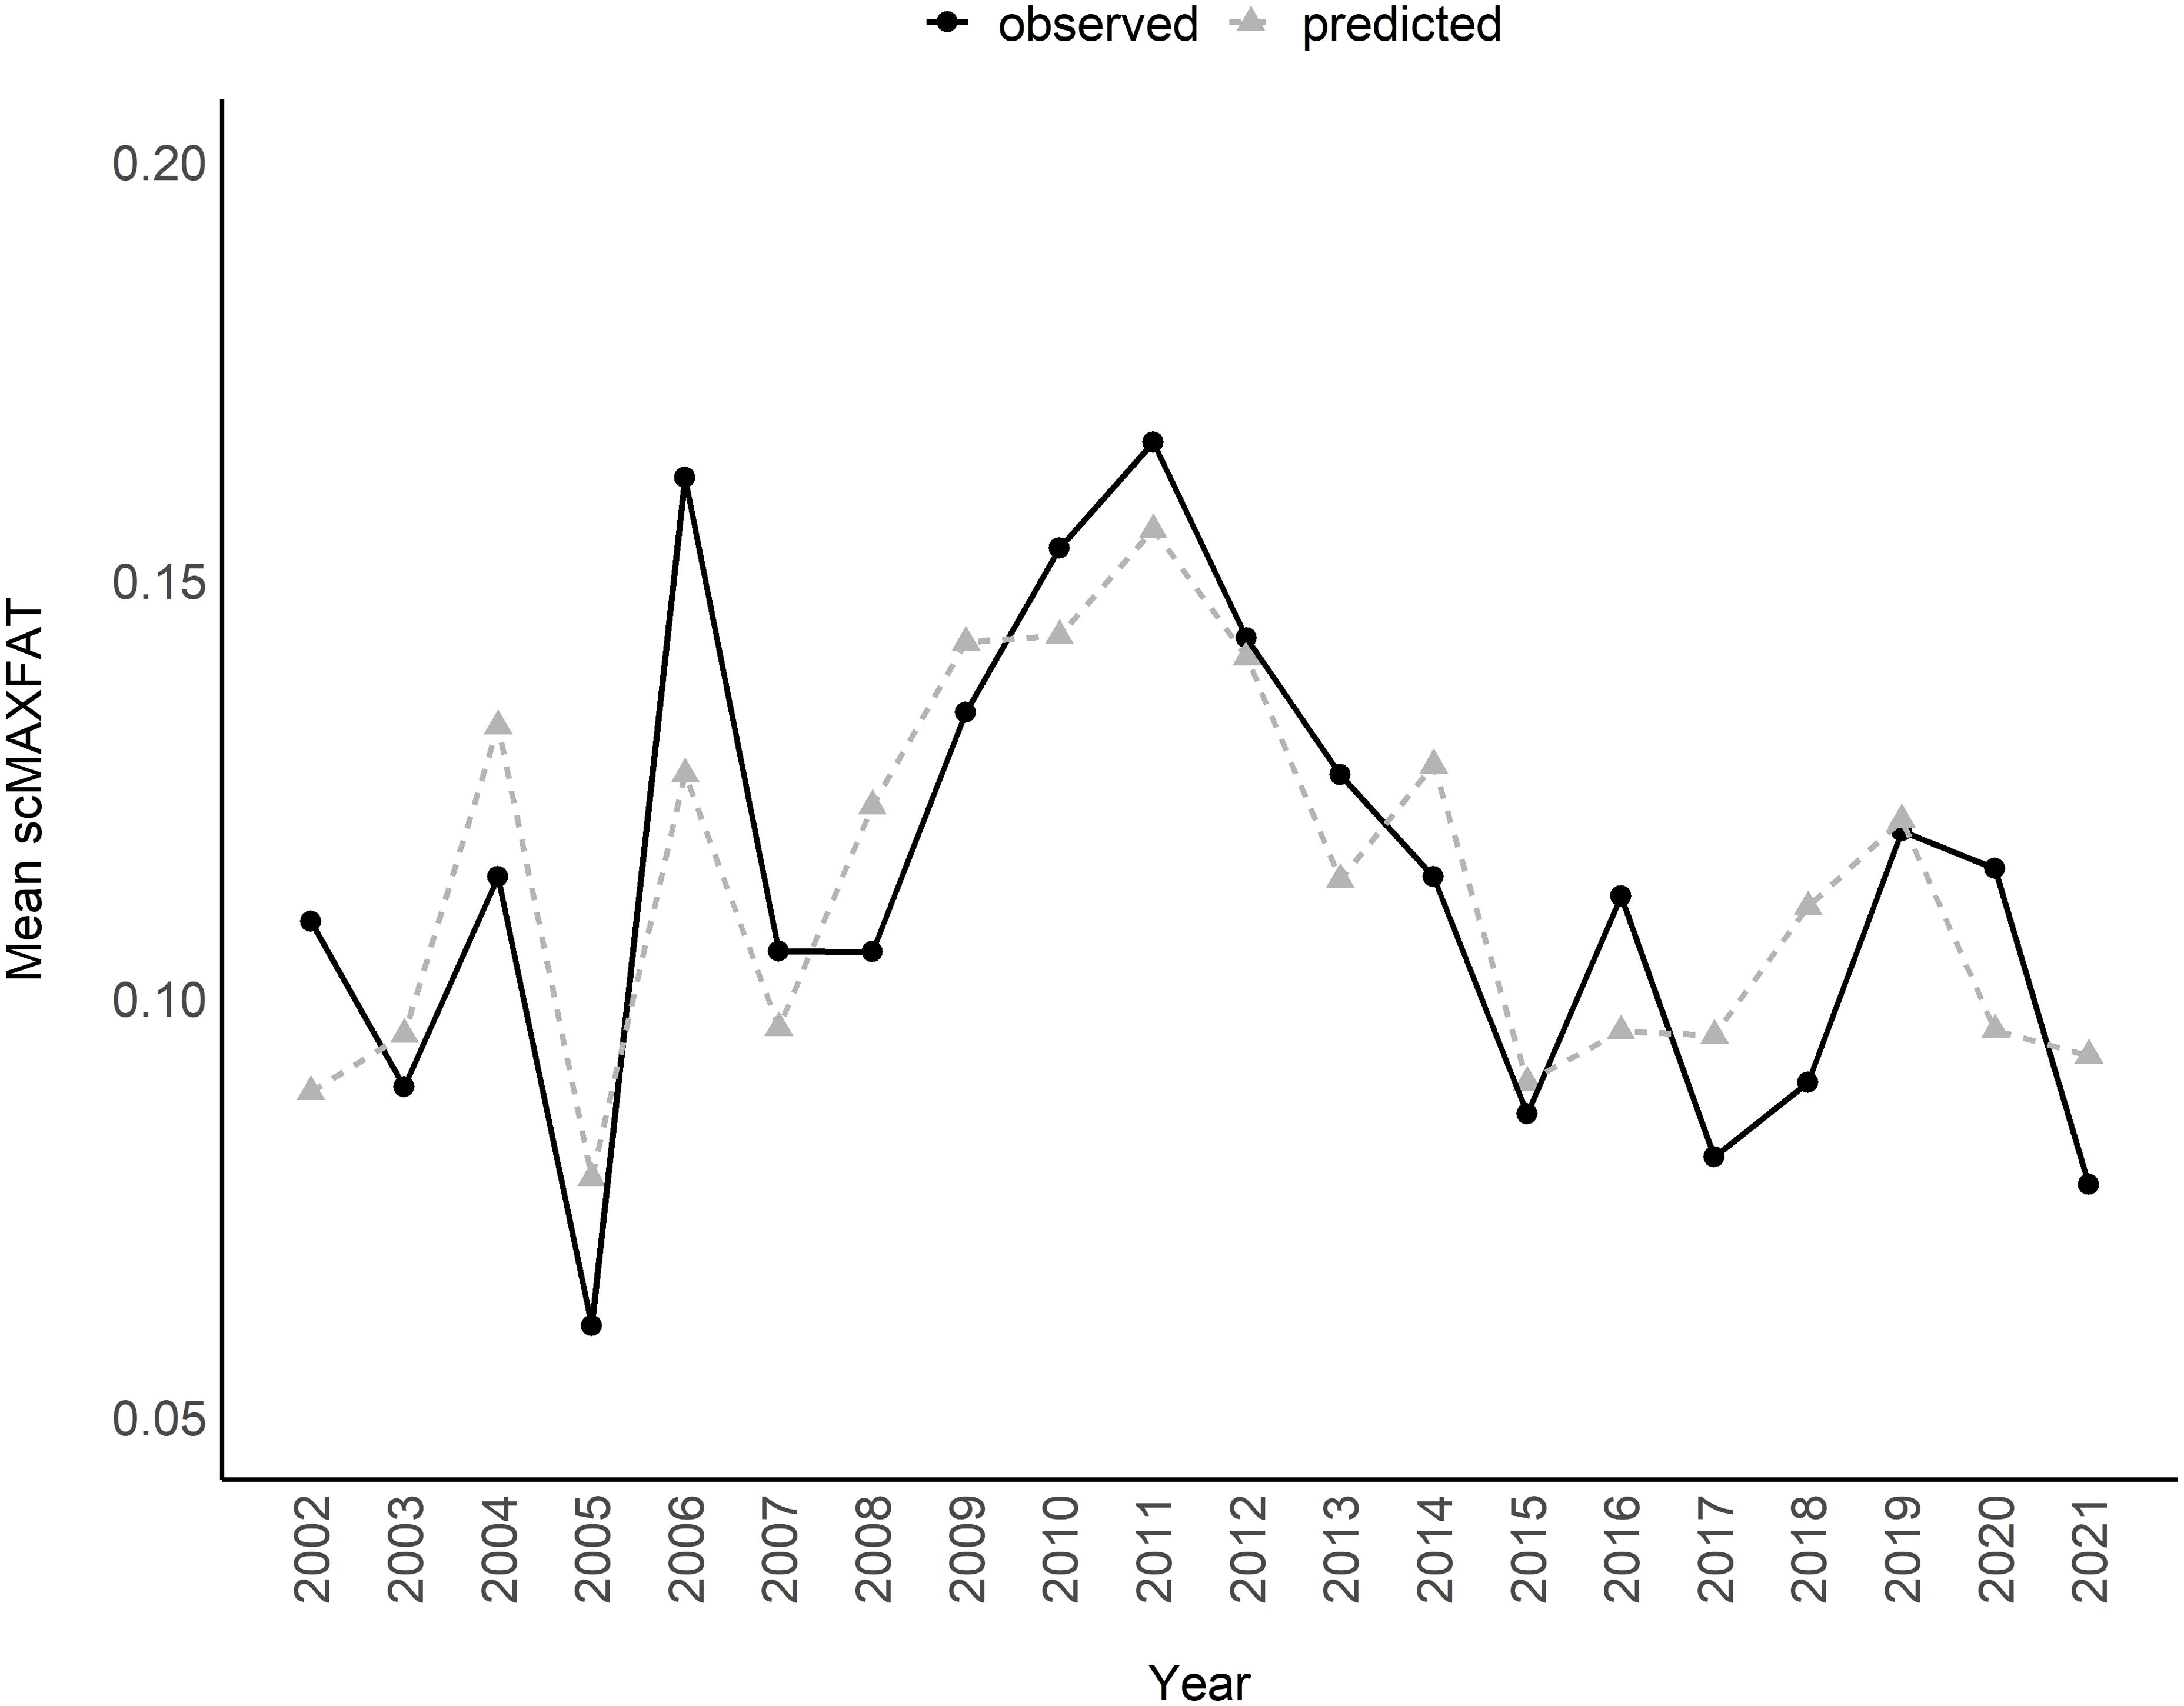
Figure 4. Mean scaled MAXFAT (scMAXFAT) predictions for lactating elk compared to the observed values each year (r = 0.83; 2002–2021).
Non-lactating elk
We did not include interactions between elk density and bottom-up covariates in our list of 2,183 all-possible models for the non-lactating group (Supplementary Table S1). The top model contained covariates for peak_ndvi_doy and summ_precip (Table 2). All top twenty models contained the covariate for summ_precip. The directions of coefficients (+/−) for all covariates were consistent across the top 20 models (Supplementary Data Sheet 6), and we consistently estimated that scMAXFAT increased with increasing peak_ndvi_doy, summ_precip, and PDSI_growseason (Supplementary Data Sheet 6). Summ_precip ranked highest in variable importance (ratio of proportions=2.69) followed by PDSI_growseason (ratio of proportions=1.69), and peak_ndvi_doy (ratio of proportions=1.66; Supplementary Data Sheet 7).
The marginal plots and odds ratios for covariates in the top model predicted that scMAXFAT would increase by 0.54% for every day past peak_NDVI_doy (90% CI from 0.33 to 0.75; every 10 days, it increased by 5.5%: 90% CI from 3.3 to 7.8; Figure 5, Table 2) if holding all other conditions constant. Similarly, scMAXFAT would increase by 0.31% for every additional mm of summer precipitation (90% CI from 0.21 to 0.40; Table 2). Mean predicted scMAXFAT values for all non-lactating elk in our data were strongly correlated with the observed values (r = 0.76; Figure 6). Using k-fold validation, the correlation between the mean observed and predicted scMAXFAT values was 0.64.
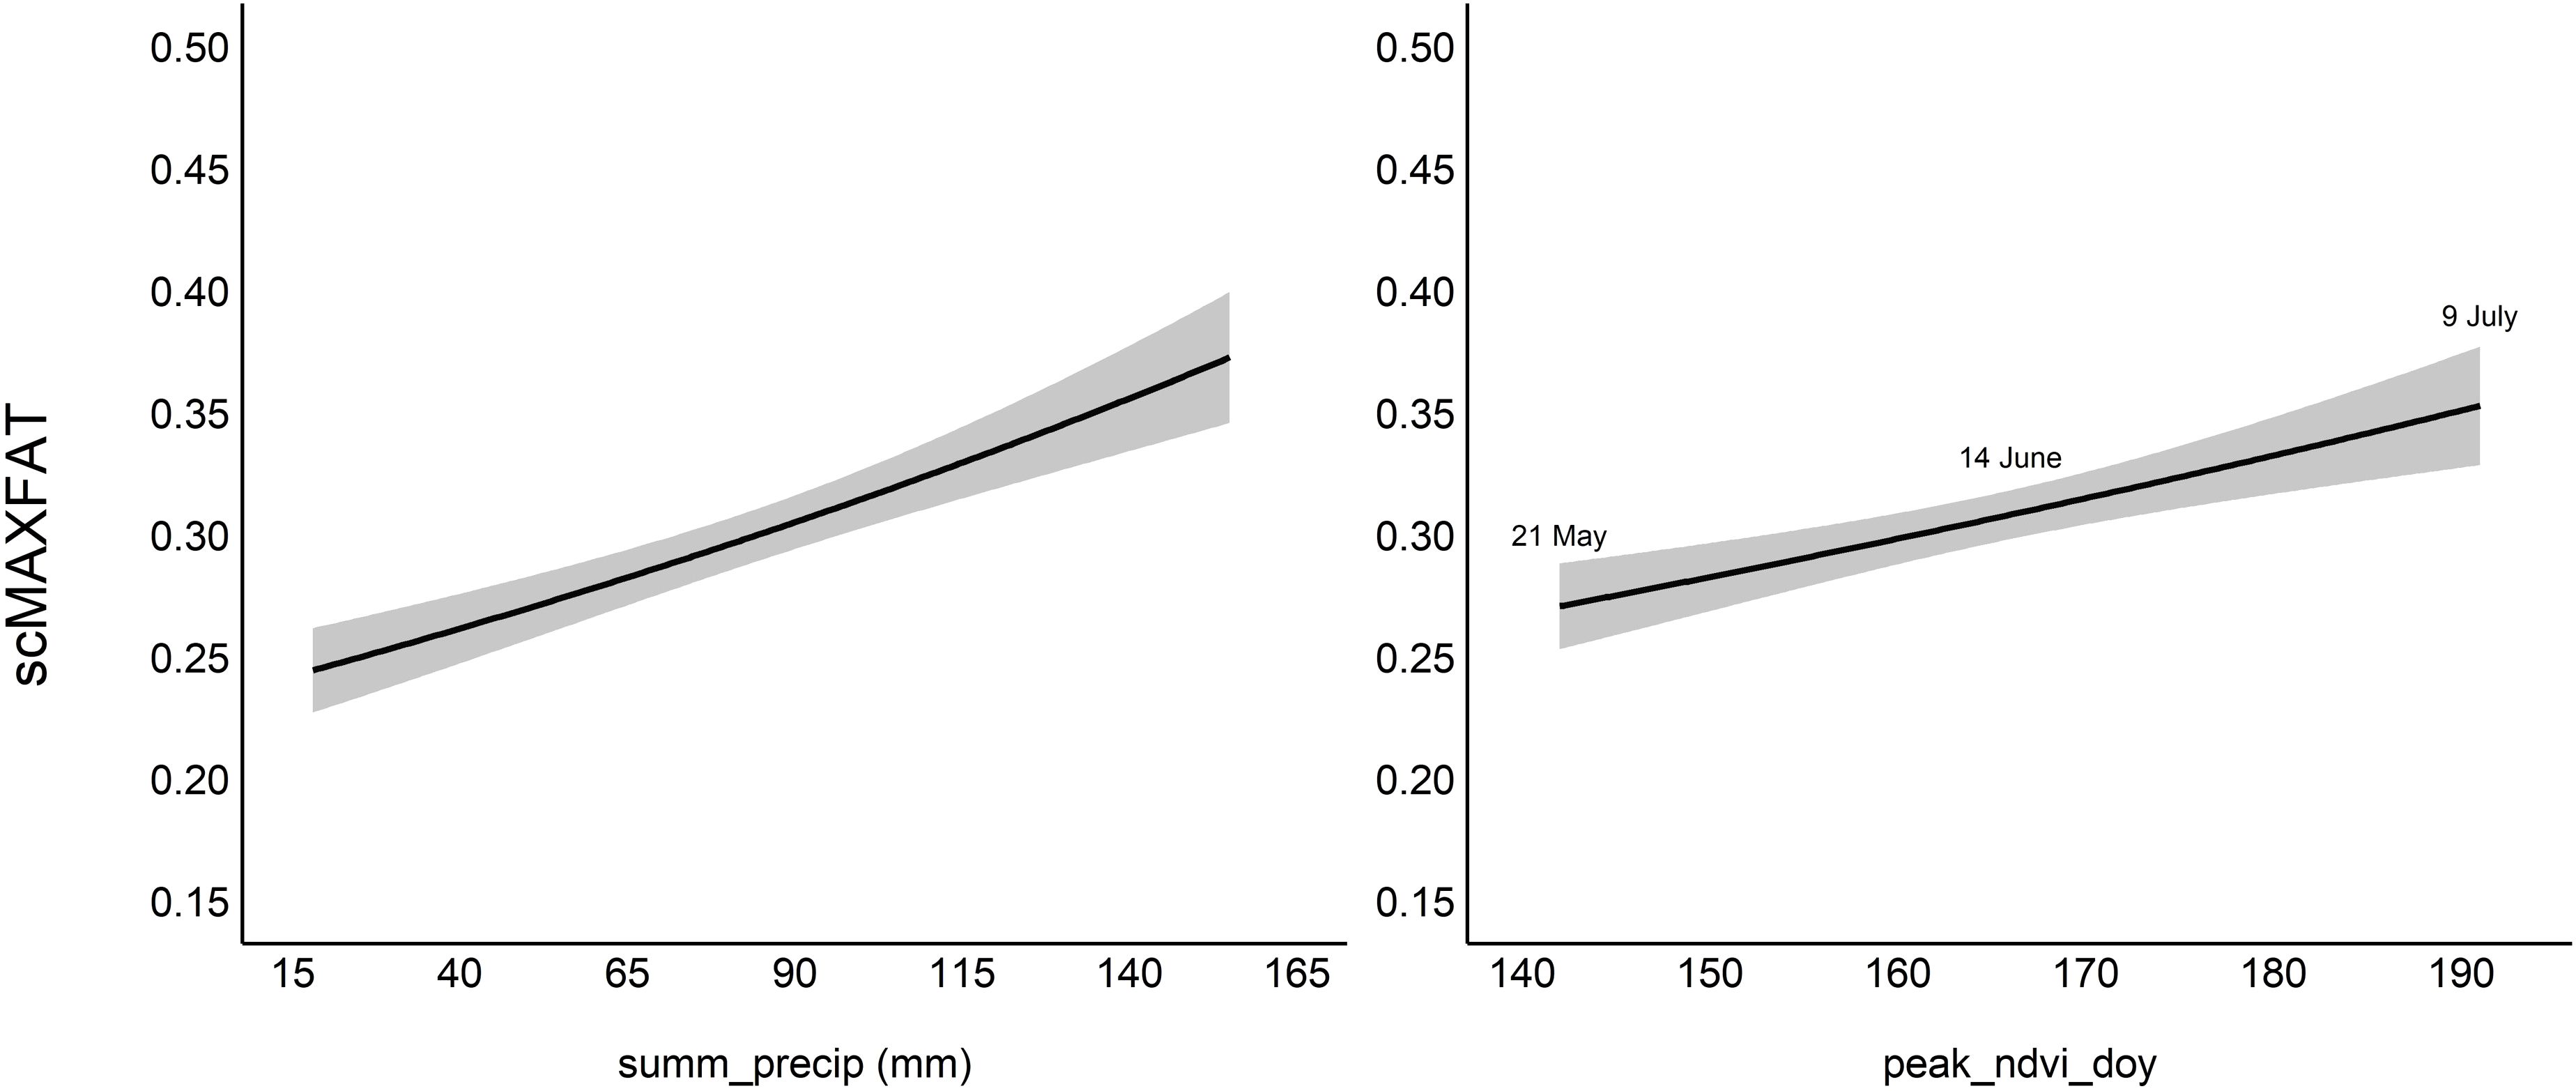
Figure 5. Marginal plots for the top model for scaled MAXFAT (scMAXFAT) of non-lactating elk. Each plot shows the estimated relationship between scMAXFAT and a single covariate while holding all other model covariates constant at their median values. Summ_precip refers to cumulative summer (Jun–Aug) precipitation (mm), and peak_ndvi_doy refers to the day of the year of peak NDVI.
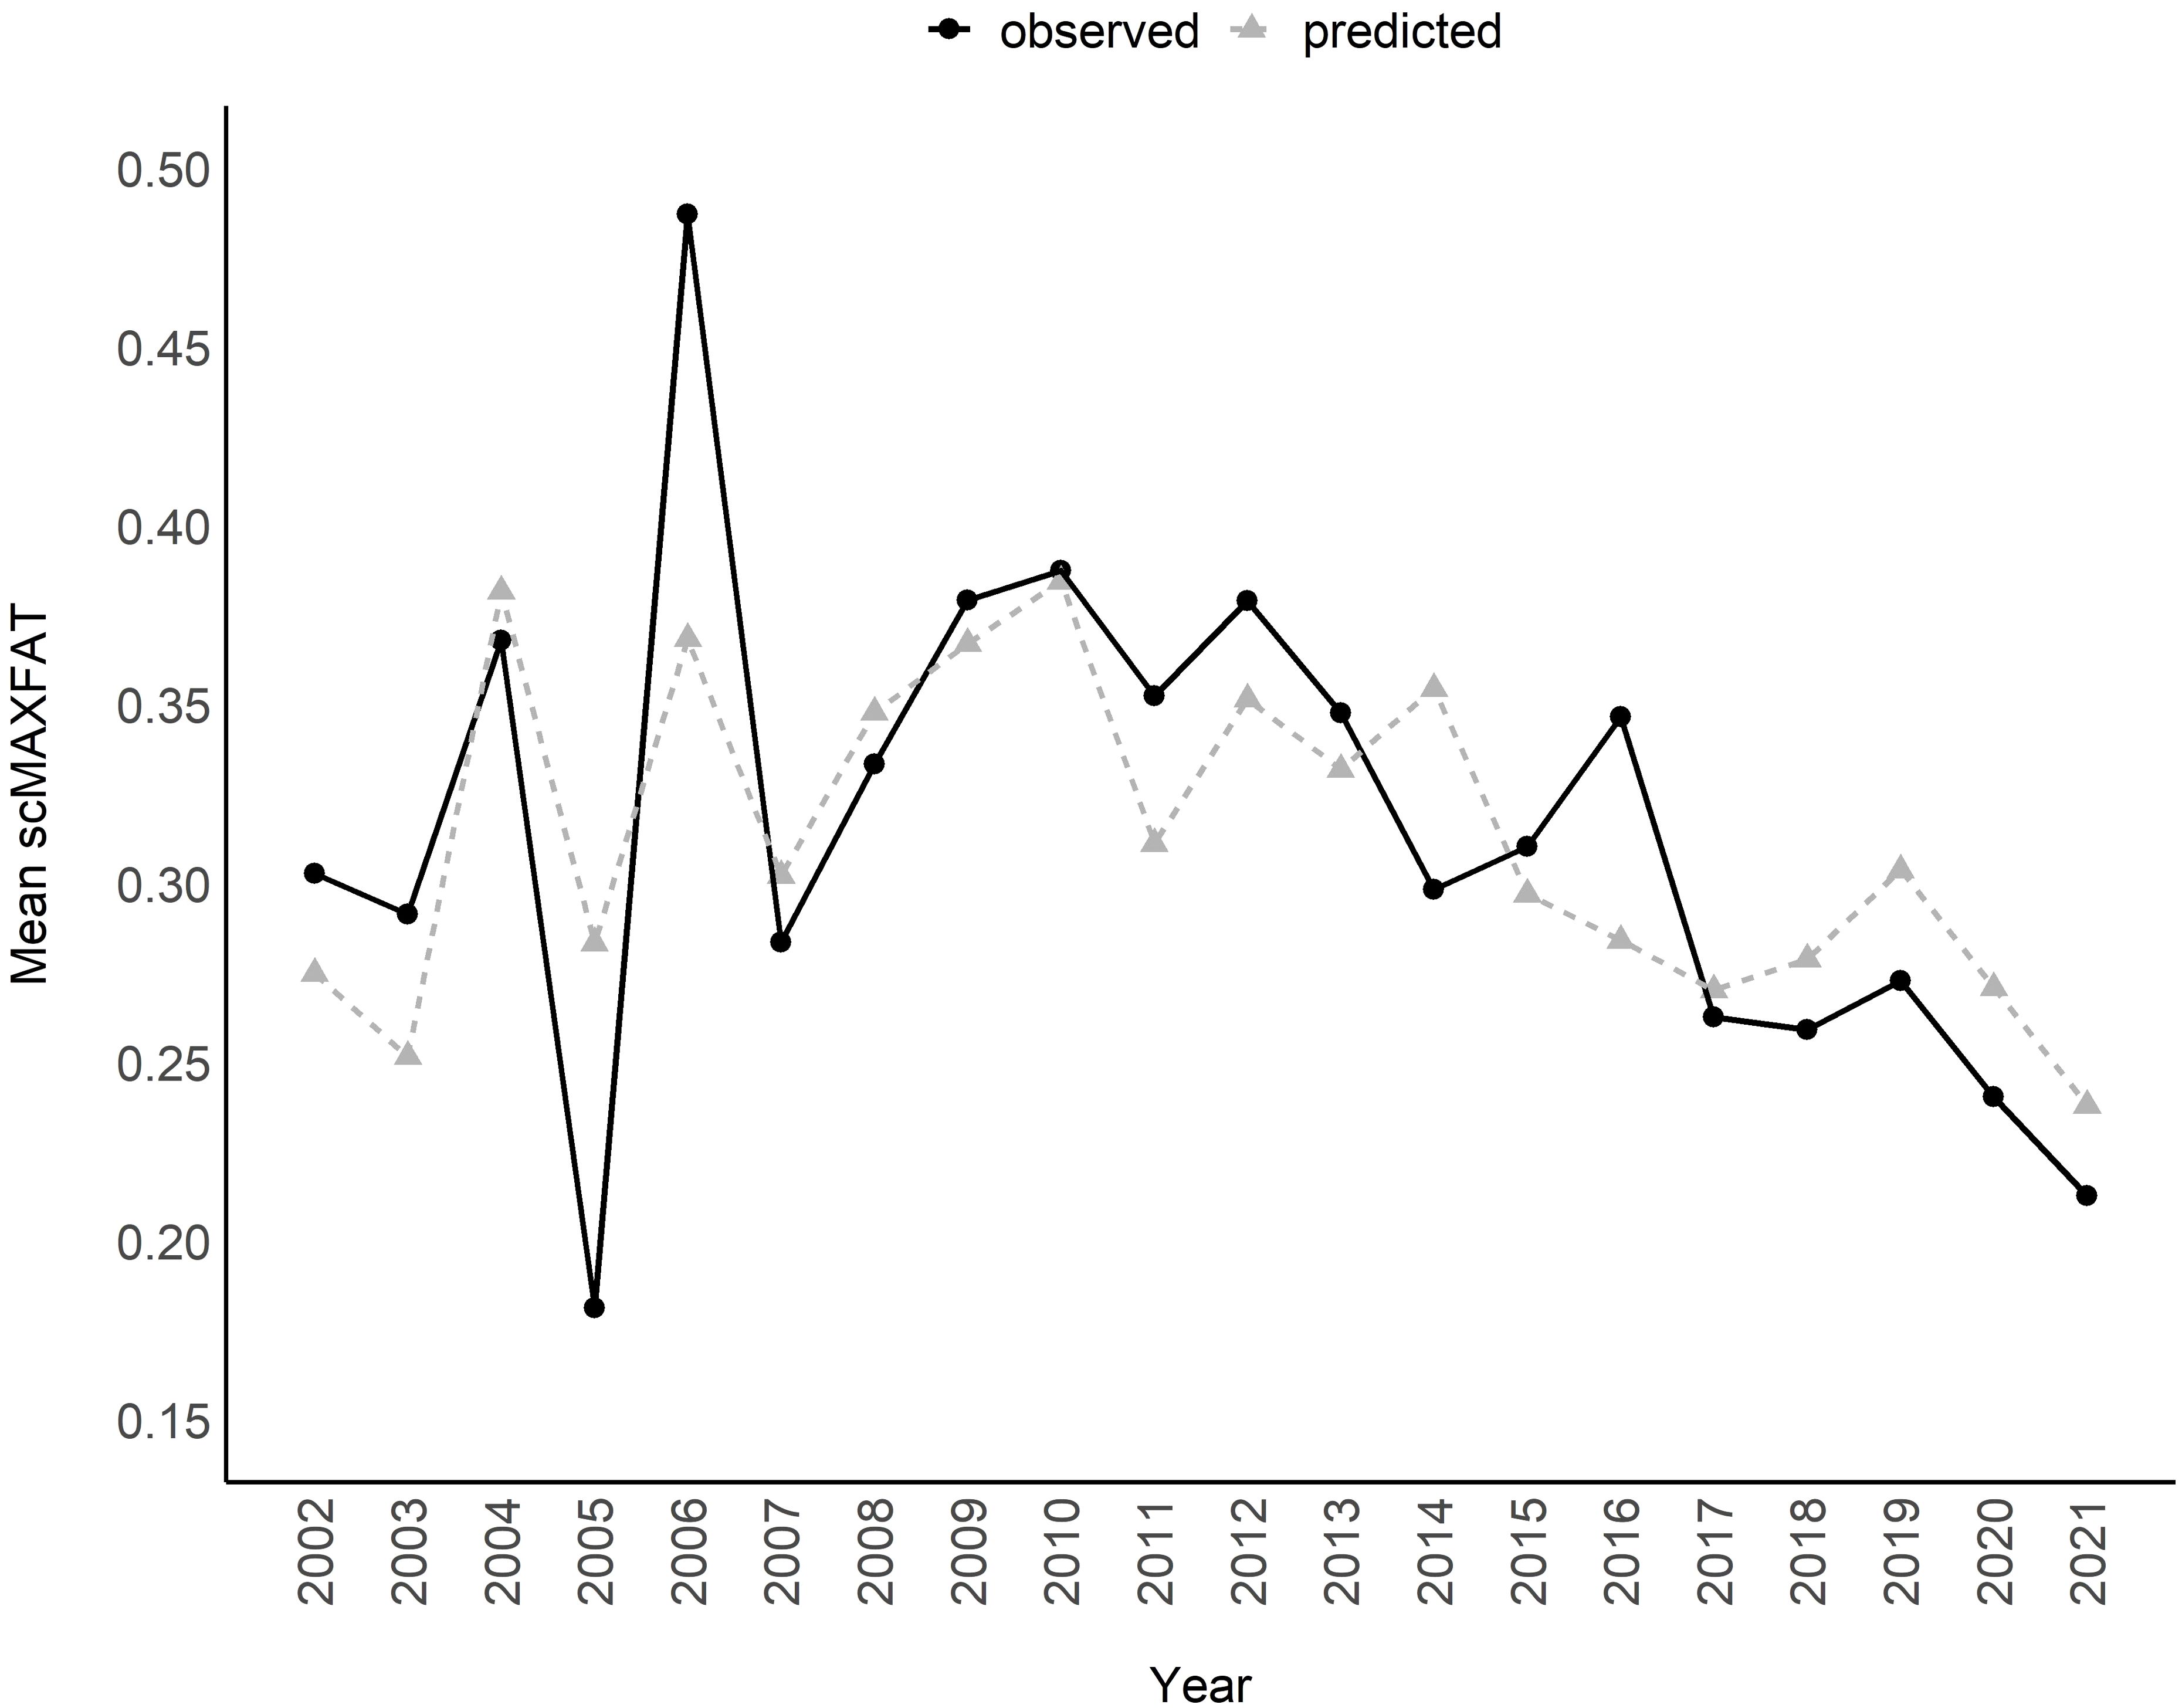
Figure 6. Mean of scaled MAXFAT (scMAXFAT) predictions for non-lactating elk compared to the observed values in each year (r = 0.76; 2002–2021).
Non-pregnant elk
We did not include interactions between elk density and bottom-up covariates in our list of 2,183 all-possible models for the non-pregnant group (Supplementary Table S1). The top model contained covariates for fall_precip, sprg_temp_mn, and summ_precip (Table 2). All top twenty models contained the covariate for summ_precip (Supplementary Data Sheet 7. The directions of coefficients (+/−) for covariates were consistent across the top 20 models (Supplementary Data Sheet 6). We consistently estimated that scMAXFAT increased with fall and summer precipitation but decreased with increasing sprg_precip and sprg_temp_mn. Sprg_temp_mn ranked highest in variable importance (ratio of proportions=3.37) and was followed by summ_precip (ratio of proportions=2.69), and sprg_precip (ratio of proportions=1.53; Supplementary Data Sheet 7).
The marginal plots and odds ratios for covariates in the top model predicted that scMAXFAT would increase by 0.25% for every mm increase in fall_precip (90% CI from 0.11 to 0.39) and by 0.36% for every additional mm of summer precipitation (90% CI from 0.23 to 0.49) if holding all other conditions constant (Figure 7; Table 2). In addition, the top model estimated that scMAXFAT would decrease by 9.1% for every 1-degree increase in sprg_temp_mn (90% CI from 4.9% to 13.24% decrease; Table 2). Mean predicted scMAXFAT values for all non-pregnant elk in our data were moderately correlated with the observed values (r = 0.53; Figure 8). Using k-fold validation, the correlation between the mean observed and predicted scMAXFAT values was 0.30.
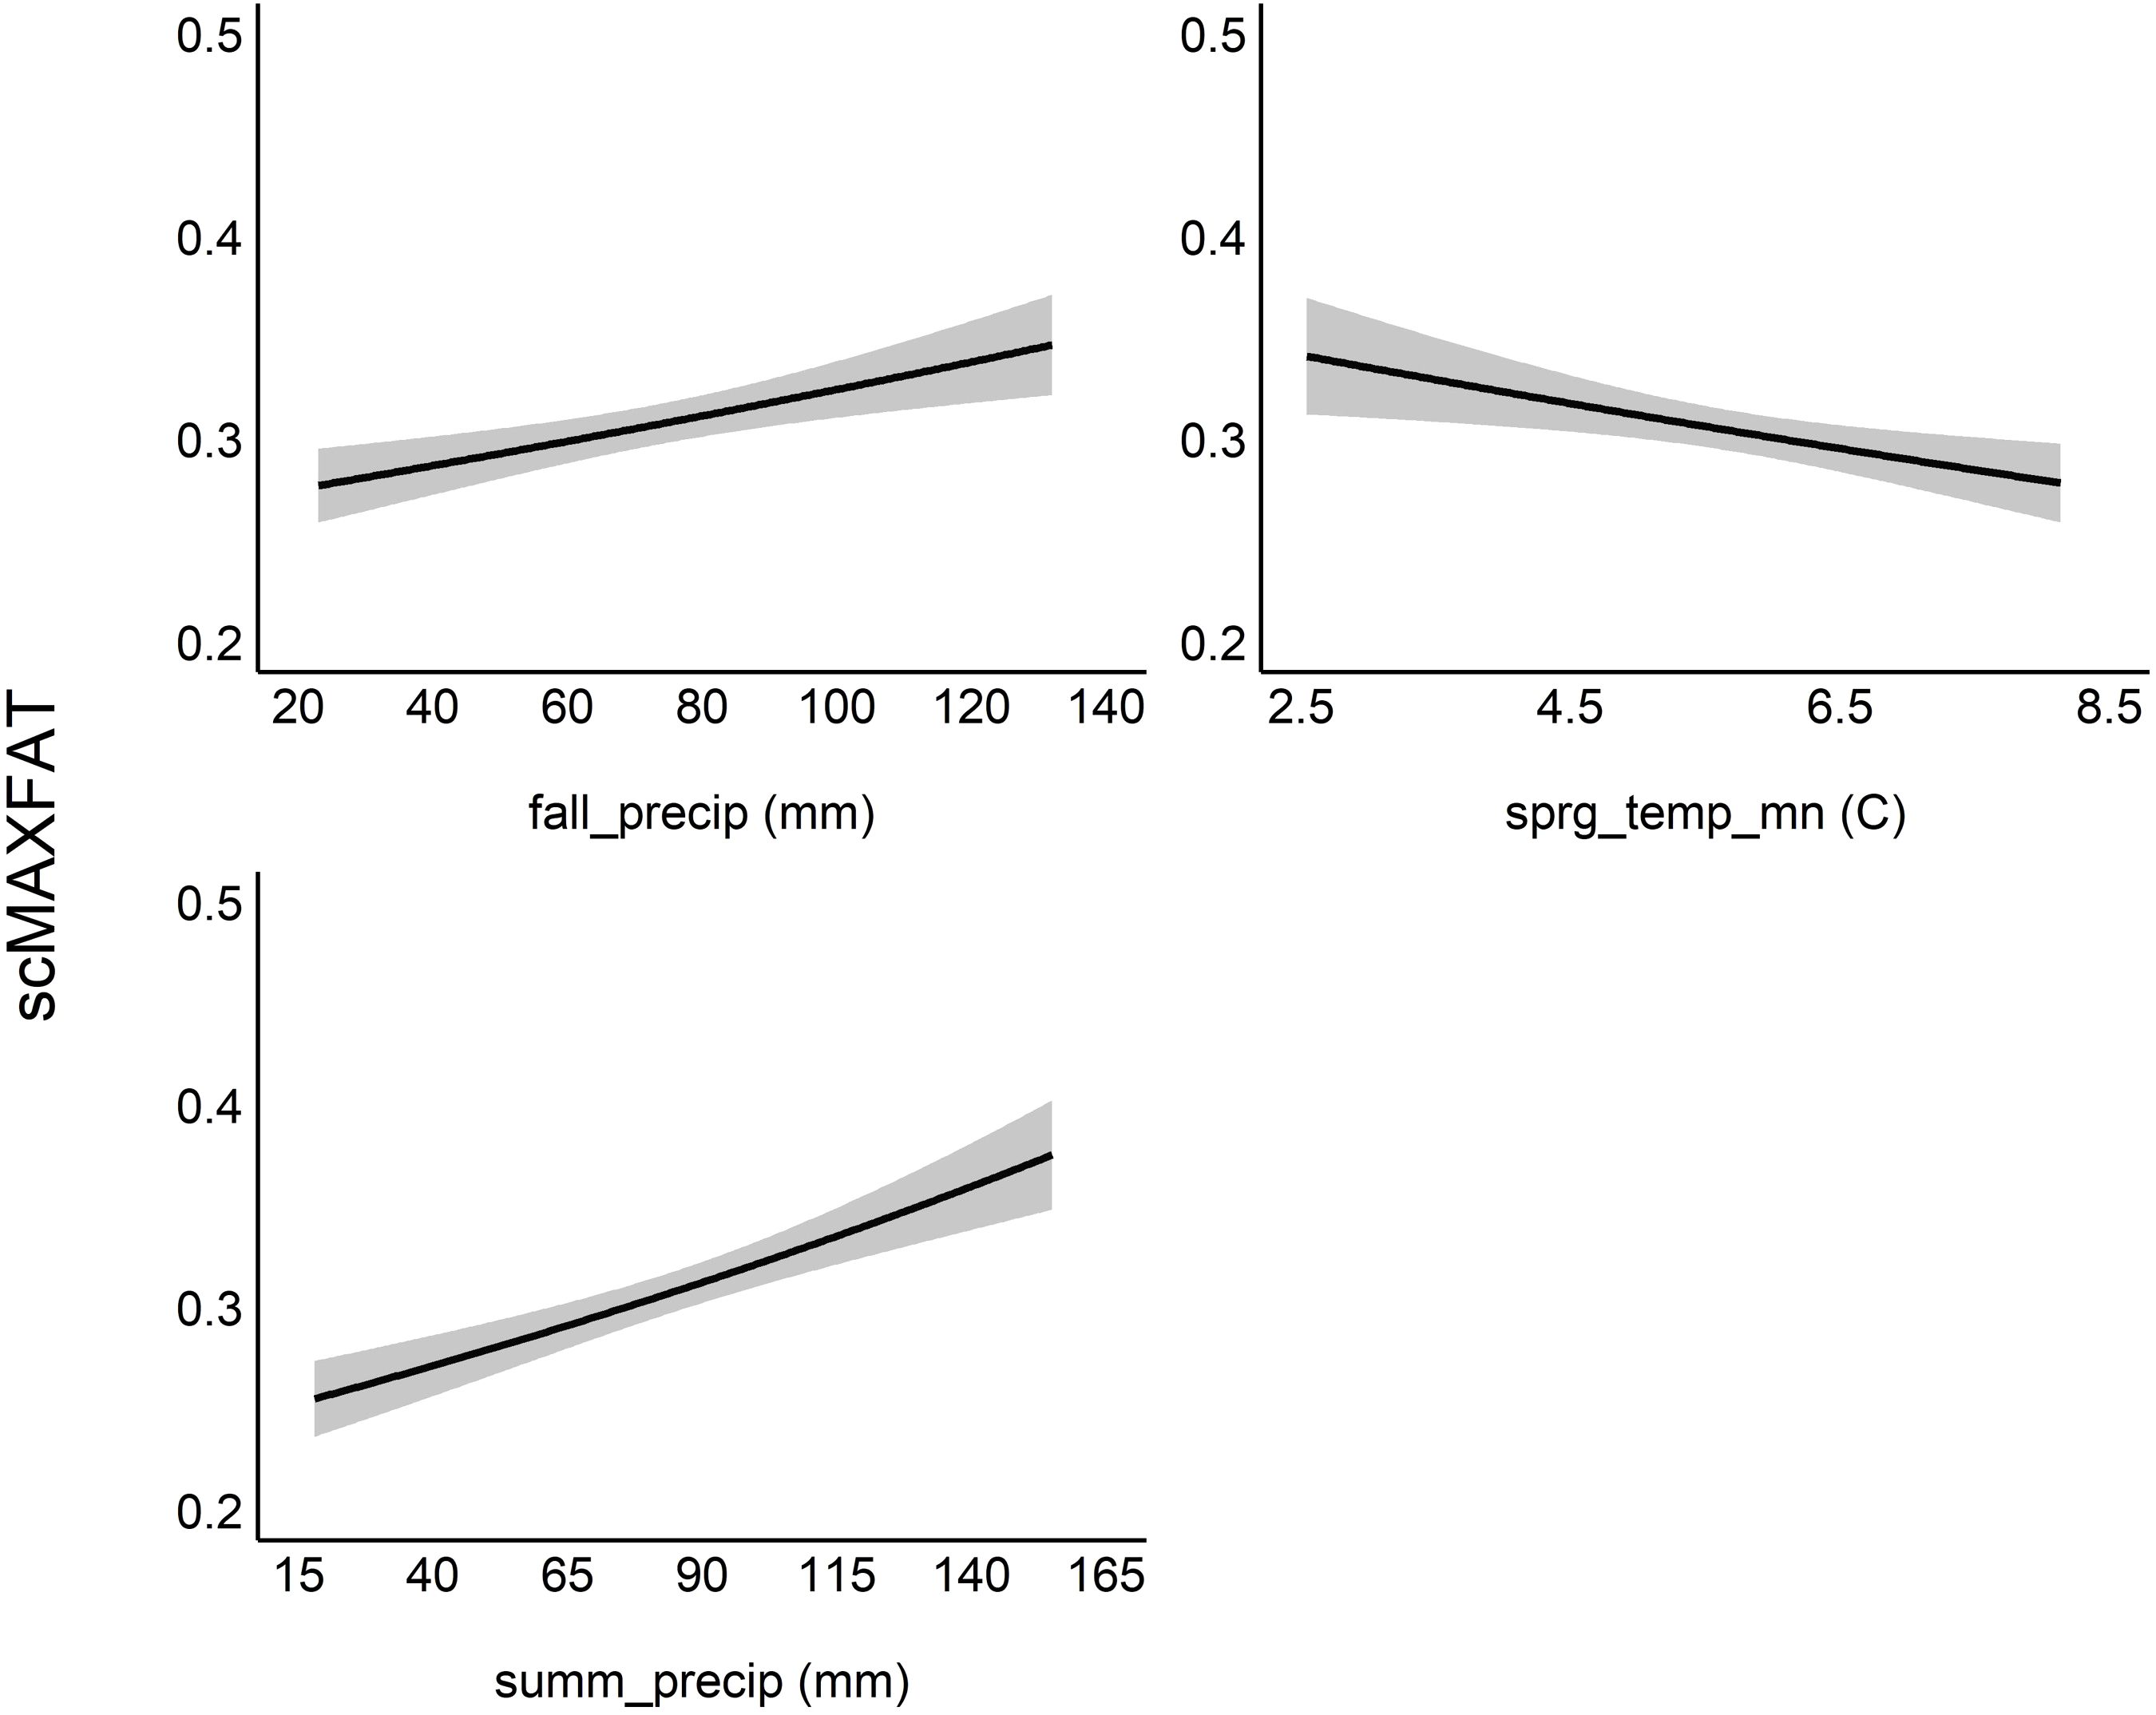
Figure 7. Marginal plots for the top model for scaled MAXFAT (scMAXFAT) of non-pregnant elk. Each plot shows the estimated relationship between scMAXFAT and a single covariate while holding all other model covariates constant at their median values. Summ_precip refers to cumulative summer (Jun–Aug) precipitation (mm), fall_precip refers to cumulative fall (Sep–Oct) precipitation (mm), and sprg_temp_mn refers to mean spring (Mar–May) temperature (°C).

Figure 8. Mean of scaled MAXFAT (scMAXFAT) predictions for non-pregnant elk compared to the observed values each year (r = 0.53; 2002–2021).
Discussion
Understanding which factors are most closely related to body condition and how they might interact with animal densities is critical for managing wild ungulate populations experiencing demographic and ecosystem-level changes. Our analysis of two decades of elk body condition data during which elk densities and seasonal climate patterns varied considerably indicated density-dependent effects on the body condition of lactating animals. As predicted, body fat of lactating elk was negatively associated with severe drought, and this relationship was more pronounced at higher densities. This finding suggests that drought and intraspecific competition for forage resources resulted in nutritional limitations for lactating elk. Lactating elk require ~50% more metabolizable energy/day than non-lactating females (Cook et al., 2004), making them more sensitive to environmental variation, particularly at high densities. Female herbivores with elevated requirements for milk production are less likely to accrue fat going into winter (Denryter et al., 2020; Stephenson et al., 2020), unless forage quality is adequate (Cook et al., 2010). Severe drought will likely add further nutritional constraints to lactating females by restricting food resources temporally and geographically.
Increased precipitation during summer was the only covariate occurring in the top model for all three groups and was associated with a significant, positive effect on body fat, highlighting the importance of an indirect, bottom-up influence on female elk nutrition. Variations in the amount of precipitation in late spring and early summer are strongly associated with the amount of dry matter digestibility in forage (Vavra and Phillips, 1980; Schuyler et al., 2021), which in turn can influence fat accumulation in adult elk as well as reproductive performance and survival (Cook et al., 2004, 2013). In addition to summer precipitation, we found a positive association between non-pregnant elk body fat and fall precipitation. Starkey is characterized by small, unpredictable autumn rains that can produce a flush of plant growth during some years, particularly in grasses, late in the season (Skovlin, 1967). Although the strength of the relationship between fall precipitation and body fat was not as pronounced as summer precipitation, a late-season pulse of nutritious understory vegetation may enhance or maintain condition for some animals. This small increase in autumn precipitation, when it occurs, can be an important boost to nutritional resources during a period when major sources of forage otherwise have senesced and thus are of low quality. As precipitation fluctuates across seasons, diet flexibility may allow herbivores to respond to changes in local forage availability and quality (Abraham et al., 2019). Given the consistent, positive relationship between growing season precipitation and body fat, we proffer that seasonal precipitation metrics are an appropriate indirect indicator of nutritional resources in semiarid systems.
Contrary to expectations, we did not find evidence of interactions between density and bottom-up covariates with body fat of non-lactating and non-pregnant elk. Faced with drought but without the nutritional stress of lactation, it is possible that these animals were able to adapt their behavioral strategies (i.e., changing feeding tactics) such that density did not interact with environmental conditions to influence fat accumulation during summer. For example, females without calves may be able to utilize higher quality habitats (open meadows at peak biomass) while lactating females avoid those same areas due to heightened predation risk on newborns (Festa-Bianchet, 1988; Ciuti et al., 2009). Since we could not validate the date that non-lactating animals stopped producing milk, it is possible that the weaker relationship between body fat and bottom-up variables found in this group was affected by variations in seasonal lactation history. Additionally, fewer elk entered the winter-feeding area during years with mild conditions (e.g., low snowpack), leading to missing data or small sample sizes that influenced the predicted values of non-pregnant elk body fat.
Including phenological variables that represent seasonal growing conditions in our models revealed that the timing of green-up and peak vegetative productivity can affect female elk body fat. Although one could assume that earlier green-up would provide timely access to nutritional resources for pregnant animals coming out of winter, we found that a later peak green-up was associated with a positive effect on elk body fat of lactating animals. In our system, the onset of peak understory plant growth occurred during the first three weeks of April (Brown et al., 2022) and was approximately one month earlier than the mean parturition date for elk in Starkey (May 27; Ruprecht et al., 2022). Newly emergent plants are of higher quality than older plants, and later peak green-up could prolong access to high-quality forage for wild and domestic herbivores (Mysterud and Austrheim, 2014) and better align forage resources with nutritional demands of late-pregnancy and lactation. Similarly, we found that the body fat of non-lactating elk was positively associated with a later date of peak NDVI. The assumption that precipitation and NDVI-derived metrics represent landscape-level nutritional signals has not been directly validated for our study area. Yet, spring through fall NDVI has been linked to fitness and population performance in other herbivores including mule deer (Hurley et al., 2014), bighorn sheep (Heffelfinger et al., 2018), and Dall’s sheep (Van de Kerk et al., 2020). Large, mobile ungulates have the behavioral advantage of being able to adjust migratory movements to coincide with plant growth and senescence (Hebblewhite and Merrill, 2009; Aikens et al., 2020). Since the Starkey fence prohibits movement to winter ranges, our results do not represent potential energy expenditures associated with seasonal migration between summer and winter range.
Interpretations connecting our elk body fat data and adult female survival should be made with caution. Indices of a single type of fat store (e.g., rump fat) may be too limited to predict the nutritional thresholds between body fat and survival, particularly for animals with little to no subcutaneous fat (<0.3 cm; Cook et al., 2010). Our results do indicate that the number of non-lactating female elk has increased over time and in turn suggests that calf recruitment has declined. These results corroborate recent findings that show mean calf recruitment in Starkey declined 30% over three decades (Loonam et al., 2025). If neonatal mortality occurs early in the growing season, female elk have more time to recuperate lost energy stores before entering winter than those that lose calves late in the season. However, if pregnancy rates of both lactating and non-lactating elk become sufficiently suppressed due to bottom-up limitations, population productivity will decline. Since non-lactating elk compose a large proportion of the sample size, future work should validate approaches to account for seasonal lactation history on energy compensation following the loss of a calf.
There is still a clear need for more information on the effects of extreme weather on large ungulate physiology in temperate ecosystems (Felton et al., 2024). Variations in the seasonal timing and amount of rainfall, increased temperatures, and water deficits associated with projected global climate change are likely to increase in semiarid areas worldwide (IPCC, 2007; Seager et al., 2007). These variations have already been predicted for northeastern Oregon, with anticipated 1) decreases in snowpack (Clifton et al., 2018), 2) shifts in plant communities, with increasing ponderosa pine and sagebrush (Artemisia spp.; Kerns et al., 2018), 3) marked increases in fire activity (Kim et al., 2018), and 4) more frequent and longer droughts (Dalton et al., 2017). Managing wildlife for climate-related stressors, such as long-term drought, is difficult and would require substantial resources (e.g., deployment of water sources; Ledee et al., 2021). Consequently, directly managing for viable ungulate populations through harvest regulations while enhancing and restoring habitat will become increasingly important interventions particularly in systems with density-driven competition for food resources. As climate-driven habitat alterations become more pervasive, ungulates may become susceptible as they are challenged to quickly adapt foraging strategies to ecosystem-level changes. This underscores the value of incorporating long-term data into comprehensive analyses to investigate the mechanisms driving individual performance of species as climate change increases in rate and intensity across the world.
Data availability statement
The raw data supporting the conclusions of this article will be made available by the authors, without undue reservation.
Ethics statement
The animal study was approved by Institutional Animal Care and Use Committee IACUC 92-F-0004. The study was conducted in accordance with the local legislation and institutional requirements.
Author contributions
CB: Conceptualization, Data curation, Formal analysis, Methodology, Software, Visualization, Writing – original draft, Writing – review & editing. RN: Conceptualization, Data curation, Formal analysis, Methodology, Software, Validation, Visualization, Writing – original draft, Writing – review & editing. DC: Conceptualization, Methodology, Project administration, Supervision, Writing – original draft, Writing – review & editing. RK: Investigation, Writing – original draft. KL: Formal analysis, Methodology, Software, Writing – original draft, Writing – review & editing. MR: Conceptualization, Methodology, Writing – original draft, Writing – review & editing. MW: Conceptualization, Methodology, Project administration, Supervision, Writing – original draft, Writing – review & editing.
Funding
The author(s) declare that financial support was received for the research and/or publication of this article. Financial support was provided by the Oregon Department of Fish and Wildlife and the Wildlife and Sport Fish Restoration Act. The United States Department of Agriculture Forest Service Pacific Northwest Research Station provided logistic and financial support to handle elk.
Acknowledgments
For assistance with fieldwork and data collection, we thank Brian Dick, Dennis Rea, Cheryl Borum, Eric Dewitt, and Hans Hayden. We thank Bridgett Naylor, Jennifer Hafer, and Ken Bible for management of elk nutrition and weather data. Charlie Schaffer and Bonnie Ruefenacht provided computational resources and services at the Geospatial Technology and Application Center.
Conflict of interest
RN was employed by Eagle Environmental, Inc.
The remaining authors declare that the research was conducted in the absence of any commercial or financial relationships that could be construed as a potential conflict of interest.
Generative AI statement
The author(s) declare that no Generative AI was used in the creation of this manuscript.
Publisher’s note
All claims expressed in this article are solely those of the authors and do not necessarily represent those of their affiliated organizations, or those of the publisher, the editors and the reviewers. Any product that may be evaluated in this article, or claim that may be made by its manufacturer, is not guaranteed or endorsed by the publisher.
Supplementary material
The Supplementary Material for this article can be found online at: https://www.frontiersin.org/articles/10.3389/fevo.2025.1584866/full#supplementary-material
References
Abatzoglou J. T., McEvoy D. J., and Redmond K. T. (2017). The west wide drought tracker: drought monitoring at fine spatial scales. Bull. Am. Meteorol. Soc. 98, 1815–1820. doi: 10.1175/BAMS-D-16-0193.1
Abraham J. O., Hempson G. P., and Staver A. C. (2019). Drought‐response strategies of savanna herbivores. Ecology and Evolution 9, 7047–7056. doi: 10.1002/ece3.5270
Aikens E. O., Monteith K. L., Merkle J. A., Dwinnell S. P., Fralick G. L., and Kauffman M. J. (2020). Drought reshuffles plant phenology and reduces the foraging benefit of green-wave surfing for a migratory ungulate. Global Change Biol. 26, 4215–4225. doi: 10.1111/gcb.15169
Albon S. D., Irvine R. J., Halvorsen O., Langvatn R., Loe L. E., Ropstad E., et al. (2017). Contrasting effects of summer and winter warming on body mass explain population dynamics in a food-limited Arctic herbivore. Global Change Biol. 23, 1374–1389. doi: 10.1111/gcb.2017.23.issue-4
Alldredge M. W., Peek J. M., and Wall W. A. (2002). Nutritional quality of forages used by elk in northern Idaho. Rangeland Ecol. Manage. 55, 253–259. doi: 10.2307/4003131
Ayotte P., Le Corre M., and Côté S. D. (2020). Synergistic population density and environmental effects on deer body condition. J. Wildlife Manage. 84, 938–947. doi: 10.1002/jwmg.21862
Bellard C., Bertelsmeier C., Leadley P., Thuiller W., and Courchamp F. (2012). Impacts of climate change on the future of biodiversity. Ecol. Lett. 15, 365–377. doi: 10.1111/j.1461-0248.2011.01736.x
Bischof R., Loe L. E., Meisingset E. L., Zimmermann B., Van Moorter B., and Mysterud A. (2012). A migratory northern ungulate in the pursuit of spring: jumping or surfing the green wave? Am. Nat. (Hjorth: Chapman & Hall London; New York) 180, 407–424. doi: 10.1086/667590
Bonenfant C., Gaillard J.-M., Coulson T., Festa-Bianchet M., Loison A., Garel M., et al. (2009). Empirical evidence of density-dependence in populations of large herbivores. Adv. Ecol. Res. 41, 313–357. doi: 10.1016/S0065-2504(09)00405-X
Bowyer R. T., Nicholson M. C., Molvar E. M., and Faro J. B. (1999). Moose on Kalgin Island: are density-dependent processes related to harvest? Alces: A J. Devoted to Biol. Manage. Moose 35, 73–89.
Brown C. L., Coe P. K., Clark D. A., Wisdom M. J., Rowland M. M., Averett J. P., et al. (2022). Climate change effects on understory plant phenology: implications for large herbivore forage availability. Environ. Res.: Ecol. 1, 011002. doi: 10.1088/2752-664X/ac7fb0
Burnham K. P. and Anderson D. R. (2002). Model Selection and Multimodel Inference: A Practical Information-Theoretic Approach. 2nd ed. (New York: Springer-Verlag). doi: 10.1098/rstb.2013.0196"doi.org/10.1098/rstb.2013.0196
Chesson P. (2000). General theory of competitive coexistence in spatially-varying environments. Theor. Popul. Biol. 58, 211–237. doi: 10.1006/tpbi.2000.1486
Ciuti S., Pipia A., Grignolio S., Ghiandai F., and Apollonio M. (2009). Space use, habitat selection and activity patterns of female Sardinian mouflon (Ovis orientalis musimon) during the lambing season. Eur. J. Wildlife Res. 55, 589–595. doi: 10.1007/s10344-009-0279-y
Clifton C. F., Day K. T., Luce C. H., Grant G. E., Safeeq M., Halofsky J. E., et al. (2018). Effects of climate change on hydrology and water resources in the Blue Mountains, Oregon, USA. Climate Serv. 10, 9–19. doi: 10.1016/j.cliser.2018.03.001
Cook R. C., Cook J. G., Murray D. L., Zager P., Johnson B. K., and Gratson M. W. (2001). Development of predictive models of nutritional condition for Rocky Mountain elk. J. Wildlife Manage. 65, 973–987. doi: 10.2307/3803046
Cook R. C., Cook J. G., Stephenson T. R., Myers W. L., McCorquodale S. M., Vales D. J., et al. (2010). Revisions of rump fat and body scoring indices for deer, elk, and moose. J. Wildlife Manage. 74, 880–896. doi: 10.2193/2009-031
Cook R. C., Cook J. G., Vales D. J., Johnson B. K., McCorquodale S. M., Shipley L. A., et al. (2013). Regional and seasonal patterns of nutritional condition and reproduction in elk. Wildlife Monogr. 184, 1–45. doi: 10.1002/wmon.v184.1
Cook J. G., Johnson B. K., Cook R. C., Riggs R. A., Delcurto T. I. M., Bryant L. D., et al. (2004). Effects of summer-autumn nutrition and parturition date on reproduction and survival of elk. Wildlife Monogr. 155, 1–61. doi: 10.2193/0084-0173(2004)155[1:EOSNAP]2.0.CO;2
Dalton M. M., Dello K. D., Hawkins L., Mote P. W., and Rupp D. E. (2017). The third Oregon climate assessment report (Corvallis, OR: Oregon Climate Change Research Institute, College of Earth, Ocean and Atmospheric Sciences, Oregon State University).
Deen M. and de Rooij M. (2020). ClusterBootstrap: An R package for the analysis of hierarchical data using generalized linear models with the cluster bootstrap. Behav. Res. Methods 52, 572–590. doi: 10.3758/s13428-019-01252-y
Denryter K., Cook R. C., Cook J. G., Parker K. L., and Gillingham M. P. (2020). State-dependent foraging by caribou with different nutritional requirements. J. Mammal. 101, 544–557. doi: 10.1093/jmammal/gyaa003
Fauteux D., Stien A., Yoccoz N. G., Fuglei E., and Ims R. A. (2021). Climate variability and density-dependent population dynamics: Lessons from a simple High Arctic ecosystem. Proc. Natl. Acad. Sci. 118, e2106635118. doi: 10.1073/pnas.2106635118
Felton A. M., Hilde K. W., Borowski Z., Granhus A., Juvany L., Matala J., et al. (2024). Climate change and deer in boreal and temperate regions: From physiology to population dynamics and species distributions. Global Change Biol. 30, e17505. doi: 10.1111/gcb.17505
Festa-Bianchet M. (1988). Seasonal range selection in bighorn sheep: conflicts between forage quality, forage quantity, and predator avoidance. Oecologia 75, 580–586. doi: 10.1007/BF00776423
Flook D. R. (1970). A study of sex differential in the survival of wapiti. Canada Wildlife Service Report, Serial Number 11 (Ontario, Canada: Queens Printer, Ottawa).
Gerhart K. L., White R. G., Cameron R., and Russell D. E. (1996). Estimating fat content of caribou from body condition scores. J. Wildlife Manage. 60, 713–718. doi: 10.2307/3802369
Gustine D. D., Parker K. L., and Heard D. C. (2007). Using ultrasound measurements of rump fat to assess nutritional condition of woodland caribou in northern British Columbia, Canada. Rangifer 17, 249–256. doi: 10.7557/2.27.4.351
Heard D., Barry S., Watts G., and Child K. (1997). Fertility of female moose (Alces alces) in relation to age and body composition. Alces: A J. Devoted to Biol. Manage. Moose 33, 165–176.
Hebblewhite M. and Merrill E. H. (2009). Trade-offs between predation risk and forage differ between migrant strategies in a migratory ungulate. Ecology 90, 3445–3454. doi: 10.1890/08-2090.1
Heffelfinger L. J., Stewart K. M., Bush A. P., Sedinger J. S., Darby N. W., and Bleich V. C. (2018). Timing of precipitation in an arid environment: Effects on population performance of a large herbivore. Ecol. Evol. 8, 3354–3366. doi: 10.1002/ece3.2018.8.issue-6
Hjorth J. S. U. (1994). Computer Intensive Statistical Methods Validation, Model Selection, and Bootstrap (London, New York: Chapman & Hall), ISBN: ISBN 0412491605.
Hobbs N. T. (1989). Linking energy balance to survival in mule deer: development and test of a simulation model (Wildlife Monographs), 3–39.
Hobbs N. T. (1996). Modification of ecosystems by ungulates. J. Wildlife Manage. 60, 695–713. doi: 10.2307/3802368
Hoffmann A. A. and Sgrò C. M. (2011). Climate change and evolutionary adaptation. Nature 470, 479–485. doi: 10.1038/nature09670
Hosmer D. W., Lemeshow S., and Sturdivant R. X. (2013). Applied logistic regression Vol. 398 (Hoboken, New Jersey: John Wiley & Sons).
Hurley M. A., Hebblewhite M., Gaillard J. M., Dray S., Taylor K. A., Smith W. K., et al. (2014). Functional analysis of normalized difference vegetation index curves reveals overwinter mule deer survival is driven by both spring and autumn phenology. Philos. Trans. R. Soc. B: Biol. Sci. 369, 20130196. doi: 10.1098/rstb.2013.0196
IPCC (2007). Climate Change 2007: Synthesis Report. Contribution of Working Groups I, II and III to the Fourth Assessment Report of the Intergovernmental Panel on Climate Change. Eds. Core Writing Team, Pachauri R. K., and Reisinger A. (Geneva, Switzerland: IPCC).
Johnson B. K., Coe P. K., and Green R. L. (2013). Abiotic, bottom-up, and top-down influences on recruitment of Rocky Mountain elk in Oregon: a retrospective analysis. J. Wildlife Manage. 77, 102–116. doi: 10.1002/jwmg.v77.1
Johnson B. K., Jackson D. H., Cook R. C., Clark D. A., Coe P. K., Cook J. G., et al. (2019). Roles of maternal condition and predation in survival of juvenile elk in Oregon. Wildlife Monogr. 201, 3–60. doi: 10.1002/wmon.v201.1
Karl T. R. (1986). The sensitivity of the Palmer Drought Severity Index and Palmer’s Z-index to their calibration coefficients including potential evapotranspiration. J. Climate Appl. Meteorol. 25, 77–86. doi: 10.1175/1520-0450(1986)025<0077:TSOTPD>2.0.CO;2
Keech M. A., Bowyer J. H., Jay M., Hoef V., Boertje R. D., Dale B. W., et al. (2000). Life-history consequences of maternal condition in Alaskan moose. J. Wildlife Manage. 64, 450–462. doi: 10.2307/3803243
Kerns B. K., Powell D. C., Mellmann-Brown S., Carnwath G., and Kim J. B. (2018). Effects of projected climate change on vegetation in the Blue Mountains ecoregion, USA. Climate Serv. 10, 33–43. doi: 10.1016/j.cliser.2017.07.002
Kie J. G., Bowyer R. T., and Stewart K. M. (2003). “Ungulates in western forests: habitat requirements, population dynamics, and ecosystem processes,” in Mammal community dynamics: management and conservation in the coniferous forests of western North America, (New York: Cambridge University Press). 296–340.
Kim J. B., Kerns B. K., Drapek R. J., Pitts G. S., and Halofsky J. E. (2018). Simulating vegetation response to climate change in the Blue Mountains with MC2 dynamic global vegetation model. Climate Serv. 10, 20–32. doi: 10.1016/j.cliser.2018.04.001
Latta G., Temesgen H., Adams D., and Barrett T. (2010). Analysis of potential impacts of climate change on forests of the United States Pacific Northwest. For. Ecol. Manage. 259, 720–729. doi: 10.1016/j.foreco.2009.09.003
Ledee O. E., Handler S. D., Hoving C. L., Swanston C. W., and Zuckerberg B. (2021). Preparing wildlife for climate change: How far have we come? J. Wildlife Manage. 85, 7–16. doi: 10.1002/jwmg.21969
Li D., Wrzesien M. L., Durand M., Adam J., and Lettenmaier D. P. (2017). How much runoff originates as snow in the Western United States, and how will that change in the future? Geophys. Res. Lett. 44, 6163–6172. doi: 10.1002/2017GL073551
Loonam K., Brown C. L., Clark D., Rowland M., Wisdom M., and Levi T. (2025). The effects of predator recovery and climate change on the long-term demography of a flagship herbivore. [Preprint] doi: 10.1101/2025.05.16.654556
Manly B. F. J. (2018). Randomization, Bootstrap and Monte Carlo Methods in Biology. Third (New York: Chapman and Hall/CRC).
McArt S. H., Spalinger D. E., Collins W. B., Schoen E. R., Stevenson T., and Bucho M. (2009). Summer dietary nitrogen availability as a potential bottom-up constraint on moose in south-central Alaska. Ecology 90, 1400–1411. doi: 10.1890/08-1435.1
McCulloch C. E., Searle S. R., and Neuhaus J. M. (2008). Generalized, Linear, and Mixed Models. 2nd Edition (Hoboken, N.J: Wiley-Interscience).
Middleton A. D., Kauffman M. J., McWhirter D. E., Cook J. G., Cook R. C., Nelson A. A., et al. (2013). Animal migration amid shifting patterns of phenology and predation: lessons from a Yellowstone elk herd. Ecology 94, 1245–1256. doi: 10.1890/11-2298.1
Moen A. N. (1978). Seasonal-changes in hear-rates, activity, metabolism, and forage intake of white-tailed deer. J. Wildlife Manage. 32, 338–344. doi: 10.2307/3800763
Monteith K. L., Bleich V. C., Stephenson T. R., Pierce B. M., Conner M. M., Kie J. G., et al. (2014). Life-history characteristics of mule deer: effects of nutrition in a variable environment. Wildlife Monogr. 186, 1–62. doi: 10.1002/wmon.1011
Morano S., Stewart K. M., Sedinger J. S., Nicolai C. A., and Vavra M. (2013). Life-history strategies of North American elk: trade-offs associated with reproduction and survival. J. Mammal. 94, 162–172. doi: 10.1644/12-MAMM-A-074.1
Moyes K., Nussey D. H., Clements M. N., Guinness F. E., Morris A., Pemberton J. M., et al. (2011). Advancing breeding phenology in response to environmental change in a wild red deer population. Global Change Biol. 17, 2455–2469. doi: 10.1111/j.1365-2486.2010.02382.x
Mysterud A. and Austrheim G. (2014). Lasting effects of snow accumulation on summer performance of large herbivores in alpine ecosystems may not last. J. Anim. Ecol. 83, 712–719. doi: 10.1111/jane.2014.83.issue-3
Noyes J. H., Sasser R. G., Johnson B. K., Bryant L. D., and Alexander B. (1997). Accuracy of pregnancy detection by serum protein (PSPB) in elk. Wildlife Soc. Bull. 25, 695–698.
Palmer W. C. (1965). Meteorological Drought Vol. 30 (Washington D.C.: US Department of Commerce, Weather Bureau).
Parker K. L., Barboza P. S., and Gillingham M. P. (2009). Nutrition integrates environmental responses of ungulates. Funct. Ecol. 23, 57–69. doi: 10.1111/j.1365-2435.2009.01528.x
Parker K. L., Barboza P. S., and Stephenson T. R. (2005). Protein conservation in female caribou (Rangifer tarandus): effects of decreasing diet quality during winter. J. Mammal. 86, 610–622. doi: 10.1644/1545-1542(2005)86[610:PCIFCR]2.0.CO;2
Pekins P. J., Smith K. S., and Mautz W. W. (1998). The energy cost of gestation in white-tailed deer. Can. J. Zool. 76, 1091–1097. doi: 10.1139/z98-032
Pettorelli N., Vik J. O., Mysterud A., Gaillard J. M., Tucker C. J., and Stenseth N. C. (2005). Using the satellite-derived NDVI to assess ecological responses to environmental change. Trends Ecol. Evol. 20, 503–510. doi: 10.1016/j.tree.2005.05.011
Post E. and Forchhammer M. C. (2008). Climate change reduces reproductive success of an Arctic herbivore through trophic mismatch. Philos. Trans. R. Soc. B: Biol. Sci. 363, 2367–2373. doi: 10.1098/rstb.2007.2207
Price M. A. and White R. G. (1985). “Growth and development,” in Bioenergetics of Wild Herbivores. Eds. Hudson R. J. and White R. G. (CRC Press, Inc., Boca Raton, Florida), 183–214.
Proffitt K. M., Hebblewhite M., Peters W., Hupp N., and Shamhart J. (2016). Linking landscape-scale differences in forage to ungulate nutritional ecology. Ecol. Appl. 26, 2156–2174. doi: 10.1002/eap.2016.26.issue-7
Rivrud I. M., Bischof R., Meisingset E. L., Zimmermann B., Loe L. E., and Mysterud A. (2016). Leave before it’s too late: anthropogenic and environmental triggers of autumn migration in a hunted ungulate population. Ecology 97, 1058–1068. doi: 10.1890/15-1191.1
Rowland M. M., Bryant L. D., Johnson B. K., Noyes J. H., Wisdom M. J., and Thomas J. W. (1997). The Starkey Project: history, facilities, and data collection methods for ungulate research. U.S. Department of Agriculture Forest Service, Pacific Northwest Research Station General Technical Report, PNW-GTR-396, Portland, Oregon.
Rupp D. E., Abatzoglou J. T., and Mote P. W. (2017). Projections of 21st century climate of the Columbia River Basin. Climate Dyn. 49, 1783–1799. doi: 10.1007/s00382-016-3418-7
Ruprecht J., Forrester T. D., Jackson N. J., Clark D. A., Wisdom M. J., Rowland M. M., et al. (2022). A seasonal pulse of ungulate neonates influences space use by carnivores in a multi-predator, multi-prey system. Ecol. Evol. 12, e9389. doi: 10.1002/ece3.v12.10
Sæther B. E. (1997). Environmental stochasticity and population dynamics of large herbivores: a search for mechanisms. Trends Ecol. Evol. 12, 143–149. doi: 10.1016/S0169-5347(96)10068-9
Schuyler E. M., Ellsworth L. M., Sanchez D. M., and Whittaker D. G. (2021). Forage quality and quantity in migratory and resident mule deer summer ranges. Rangeland Ecol. Manage. 79, 43–52. doi: 10.1016/j.rama.2021.07.004
Seager R., Ting M., Held I., Kushnir Y., Lu J., Vecchi G., et al. (2007). Model projections of an imminent transition to a more arid climate in southwestern North America. Science 316, 1181–1184. doi: 10.1126/science.1139601
Simard A., Huot J., De Bellefeuille S., and Côté S. D. (2014). Influences of habitat composition, plant phenology, and population density on autumn indices of body condition in a northern white-tailed deer population. Wildlife Monogr. 187, 1–28. doi: 10.1002/wmon.1010
Skovlin J. M. (1967). Fluctuations in forage quality on summer range in the Blue Mountains. PNW-44 (Portland, Oregon: US Department of Agriculture, Forest Service, Pacific Northwest Research Station), 20.
Stephens P. A., Houston A. I., Harding K. C., Boyd I. L., and McNamara J. M. (2014). Capital and income breeding: the role of food supply. Ecology 95, 882–896. doi: 10.1890/13-1434.1
Stephenson T. R., Bleich V. C., Pierce B. M., and Mulcahy G. P. (2002). Validation of mule deer body composition using in vivo and post-mortem indices of nutritional condition. Wildlife Soc. Bull. 30, 557–564. doi: 10.1139/z97-248
Stephenson T. R., German D. W., Cassirer E. F., Walsh D. P., Blum M. E., Cox M., et al. (2020). Linking population performance to nutritional condition in an alpine ungulate. J. Mammal. 101, 1244–1256. doi: 10.1093/jmammal/gyaa091
Stephenson T. R., Hundertmark K. J., Schwartz C. C., and Van Ballenberghe V. (1998). Predicting body fat and body mass in moose with ultrasonography. Can. J. Zool. 76, 717–722. doi: 10.1139/z97-248
Stewart K. M., Bowyer R. T., Dick B. L., Johnson B. K., and Kie J. G. (2005). Density-dependent effects on physical condition and reproduction in North American elk: an experimental test. Oecologia 143, 85–93. doi: 10.1007/s00442-004-1785-y
Stewart K. M., Bowyer R. T., Kie J. G., Dick B. L., and Ruess R. W. (2009). Population density of North American elk: effects on plant diversity. Oecologia 161, 303–312. doi: 10.1007/s00442-009-1376-z
Stewart K. M., Bowyer R. T., Ruess R. W., Dick B. L., and Kie J. G. (2006). Herbivore optimization by North American elk: consequences for theory and management. Wildlife Monogr. 167, 1–24. doi: 10.2193/0084-0173(2006)167[1:HOBNAE]2.0.CO;2
Trainer C. E. (1971). The relationship of physical condition and fertility of female Roosevelt elk (Cervus canadensis rooseveltti) in Oregon. M.S. Thesis. Oregon State University, Corvallis, Oregon.
Van de Kerk M., Arthur S., Bertram M., Borg B., Herriges J., Lawler J., et al. (2020). Environmental influences on Dall’s sheep survival. J. Wildlife Manage. 84, 1127–1138. doi: 10.1002/jwmg.21873
Vavra M. and Phillips R. L. (1980). Drought effects on cattle performance, diet quality, and intake. Proc. Western Sect. Am. Soc. Anim. Sci. 31, 157–160.
Whittingham M. J., Stephens P. A., Bradbury R. B., and Freckleton R. P. (2006). Why do we still use stepwise modelling in ecology and behavior? J. Anim. Ecol. 75, 1182–1189. doi: 10.1111/j.1365-2656.2006.01141.x
Wisdom M. J. (2005). The Starkey Project: a synthesis of long-term studies of elk and mule deer (Lawrence, Kansas: Alliance Communications Group), 252 p.
Wisdom M. J., Cook J. G., Rowland M. M., and Noyes J. H. (1993). Protocols for care and handling of deer and elk at the Starkey Experimental Forest and Range (Portland, Oregon: U.S. Department of Agriculture, Forest Service, General Technical Report PNW-GTR-311).
Keywords: body condition, Cervus canadensis, climate, density, drought, elk, precipitation
Citation: Brown CL, Nielson RM, Clark D, Kennedy R, Loonam K, Rowland MM and Wisdom MJ (2025) Drought-linked resource limitations on the body condition of a large ungulate. Front. Ecol. Evol. 13:1584866. doi: 10.3389/fevo.2025.1584866
Received: 27 February 2025; Accepted: 02 June 2025;
Published: 03 July 2025.
Edited by:
Aurelio F. Malo, University of Alcalá, SpainReviewed by:
Fraser John Combe, Independent researcher, Minneapolis, MN, United StatesDominik Werner Melville, University of Ulm, Germany
Copyright © 2025 Brown, Nielson, Clark, Kennedy, Loonam, Rowland and Wisdom. This is an open-access article distributed under the terms of the Creative Commons Attribution License (CC BY). The use, distribution or reproduction in other forums is permitted, provided the original author(s) and the copyright owner(s) are credited and that the original publication in this journal is cited, in accordance with accepted academic practice. No use, distribution or reproduction is permitted which does not comply with these terms.
*Correspondence: Casey L. Brown, Y2FzZXkubC5icm93bkBvZGZ3Lm9yZWdvbi5nb3Y=