 Jinhang Li
 Yuping Han2*
- 1North China University of Water Resources and Electric Power, Zhengzhou, China
- 2Zhejiang University of Water Resources and Electric Power, Hangzhou, China
Aiming at the increasingly serious problem of water resources shortage and ecological environment deterioration in the world, this study takes 9 provinces and regions in the Yellow River Basin (YRB) as the research objects, and constructs a multi-dimension assessment framework of Water-carbon-ecology (W-C-E) system based on water resources, carbon emissions and ecosystem data from 2002 to 2017. The analysis is innovatively carried out at three progressive levels: first, the independent abundance of each system is assessed, then the coordination between the two systems is examined, and finally the overall robustness of the three systems is measured. Based on this framework, the water-carbon-ecological coupling index (WCENI) is proposed as a comprehensive evaluation index, and the coupling mechanism of the system is deeply analyzed by combining the obstacle degree model and the geographical detector model. The results show that: in terms of time dimension, the overall WCENI increased significantly from 0.3371 to 0.3571 during the study period, and the system coordination index and robustness index showed a steady growth trend. In terms of spatial dimension, there are significant differences in sub-system abundance among provinces and regions, among which Henan Province ranks first with an average WCENI value of 0.3995. The mechanism analysis showed that there was obvious synergistic enhancement effect among the driving factors, and the interaction intensity was significantly higher than that of the single factor, and the per capita water consumption (13.82% obstacle degree) was identified as the key limiting factor restricting the coordinated development of the system. This study not only provides a new analytical framework for understanding the complex human-land system coupling mechanism, but also provides a scientific basis for the implementation of ecological protection and high-quality development strategies in the Yellow River Basin, especially emphasizing the core role of optimizing water resources management in promoting regional sustainable development.
1 Introduction
In recent years, along with the escalating global warming and the accelerating urbanization process, the issues of the contradiction between water supply and demand and the imbalance of the ecosystem are urgently in need of resolution. The total volume of water resources in China approximates 2.57 trillion cubic meters, and the per capita water resources are relatively meager, merely amounting to 2,100 cubic meters, which is lower than the global per capita level. As one of the largest carbon emitters globally, China’s carbon dioxide emissions reached 12.6 billion tons in 2023, constituting approximately 34% of the global carbon dioxide emissions. Consequently, the crux for achieving sustainable development in China lies in maintaining the coupled and coordinated development among water, carbon, and the ecosystem, and conducting in-depth exploration of the underlying driving factors, thereby implementing corresponding regulatory measures.
The coupling coordination among water, carbon, and ecology is a complex and intricate ecological process. They are interdependent and mutually influential, jointly maintaining the stability and equilibrium of the ecosystem. Water plays an essential role in sustaining ecosystem services and its distribution and availability directly influence the structure and function of the entire ecosystem. As a medium for photosynthesis and numerous biochemical reactions, water is of critical significance for the fixation and transformation of carbon, while factors such as vegetation coverage, soil type, and topography within the ecosystem can affect the storage, purification, and release processes of water. Natural ecosystems such as forests can fix carbon in the atmosphere through means like photosynthesis, thereby reducing the concentration of greenhouse gases (Zhang and Yang, 2024). Hence, enhancing the coupling coordination level of China’s W-C-E system and seeking the maximum coordination among water, carbon, and ecology is an urgent issue that society must address to achieve sustainable development. In recent years, research achievements on the W-C-E system have mainly concentrated on the single aspect of W-C-E or the evolution of multi-system footprints. Analyzed the environmental, social, and economic sustainability aspects of the water footprint in the industrial symbiotic system through the concept of water footprint. Liu et al. (2024) revised the calculation parameters of the ecological footprint method based on the definition of fossil energy land use and the latest average grain yield from six aspects: gas, electricity, agricultural products, aquatic products, livestock products, and paper. Incorporated the carbon footprint and water footprint accounting into the sustainable development planning of the central urban area of Guangzhou based on NBS, in order to strengthen the mitigation of urban flood disasters and carbon sinks. Based on a new comprehensive perspective, the WEC correlation efficiency of 30 regions in China was evaluated and predicted. The WEC efficiency and relaxation variables of 30 regions from 2006 to 2020 were measured using a measure model based on relaxation variables.
Water, carbon and ecology are not a simple parallel relationship, but a multi-level, mutually nested collaborative and feedback relationship. The ecosystem as a whole framework covers key components such as water and carbon.
There is a direct interaction between water and carbon. On the one hand, water drives carbon processes, for example, vegetation photosynthesis depends on water, and soil moisture affects the rate of microbial decomposition of organic carbon. On the other hand, carbon reacts on water, for example, forest carbon stocks affect the hydrological cycle by regulating canopy retention and soil water holding capacity. This mutual feeding relationship is particularly significant in the Yellow River basin. For example, after the Loess Plateau is returned to forest, vegetation restoration not only enhances carbon sink capacity, but also improves soil water retention, forming “water-carbon synergistic gain”.
Ecology, as a higher-level system, acts as a “regulator” that determines the strength and direction of the water-carbon relationship. For example, vegetation type (e.g., forest vs grassland) affects water-carbon exchange efficiency, while biodiversity enhances system stability and buffers against climate extremes that disrupt the water-carbon cycle.
Conversely, ecological degradation (such as the shrinkage of wetlands due to overdevelopment) can disrupt the water-carbon balance, creating a vicious cycle. Therefore, when studying the drivers, it is necessary to pay attention to how natural factors (such as climate change) and human interventions (such as ecological restoration projects) affect the overall ecosystem function by regulating the water-carbon relationship. In summary, water, carbon and ecology constitute a “element-process-function” progressive system: water and carbon are the basic process, and ecology is the integrated service output. To provide scientific basis for ecological protection and high-quality development of the Yellow River basin, it is necessary to avoid isolated analysis and pay attention to their interaction mechanism and comprehensive effects at the basin scale. The logical relationship and analysis framework of W-C-E are shown in.
To sum up, there are still certain lacunae in the current research on the coupled and coordinated development of the W-C-E system. The current research mainly focuses on water-energy-carbon, water-energy-grain research, lack of unified standards and quantitative methods for W-C-E system coupling coordination research. In this paper, the WCENI index and the quantitative index of W-C-E system coupling coordination are presented. This study can provide scientific basis for the coordinated development of regional water-carbon-ecology coupling. In view of the critical role of the coupled and coordinated development of the W-C-E system in promoting China’s sustainable development strategy, this study constructed the WCENI nexus index, comprehensively taking into account the inherent richness of a single system, the synergy between dual systems, and the robustness after the integration of the third system, thereby filling the void in the quantification of the coupling coordination relationship of the W-C-E system. On this basis, through the barrier degree model and the geographic detector model, this study conducted an in-depth analysis of the restrictive degree of each evaluation index on the linkage relationship and quantitatively identified the potential influence of external driving factors on the linkage relationship. The research results not only offer a theoretical foundation for quantifying the coupling coordination degree among the W-C-E systems but also provide a scientific basis for optimizing resource allocation and adjusting the industrial structure in regional areas.
2 Material and methods
2.1 Research framework
This study investigated the coupling and coordinated relationship of the W-C-E system and its driving factors in the nine provincial regions of the YRB through a four-step approach. (1) The coupling and coordinated mechanism analysis of the W-C-E system served as the basis for quantitative analysis. From a qualitative perspective, this study clarified the interaction relationships among the components of the W-C-E system. (2) Based on the results of the mechanism analysis, the WCENI index was proposed, and an evaluation index system for the coupling and coordinated development of each dimension of the W-C-E system in the nine provincial regions of the YRB was constructed. (3) The WCENI index values of each dimension in the study area were quantitatively calculated. According to the calculation results of the index and the division of index grades, the degree of coupling coordination of the YRB was qualitatively analyzed. (4) Combined with the evaluation index system and the results of the coupling coordination degree, an external driving factor system was constructed to comprehensively analyze the driving factors of the coupling and coordinated development of the W-C-E system in the study area. Multidimensional evaluation model
2.2 Construction of evaluation index system
The W-C-E system coupling coordination evaluation index system established in this study aims to quantify the interaction between water, carbon and ecosystem in the Yellow River Basin based on the system coupling theory and sustainable development goals. The abundance system selects a single index of water-carbon-ecology, such as per capita water consumption, to represent the pressure of human activities and the adjustment ability of nature. The interactive index of coordination system selects ecological water consumption and directly reveals the coupling mechanism between systems. The robust sub-system selects indicators such as per capita GDP, considers theoretical completeness and watershed particularity, and reduces subjective bias through combination weighting method, which provides scientific basis for identifying driving factors and making differentiated policies. The coupled and coordinated development of the W-C-E system is a rather complex process, influenced comprehensively by multiple factors such as economy, society, and the natural environment. In this paper, a multi-dimensional assessment model framework is constructed from the perspective of the coupled and coordinated development of the W-C-E system, aiming at calculating the W-C-E nexus index. Based on the principles of data quantifiability, comparability, and accessibility, the index system of each system is constructed with the richness of a single system, the coordination between dual systems, and the robustness of the third system. Among them, the single systems refer to the water system, the carbon system, and the ecological system; the dual systems refer to the W-C system, the W-E system, and the C-E system; the third system refers to the W-C-E system. This study selects GDP and other indicators as robustness indicators, mainly based on the following theoretical assumptions and empirical considerations: First of all, based on the environmental Kuznets curve theory, it is assumed that there is a nonlinear relationship between economic development level (GDP) and resource and environmental pressure. Regions with high GDP should have stronger coordination ability of W-C-E system, but at the same time, the standardization of GDP per capita and per place can avoid the deviation caused by simple scale effect. Secondly, according to the characteristics of 70% of agricultural water use in the Yellow River Basin, it is assumed that the proportion of primary industry can effectively reflect the intensity of regional agricultural water use and the difficulty of low-carbon transition. This hypothesis is verified by the comparison of WCENI differences between Ningxia (8.7%) and Henan (9.4%). The “water-carbon-ecology” system in the Yellow River Basin is highly coupled, and the change of a single factor may trigger a chain reaction (such as the shortage of water resources inhibits vegetation carbon sequestration and aggravates ecological degradation). Coupling coordination analysis can quantify the degree of collaboration or conflict among the three, and reveal the critical point of system evolution. Barrier analysis can identify key limiting factors (such as inefficient water use or excessive carbon emissions in a region), while two-factor interaction analysis (such as Granger causality tests) can resolve causal chains and avoid misinterpreting correlations as causality. These methods together build a theoretical framework of system coupling and make up for the shortcomings of traditional single-factor research. The evaluation index system is shown in Figure 1.
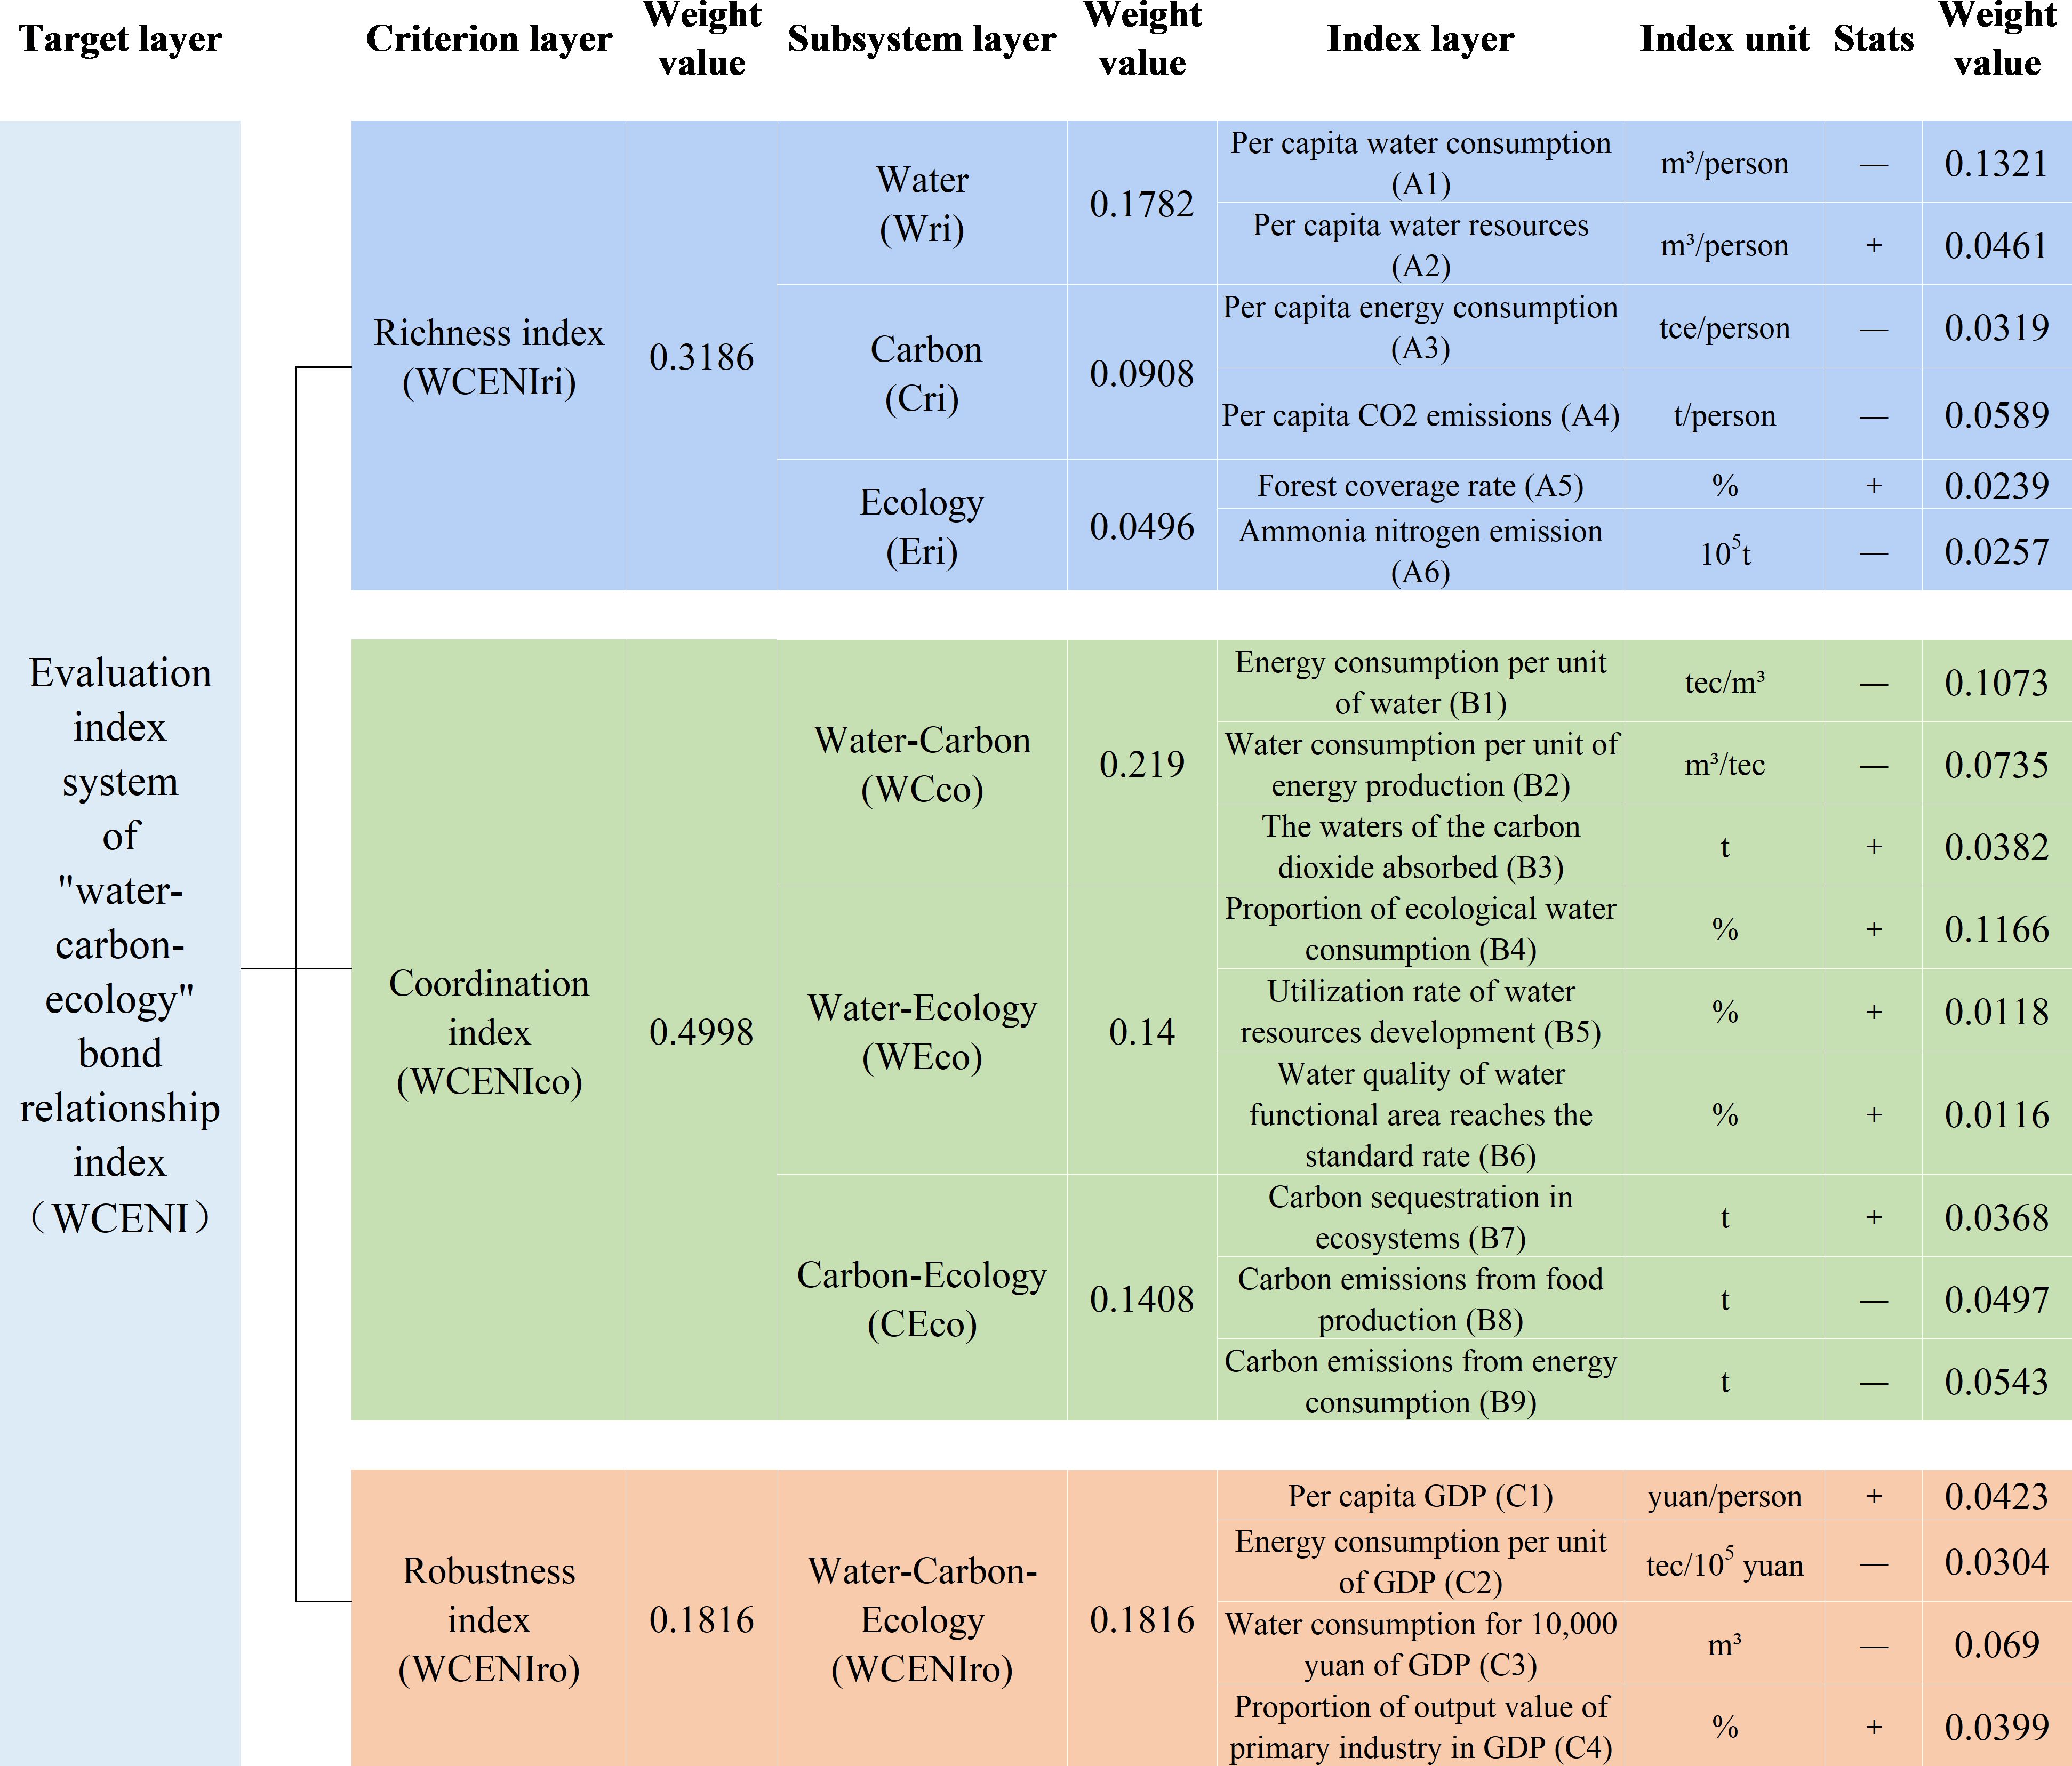
Figure 1. Evaluation index system and weight values.
2.2.1 Determining indicator weights
In this study, AHP method is used to calculate subjective weight, CRITIC weight method is used to calculate objective weight, and on this basis, minimum information entropy principle is introduced to form a combination weight calculation method based on the minimum information entropy principle. This study adopts the subjective and objective weight combination weighting method, which is mainly based on two considerations: First, the three methods are complementary. Second, relying solely on objective weights has limitations, which may ignore the policy value of strategic indicators (such as per capita water resources), which is difficult to reflect the particularity of the “water-economy” contradiction in the basin, and cannot effectively compensate for the impact of the absence of early ecological data (Equation 1).
On the basis of a single weight calculation method, this study introduces the combination weight based on minimum information entropy, and the principle of minimum information entropy can use subjective and objective weights to obtain the optimal combination weight value, so as to minimize the deviation between subjective and objective weights and make the obtained combination weight value more scientific. The weight calculation results are shown below. The calculation formula is as follows:
In the formula, wei is the comprehensive weight; wEi is the objective weight determined by entropy method. wAi is the subjective weight determined by analytic hierarchy process, and m is the number of indicators.
2.2.2 “W-C-E” system coupling coordinated development index
Based on the analysis of the coupling coordination mechanism of W-C-E, this study put forward the W-C-E nexus index (WCENI), which comprehensively reflects the coupled coordinated development level of the W-C-E system. The calculation formula is as follows:
In the formula, WCENIri is the reliability index of a single system, WCENIco is the coordination index between two systems, and WCENIro is the robustness index of the third system. Li,t are the corresponding index values after standardization. WCENIri,co,ro represents the richness, harmony, and robustness of the “W-C-E” system. Wri,co,ro represent the richness of the water system and the coordination and robustness of the water system with the carbon-ecosystem; Cri,co,ro represent the richness of the carbon system and the coordination and robustness of the carbon system with the water-ecosystem; Eri,co,ro respectively represent the richness of the ecological system and the coordination and robustness of the ecological system with the water-carbon system.
This study computes the WCENI index values from three dimensions: the richness of a single system, the coordination between dual systems, and the robustness of the third system. The WCENI index results are used to comprehensively reflect the coupled and coordinated development level of the W-C-E system in the YRB. In this paper, based on the WEFNI index values, the coupled and coordinated development level of the W-C-E system is classified into five grades: high level, relatively high level, medium level, relatively low level, and low level. The classification results are shown.
2.3 Analysis of driving factors
2.3.1 Obstacle factor analysis
In this study, the obstacle degree model was introduced to analyze the obstacle factors of the indicators in the evaluation system, with a view to determining the main obstacle factors affecting the coordinated development of the system coupling, to formulate more targeted improvement measures. The specific steps are as follows:
(1) Calculate the contribution degree of the j -th evaluation index :
In the formula: is the weight value of the criterion layer corresponding to the index.
(2) Calculate the deviation :
In the formula, xij is the result of index normalization.
(3) Calculate the obstacle degree of each evaluation index :
2.3.2 Geographic detector model
Geographic detector model is a statistical method to detect spatial heterogeneity and reveal its drivers, which includes a total of four detectors: factor detection, interaction detection, risk detection, and ecological detection, the first two components of which were used in this study. The core idea of factor detection is to determine whether the explained variable plays a decisive role in the explained variable by comparing whether the explained variable and the explained variable have similar spatial distribution, the calculation process is as follows:
In the formula: q∈[0,1] is the explanatory power of the driving factor of the system coordination level. The larger the value of q, the stronger the explanatory power of the driving factor, h=1,…, L is the stratification of variables or factors; and are the number of units in the layer and the whole area; and is the variance of the layer and global values.
When constructing the W-C-E system coupling and coordination evaluation system, this study constructs the external driving force index system from nine dimensions based on the development characteristics of the Yellow River Basin. The selection of these indicators follows the following principles: (1) System coverage, ensuring that all key dimensions of social economy are covered; (2) Policy relevance, which is connected with the high-quality development policy of the basin; (3) Data availability to ensure the integrity of provincial panel data from 2002 to 2017; (4) The clarity of the driving mechanism, each index has been confirmed by the literature to have a significant impact on the W-C-E system. Based on the established evaluation index system, in this study, according to the coupling coordination mechanism of the W-C-E system and in combination with the actual situation, nine aspects are selected to construct the external driving force index system, as shown in the Table 1.
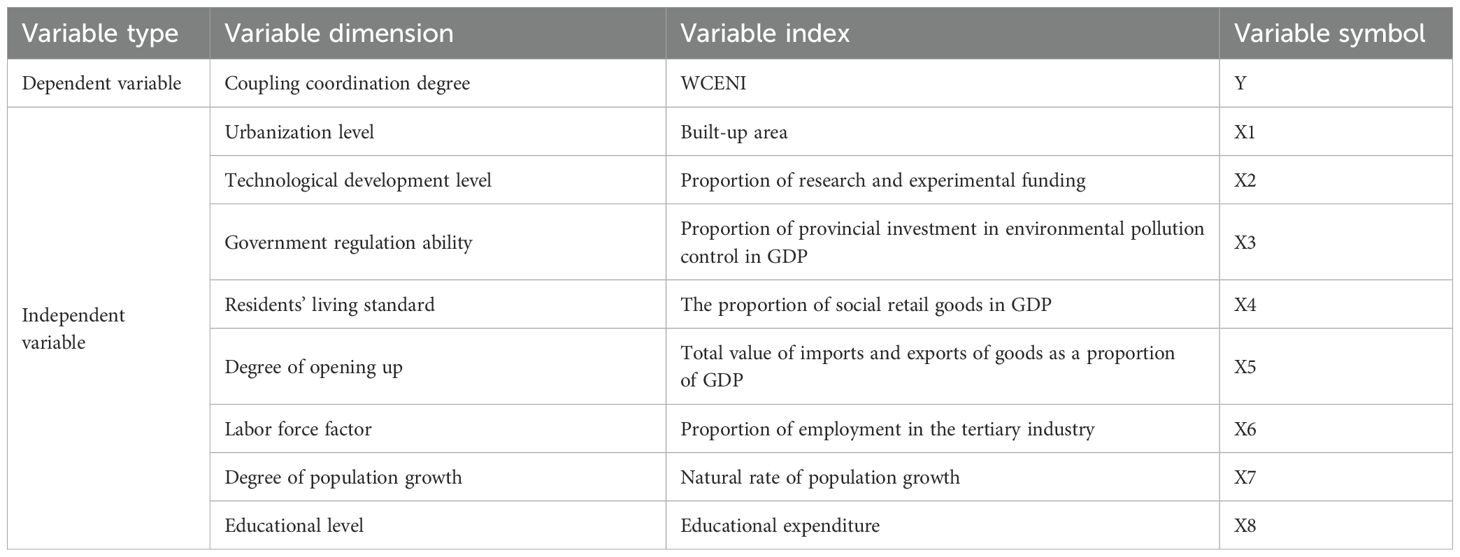
Table 1. External factor index system.
3 Results and discussion
3.1 Coupled coordination system analysis
3.1.1 Richness of a single system
This study analyzed the richness index of the single W-C-E system in the YRB from the multi-dimensional perspectives of the water system, the carbon system, and the ecological system. Presents the results and spatial variation trends of the richness index of the single W-C-E system in the YRB from 2002 to 2017.
Shows the results and spatial trends of Wri index for YRB from 2002 to 2017. As shown in the figure, the average Wri index value for the YRB in 2002 was 0.04439, which increased to 0.04764 in 2017. The Wri index values of most provinces in the YRB showed different trends of growth, with higher values in Qinghai, Sichuan, Gansu, Shaanxi, and higher values in Ningxia, Shanxi, and Shandong. The Wri index value of Henan increased the most from 0.0333 to 0.04158 from 2002 to 2017, mainly because although the per capita water consumption in Henan increased by less, the per capita water resources in Henan increased from 418.4 m³/person to 443.2 m³/person. Although the per capita water consumption in Shandong and Nei Mongol increased by less, the per capita water resources in both places had a downward trend, so the Wri index value of Shandong decreased from 0.03748 to 0.0325, and the Wri index value of Nei Mongol decreased from 0.0526 to 0.0469. Qinghai has a higher per capita water consumption, but its per capita water resources are the highest among the YRB, so it has a higher Wri index value.
Presents the results and spatial variation trends of the Cri index for the YRB from 2002 to 2017. As can be observed from the figure, the average Cri index value for the YRB in 2002 was 0.076, which declined to 0.0615 in 2017. The Cri index values of most of the YRB demonstrated diverse decreasing trends. The Cri index values were relatively higher in Sichuan, Henan, and Shandong, while they were lower in Shanxi and Nei Mongol. From 2002 to 2017, the Cri index value of Sichuan was the highest, with an average of 0.18595. This was mainly attributed to the relatively low per capita carbon dioxide emissions in Sichuan. As of 2017, the per capita carbon dioxide emissions in Sichuan were only 3.214 tons per person. The province with the greatest reduction in the Cri index value was Gansu, which dropped from 0.06452 to 0.04992. This was mainly because the per capita energy consumption in Gansu more than doubled during the period from 2002 to 2017, leading to a continuous increase in per capita carbon dioxide emissions. Although Shandong has a relatively high absorption capacity of carbon dioxide in water bodies, its per capita carbon dioxide emissions are the highest among the YRB. Consequently, the Cri index value of Shandong is relatively low, with an average of 0.0478.
Presents the outcomes and spatial variation trends of the Eri index for the YRB from 2002 to 2017. It can be observed from the figure that the average Eri index value of the YRB in 2002 was 0.07144, which rose to 0.076 in 2017, with an increase of 6.38%. Among them, more provinces witnessed a decline in the Eri index value. Nei Mongol, Shandong, and Shaanxi had relatively higher Eri index values, while Shanxi and Sichuan had lower values. From 2002 to 2017, Nei Mongol had the highest Eri index value. In 2002, it was 0.05551, and in 2017, it was 0.0936. This was mainly due to the higher endowment of its own resources. The forest coverage rate of Nei Mongol was 22.1% in 2017, and the proportion of agriculture and animal husbandry in the economy was relatively high, with a lower ammonia nitrogen emission. From 2002 to 2017, the ammonia nitrogen emission in Qinghai was the lowest among the YRB. However, due to its poor forest coverage rate, which was only 5.8% in 2017, the average Eri index value of Qinghai was relatively low, at 0.0705.
Shows the results and spatial trends of the richness index of the W-C-E system in the YRB from 2002 to 2017. As can be seen from the figure, for the WCENIri index of a single system, the WCENIri index of most areas is in an upward trend, of which the increase in the WCENIri index of Henan is the highest, from 0.198 to 0.208509. By 2017, the WCENIri index value of Sichuan was 0.2931, the highest among the YRB, and the WCENIri index values of the YRB showed no obvious decline, with a stable upward trend.
3.1.2 Coordination between two systems
This study analyzed the coordination index between the dual systems of the W-C-E system in the YRB from the perspectives of the W-C system, W-E system, and C-E system. Shows the results and spatial trends of the coordination index between the dual systems of the W-C-E system in the YRB from 2002 to 2017.
Presents the results and spatial variation trends of the WCco index for the YRB from 2002 to 2017. It can be discerned from the figure that the average WCco index value for the YRB was 0.0458 in 2002 and 0.04424 in 2017, showing no distinct changing trend. The WCco index values were relatively high in Nei Mongol and Qinghai, while those in Ningxia and Sichuan were lower. From 2002 to 2017, the WCco index value in Henan increased from 0.038541 to 0.0415. This was mainly attributed to the year-on-year reduction in water consumption per unit of energy production in Henan, which decreased from 353.59 m³/tec to 226.23 m³/tec. The WCco index value in Shandong decreased from 0.0428 to 0.0358. This was mainly because of the overly rapid growth of the economy and population in Shandong, resulting in a higher energy consumption per unit of water use. Although the energy consumption per unit of water use in Qinghai was also relatively high, due to the higher absorption of carbon dioxide by water bodies and the lower water consumption for per unit of energy production in Qinghai, the WCco index value of Qinghai remained relatively stable.
Presents the results and spatial variation trends of the WEco index for the YRB from 2002 to 2017. It can be observed from the figure that the average WEco index value for the YRB in 2002 was 0.04178, and that in 2017 was 0.05099, with an increase of 22.04%. The WEco index values in Henan and Shandong were relatively high, while those in Ningxia and Sichuan were relatively low. From 2002 to 2017, the WEco index value of Shandong was the highest, increasing from 0.0725 to 0.07982. This was mainly attributed to the high proportion of ecological water use in Shandong, with the proportion of ecological water use reaching 3.26% in 2017. The WEco index value of Ningxia increased from 0.0185 to 0.0312, with the highest growth rate among the YEB. This was mainly because the increase in the proportion of ecological water use in Ningxia was the highest among the YRB, rising from 1.2% to 2.94%. The WEco index values of the remaining provinces showed no significant differences and all increased to varying degrees.
Displays the results and spatial variation trends of the ECco index for the YRB from 2002 to 2017. It can be seen from the figure that the average ECco index value for the YRB in 2002 was 0.04211, and that in 2017 was 0.04042, with a slight decrease. Nei Mongol, Shandong, and Ningxia have relatively higher ECco index values, while Shanxi, Gansu, and Qinghai have relatively lower ones. The ECco index value of Shanxi had the highest increase among the YRB. This was mainly due to its relatively low carbon emissions and a significant increase in carbon absorption. Although Shandong and Nei Mongol also have high carbon emissions, they have higher ECco index values thanks to their better natural endowments and higher carbon absorption by the ecosystems.
Presents the results and spatial variation trends of the coordination index of the W system in the YRB from 2002 to 2017. It can be observed from the figure that, for the WCENIco index between the dual systems, the WCENIri index in most areas is in an upward trend. The WCENIco index of Sichuan decreased from 0.11598 in 2012 to 0.10642. This was mainly because the carbon emissions from energy consumption in Sichuan increased from 226,326,688.8t to 262,074,451.1t, and the absorption of carbon dioxide by water bodies decreased from 10,226.3261t to 9,584.327907t. The WCENIco index values of the remaining provinces were all in a steadily upward state.
3.1.3 The third system robustness
This study selected four indicators, namely per capita GDP, energy consumption per unit of GDP, water consumption per ten thousand yuan of GDP, and the proportion of the output value of the primary industry in GDP, to analyze the robustness index among the systems of the W-C-E system in the YRB. Shows the results and spatial variation trends of the WCENIro index in the YRB from 2002 to 2017.
In 2002, the average WCENIro index value for the YRB was 0.03044, while in 2017, the average WCENIro index value for the YRB was 0.0373, presenting a distinct upward trend. It can be seen from the that the WCENIro index values for all provinces from 2002 to 2017 have an increasing tendency. This is mainly attributed to the stable economic situation in each province, the year-on-year increase in per capita GDP, along with the vigorous promotion of clean energy in each province and the implementation of the strictest water resource protection system, the energy consumption per unit of GDP and water consumption per ten thousand yuan of GDP in each province have also decreased significantly. From 2002 to 2017, the WCENIro index value of Shanxi increased from 0.02986 to 0.03889, with the highest growth rate. This is mainly due to the increase in per capita GDP in Shanxi from 7,082 yuan per person to 41,242 yuan per person, and the reduction in water consumption per ten thousand yuan of GDP from 236.65 cubic meters to 49.19 cubic meters. The WCENIro index value of Gansu was the lowest among the YRB, but it had a relatively high growth rate, increasing from 0.0177 to 0.0236, with a growth rate of 33%.
3.1.4 Analysis of spatiotemporal variation trend of WCENI index
It can be observed that, overall, the WCENI index value in the YRB increased from 0.3371 in 2002 to 0.3571 in 2017, and its coupling coordination degree remained at a relatively low level. The WCENI index value of Shanxi was the lowest among the YRB, but it exhibited a relatively rapid increase, rising from 0.25536 to 0.27103. This was mainly because the WCENIri index value of Shanxi was low, and the richness of water, carbon, and ecology was poor. With the increase in the proportion of clean energy such as solar and wind energy and the reduction in the usage proportion of traditional energy such as coal in Shanxi, the WCENI index value of Shanxi presented a stable upward trend. The growth rate of the WCENI index value of Gansu was the highest among the YRB, increasing from 0.314062 to 0.3717, with a growth rate of 18.35%. This was mainly attributed to the multiple increase in per capita GDP in Gansu. Additionally, Gansu has been continuously adjusting its industrial structure and vigorously developing industries with low water consumption and high added value, resulting in a continuous decrease in water consumption per ten thousand yuan of GDP. The WCENI index value of Sichuan decreased from 0.34075 to 0.33182, although it decreased slightly, the overall trend was stable. In 2017, the WCENI index value of Henan was 0.415619, the highest among the YRB.
The WCENI index exhibited distinct spatiotemporal trends across different provinces in the YRB from 2002 to 2017. At the regional level, the overall WCENI value in the YRB showed a gradual increase from 0.3371 to 0.3571, indicating slight improvement in the water-carbon-ecology nexus coordination, though the coupling degree remained relatively low throughout the study period. Spatially, significant inter-provincial disparities were observed. Henan Province maintained the highest WCENI value in the basin, reaching 0.415619 in 2017, likely due to its more balanced economic-ecological development patterns. In contrast, Shanxi Province consistently recorded the lowest values (0.25536 in 2002 to 0.27103 in 2017), reflecting its initial poor water-carbon-ecology endowment, yet it demonstrated the most notable upward trend thanks to substantial energy structure transformation. The most dramatic growth occurred in Gansu Province, where the index surged by 18.35% (from 0.314062 to 0.3717), attributable to rapid economic growth and effective industrial restructuring. Sichuan Province represented a unique case with a mild decline (0.34075 to 0.33182), suggesting temporary stabilization pressures in its nexus management. These spatial patterns collectively reveal that while most provinces showed improving trends, the convergence speed varied significantly based on local socioeconomic conditions and policy effectiveness, with energy transition and industrial upgrading being key drivers for faster progress in ecologically vulnerable regions like Shanxi and Gansu (Equations 2–5).
3.2 Analysis of driving factors of “W-C-E” system
3.2.1 Analysis of obstacle factors in “W-C-E” system
This study employed the impediment degree model to calculate the impediment degrees of the obstacle factors of the W-C-E system in the YRB. On this basis, the top 9 main obstacle factors of the W-C-E system in the Yellow River Basin were screened and analyzed. The calculation results of the obstacle factors are presented as shown in the.
It can be discerned from the figure that the major obstacle factors restricting the coupled and coordinated development of the W-C-E system in the Yellow River Basin from 2002 to 2017 are A1 and B1, with average impediment degrees of 13.82% and 9.21% respectively. This is due to the fact that in the water utilization structure of the Yellow River Basin, agricultural water consumption holds a relatively high proportion, while the water use efficiency of agricultural water is relatively low, resulting in a lower per capita water consumption and a higher energy consumption per unit of water. The average impediment degree of B4 is 8.25%, suggesting that the YRB should increase the proportion of ecological water use. The average impediment degrees of C4 and A2 are 7.15% and 6.12% respectively, indicating that in the context of rapid economic development in the YRB, water use efficiency should be enhanced and water consumption per 10,000 yuan of GDP should be reduced.
The average impediment degrees of B7 and A5 in Qinghai are 6.9% and 5.8% respectively. This is mainly attributed to the relatively low forest coverage rate in Qinghai. In 2017, the forest coverage rate in Qinghai was 5.8%, the lowest among the YRB. The average impediment degrees of C3 in Gansu and Ningxia are 7.4% and 6.64% respectively. This is mainly because Gansu and Ningxia have actively adjusted their industrial structures in recent years, leading to a year-on-year decrease in water consumption per 10,000 yuan of GDP. As of 2017, the figures were 152.39 cubic meters and 213.11 cubic meters respectively. The average impediment degrees of B8 in Henan and Shandong are 13.2% and 13.4% respectively. This is mainly because both places are major grain-producing provinces. In 2017, the grain output in Henan and Shandong was 59.734 million tons and 47.232 million tons respectively. The average impediment degrees of A3 in Shaanxi and Shanxi are 8.25% and 9.84% respectively, indicating that as major energy-consuming provinces, they should enhance energy utilization efficiency and promote clean energy such as wind energy to reduce energy consumption.
3.2.2 “W-C-E” system of the single factor detection analysis
In this study, eight external factors are selected as independent variables, and the WCENI index of the Yellow River Basin is taken as the dependent variable. The relationships between the coupling coordination degree and each factor are calculated using the geographic detection model. The results of the single-factor detection are presented as shown in the.
It can be observed from the figure that the q values of all factors are greater than 0, indicating that the eight selected external influencing factors can all promote the coupled and coordinated development of the W-C-E system in the YRB.
From 2002 to 2017, the q values of X1 and X2 exhibited a significant increase, belonging to strongly correlated factors. This suggests that the improvement of the urbanization level has a significant influence on the coordinated development of the W-C-E system. Technological development can provide technical support for the coordinated development of the system. The values of the remaining factors have increased to varying degrees. Although the q value of X7 decreased from 0.47 in 2017 to 0.43, the overall trend is stable.
3.2.3 Analysis of interaction between two factors
Bivariate Enhancement and Dual-Factor Enhancement are two improvement methods based on multi-dimensional optimization, the core difference being the focus. Bivariate enhancement focuses on the simultaneous use of two variables for joint analysis or adjustment, while two-factor enhancement focuses on the balance optimization of two mutually influencing objectives or constraints. The former emphasizes the interaction between variables, while the latter focuses on the synergy or game relationship between objectives, and the specific application needs to be further refined according to the needs of the field. The results of the interaction exploration between two factors of the W-C-E system are presented in. As can be observed from the figure, the impact of the interaction between the two factors on the WCENI index varies in different periods. There is no phenomenon of mutual independence or nonlinear weakening between the two factors. After the interaction of the factors, some exhibit nonlinear enhancement, that is, the influence intensity of the interaction of any two factors on the coupled and coordinated development of the system is stronger than the sum of the influence intensities of the two individual factors. Some others show dual-factor enhancement, that is, the influence intensity of the interaction of any two factors on the coupled and coordinated development of the system is greater than the maximum value of the two individual factors.
During the period of 2002–2017 in terms of factor interaction, bivariate enhancement relationships predominated, accounting for 64.28%, 67.86%, 51.25%, and 53.57% respectively. Throughout the study period, the interaction forces between X2, X3, and X7 with other factors were the most notable, suggesting that the government’s regulatory capacity as well as the government’s investment proportion in the ecological environment and population growth play an irreplaceable role in the coupled and coordinated development of the system. From 2002 to 2017, the interaction values between X1 and X7 were 0.9, 0.95, 1, and 1 respectively, while those between X7 and X8 were 0.87, 0.9, 0.9, and 0.98 respectively. All of these were greater than the high impact level of 0.8, indicating a strong interaction. In 2017, the interaction between X2 and X8 reached 1, suggesting that the advancement of core technologies is conducive to reducing the investment proportion of each province in pollution control (Equations 6–9).
4 Conclusions and policy proposals
4.1 Conclusions
This research proposed the WCENI nexus index based on the richness of a single system, the coordination between dual systems, and the robustness of the third system to investigate the coupling coordination relationship and influencing mechanism of the regional W-C-E. Taking W-C-E as the research object, this study constructed a multi-dimensional coupling coordination evaluation index system for the W-C-E system and analyzed the coupling coordination relationship of the W-C-E system in the YRB through the WCENI index. Moreover, based on the impedance model and the geographic detector model, this research analyzed the main driving factors for the coupled and coordinated development of the regional W-C-E system. The following conclusions were obtained from this study:
(a) The spatio-temporal evolution characteristics of the richness of the single system, the coordination between the dual systems, and the robustness of the third system were analyzed. Due to the differences in natural endowments and industrial structures among the YRB, there are considerable differences in the index values of the systems. The WCENIro and WCENIco index values are higher in economically more developed regions, while the WCENIri index values are higher in relatively less economically developed regions. The average WCENIri index value in Qinghai is 0.233, the average WCENIco index value in Nei Mongol is 0.175, and the average WCENIro index value in Shandong is 0.0498, all of which are the highest among the YRB.
(b) The spatio-temporal evolution characteristics of the WCENI index were analyzed. The average WCENI index value of Henan was 0.3994, which was the highest among the YRB. During the research period, the coupling coordination degree of the W-C-E system in the YRB was mostly at a medium level, and the average WCENI index generally showed an upward trend of varying degrees.
(c) The driving factors of the W-C-E coupling coordination relationship were analyzed. In the multi-dimensional evaluation index system, the average impediment degree of A1 was the highest, at 13.81%. Among the external driving factors, the interaction between any two factors was greater than the sum of the two factors or the maximum value of the two factors. The interaction forces between X2, X3, X7 and other factors were the most significant.
4.2 Policy proposals
Based on the analysis of the coupling coordination of the W-C-E system and the study of driving factors in the YRB, the following suggestions are put forward in this study:
(a) There is an uneven development of systems among different provinces and municipalities. Provinces and municipalities should formulate development strategies based on their unique characteristics of regional natural endowments and development foundations. Specifically, they should focus on the rational use of water resources by scientifically regulating and optimizing water allocation to balance water resources allocation among regions and effectively alleviate the problem of water scarcity and uneven spatial distribution. At the same time, developed areas should leverage their technological and financial advantages to provide necessary technical support and financial input to less developed areas to promote coordinated development among regions and narrow the development gap. In view of the significant difference in water resource utilization efficiency between the upper and lower reaches of the basin and the uneven spatial distribution, it is proposed to establish an inter-provincial compensation mechanism based on the ecological service value model. The economically developed downstream provinces (Shandong, Henan, etc.) should compensate the upstream ecological protection areas (Qinghai, Sichuan, etc.) through financial transfer payment. At the same time, in areas with low irrigation efficiency (Gansu, Ningxia, etc.), emphasis should be placed on promoting efficient water-saving technologies, and priority should be given to transforming areas with high water-consuming crops.
(b) Facing the era’s requirements for sustainable development, provinces and municipalities should accelerate the adjustment of their industrial structures and give priority to the development of green industries with low energy consumption and low emissions. This not only helps to reduce excessive reliance on traditional energy sources but also fundamentally lowers environmental pollution and carbon emissions. In terms of policy guidance, each province should establish and improve a scientific assessment and evaluation system, and the WCENI index value can be incorporated as an important indicator in the performance assessment of local governments. In view of the significant positive correlation between carbon intensity and coal dependence, high-carbon provinces such as Shanxi should focus on phasing out “coal-thermal power high-carbon clusters” and developing renewable energy sources, while incorporating carbon intensity reduction rates into local government performance evaluation systems.
(c) Local governments and enterprises should enhance the supervision and governance of industries with high water consumption and high pollution, and promote the transformation of these industries towards water conservation, emission reduction and green production. Meanwhile, encourage and support the research and development and application of green innovative technologies, such as water resource recycling technology and clean production technology, in order to achieve a win-win situation of economic development and environmental protection. In view of the insufficient application of green technologies in papermaking, chemical industry and other industries, it is suggested to implement dynamic monitoring of key polluting enterprises, link environmental penalties with ecological loss valuation, and force the promotion of efficient emission reduction technologies verified by this study (such as papermaking water reuse technology with ROI>15%), and support corresponding fiscal and tax incentive policies.
Data availability statement
The original contributions presented in the study are included in the article/supplementary material. Further inquiries can be directed to the corresponding author.
Author contributions
JL: Formal analysis, Funding acquisition, Project administration, Resources, Validation, Visualization, Writing – original draft, Writing – review & editing. YH: Conceptualization, Data curation, Investigation, Methodology, Software, Supervision, Writing – original draft, Writing – review & editing. MZ: Formal analysis, Project administration, Supervision, Validation, Writing – original draft, Writing – review & editing. ZJ: Funding acquisition, Resources, Visualization, Writing – original draft, Writing – review & editing.
Funding
The author(s) declare that no financial support was received for the research and/or publication of this article.
Conflict of interest
The authors declare that the research was conducted in the absence of any commercial or financial relationships that could be construed as a potential conflict of interest.
Generative AI statement
The author(s) declare that no Generative AI was used in the creation of this manuscript.
Publisher’s note
All claims expressed in this article are solely those of the authors and do not necessarily represent those of their affiliated organizations, or those of the publisher, the editors and the reviewers. Any product that may be evaluated in this article, or claim that may be made by its manufacturer, is not guaranteed or endorsed by the publisher.
References
Liu J., Wang H., and Zhao Z. (2024). Improvement and application of the ecological footprint calculation Method—A case study of a Chinese university. J. Clean. Product. 450, 141893. doi: 10.1016/J.JCLEPRO.2024.141893
Keywords: Yellow River Basin, water-carbon-ecology, coupled coordination, driving factors, WCENI
Citation: Li J, Han Y, Zhao M and Jiang Z (2025) Collaborative optimization path of the "water-carbon-ecology" system in the Yellow River Basin: spatio-temporal evolution and driving factors. Front. Ecol. Evol. 13:1586301. doi: 10.3389/fevo.2025.1586301
Received: 11 March 2025; Accepted: 14 April 2025;
Published: 21 May 2025.
Edited by:
Emmanuel Chukwuma, Forestry Research Institute of Nigeria, NigeriaReviewed by:
Zhiwei Wan, Jiangxi Normal University, ChinaWeiqi Xiang, Beijing Normal University, China
Copyright © 2025 Li, Han, Zhao and Jiang. This is an open-access article distributed under the terms of the Creative Commons Attribution License (CC BY). The use, distribution or reproduction in other forums is permitted, provided the original author(s) and the copyright owner(s) are credited and that the original publication in this journal is cited, in accordance with accepted academic practice. No use, distribution or reproduction is permitted which does not comply with these terms.
*Correspondence: Yuping Han, aGFueXBAbmN3dS5lZHUuY24=