 Yuejing Rong
 Lifu Zheng1,2
- 1State Key Laboratory of Regional and Urban Ecology, Research Center for Eco-Environmental Sciences, Chinese Academy of Sciences, Beijing, China
- 2University of Chinese Academy of Sciences, Beijing, China
Water ecological security plays a crucial role in watershed management for sustainable development and social stability. For a watershed’s ecological security, the effective matching of the supply and demand of water-related ecosystem services and the complex trade-offs among different services are essential. This study is centered on China’s water-scarce Haihe River Basin, aiming to contribute to the basin’s ecological security by exploring strategies to balance service supply and demand and enhance synergies. This study investigated and assessed the dynamic supply–demand relationship of water-related ecosystem services in the Haihe River Basin. It analyzed the evolution law of service flow and quantified the trade-offs between different services to identify strategies for balancing supply and demand, maintaining a stable flow, and exploring management interventions.The results show that: (1) Over the past 20 years, the supply of water conservation service (WCS) and soil conservation service (SCS) increased overall but declined locally. WCS declined in the Yongding River Basin and parts of the North China Plain, while SCS decreased in the Yanshan Mountains and the North China Plain. WCS demand dropped in 40% of the basin (the Plain), and SCS demand remained high in mountainous areas due to erosion. (2) High-value areas of WCS flow are in the Zhangwei River Basin’s mountain–plain transition zone, SCS flow in the North China Plain, and Water Purification Service (WPS) in high-altitude mountain areas. WPS shows insufficient flow, which hinders the supply–demand balance. (3) In supply–demand matching respects, the deficit area of WCS expanded because of high water demand in human-activity-intensive areas. SCS has supply-demand imbalances in both mountains and plains, and WPS shows a serious basin-wide deficit. (4) In Service trade-offs respects, WCS and SCS maintain a strong correlation (R≥0.90). The synergy between WCS and WPS changed due to agricultural pollution and riparian degradation. There is no significant correlation between SCS and WPS. Therefore, the innovation of this study lies in focusing on the supply–demand matching and spatial trade-offs of services in watershed ecological security. The findings offer valuable insights for optimizing water ecosystem management practices and informing policy decisions. By understanding these relationships and trade-offs, appropriate management interventions can be designed to mitigate negative trade-offs and enhance synergies, ultimately achieving the watershed ecological security.
1 Introduction
Ecological security is an important window to examine the complex connection between ecosystem integrity and sustainable human existence, and serves as the foundation for other forms of security (Abernethy, 1999; DiMento, 2007; Lyu et al., 2022). Watersheds are the basic unit of ecological study, and basin water ecological security pertains to the sustainable management and protection of water resources (Xia et al., 2007; Li et al., 2023), ensuring the health of ecosystems and meeting human survival requirements (Li, 2023; Liu et al., 2020). For the ecological security of a watershed, the key lies in the effective matching of the supply and demand of water-related ecosystem services, ecological process (Palmer and Ruhi, 2019) and the trade-offs among these services (Peng et al., 2018; Li et al., 2023b; Lyu et al., 2025). Reasonable matching and trade-offs ensure that natural ecosystems can optimally provide services such as water purification, flood regulation, and water supply, while socio-economic systems can utilize these services in a sustainable manner (Syrbe and Grunewald, 2017; Zheng et al., 2019). However, current research lacks a comprehensive understanding of how the mechanisms of ecosystem service supply and demand processes at the watershed scale, as well as the associated trade-offs, influence watershed ecological security.
In recent years, significant progress has been made in the research on the supply, demand assessment, and matching of watershed ecosystem services. Many studies have integrated remote sensing technology and Geographic Information Systems (GIS), employing multi-scale analysis methods to simulate changes in supply and demand under different scenarios through modeling (Villamagna et al., 2013; Chaminé et al., 2016; Pei et al., 2021). This approach enhances the accuracy and precision of assessments. Additionally, eco-economic integrated assessment frameworks have been utilized to analyze the matching between supply and demand of various ecosystem services within watersheds (Ding and Sun, 2023). These studies not only provide detailed ecosystem service maps but also reveal interactions among different services and potential mismatches, offering scientific evidence for watershed management decisions. In terms of research on water and soil resource matching in watersheds, algorithms for water and soil resource matching models that combine information entropy theory with multi-objective optimization have been proposed (Ursulak and Coulibaly, 2021). Based on the theory of system coupling and coordination, the response mechanisms between watershed ecosystem services and water and soil resources have been explored (Yang et al., 2021; Yao et al., 2023). Furthermore, studies on the spatial variation of ecosystem service clusters and their influencing factors have been conducted as a reference for implementing ecosystem service zoning management strategies (Raudsepp-Hearne et al., 2010; Lu et al., 2024). Notably, recent research has demonstrated the importance of balancing and regulating service flows for achieving watershed security and sustainable development (Wang et al., 2022; Zhang et al., 2023; Felipe-Lucia et al., 2015; Xue et al., 2024). Understanding the dynamics of ecosystem service supply and demand at specific spatial and temporal scales, as well as the characteristics of their service flows, serves as the theoretical foundation for the regulation and management of watershed ecosystems (Bagstad et al., 2014).
Significant progress has been made in research on the trade-offs and synergies among different ecosystem services within watersheds. Researchers often employ tools such as cost–benefit analysis and multi-objective optimization models to identify and quantify the trade-offs between different services (Geng et al., 2022; Wang and Sun, 2025). By combining spatial indicators of multiple ecosystem service provisions with public perceptions and preferences for ecosystem service management, they comprehensively identify potential synergies and trade-offs in the supply of watershed ecosystem services (Zhang et al., 2023). This provides decision support for integrated water resources management at the watershed scale in the future. Additionally, studies have utilized correlation analysis and constraint methods to explore the trade-offs and synergies among ecosystem services and their constraint effects. These studies introduce the trade-offs and synergy index (TSI) to quantitatively measure the intensity of trade-offs and synergies between each pair of ecosystem services (Cai et al., 2024; Yang et al., 2024). Bayesian networks are constructed to identify driving variables, and sensitivity analysis is conducted to determine the extent to which key variables influence the strength of these relationships. These new research methods offer new perspectives and tools for a deeper understanding of the trade-offs and synergies among watershed ecosystem services, providing both theoretical and practical foundations for achieving multi-objective management. However, previous studies rarely combined supply–demand matching with trade-off relationships for analysis, jointly exploring how these two factors jointly influence the mechanisms of watershed ecological security (Wang et al., 2019).
Addressing the current challenges and bottlenecks encountered in water ecological security research, this study focuses on the Haihe River Basin, a representative region of water scarcity in China. The research delves into the matching of water-related ecosystem services supply and demand, including services such as water conservation, soil erosion control, and water quality purification. Additionally, it explores the trade-offs between these services to better understand their interdependencies and potential conflicts.Through the combination of ecosystem service supply and demand and trade-offs, we can more comprehensively evaluate the impact of different management strategies on ecosystem services, and provide strong support for formulating scientific and reasonable watershed ecological security management policies.
2 Data source and methodology
2.1 Research design
In this study, based on the ecological background of the Haihe River Basin, such as ecology, meteorology, topography, land use, soil texture, and other ecological parameters, as well as socio-economic parameters such as GDP, population, road density, and water resource consumption, and using the current more mature methods of assessing the supply and demand of WCS, SCS and WPS, we make a comprehensive assessment of the supply and demand levels of the three services in the Haihe River Basin. We also analyze the spatial characteristics of the relationship between ecosystem services and demand. By examining the spatial relationship between the supply and demand of ecosystem services and revealing the trade-off linkages between different services, we provide a comprehensive characterization of the overall and local ecological security status of the watershed. This analysis supports the development of future policies and strategies for watershed ecological safety and sustainable development (Figure 1). The following scientific questions are addressed: (1) how to accurately quantify the flow processes of different ecosystem services and their dynamics at the basin scale; (2) How to use the matching and trade-off relationships of ES to characterize watershed ecological security?
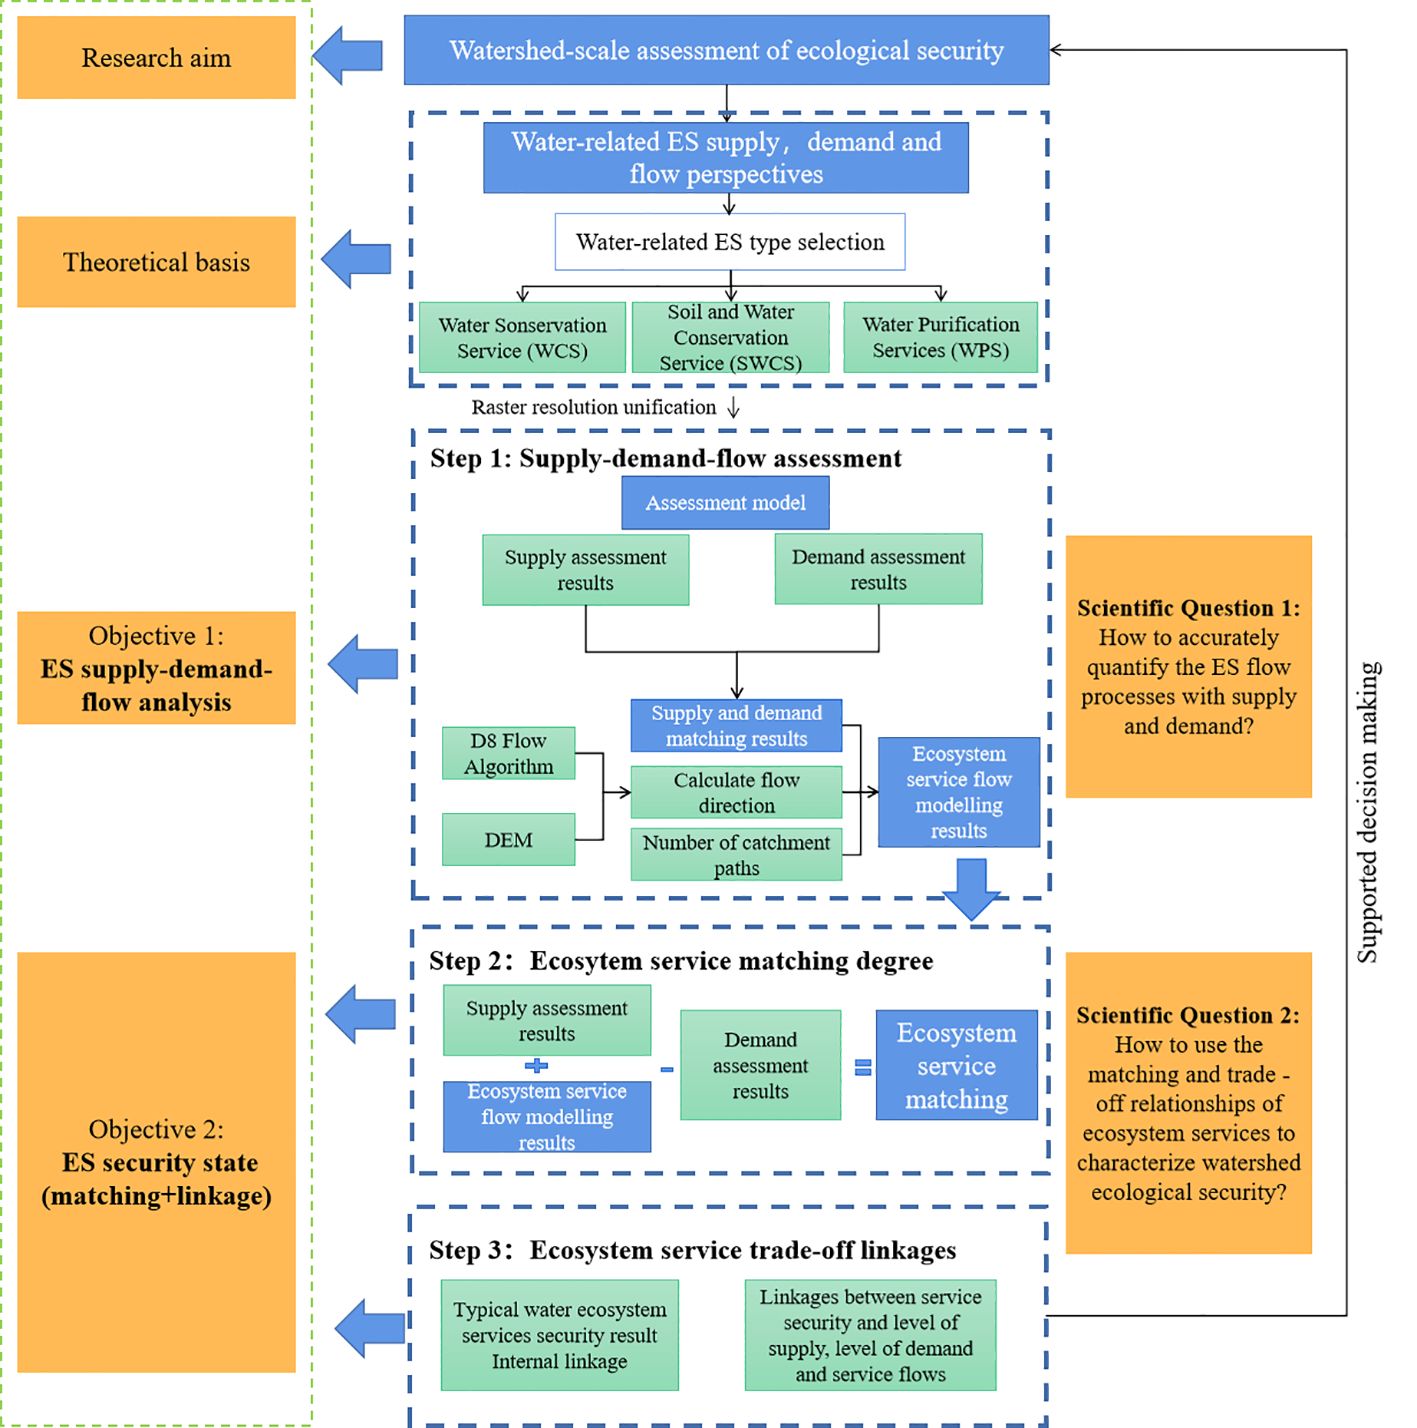
Figure 1. Research framework map.
2.2 Study area
The Haihe River Basin, located in North China, is a significant river system that flows northward into the sea. It covers a total area of about 318,000 square kilometers, spanning across several provinces and autonomous regions, including Beijing, Tianjin, Hebei, Shanxi, and Inner Mongolia. The basin experiences a typical temperate monsoon climate, characterized by seasonally variable precipitation that peaks in the summer and a relatively dry winter. The basin’s hydrological network is formed by five major direct tributaries: the Chaobai River, Yongding River, Daqing River, Ziya River, and the South Canal (section of the Zhangwei River), which constitute the backbone of the Haihe River system. These waterways are crucial for the distribution of water resources, soil and water conservation, and maintaining the ecological balance of the entire basin. The water resources of the Haihe River Basin are pivotal for the socio-economic development of the Beijing-Tianjin-Hebei region. However, the basin faces challenges such as water scarcity, water quality pollution, and ecological degradation. In terms of ecosystem types, the basin is predominantly agricultural, with farmlands accounting for about 40% of the total area, serving as the primary food production base of the region. Forests and grasslands are mainly distributed across mountainous areas, such as the Taihang and Yanshan mountains, which are significant for water conservation and biodiversity conservation. Urban ecosystems within the basin reflect the increasing trend of urbanization, which has profound implications for water resources, soil erosion, and other environmental concerns. Over the two decades from 2000 to 2020, the ecosystems of the Haihe River Basin have undergone significant changes. The reduction in farmland and grassland areas is linked to urban expansion, industrialization, and agricultural restructuring. Conversely, the increase in forested areas can be attributed to state-led ecological restoration efforts, including programs to convert farmland back to forests and tree-planting initiatives. The expansion of urban ecosystems mirrors the accelerated demographic growth and urbanization in the basin. Overall, the Haihe River Basin, with its complex ecosystems and diverse geographical features, holds considerable importance for the sustainable development of the region, especially in terms of combating soil erosion, managing water resources, and preserving ecosystem services (Figure 2).
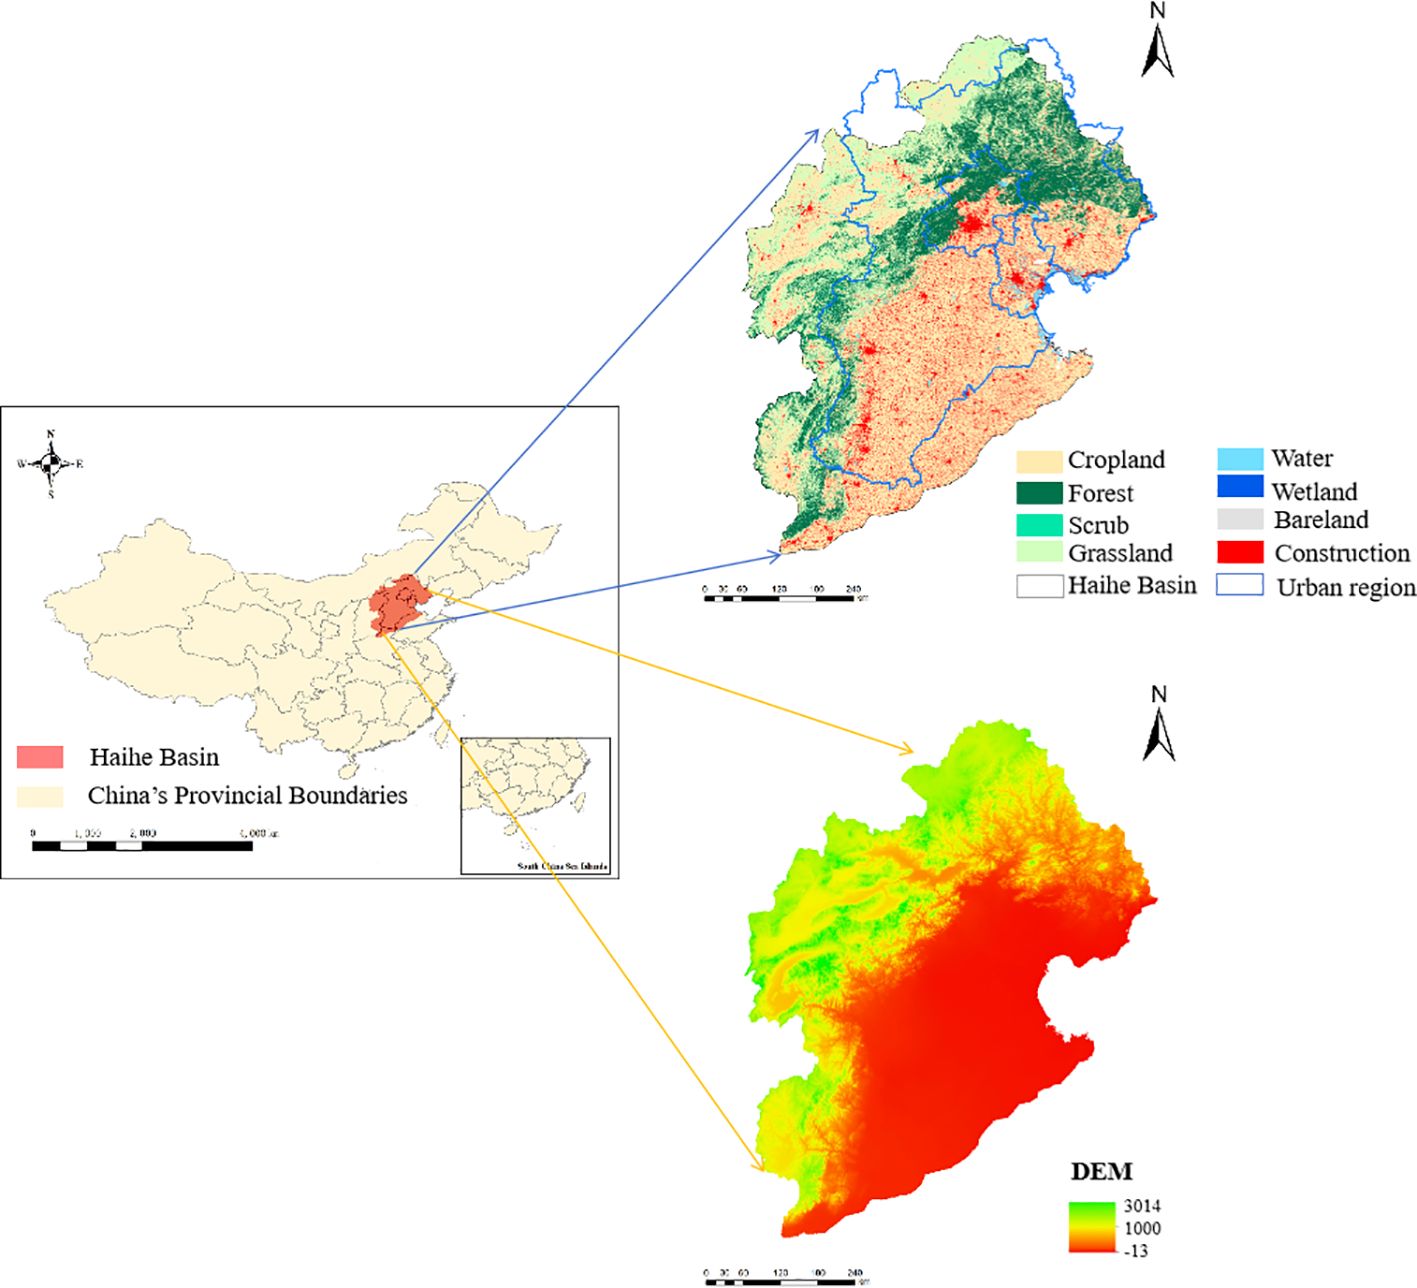
Figure 2. Location map of the study area.
2.3 Data source
This study involves a plethora of data, primarily including land use, Digital Elevation Model (DEM), Normalized Difference Vegetation Index (NDVI), Net Primary Productivity (NPP), meteorological data, soil types, administrative divisions, gridded GDP, population density data, and water consumption (Table 1). We utilized the resampling method in ArcGIS to standardize the resolution (100m ×100m) of parameters and raster results for ecosystem service assessments.
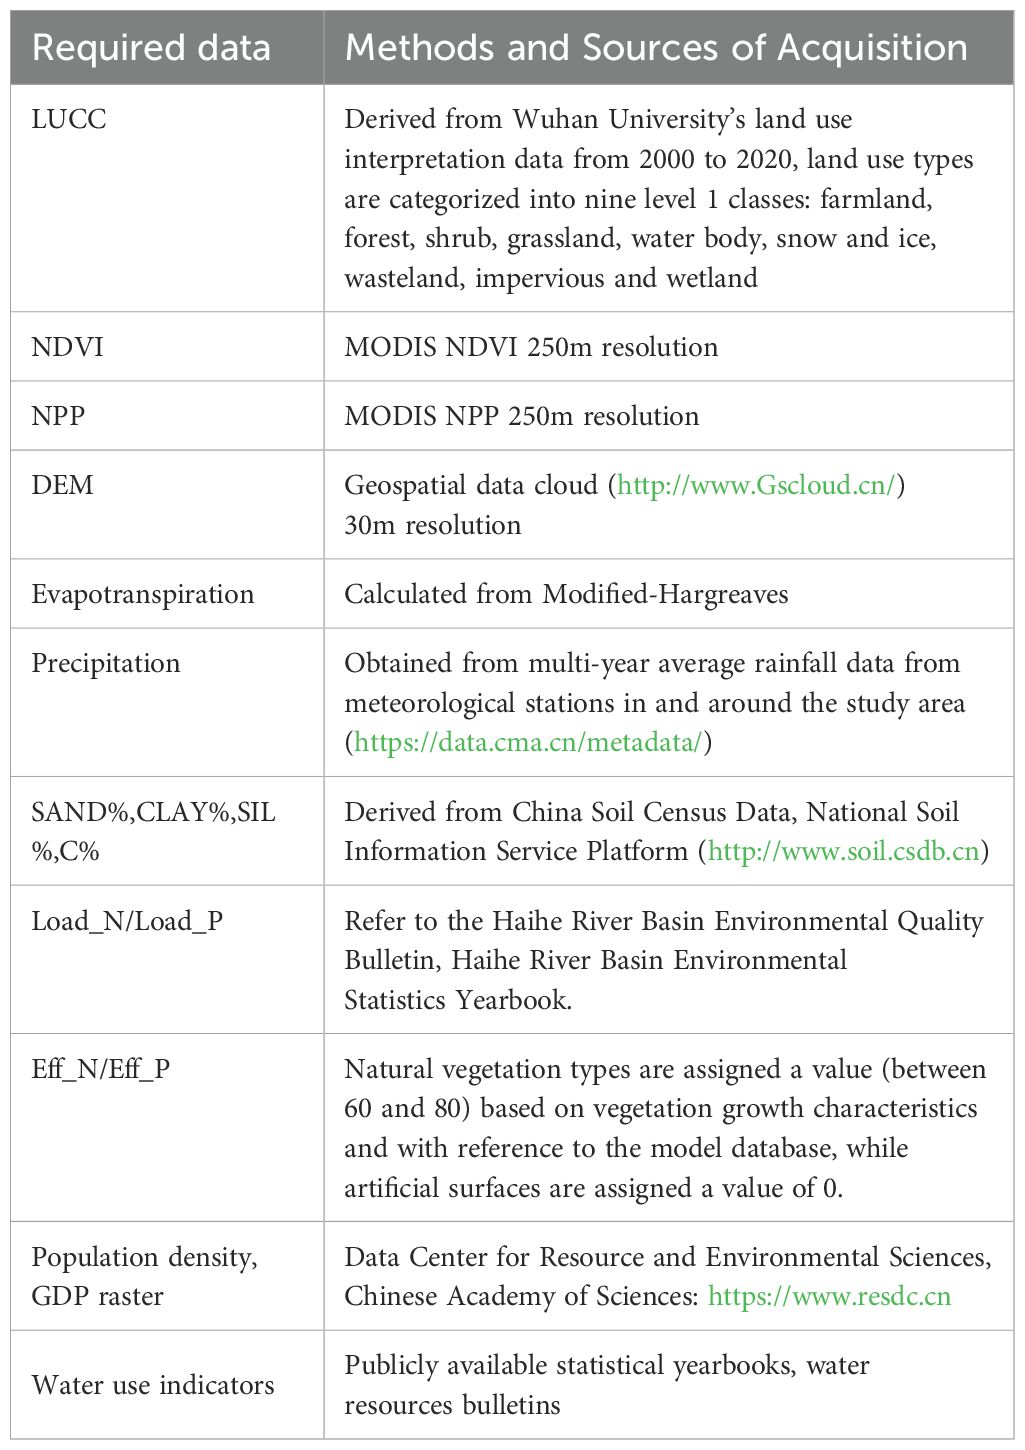
Table 1. List model data requirements and sources.
2.4 Ecosystem service supply and demand assessment methods
2.4.1 Water conservation service
The water balance method was used to calculate the water conservation supply. The water balance equation refers to the conservation of water in the ecosystem in a certain time and space, that is, the water conservation amount of the ecosystem is the difference between the precipitation input, the storm runoff and the water consumption of the ecosystem itself. The calculation formula is:
Where, is the water conservation amount, the unit is m3/a; is the area of Category I ecosystem, in m2; is the production stream rainfall of the Category I ecosystem, in mm/a; is the surface runoff of Category I ecosystem, in mm/a; is the evapotranspiration of Group I ecosystems in mm/a; i is the type of ecosystem in the accounting area, i =1,2,3,……,n;
The study equates the demand for WCS with the actual use of freshwater resources by humans, and quantifies it through four aspects: agricultural water, industrial water, domestic water and environmental water, and the specific formula is as follows:
Where, W represents the total water demand of the basin; Wagr, Wind, Wurb, and Weco represent the total amount of agricultural water use, total industrial water use, total domestic water use and total environmental water use, respectively, in tons; Iagr is the average water use index of farmland irrigation mu, the unit is m3/a, A is the km of cultivated land area, the unit is km2; Iind is the water use index of 10,000 yuan of gross national product, the unit is m3/10,000 yuan, and the GDP is the kilometer of gross national product, the unit is 10,000 yuan/km2; Iurb is the per capita comprehensive water consumption index, the unit is m3/person, POP is the km population density, the unit is people/km2; Ieco is the environmental water use index per square kilometer of the urban environment, the unit is m3/km2, and A is the area of green space and river channel in the urban environment, the unit is km2.
2.4.2 Soil conservation service
Based on the risk of severe soil erosion in the Haihe River Basin, this study evaluates soil and WCS, which are mainly related to climate, soil, topography and vegetation. The difference between soil and water conservation amount, that is, the amount of potential soil erosion (without vegetation cover and human management) and the actual amount of soil erosion (Peng et al., 2018), was used as an evaluation index for soil and water conservation service supply. The regional soil and water conservation was estimated using the modified General Equation for Soil Erosion (RUSLE) as follows:
Where, SC is the water and soil conservation supply (t/hm2), RKLS is the potential soil erosion amount (t/hm2), USLE is the actual soil erosion amount (t/hm2), R is the precipitation erosion factor (MJ·mm/[hm2·h]), K is the soil erosion factor (t·ha·h/[hm2· MJ·mm]), LS is the slope length factor (unitless), C is the vegetation cover factor (unitless), P is the soil and water conservation factor.
2.4.3 Water quality purification service
The study generates total and average runoff volumes at the sub-basin level through the InVEST water yield module and characterizes water quality purification supply services using the amount of total nitrogen or total phosphorus in the water body that the ecosystem is able to purify. The calculation methodology is described below:
Where, represents the regulated load value of grid x, represents the output coefficient of grid x, represents the hydrologic sensitivity of grid x, represents the runoff coefficient of grid x, represents the average runoff coefficient in the watershed, and represents the total water yield of grid x and all upstream grids that feed into that grid last.
The water quality purification service demand combines the ideal water quality standard – Class III water quality of the Haihe River Basin, and the difference between the total amount of water quality pollution and the pollution amount of the ideal water quality standard calculated by the InVEST model is used as the water quality purification service demand, which is calculated by the following formula:
Where, WP is the water quality purification demand in kg/ha, LOAD is the amount of water quality pollution; SDi indicates the amount of water quality pollution permitted at the basin scale in kg; it is the amount of water production in m3; and the value indicates the limit of water quality standard of class III for surface water environment in kg/m3, c=0.001.
2.5 Ecosystem service flow assessment methods
The water conservation ecosystem service flow (surface water) is utilized through the river channel (connection area) by the area through which it flows to generate benefits in the form of irrigation; the soil and water conservation ecosystem service flow is mainly through gravity, and finally enters the river channel and moves downstream with the water flow, and its benefits are reflected in the mitigation of ecosystem mitigation by forests and grasses to reduce the loss of soil organic matter to maintain soil fertility, reduce soil erosion and alleviate the threat to river sediment input, reducing the threat to downstream rivers and reservoirs by sediment accumulation this study generates a map of service flow beneficiary areas based on the directed service flow of water processes, with the following calculation equation:
Where, denotes the potential energy of directed service flow; denotes the supply of ecosystem services in the supply area; denotes the matching of supply and demand of ecosystem service flows, SD denotes the flow of ecosystem services in the supply area, and P denotes the demand of ecosystem services in the beneficiary area; and D denotes the space of matching of ecosystem service supply and demand, ∈[0,1], where the higher the value, the more serious is the imbalance between ecosystem service supply and demand.
All the computational processes are carried out in Python 3.7 environment, where the flow direction of the directed stream is generated using D8 unidirectional flow algorithm, and NIDP algorithm, etc. Among them, the D8 unidirectional flow algorithm expresses the flow direction of each cell numerically, and the numbers vary from 1 to 255, where 1: East; 2: Southeast; 4 South; 8: Southwest; 16: West; 32: Northwest; 64: North; 128: Northeast. And in this process, it repeatedly traverses the region with NIDP value of ‘−1’, when the result of the difference between supply and demand is positive, it means that the ecosystem services in that region are still in excess, so along the direction of flow, the flow of ecosystem services will be passed on to the next region and the NIDP value will be subtracted by 1 (Figure 3).
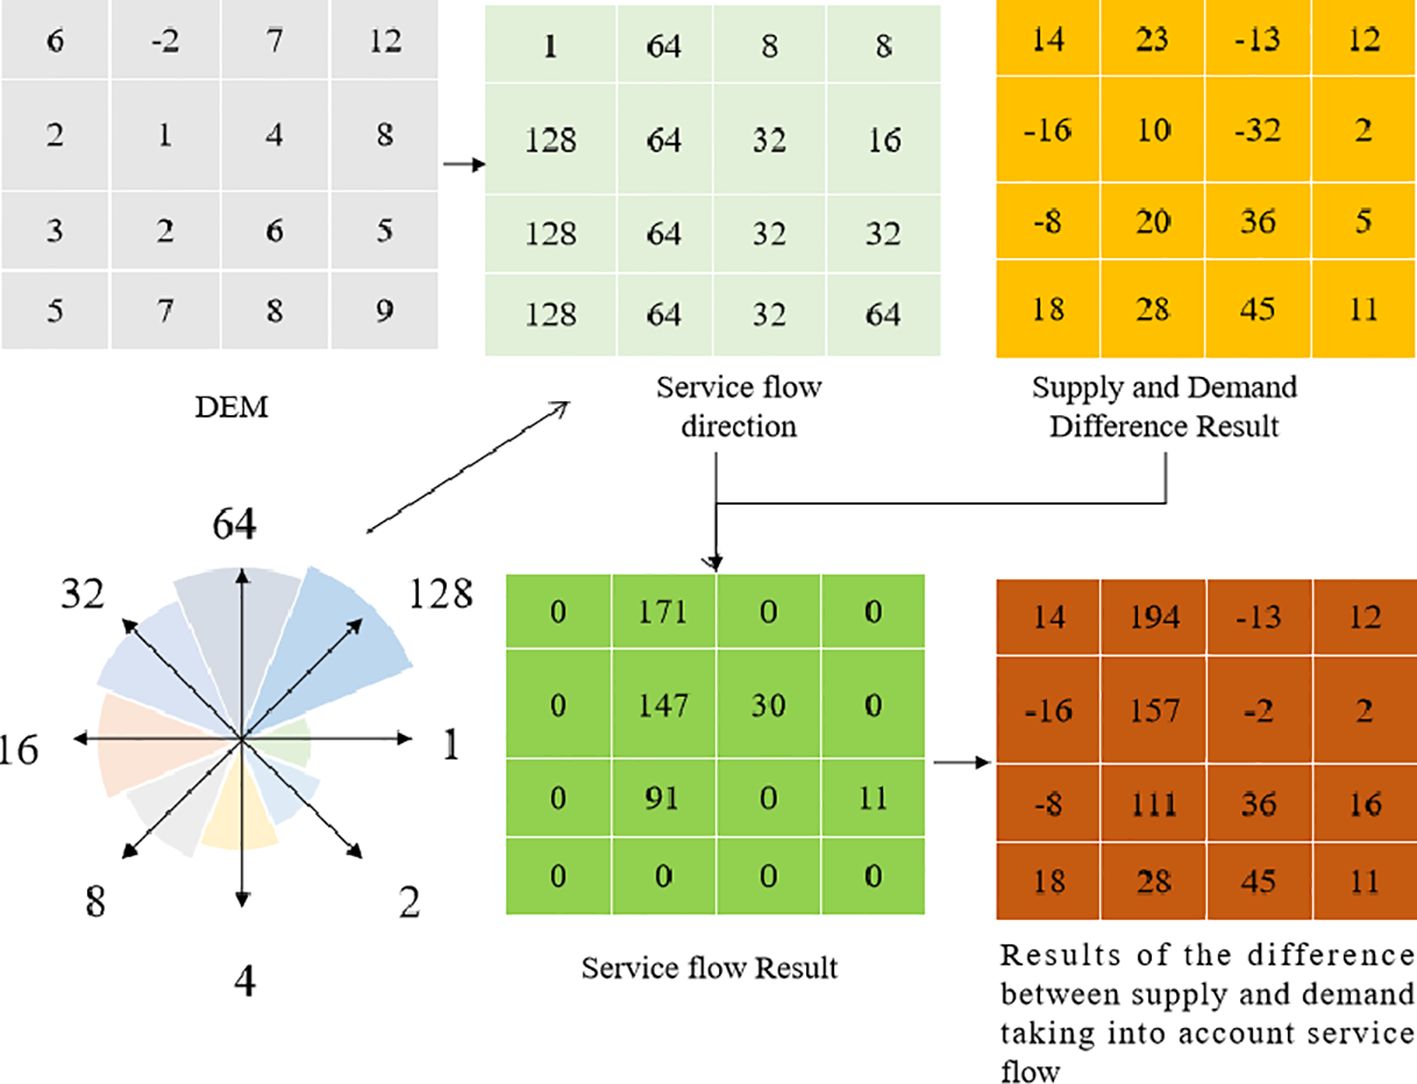
Figure 3. Assessment method of water ecosystem service flow.
2.6 Supply and demand matching degree assessment method
Based on the results of supply and demand and service flow assessment of key ES in the Haihe River Basin, for water conservation, soil conservation, and water quality purification services, all of which are directed services, combined with previous research methods and experience, the SDM of ecosystem services is calculated based on the sum of supply and service flow, and the difference between demand; the specific formula is:
Where: Ywcs is the SDM of WCS; Swcs is the result of WCS supply; Fwcs is the result of WCS flow; Dwcs is result of WCS demand; Yscs is the SDM of SCS; Sscs is the result of SCS supply; Fscs is the result of SCS flow; Dscs is the result of SCS demand; Ywps is the SDM of WPS; Swps is the result of WPS supply; Fwps is the result of WPS flow; Dwps is result of WPS demand.
2.7 Spatially linked model of different ecosystem services
Using binary Moran’s I, we describe the correlation between the spatial clustering (positive spatial correlation) and spatial dispersion (negative spatial correlation) between the two of WCS, SCS and WPS. The specific equations are as follows:
3 Results
3.1 Supply and demand assessment of water ecosystem services
3.1.1 Water conservation service
Based on the assessment of WCS supply and demand, combined with the industrial, agricultural, and ecological water use demands and water source conservation supply status in the Hai River Basin, and to allow for a clear comparison of the temporal and spatial evolution of WCS supply and demand, both supply and demand are classified into five levels: low (0~5), lower (5~10), medium (10~50), high (50~100), and higher (>100). Figure 4a presents the WCS supply distribution, which show that, from 2000 to 2020, the highest WCS is in the Zhangwei River Basin in the southwest and the Luan River Basin along the coast, accounting for more than 44% of the total area of the basin; over the past two decades, the overall amount of WCS has increased, but it has declined in localized areas of the Yongding River Basin and the North China plain in the southeast, and the area with low and lower levels of WCS has risen from 5% to 8%, with a serious expansion trend. Figure 4b shows WCS demand distribution, which show that, Yanshan and Taihangshan regions have a low level of WCS demand, accounting for 48% of the basin area in 2020; Beijing, Tianjin, and the core cities have a high demand, especially Beijing, accounting for 0.11% of the basin area, due to the fact that the industrial and agricultural water use is increasing, which leads to the increasing demand for water resources in the cities. Over the past two decades, the North China Plain region is more obvious changes, the type of demand from medium demand gradually converted to lower demand, accounting for about 50% of the basin area.

Figure 4. Assessment results of WCS supply (a) and demand (b) in 2000, 2010 and 2020.
3.1.2 Soil conservation service
Based on the assessment of SCS supply and demand, combined with the current soil erosion status and needs in various watersheds and mountainous areas within the Hai River Basin, as well as the level of soil conservation services supplied by the ecosystem, this study classifies both SCS supply and demand into five levels: low (0~5), lower (5~10), medium (10~50), high (50~100), and higher (>100). This classification allows for a clear comparison of the temporal and spatial evolution of SCS supply and demand within the basin. Figure 5a presents the results of SCS supply, which show that, the overall area has the highest amount of SCS (Soil Conservation Service) above 100 t/hm², accounting for 13~27% from 2000 to 2020, mainly located in the Taihang Mountains and Yan Mountains region; The amount of SCS in the North China plain and north-western Damshang Plateau areas is lower, accounting for 60% of the Haihe River Basin in 2020. Over the past two decades, the overall amount of SCS has increased, but there has been a local decrease in the Yanshan Mountain area and the Southeast North China Plain. Figure 5b presents the results of SCS demand, which show that, from 2000 to 2020, 5~50 t/hm2 in the Yanshan and Taihangshan regions, which are the areas with the highest demand, accounting for 20%, the North China Plain has consistently been at a low level of SCS demand, accounting for more than 79%.
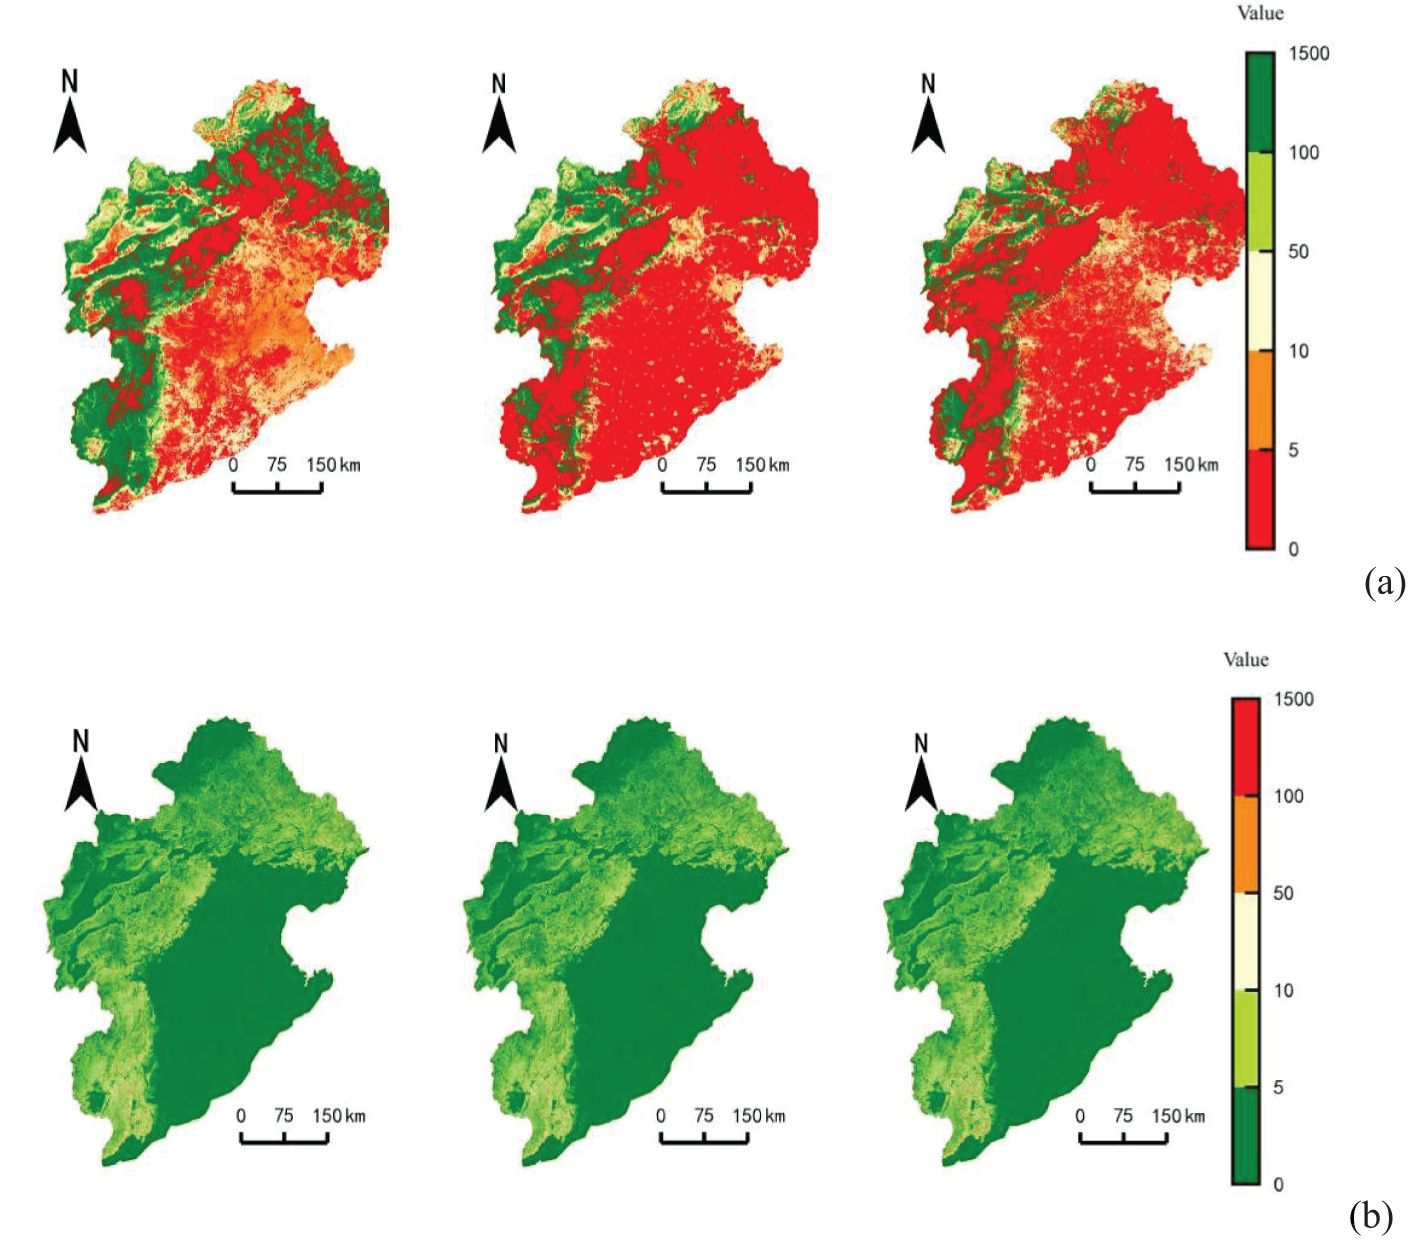
Figure 5. Assessment results of SCS supply (a) and demand (b) in 2000, 2010 and 2020.
3.1.3 Water quality purification service
Based on the assessment of WPS supply and demand, combined with the water quality standards required for each water function zone in the Hai River Basin, and the level of water quality purification services supplied by the basin’s ecosystem, this study classifies both WPS supply and demand into five levels: low (0~5), lower (5~50), medium (50~70), high (70~100), and higher (>100). This classification allows for a clear comparison of the temporal and spatial evolution of WPS supply and demand. Figure 6a presents the results of WPS supply, which show that, from 2000 to 2020, the supply level is low in the mountainous areas of Taihang Mountain and Yanshan Mountain, and high in the North China Plain, with the proportion of about 50% in each case. Figure 6b presents the results of WPS demand, which show that more than 50% of the Haihe River Basin is in a state of higher demand, mainly located in the Hebei Plain area in the south-east of the Haihe River Basin and in the Yongdig River Basin area in the west of the Taihang Mountains; about 30% of the area is in a state of medium and high demand, mainly located in the Taihang Mountains and the Yanshan Mountain area.
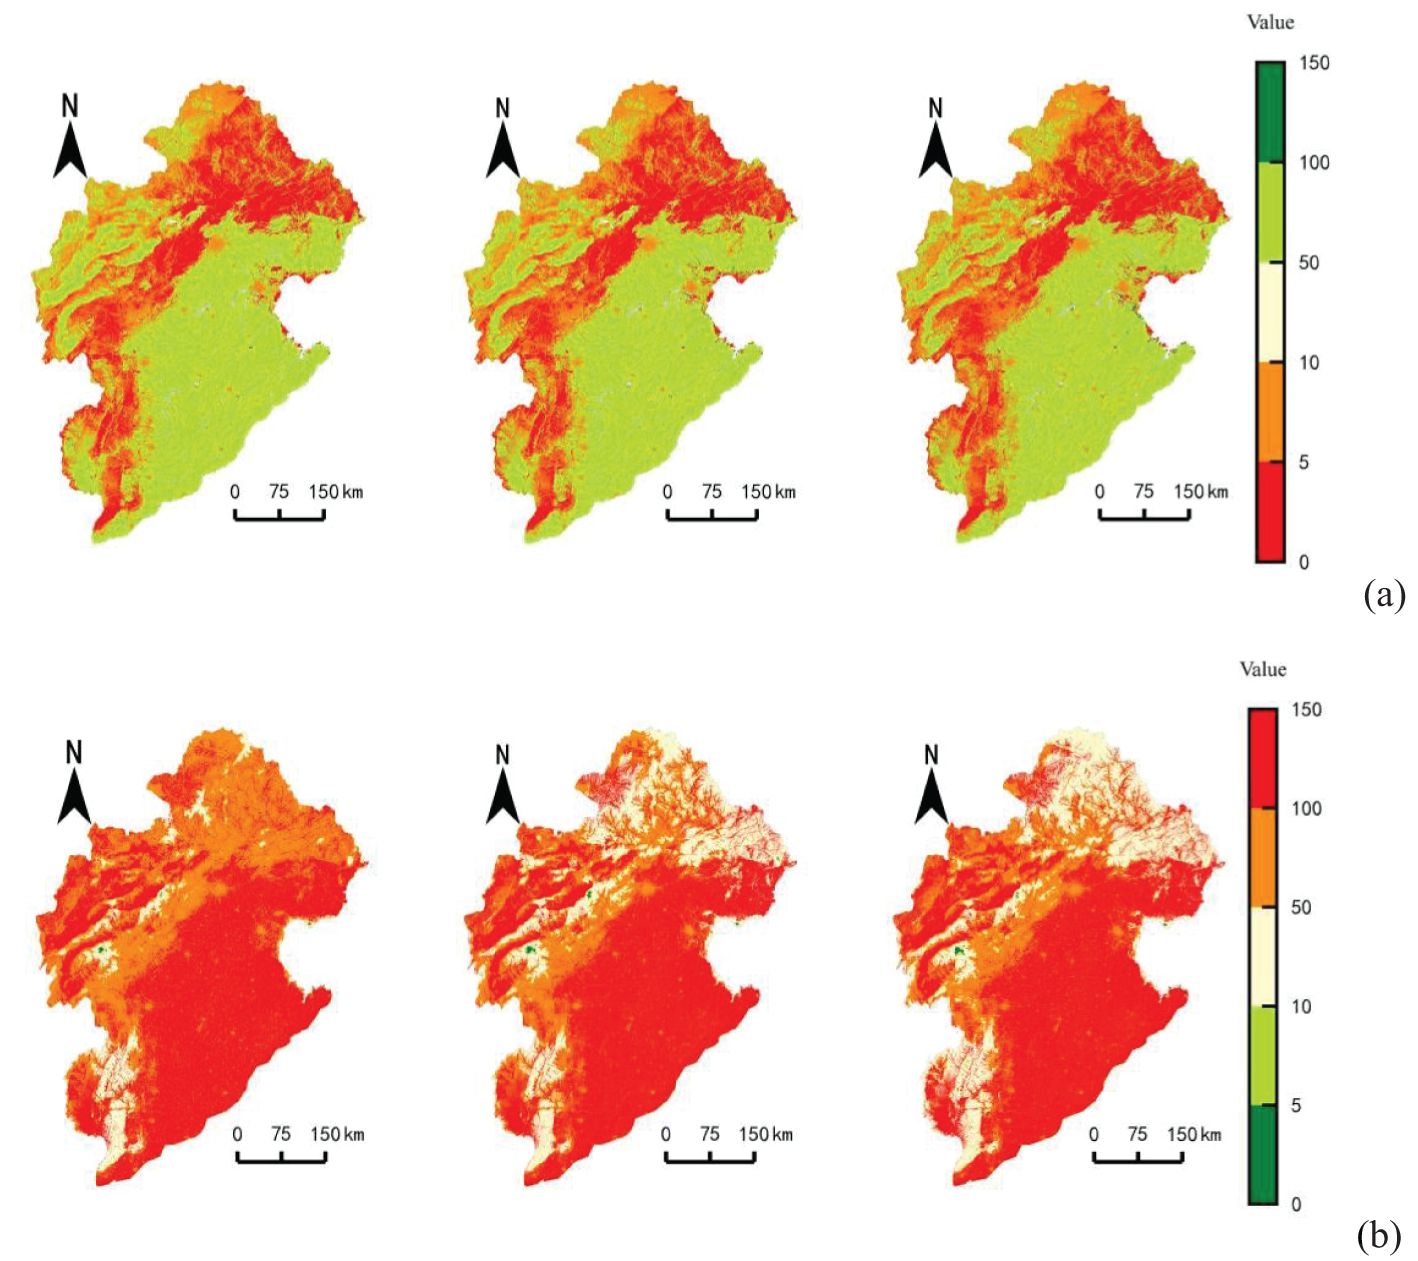
Figure 6. Assessment results of WPS supply (a) and demand (b) in 2000, 2010 and 2020.
3.2 Assessment results of service flows
For the three typical water ecosystem services in the Haihe River Basin, in the process of service flow dynamics, the beneficiary area can enjoy the service benefits transmitted from the supply area. The spatial flow results of water conservation, soil conservation and WPS flows in the Haihe River Basin were simulated by the service flow model.
According to the flow size of the Haihe River Basin, the flow of water conservation service (WCSF) is divided into five grades: low (0~500), low (500~1000), medium (1000~2000), high (2000~3000) and high (3000~8000). Figure 7 shows that, in 2020, the area of WCSF at a low level is the largest at 91,951.6 km2, accounting for 44.51% of the total area of the Haihe River basin; the lower level accounts for about 18%, and the two are mainly located in the northern region of the Taihangshan Mountains and the southeastern region of the Hebei Plain; and the area at a high level or above is located in the southern Zhangwei River basin of the Taihangshan Mountains, accounting for about 15 per cent. Over the past two decades, the service flow in the Zhangwei River basin in the southern Taihang Mountains has shown a decreasing trend, with the high-level service flow area increasing by 6942.69 km2, accounting for 2.92% of the basin area, and the low-level service flow area increasing by 12895.75 km2, accounting for 4.44% of the basin area.

Figure 7. Assessment results of the WCSF in 2000, 2010 and 2020.
The soil conservation service flow (SCSF) is divided into five classes: low (0~10), lower (10~100), medium (100~500), high (500~1000) and higher (>1000). Figure 8 shows that, in 2020, the area with low level of SCSF is the largest of 183958.4km2, accounting for 59.15% of the total area; the lower level accounts for 9.4%, and the two are located in the Taihangshan and Yanshan mountainous areas; the area with medium level is mainly located in the farmland area of the North China Plain; in the past two decades, the service flow in the Taihangshan Mountain area in the southern part and the Plain in the southeastern part has increased by 12895.75km2, accounting for 4.44%. Plain in the southeast showed a decreasing trend, in which the high level service flow area decreased by 15.59%; the low level service flow area increased by 28.63%.
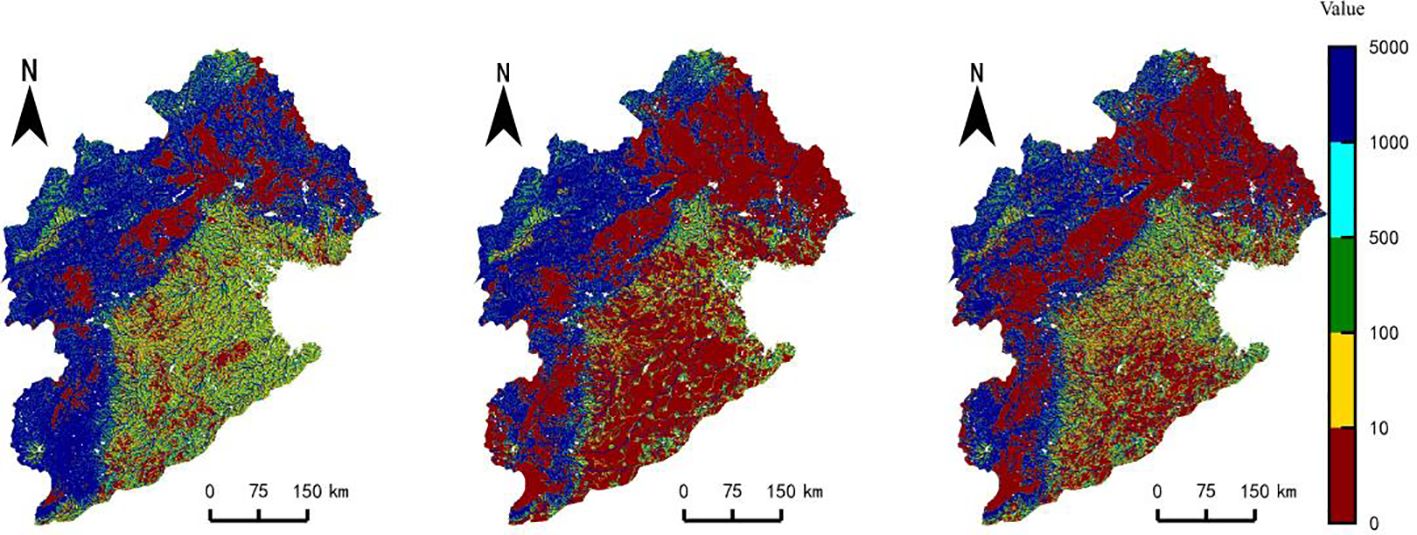
Figure 8. Assessment results of SCSF in 2000, 2010 and 2020.
The water purification service flow (WPSF) is divided into five classes: low (0~1), lower (1~5), medium (5~10), high (10~100) and higher (>100). Figure 9 shows that, in 2020, the WPSF is less distributed in the whole region, and 2% of the area generates higher water quality purification service flow, which is mainly located in the Wutai Mountain area in Xinzhou, Shanxi Province, and the Xiaowutai area in Hebei Province, which are both above 2800m in elevation.
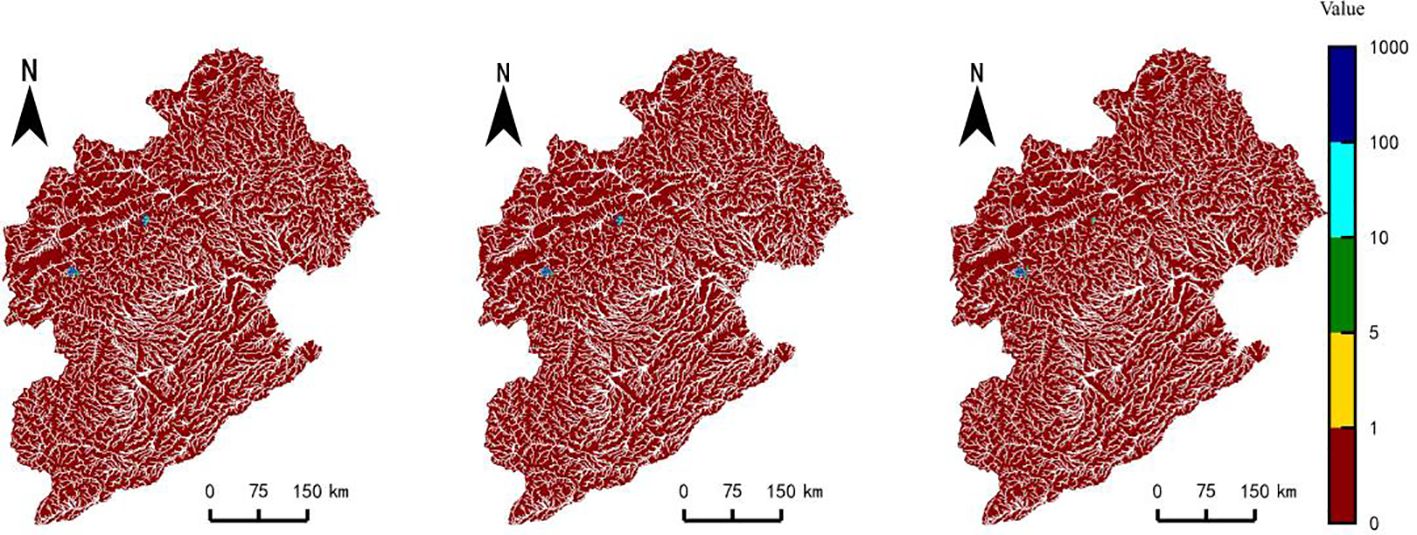
Figure 9. Assessment results of WPSF in 2000, 2010 and 2020.
3.3 Supply–demand matching based on service flow
3.3.1 water conservation service
Based on the SDM results of WCS, it is classified into five levels: severe deficit (−1200~−500), slight deficit (−500~−10), primary balance(−10~10), slight surplus (10~1500) and full surplus (1500~50,000). Figure 10 indicates that, in 2020, the Haihe River Basin’s water conservation service experienced a slight surplus in the largest area, accounting for 49.45% of the total area. Areas with a full surplus accounted for 20.11%. The regions with slight and full surpluses are primarily located in the western Taihang Mountains and the northern Yanshan mountainous areas. Following that, areas with a slight deficit represented 26.35%, mainly located in the southeastern North China Plain and the Zhangjiakou region within the Yongding River basin. This demonstrates that the distribution of the SDM of WCS in the Haihe River Basin is polarized, with a sufficient surplus in the mountainous regions and deficits in the urban and peripheral areas, as well as in some grassland regions.
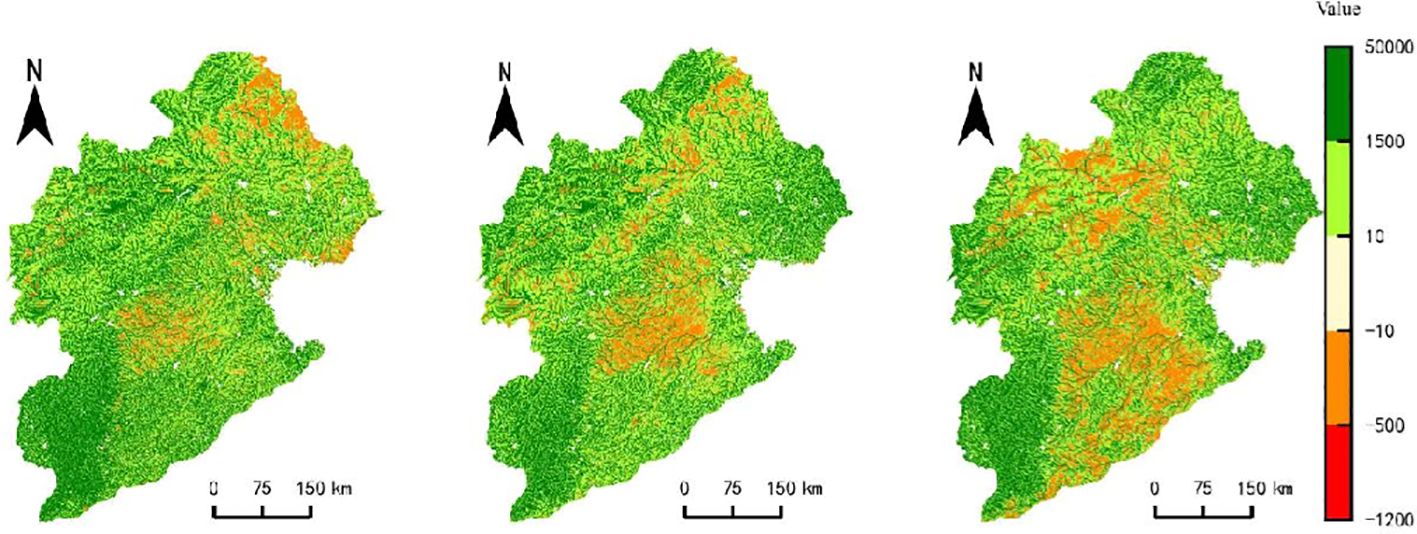
Figure 10. The SDM of WCS based on service flow.
From 2000 to 2020, the number of areas in the Haihe River Basin with slight deficits has increased from 16.66% to 26.35%. This suggests that the demand for water in the North China Plain and the Yongding River Basin has been growing over the past 20 years. In the grassland areas of Zhangjiakou, the population’s demand for water far exceeds the natural ecosystem’s supply for water source containment. Additionally, the areas of slight surplus and full surplus in the Haihe River Basin have also been diminishing, from 54.37% and 26.26% in 2000 to 49.45% and 20.11%, respectively, in 2020. This indicates that the trend of increasing water consumption is outpacing the growth trend of natural ecosystems’ water conservation function, resulting in an increase in the deficit and a decrease in the surplus in the matching of supply and demand for WCS in the Haihe River Basin (Table 2).
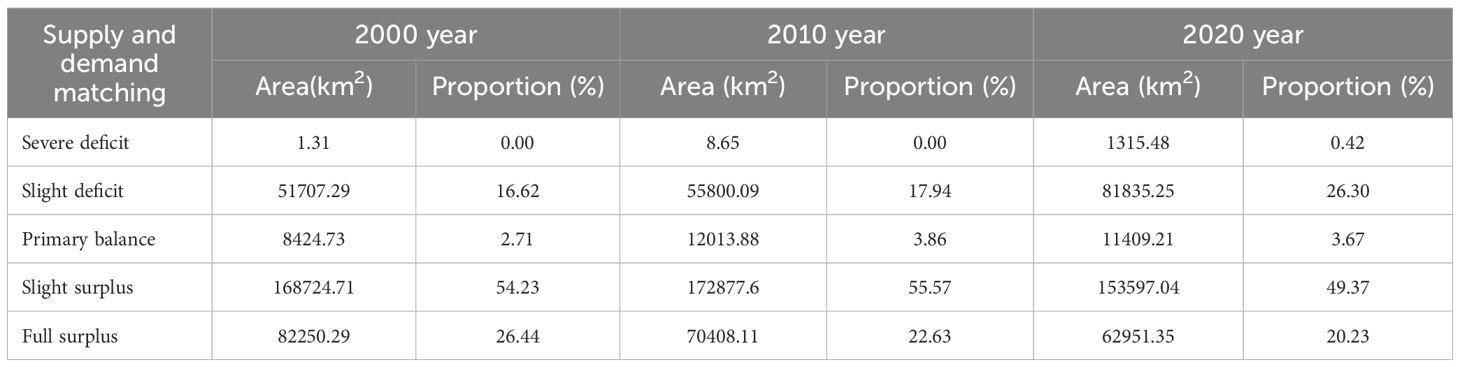
Table 2. Statistical results on the SDM of WCS.
3.3.2 Soil conservation service
Based on the SDM results of SCS, it is classified into five levels: severe deficit (−6900~−2000), slight deficit (−2000~−10), primary balance (−10~10), slight surplus (10~2000) and full surplus(2000~50,000). Figure 11 shows that, in 2020, primary balance grade covers the largest area, accounting for 48.9%, mainly located in the junction of mountainous areas and plains, showing a belt-shaped distribution pattern; followed by Slight Surplus and Sufficient Surplus grades, accounting for 27.6% and 15.93%, respectively; mainly located in the mountainous areas of the Taihang Mountains and Yanshan Mountains; and then the slight deficit region, accounting for 7.57%, mainly located in the Tangshan area of the Luan River Basin; there is no serious deficit region.
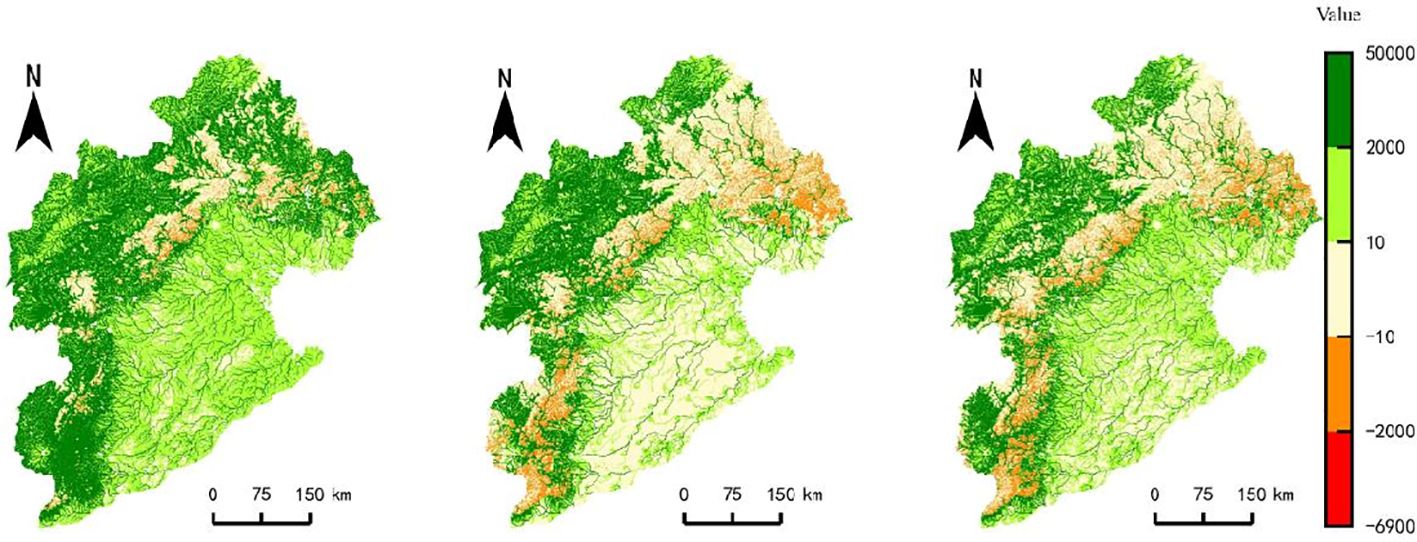
Figure 11. The SDM of SCS based on service flow.
From 2000 to 2020, the slight deficit region of the Haihe River Basin has been increasing, from 2.72% in 2000 to 7.57%, which indicates that soil erosion in the Luan River Basin of the Haihe River Basin in the past 20 years has been more serious, resulting in the intensification of the deficit phenomenon; at the same time, the proportion of the slight surplus At the same time, the proportion of slight surplus and full surplus areas in the Haihe River Basin decreased by 16.60% and 13.98% respectively, which indicates that the increasing trend of soil erosion area in the Haihe River Basin far exceeds the trend of the growth of soil and water conservation function, resulting in the matching of supply and demand of soil and WCS in the Haihe River Basin with an increase in the area of deficit and a decrease in the area of surplus (Table 3).
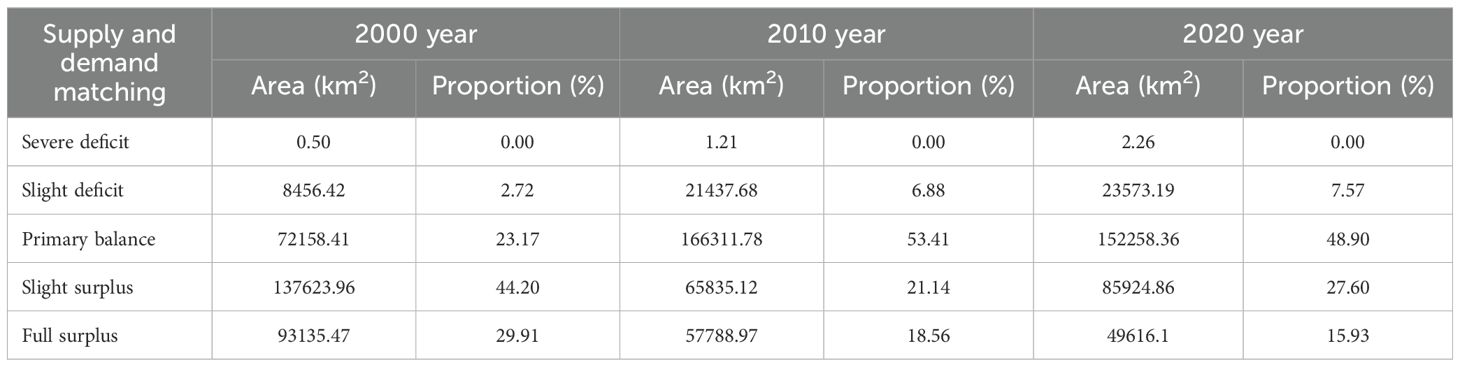
Table 3. Statistical results on the SDM of SCS.
3.3.3 Water quality purification service
Based on SDM results of WPS, it is classified into five levels according to the size, namely, severe deficit (<−50), slight deficit (−50~−10), Primary balance (−10~10), slight surplus (10~50), and sufficient surplus (50~70). Figure 12 shows that in 2020, 52% of the area of the Haihe River Basin is at the severe deficit level, which is mainly faceted in the southeastern plains and Zhangjiakou grassland area; 46% is at the slight deficit level, which is distributed in the Taihang Mountain and Yanshan Mountain forest area. From 2000 to 2020, 99% of the area of the Haihe River Basin SDM of WPS is in the deficit (Table 4).
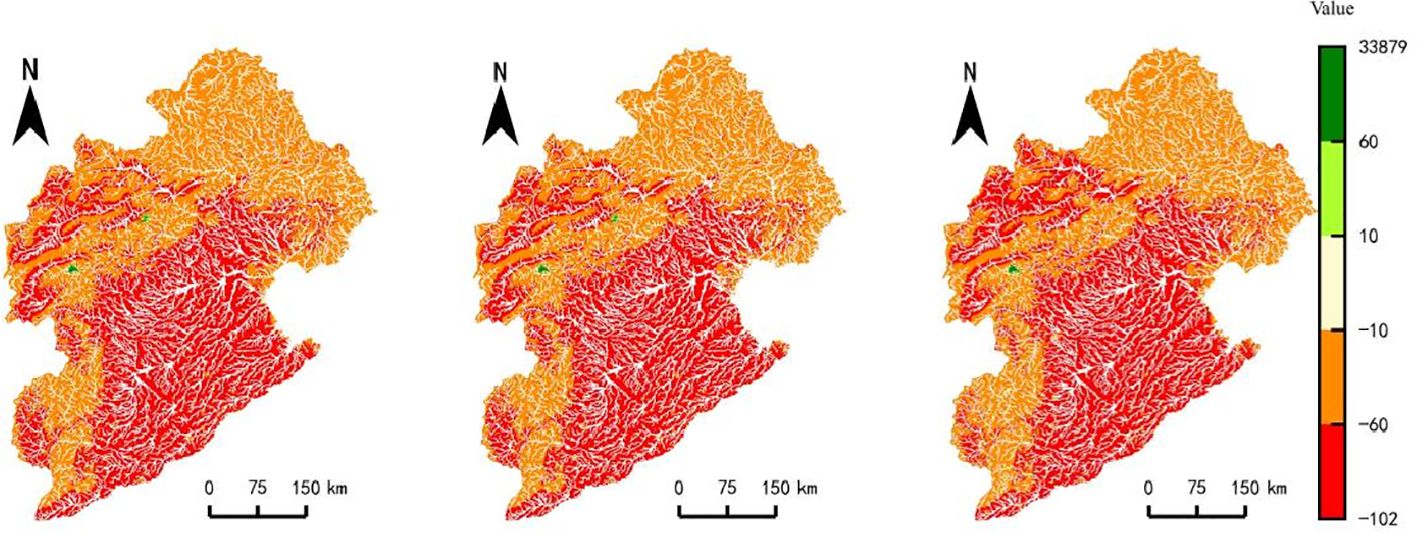
Figure 12. The SDM of WPS based on service flow.
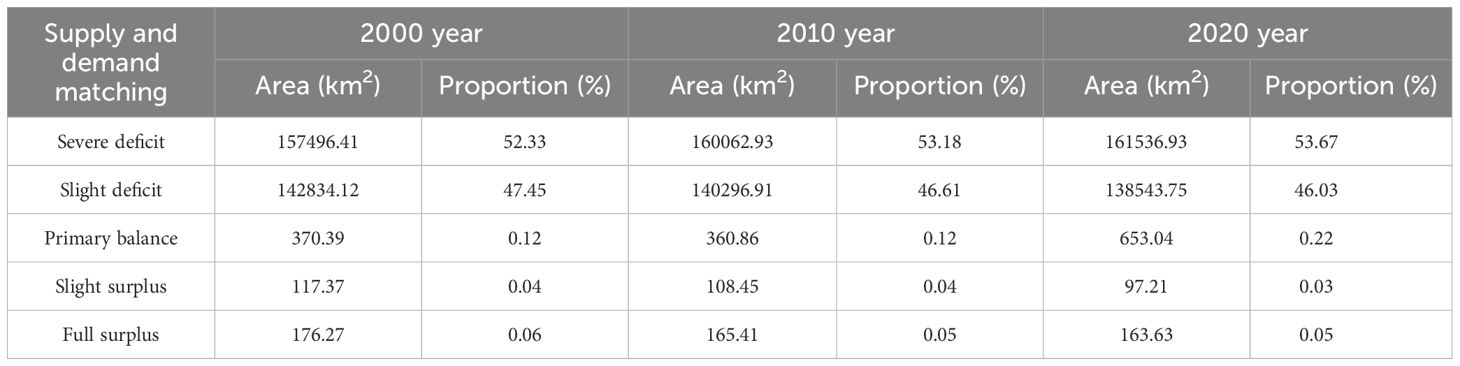
Table 4. Statistical results on the SDM of WPS.
3.4 Spatial correlation analysis between different ecosystem services
3.4.1 Global linear correlation analysis
Figure 13 illustrates the correlations among three typical water-related ecosystem service combinations in the Haihe River Basin. The results demonstrate that WCS and SCS exhibited strong correlations across all years (R ≥ 0.90). The linear function coefficients revealed the highest correlation in 2000, followed by a decline in 2010 and subsequent recovery in 2020, suggesting that ecological engineering measures (e.g., Grain-for-Green Program) implemented post-2010 enhanced synergies between these services. The contiguous high-value synergy zones in the Yanshan-Taihang Mountain region likely resulted from improved vegetation coverage. The weakened correlation between WCS and WPS from strong association in 2000 to non-significant levels in 2010 and 2020 may be attributed to increased agricultural non-point source pollution and degradation of riparian ecological functions. No significant correlations were observed between soil conservation and water purification across all study years, primarily due to their differential regulatory mechanisms – sediment interception via surface runoff versus biogeochemical processes in aquatic systems.
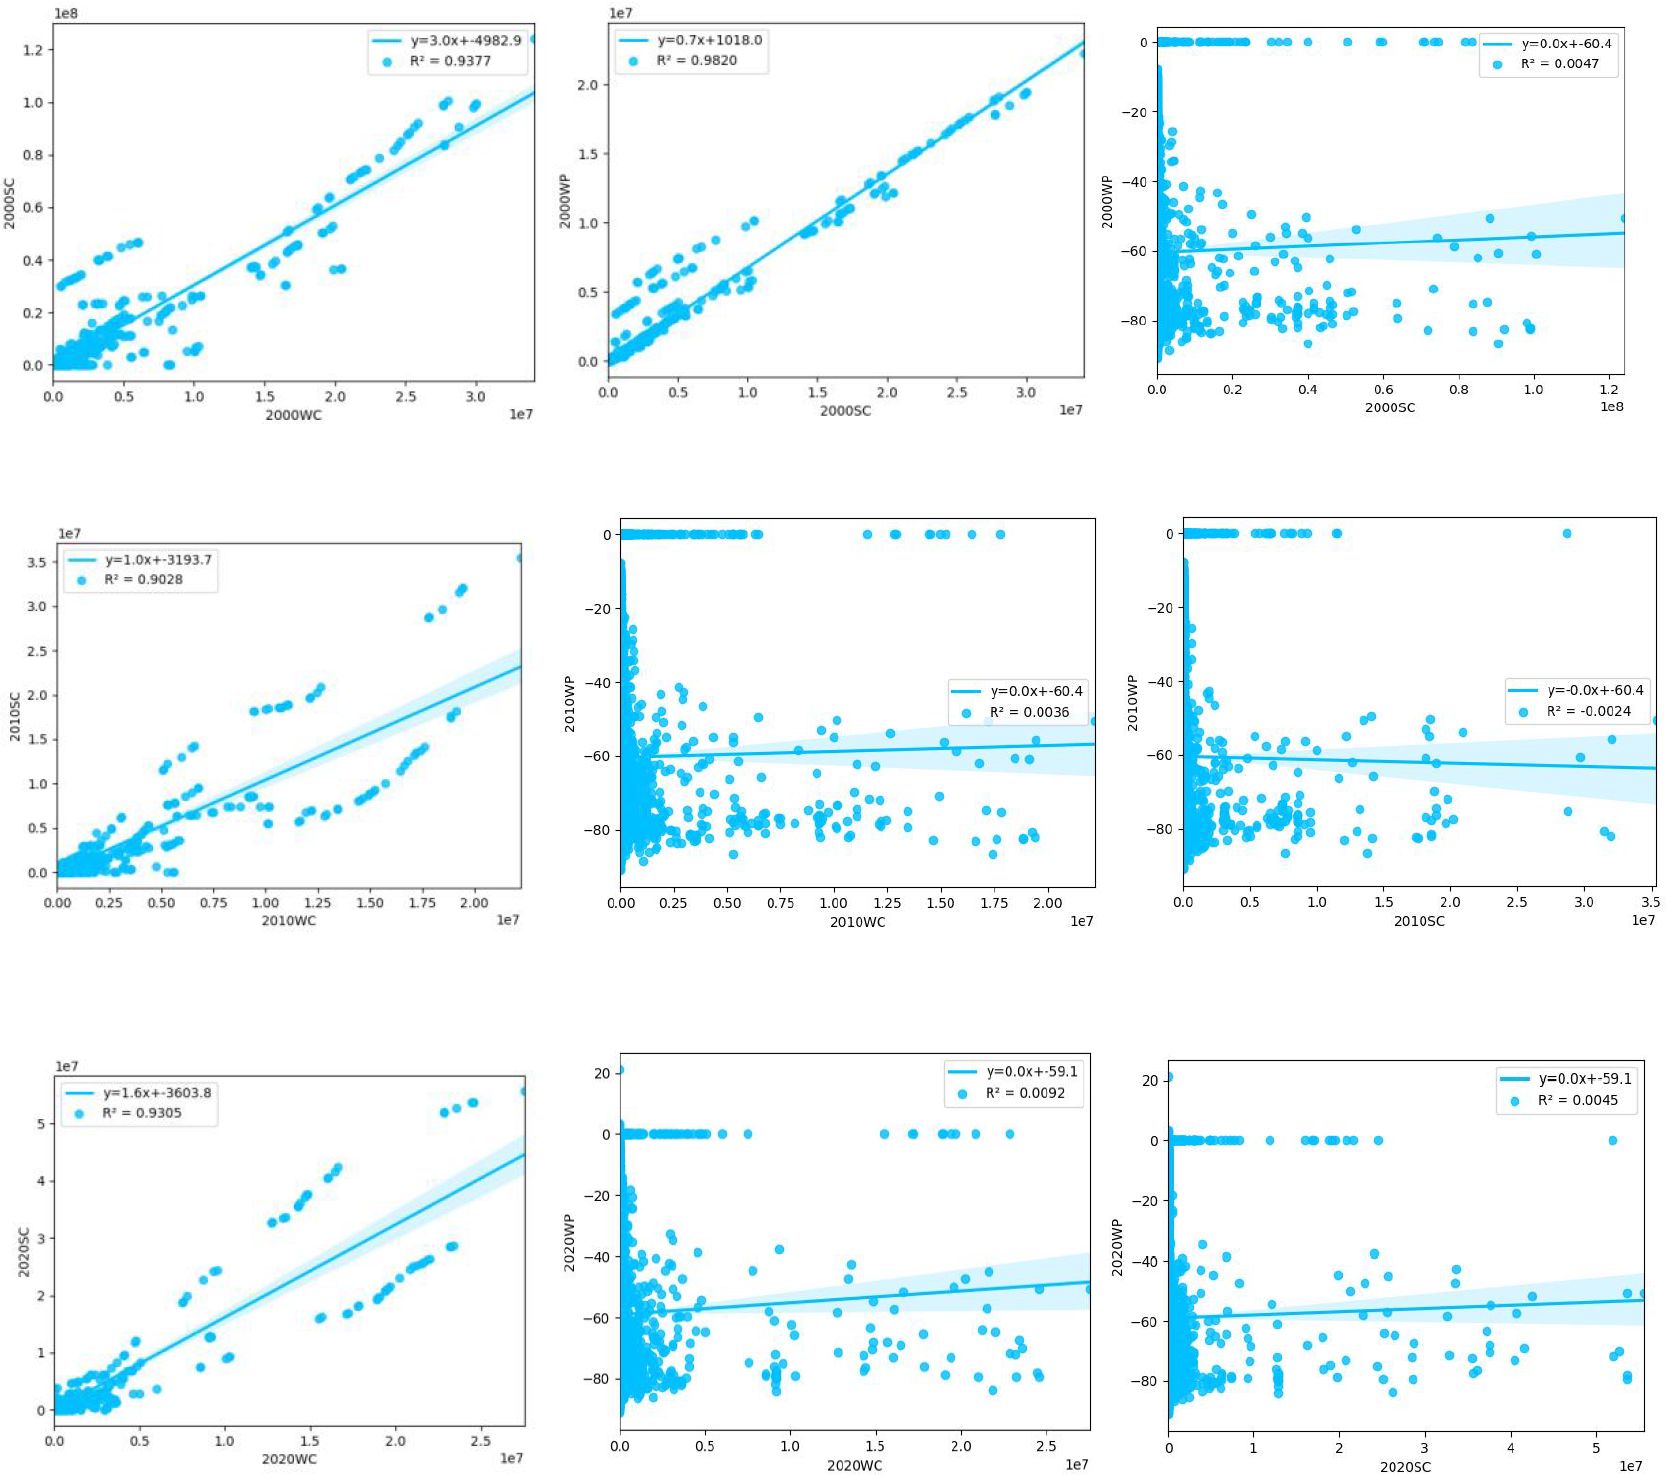
Figure 13. The correlation map of WCS, SCS and WPS in 2000, 2010 and 2020.
3.4.2 Global spatial correlation analysis
Table 5 present the trade-off relationships among the three ecosystem service combinations. Results show that low–low synergistic combinations consistently represented the most prevalent type, indicating frequent co-occurrence of suboptimal service levels across the study area. However, temporal analysis revealed increasing proportions of low–high and high–low trade-off categories, particularly between WCS–WPS and SCS–WPS. This trend highlights disconnections in service synergies, suggesting that current ecological conservation measures may have preferentially enhanced WCS or SCS while neglecting WPS, or vice versa.
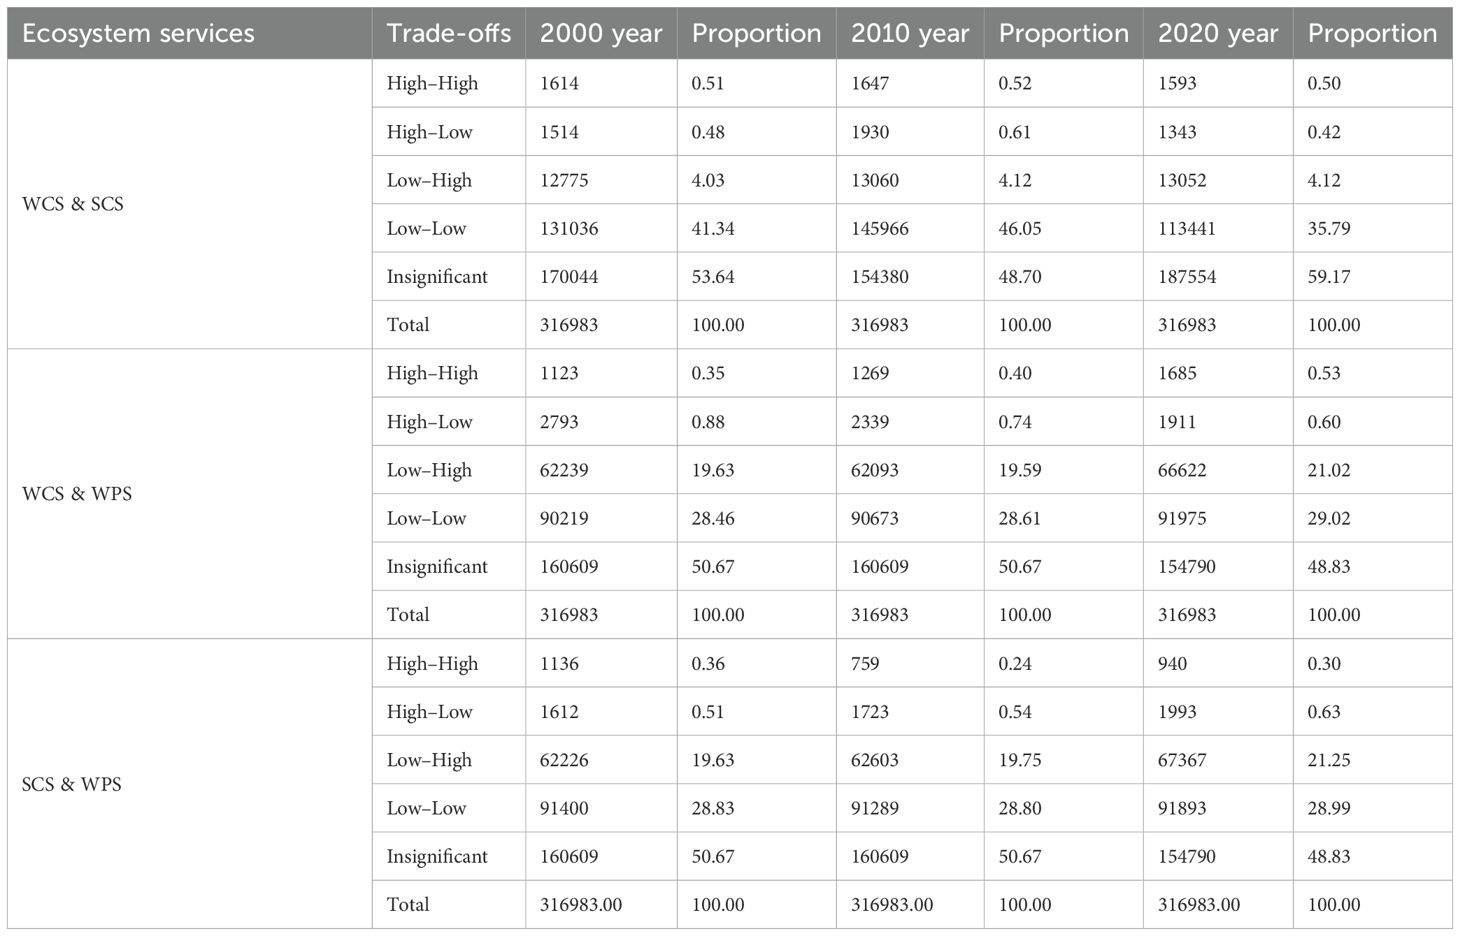
Table 5. Spatial distribution of trade-offs among WCS & SCA, WCS & WPS and SCS & WPS.
For the WCS–SCS, low–low synergy dominated across all years (41.34% in 2000, 46.05% in 2010, and 35.79% in 2020), reflecting generally strong synergies. The stable proportions of low–high (4.28–4.67%) and high-low (0.41–0.84%) trade-offs suggest limited interannual variability in synergy deficiencies. Notably, from 2000 to 2020, non-significant associations increased substantially from 53.64% to 59.17%, indicating gradual weakening of synergistic effects over time. Regarding WCS–WPS interactions, low–low synergies (28.46–29.02%) and high–high synergies (0.41–0.53%) predominated, though low–high trade-offs showed progressive increases from 19.63% to 21.02%. The proportion of non-significant associations decreased from 50.67% to 48.83%, implicitly reflecting enhanced trade-off recognition between these services. The SCS-WPS relationship exhibited similar patterns to the WCS-WPS, with stable low–low synergies (28.80–28.99%) and increasing low–high trade-offs (19.63–21.25%). The declining proportion of non-significant associations is from 50.67% to 48.83%, further confirms gradual intensification of trade-off effects between SCS and WPS.
3.4.3 Local spatial correlation analysis
Figure 14 present the trade-off relationships among the three ecosystem service combinations at grid scale. Results show that:
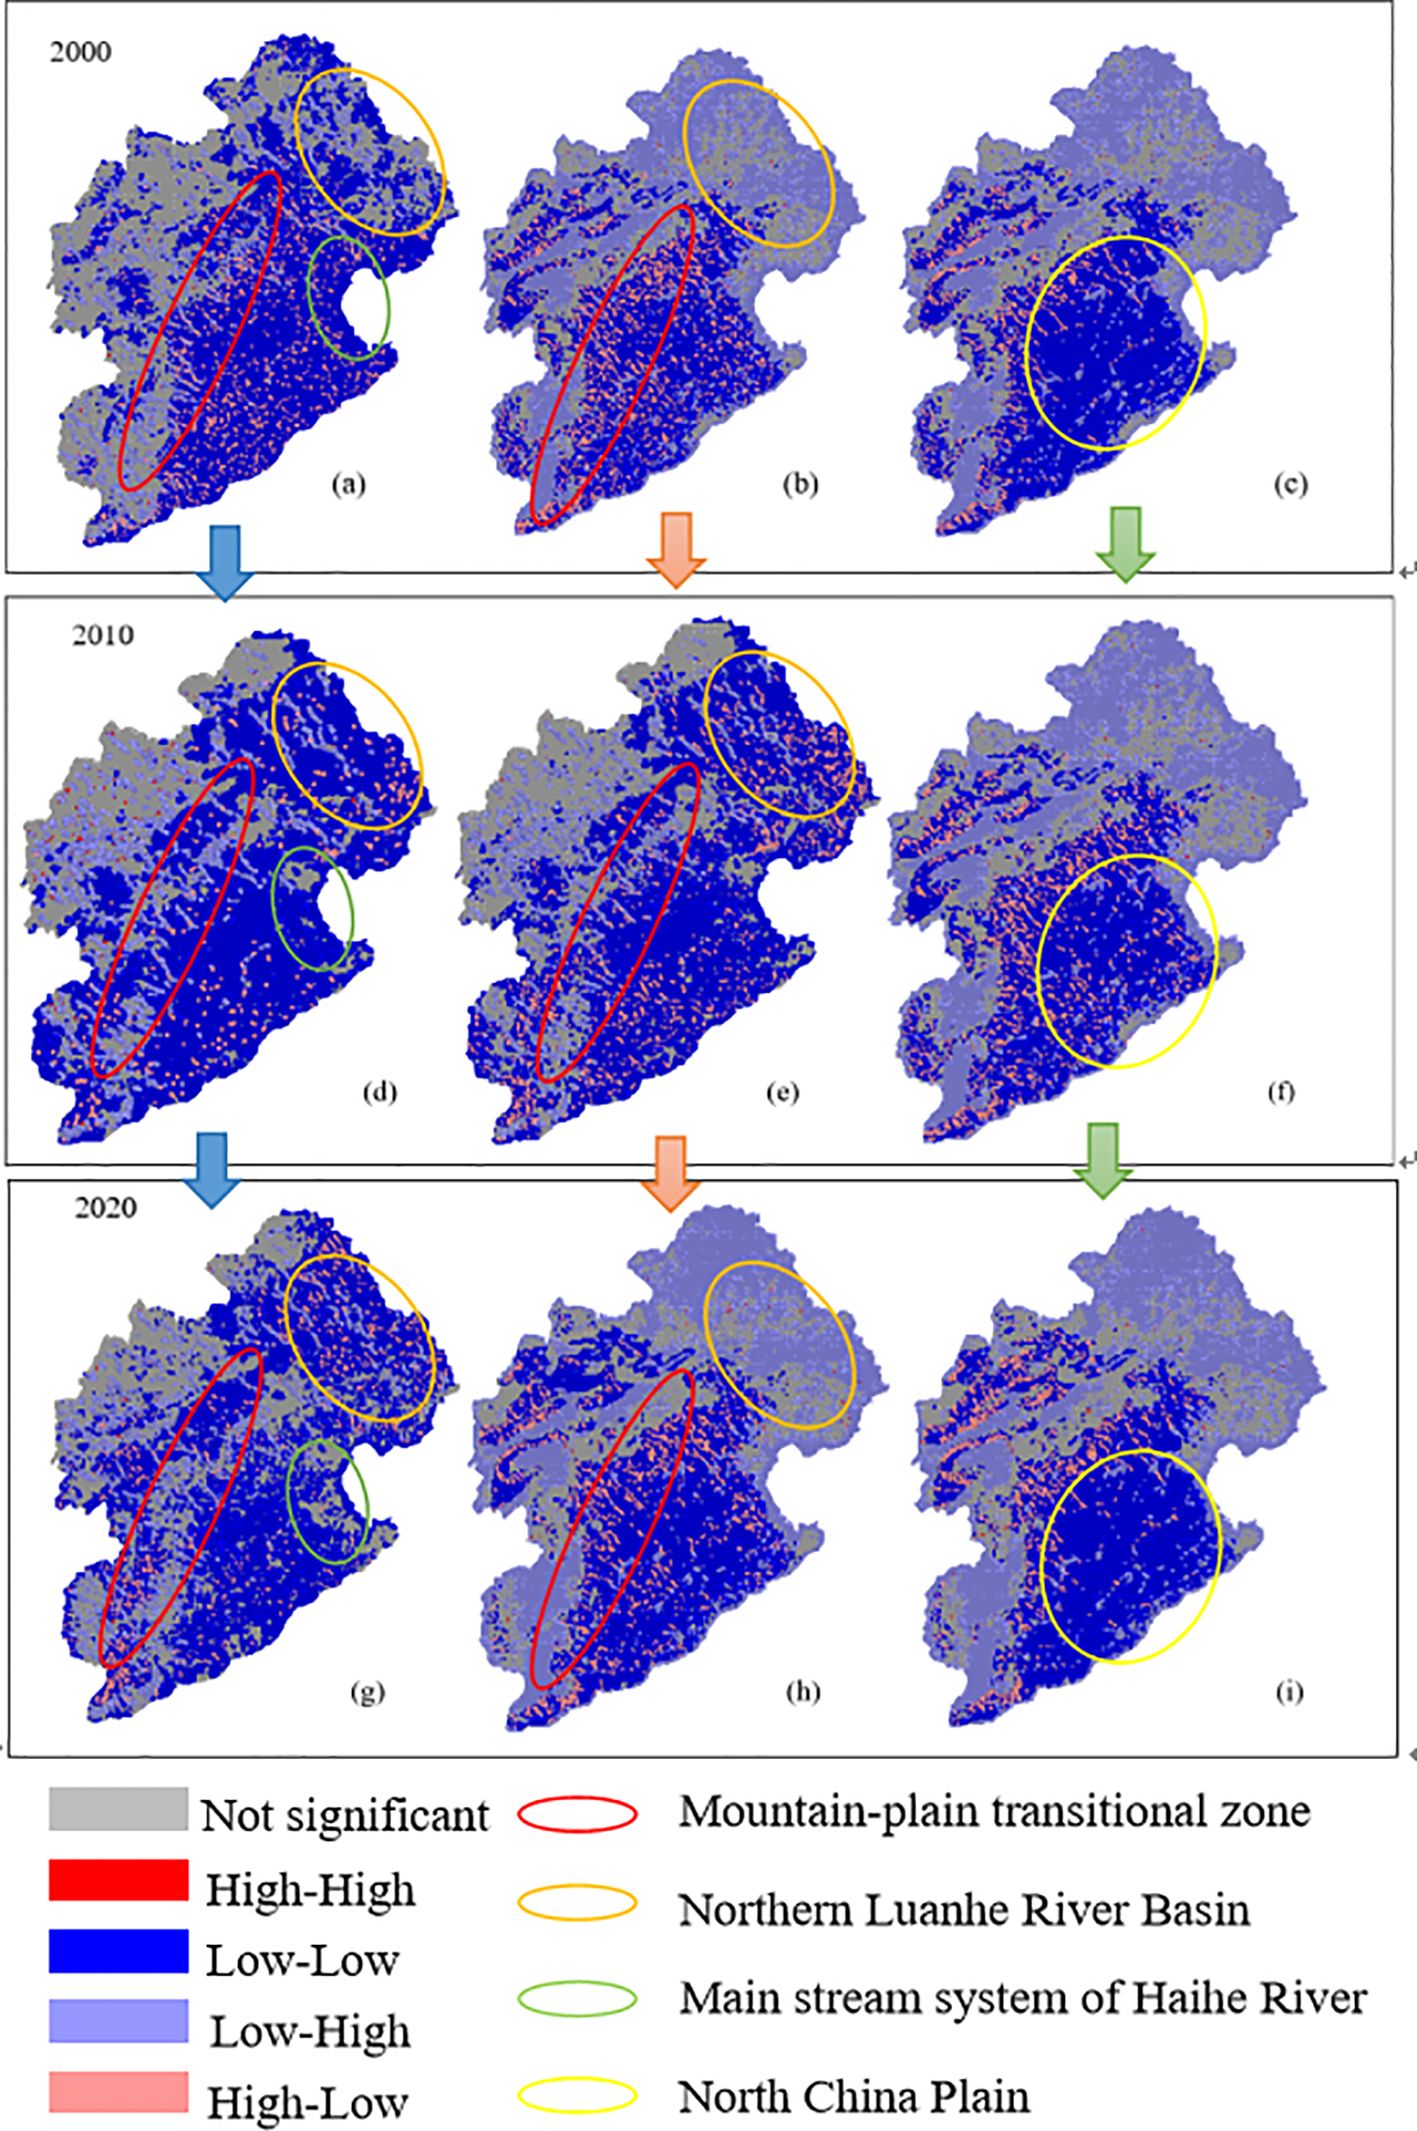
Figure 14. Spatial distribution of trade-offs and synergies: (a)2000 WCS & SCS; (b) 2000 WCS & WPS; (c) 2000 SCS& WPS; (d)2010 WCS & SCS; (e) 2010 WCS & WPS; (f) 2010 SCS& WPS; (g)2020 WCS & SCS; (h) 2020 WCS & WPS; (i) 2020 SCS& WPS.
In the mountain–plain transitional zones (The red regions in the figure), the correlation between WCS and SCS gradually becomes evident, evolving from initially insignificant to a significant low–low agglomeration correlation. Meanwhile, the correlation between WCS and WPS underwent a transformation from low–high agglomeration correlation to low–low agglomeration or no longer significant. This is closely related to the effects of terrain-driven hydrological process differentiation and stepwise land use development. The transition from steep mountainous areas to flat plains may lead to the segmentation of natural water and sediment transport pathways by artificial water conservancy facilities (such as weirs and irrigation channels), disrupting the natural coupling mechanism of water, soil, and pollutants. Additionally, the gradient shift in land use from ecologically dominant (forests/grasses) to production-oriented (agricultural land/buildings), with the spread of agricultural non-point source pollution, makes it difficult for WCS to efficiently coordinate and meet the demands of soil conservation SCS and water purification WPS. This ultimately results in a nonlinear transformation of service correlations.
In the northern Luanhe River Basin(the orange regions in the figure), the correlation between WCS and SCS exhibits a dynamic evolution. Initially, there was no significant correlation or only a low–low agglomeration relationship between them. However, over time, this relationship evolved into a complex pattern of coexisting high–low and low–low agglomeration. Simultaneously, the correlation between WCS and WPS also underwent significant changes. From 2000 onwards, they exhibited a mix of low–high agglomeration and insignificant relationships, but by 2010, this relationship had shifted to a low–low agglomeration pattern. By 2020, their correlation seemed to revert to the state observed in 2000. This evolution may be due to the coexistence of the Luanhe River Basin’s ecological afforestation projects enhancing WCS and SCS supply while downstream irrigation agriculture expansion increased water resource consumption, further complicating the interactions between these services. Additionally, the phased changes in non-point source pollution control measures reveal a periodic fluctuation pattern of WCS–WPS correlation (“low–high→low–low→low–high”), indirectly reflecting the lagged effectiveness of non-point source pollution control policies.
In the Haihe main river system(the green regions in the figure), the correlation between WCS and SCS gradually weakened. Initially, there may have been some degree of agglomeration relationship between them, but over time, this relationship became insignificant. This may be due to the influence of multiple natural and anthropogenic factors, leading to increasingly complex and elusive interactions between WCS and SCS.
In the North China Plain region (the yellow regions in the figure), the correlation between WCS and WPS has shown a gradually increasing trend. In 2000, there was no significant correlation between them. However, over time, their agglomeration effects gradually emerged, characterized by high–low agglomeration. This means that within this region, although there is some interaction between WCS and WPS, the strength of this interaction is not high and may be influenced by various other factors.
4 Discussions
4.1 Comparative analysis of watershed ecological security results considering ecosystem service flows with previous studies
This study systematically evaluated the coupled ecological security of the three services from 2000 to 2020, revealing that the synergistic zones of water retention–soil conservation–water purification services showed a decreasing trend. This finding significantly differs from mainstream ecological security assessments. Traditional studies predominantly focused on single-service threshold methods and assessed the security status of the Haihe River Basin using water quality compliance rates and concluded that the basin was generally secure. However, this study demonstrates that when considering service flow blocking effects, the actual proportion of secure zones is much lower. This discrepancy highlights the limitations of single-service assessments: even if individual services meet standards in localized areas (e.g., soil conservation modulus >800 t/ha in the southern Taihang Mountains), blocked service flow pathways may degrade comprehensive security status downstream.
Compared to existing “source–sink” pattern studies (Peng et al., 2018), the innovation of this research lies in its dynamic service flow perspective. Traditional methods identified the northern Yanshan Mountains as a stable ecological source area. However, our study found a declining trend in water retention service flow efficiency in this region. Notably, while the persistent basin-wide deficit in water purification services aligns with single-service evaluations. our study proposes systematic governance strategies – source control, process management, and local remediation – from a service flow transmission perspective, to translate upstream management benefits into downstream ecological security improvements, thereby addressing mismatches in various ecosystem services.
4.2 The role of service supply–flow–demand coupling trade-off mechanisms in achieving sustainable development goals
This study employs a “supply–flow–demand” (S-F-D) framework and examine the relationship between trade-offs and synergies, identifying watershed security issues in the Haihe River Basin. The analysis reveals that the basin has experienced an increase in areas with slight deficits in WCS within the North China Plain and Yongding River Basin, while areas with slight and full surpluses have decreased in mountainous regions. This trend indicates that water demand is outpacing supply, underscoring the need for integrated management strategies to balance WCS supply and demand. Additionally, the Haihe River Basin has seen a significant increase in slight deficit areas for SCS, particularly in the Luan River Basin, indicating worsening soil erosion. Concurrently, the proportion of surplus areas has decreased, suggesting that soil erosion is outpacing conservation efforts, leading to more deficits and fewer surpluses in SCS. Furthermore, 52% of the Haihe River Basin experienced severe deficits and 46% slight deficits in WPS, predominantly in the plains and Zhangjiakou grasslands, with the Taihang and Yanshan mountain areas also affected. Regarding service trade-offs, low–low synergy combinations are most prevalent across the three ecosystem service combinations (WCS, SCS, and WPS). Additionally, the proportions of low–high and high–low trade-off categories are increasing, particularly between WCS–WPS and SCS–WPS, indicating a growing disconnection in service synergies and a weakening overall effect. This highlights the need for more balanced and comprehensive ecological strategies that consider the interdependencies among different ecosystem services.
Intensive agricultural activities and rapid urbanization are key factors contributing to declining water quality, disrupted natural flows, and increased trade-offs between ecosystem services. To mitigate these challenges, integrated management strategies should focus on balanced resource allocation, enhanced synergies through targeted restoration and improved practices, and coordinated policies that address both supply and demand aspects of ecosystem services. Robust monitoring and adaptive measures are also essential for tracking changes and ensuring sustainable outcomes, thereby supporting the achievement of the Sustainable Development Goals.
4.3 Research limitations and perspectives
Based on the difference surplus between the supply side and the demand side of aquatic ecosystem services, this study formed a service flow and evaluated the security status of various types of aquatic ecosystem services, considering both local and remote service flows. The overall pattern aligns with previous research findings and reflects the current actual situation of the study area. However, due to the complexity of water ecological processes, influenced by topography and geomorphology, it is difficult to accurately estimate the consumption law of service flow, as both surface water and groundwater are involved. Additionally, the spatial resolution used in this study was not sufficient to fully capture the complexity of small-scale ecological processes, particularly the spatiotemporal variation in service supply and demand at the microhabitat level. In the next phase of this study, further consideration will be given to the consumption of surface water and groundwater on aquatic ecosystem services, with the goal of optimizing the service flow evaluation model and improving the accuracy of aquatic ecosystem service assessments.
5 Conclusion
This study innovatively proposes the “Watershed Ecosystem Services Security” theoretical framework and constructs a “supply–flow–demand” three-dimensional analytical framework, achieving a full-chain quantitative analysis of ecosystem service supply, transmission, and demand. The main findings reveal that spatial mismatches in supply and demand, as well as service flow path blockages, are the core mechanisms driving the decline in synergies between WCS–SCS, WCS–WPS, and SCS–WPS. The weak correlations among these services arise from the heterogeneity of service pathways. The diverging temporal trajectories of synergy deficiencies across service combinations underscore the necessity for more nuanced monitoring and management of ecosystem service interactions.
Future research should focus on expanding the application of multi-scale, multi-process coupled models, particularly for cross-regional ecological restoration and water resource management. By integrating digital twin technologies and real-time monitoring platforms, dynamic tracking of service flow path changes can be achieved, leading to optimized service flow management. Additionally, incorporating socio-ecological systems (SES) frameworks will help integrate socio-economic factors into the dynamic evaluation of ecosystem services, facilitating the monitoring of changes in ecosystem service demands. Long-term evaluations of ecological restoration policies and management measures are also essential to assess their impact on ecosystem service supply and demand, thereby providing a more robust scientific basis for enhancing watershed ecological security and sustainability.
Data availability statement
The original contributions presented in the study are included in the article/supplementary material. Further inquiries can be directed to the corresponding author.
Author contributions
YR: Conceptualization, Data curation, Formal Analysis, Funding acquisition, Investigation, Resources, Writing – original draft, Writing – review & editing. LZ: Investigation, Methodology, Project administration, Software, Validation, Writing – original draft. YZ: Conceptualization, Formal Analysis, Methodology, Resources, Writing – original draft.
Funding
The author(s) declare that financial support was received for the research and/or publication of this article. This research was funded by National Natural Science Foundation of China (Project Numbers: 71673268, 72404266) and Special research Assistant project, Chinese Academy of Sciences.
Conflict of interest
The authors declare that the research was conducted in the absence of any commercial or financial relationships that could be construed as a potential conflict of interest.
Generative AI statement
The author(s) declare that no Generative AI was used in the creation of this manuscript.
Publisher’s note
All claims expressed in this article are solely those of the authors and do not necessarily represent those of their affiliated organizations, or those of the publisher, the editors and the reviewers. Any product that may be evaluated in this article, or claim that may be made by its manufacturer, is not guaranteed or endorsed by the publisher.
References
Abernethy V. D. (1999). Nature’s services: Societal dependence on natural ecosystems. Population Environ. 20, 277–278. doi: 10.1023/A:1023307309124
Bagstad K. J., Villa F., Batker D., Harrison-Cox J., Voigt B., and Johnson G. W. (2014). From theoretical to actual ecosystem services: mapping beneficiaries and spatial flows in ecosystem service assessments. Ecol. Soc. 19, 2. doi: 10.5751/ES-06523-190264
Cai J., Wei X. J., Jiang P., and Liang Y. Q. (2024). Ecosystem service trade-off synergy strength and spatial pattern optimization based on bayesian network: A case study of the Fenhe River basin. Huan Jing Ke Xue 45, 2780–2792. doi: 10.13227/j.hjkx.202305204
Chaminé H. I., Teixeira J., Freitas L., Pires A., Silva R. S., Pinho T., et al. (2016). From engineering geosciences mapping towards sustainable urban planning. Eur. Geol. J. 41, 16–25. Available online at: http://hdl.handle.net/10400.22/18052.
DiMento J. F. C. (2007). From resource scarcity to ecological security: exploring new limits to growth, by Dennis Pirages and Ken Cousins, The MIT Press 2005, ISBN-10: 0-262-66189-6. Int. Environ. Agreements 7, 99–103. doi: 10.1007/s10784-006-9020-4
Ding H. and Sun R. (2023). Supply-demand analysis of ecosystem services based on socioeconomic and climate scenarios in North China. Ecol. Indic. 146, 109906. doi: 10.1016/j.ecolind.2023.109906
Felipe-Lucia M. R., Martín-López B., Lavorel S., Berraquero-Díaz L., Escalera-Reyes J., and Comín F. A. (2015). Ecosystem services flows: why stakeholders’ Power relationships matter. PloS One 10, e0132232. doi: 10.1371/journal.pone.0132232
Geng W., Li Y., Zhang P., Yang D., Jing W., and Rong T. (2022). Analyzing spatio-temporal changes and trade-offs/synergies among ecosystem services in the Yellow River Basin, China. Ecol. Indic. 138, 108825. doi: 10.1016/j.ecolind.2022.108825
Li S. K., He W. X., Wang L., Zhang Z., Chen X. Q., Lei T. C., et al. (2023). Optimization of landscape pattern in China Luojiang Xiaoxi basin based on landscape ecological risk assessment. Ecol. Indic. 146, 109887. doi: 10.1016/j.ecolind.2023.109887
Li X., Li X., Lyu X., Dang D., Wang K., Zhang C., et al. (2023b). Linking ecological and social systems to promote regional security management: A perspective of ecosystem services supply-flow-demand. Ecol. Indic. 156, 111124. doi: 10.1016/j.ecolind.2023.111124
Liu C., Li H., and Zhang Q. (2020). Research on sewage monitoring and water quality prediction based on wireless sensors and support vector machines. Wireless Commun. Mobile Computing. 10, 8852965. doi: 10.1155/2020/8852965
Lu Z., Li W., and Yue R. (2024). Investigation of the long-term supply–demand relationships of ecosystem services at multiple scales under SSP–RCP scenarios to promote ecological sustainability in China’s largest city cluster. Sustain. Cities Soc. 104, 105295. doi: 10.1016/j.scs.2024.105295
Lyu X., Li X., Wang K., Cao W., Gong J., Wang H., et al. (2022). Linking regional sustainable development goals with ecosystem services to identify ecological security patterns. Land Degradation Dev. 33, 3841–3854. doi: 10.1002/ldr.v33.18
Lyu R., Yuan M., Fu X., Tang M., Qu L., Yin Z., et al. (2025). The trade-offs and constraints of watershed ecosystem services: A case study of the west Liao river basin in China. Land 14, 119–119. doi: 10.3390/land14010119
Palmer M. A. and Ruhi A. (2019). Linkages between flow regime, biota, and ecosystem processes: Implications for river restoration. Science 365, eaaw2087. doi: 10.1126/science.aaw2087
Pei T., Xu J., Liu Y., Huang X., Zhang L., Dong W., et al. (2021). GIScience and remote sensing in natural resource and environmental research: Status quo and future perspectives. Geography Sustainability 2, 207–215. doi: 10.1016/j.geosus.2021.08.004
Peng J., Yang Y., Liu Y. X., Hu Y. N., and Du Y. Y. (2018). Meersmans J, Qiu S J. Linking ecosystem services and circuit theory to identify ecological security patterns. Sci. Total Environ. 644, 781–790. doi: 10.1016/j.scitotenv.2018.06.292
Raudsepp-Hearne C., Peterson G. D., and Bennett E. M. (2010). Ecosystem service bundles for analyzing tradeoffs in diverse landscapes. Proc. Natl. Acad. Sci. 107, 5242–5247. doi: 10.1073/pnas.0907284107
Syrbe R. and Grunewald K. (2017). Ecosystem service supply and demand – the challenge to balance spatial mismatches. Int. J. Biodiversity Sci. Ecosystem Service 2, 148–161. doi: 10.1080/21513732.2017.1407362
Ursulak J. and Coulibaly P. (2021). Integration of hydrological models with entropy and multi-objective optimization based methods for designing specific needs streamflow monitoring networks. J. Hydrol. 593, 125876. doi: 10.1016/j.jhydrol.2020.125876
Villamagna A. M., Angermeier P. L., and Bennett E. M. (2013). Capacity, pressure, demand, and flow: A conceptual framework for analyzing ecosystem service provision and delivery. Ecol. Complexity 15, 114–121. doi: 10.1016/j.ecocom.2013.07.004
Wang Y. Q. and Sun X. Y. (2025). Trade-off and synergy of ecosystem services in the yellow river basin and their spatiotemporal heterogeneity. Huan Jing Ke Xue 46, 972–989. doi: 10.13227/j.hjkx.202402126
Wang L., Zheng H., Chen Y., Ouyang Z., and Hu X. (2022). Systematic review of ecosystem services flow measurement: Main concepts, methods, applications and future directions. Ecosystem Serv. 58, 101479. doi: 10.1016/j.ecoser.2022.101479
Wang L., Zheng H., Wen Z., Liu L., Robinson B. E., Li R., et al. (2019). Ecosystem service synergies/trade-offs informing the supply-demand match of ecosystem services: Framework and application. Ecosystem Serv. 37, 100939. doi: 10.1016/j.ecoser.2019.100939
Xia J., Zhang L., Liu C., and Yu J. (2007). Towards better water security in North China. Water Resour. Manage 21, 233–247. doi: 10.1007/s11269-006-9051-1
Xue F., Yang Y., and Hu Y. n. (2024). Integrating supply and benefits of ecosystem services into ecological security pattern: A spatial flow perspective. Ecol. Indic. 166, 112455. doi: 10.1016/j.ecolind.2024.112455
Yang S., Peng S., Li X., Wei X., Pan Y., and Jiao Y. (2024). Spatial heterogeneity and interacting intensity of drivers for trade-offs and synergies between carbon sequestration and biodiversity. Global Ecol. Conserv. 56, e03256. doi: 10.1016/j.gecco.2024.e03256
Yang J., Xie B., Tao W., and Zhang D. (2021). Ecosystem services assessment, trade-off, and bundles in the yellow river basin, China. Diversity 13, 308. doi: 10.3390/d13070308
Yao Z., Wang Z., Cui X., and Zhao H. (2023). Research on multi-objective optimal allocation of regional water resources based on improved sparrow search algorithm. J. Hydroinformatics 25, 1413–1437. doi: 10.2166/hydro.2023.037
Zhang J., He C., Huang Q., and Li L. (2023). Understanding ecosystem service flows through the metacoupling framework. Ecol. Indic. 151, 110303. doi: 10.1016/j.ecolind.2023.110303
Zhang B., Zheng L., Wang Y., Li N., Li J., Yang H., et al. (2023). Multiscale ecosystem service synergies/trade-offs and their driving mechanisms in the Han River Basin, China: implications for watershed management. Environ. Sci. Pollut. Res. 30, 43440–43454. doi: 10.1007/s11356-023-25248-6
Keywords: ecosystem services, supply demand matching, service flows, trade-offs, watershed ecological security
Citation: Rong Y, Zheng L and Zhao Y (2025) Balancing ecosystem services supply-flow-demand for watershed ecological security: a case study of the Hai River Basin, China. Front. Ecol. Evol. 13:1587167. doi: 10.3389/fevo.2025.1587167
Received: 04 March 2025; Accepted: 02 May 2025;
Published: 23 May 2025.
Edited by:
Jeanne Marie Fair, Los Alamos National Laboratory (DOE), United StatesReviewed by:
Cristhian Clavijo, Vida Silvestre Uruguay, UruguayGuang Hu, Zhejiang Sci-Tech University, China
Copyright © 2025 Rong, Zheng and Zhao. This is an open-access article distributed under the terms of the Creative Commons Attribution License (CC BY). The use, distribution or reproduction in other forums is permitted, provided the original author(s) and the copyright owner(s) are credited and that the original publication in this journal is cited, in accordance with accepted academic practice. No use, distribution or reproduction is permitted which does not comply with these terms.
*Correspondence: Yuejing Rong, eWpyb25nQHJjZWVzLmFjLmNu