 Zhijia Gu
 Keke Ji1,2
- 1School of Geographical Sciences, Xinyang Normal University, Xinyang, China
- 2North–South Transitional Zone Typical Vegetation Phenology Observation and Research Station of Henan Province, Xinyang, China
- 3School of Geographical Sciences, School of Carbon Neutrality Future Technology, Fujian Normal University, Fuzhou, China
- 4Faculty of Geographical Science, Beijing Normal University, Beijing, China
- 5School of International Education, Xinyang Normal University, Xinyang, China
Introduction: Understanding spatiotemporal variations in vegetation and their climatic and anthropogenic factors can provide a crucial theoretical basis for environmental conservation and ecological restoration in the loess hilly area of western Henan Province. However, the spatiotemporal variation and driving forces of vegetation cover in this area under climate change and human activities are still unclear.
Methods: Therefore, in this study, based on the MOD13Q1 NDVI (Normalized Difference Vegetation Index) data from 2000 to 2022, combined with climatic, topographic and human activities data, trend analysis, residual analysis, partial correlation coefficient calculation, and geographical detector techniques were applied to detect the dynamic trends of vegetation changes and their intrinsic relationships with various influencing factors.
Results: The findings revealed the following: (1) From 2000 to 2022, a comprehensive analysis of satellite-derived vegetation indices revealed substantial enhancements in vegetation cover across 77.5% of the study region, with pronounced improvements documented in five key administrative units: Lushi County, Lingbao City (southern sector), Luoning County, Mianchi County, and Xinan City. In contrast, due to the rapid expansion of urbanization and the implementation of production and construction projects, the vegetation has been greatly disturbed. Severe vegetation degradation has been noted in smaller areas, such as Luoyang City, Mengjin County, Gongyi City, northern Lingbao City, Shangjie District of Rongyang City, and Yiyang County, covering 4.4% of the total area. (2) The seasonal difference of loess hilly area in western Henan is significant. The observed vegetation improvement across the study area between 2000 and 2022 can be primarily attributed to enhanced spring vegetation growth during this period. (3) Partial correlation analysis indicated that the precipitation had more significant effect on NDVI than temperature in the study area. During the study period, the area of pixels with positive NDVI residual trends accounted for 86.96% of the total area. (4) The observed increase in vegetation NDVI across the study area was predominantly attributable to the synergistic effects of climate change and human activities. Landuse, elevation, and temperature exhibited consistently high average explanatory contributions, with each factor independently accounting for over 40%. The explanatory contributions of interaction effects was further enhanced compared to that of individual factors, with the interaction between land use type and elevation reaching as high as 70.9%. The explanatory contributions of various interacting factors on NDVI showed a gradual increase trend.
Discussion: The NDVI changes in the loess hilly region of western Henan exhibit a "promotion-dominated, suppression-supplemented" anthropogenic influence pattern. Human activity intensity serves as the primary driving factor for vegetation changes in this area. For instance, the "Grain for Green Project" has significantly promoted vegetation restoration in the study region, while land use changes tend to trigger substantial vegetation disturbances.
1 Introduction
Vegetation plays an essential role in terrestrial ecosystems, exerting a significant influence on material circulation and energy exchange with atmosphere, lithosphere, soil sphere and hydrosphere (Lunetta et al., 2006). Terrestrial vegetation also has a positive impact and feedback on the carbon cycle, nitrogen cycle and water cycle (David, 1995; Myneni et al., 2001). The normalized difference vegetation index (NDVI) is a crucial indicator in satellite remote sensing for assessing vegetation growth. It has been extensively applied for monitoring vegetation dynamics at large areas and extended temporal scales (Piao et al., 2014; Gonsamo et al., 2017). The MODIS NDVI dataset offers more accurate spectral, spatial, geometric, and radiometric attributes (Ganguly et al., 2010; Petus et al., 2013). Therefore, with a good correlation with vegetation coverage, it has been widely used to analyze vegetation changes at large scale areas.
The succession of vegetation cover is mainly influenced by the climate and human activities. Resource extraction and land use change are examples of activities that directly affect ecosystems (Glina et al., 2019). Therefore, it is imperative to systematically track vegetation dynamics and detect the nuanced impacts of driving factors on vegetation variation (Yang et al., 2024). Vegetation is frequently a biological indicator of climate change due to its sensitivity to climatic changes (Ahmad et al., 2022). Therefore, the responses of vegetation changes to climate factors have attracted more attention around the world (Baniya et al., 2018; Chen et al., 2024). Analyzing spatiotemporal vegetation dynamics and their correlation with climatic factors has emerged as a pivotal research frontier in understanding ecological environment change (Wu et al., 2020). At different geomorphic units, basins, national and provincial administrative units, spatiotemporal variation of NDVI have been studied from different spatial and temporal scales (Ma et al., 2022; Wei et al., 2022; Eisfelder et al., 2023; Dastigerdi et al., 2024; Han et al., 2022). In general, the impact of precipitation on NDVI was greater than that of temperature (Han et al., 2022; Chen et al., 2021; Zhang et al., 2023). The study in the Loess Hilly and Gully Region of China showed the annual precipitation was the most crucial factor driving the NDVI change (Jia et al., 2023). There are differences in the effects of climate and human activities on vegetation. The study in the across wet meadow areas in the Andes Centrales of Argentina showed that climate factors rather than human activities controlled NDVI trends (Sardiña et al., 2023). The study on the Loess Plateau in China also found the driving force of natural factors was significantly greater than anthropogenic factors (Zhang et al., 2022). More than half vegetation change in the desertified areas of northern China was driven by non–climatic factors (such as groundwater level and soil matrix) (Wang et al., 2021). Since the beginning of the 21st century, human activity was the driving force for vegetation improvement in Wuliangsu Lake Basin, Northern China, where ecological instability is weak (Li et al., 2023). Based on the interaction geographic detector, human activities played a dominant role in the influence of NDVI on the vegetation of Miaoling Karst Mountain Area, SW China (Wu et al., 2023). From 1982 to 2020, precipitation and solar radiation were the most important influences, however, human activities favorably affected vegetation recovery in most area of China after 2000 (Tuoku et al., 2024). In the context of global warming, extreme climate events such as drought occur frequently, which seriously affect the growth of regional vegetation. Long–term NDVI data is the basis for in–depth understanding of the spatio–temporal evolution of vegetation and its response to climate factors.
The loess hilly area of western Henan Province is one of the most serious areas of soil erosion, and the local ecological environment deteriorates, which affects the living environment of local people. Therefore, the study of temporal and spatial changes of vegetation coverage and its influencing factors in this region is conducive to the further conservation of soil and water resources, the preservation and improvement of ecological environment, and the ecological, economic and social benefits are significant. There are few studies on NDVI of vegetation in the western Henan Province. Based on NDVI data, Zhang et al. (2017) analyzed the recovery rate of NDVI in the western Henan mountains at different altitudes, slopes and slope directions, as well as the changes in response to climate. Yu et al. (2022) conducted research on NDVI in Henan Province and found that the terrain in the hilly area of western Henan was fragmented, farmland was damaged, and soil erosion was severe, which contributed to the low NDVI values in the region. It has been found that NDVI was positively correlated with temperature and precipitation in most regions of Henan Province (Guo and Wang, 2018). From 2000 to 2015, the influence of human factors on vegetation in Henan Province was more obvious than that of natural factors, and the areas of vegetation degradation were mainly concentrated in Jiaozuo City, Zhengzhou City and the north of Luoyang City in the loess hilly region of western Henan Province (Nie et al., 2024). Human activities have a dual effect on changes in vegetation coverage. With the advancement of urbanization, surface vegetation is directly or indirectly destroyed, resulting in a decrease in vegetation coverage. On the other hand, a series of ecological restoration measures such as returning farmland to forests, afforestation, and natural forest protection have also improved vegetation coverage in the region (Wang et al., 2010; Li et al., 2024). Previous research has partially determined the driving factors and their respective contributions to the spatial distribution patterns of NDVI in Henan Province. Some researchers have pointed out that the areas where vegetation has significantly degraded in recent years are mainly concentrated in the loess hilly region of western Henan. This is because the area is located in the loess hilly region, with fragmented terrain and numerous gullies. The cultivated land has been severely damaged. At the same time, due to the development of urbanization, the construction land has increased, reducing the vegetation coverage. Therefore, vegetation cover dynamics and their influencing factors in this region require further in-depth analysis. Understanding the vegetation dynamics respond to climate change and human activities is a key research focus due to its crucial role and ever–changing nature (Chen et al., 2015). Besides, it is of great important for regional ecological protection, vegetation restoration and ecosystem management (Chen et al., 2022; Xu et al., 2022). In recent years, climatic factors such as precipitation and temperature in this region have undergone noticeable changes compared to historical patterns. Additionally, the impact of human activities on land use has been intensifying. Due to the rapid expansion of urbanization and the implementation of production and construction projects, the vegetation has been greatly disturbed. However, a thorough understanding of the spatiotemporal dynamics of vegetation and its interactions with climate factors and human activities in the research area still needs to be improved.
Based on the MOD13Q1 NDVI data from 2000 to 2022, this study through trend analysis, residual analysis, partial correlation analysis and Geodetector, analyzed the vegetation dynamics in the loess hilly area of western Henan Province. And the driving factors of vegetation change were determined. In this study, we pursued the following objectives: (1) to detect the temporal and spatial vegetation dynamics in the loess hilly region of western Henan Province; (2) to identify the responses of vegetation change to climate and human activities from 2000 to 2022; (3) to determine the dominant factors affecting spatial distribution of vegetation in loess hilly region of western Henan Province.
2 Materials and methods
2.1 Study area
The loess hilly area of western Henan Province is located in the west of Henan Province, adjacent to the Yellow River to the north, the mountainous terrain of western Henan to the south, and the plains of eastern Henan to the east (Figure 1). The loess hills account for approximately 80% of the area, with elevations ranging from 110 m in the Yiluo river valley to 500 m across low-relief mountainous zones, while isolated peaks reach elevations exceeding 1000 m. The study area belongs to the temperate semi-humid to semi-arid monsoon climate, featuring sufficient solar radiation and thermal accumulation. The mean annual average temperature ranges from 14 to 15°C, coupled with 600–700 mm of precipitation. The precipitation began to increase from April, but the increase was not significant from April to June. It surged to its peak in July and gradually decreased thereafter. The terrain in this area is rugged, with crisscrossing valleys and fragile ecological environment (Gu et al., 2024). The vegetation types within the study area are predominantly cold-tolerant woody plants. The existing vegetation mainly comprises natural secondary forests and plantations. The current vegetation includes tree species such as Cercidiphyllum japonicum, Pistacia chinensis, Populus L., Robinia pseudoacacia L., and Cupressus funebeis Endl. The main soil types in the study area are cinnamon soil, skeletal soil, and brown soil. Soil erosion in the study area was generally moderate erosion and below, accounting for 76.09%.
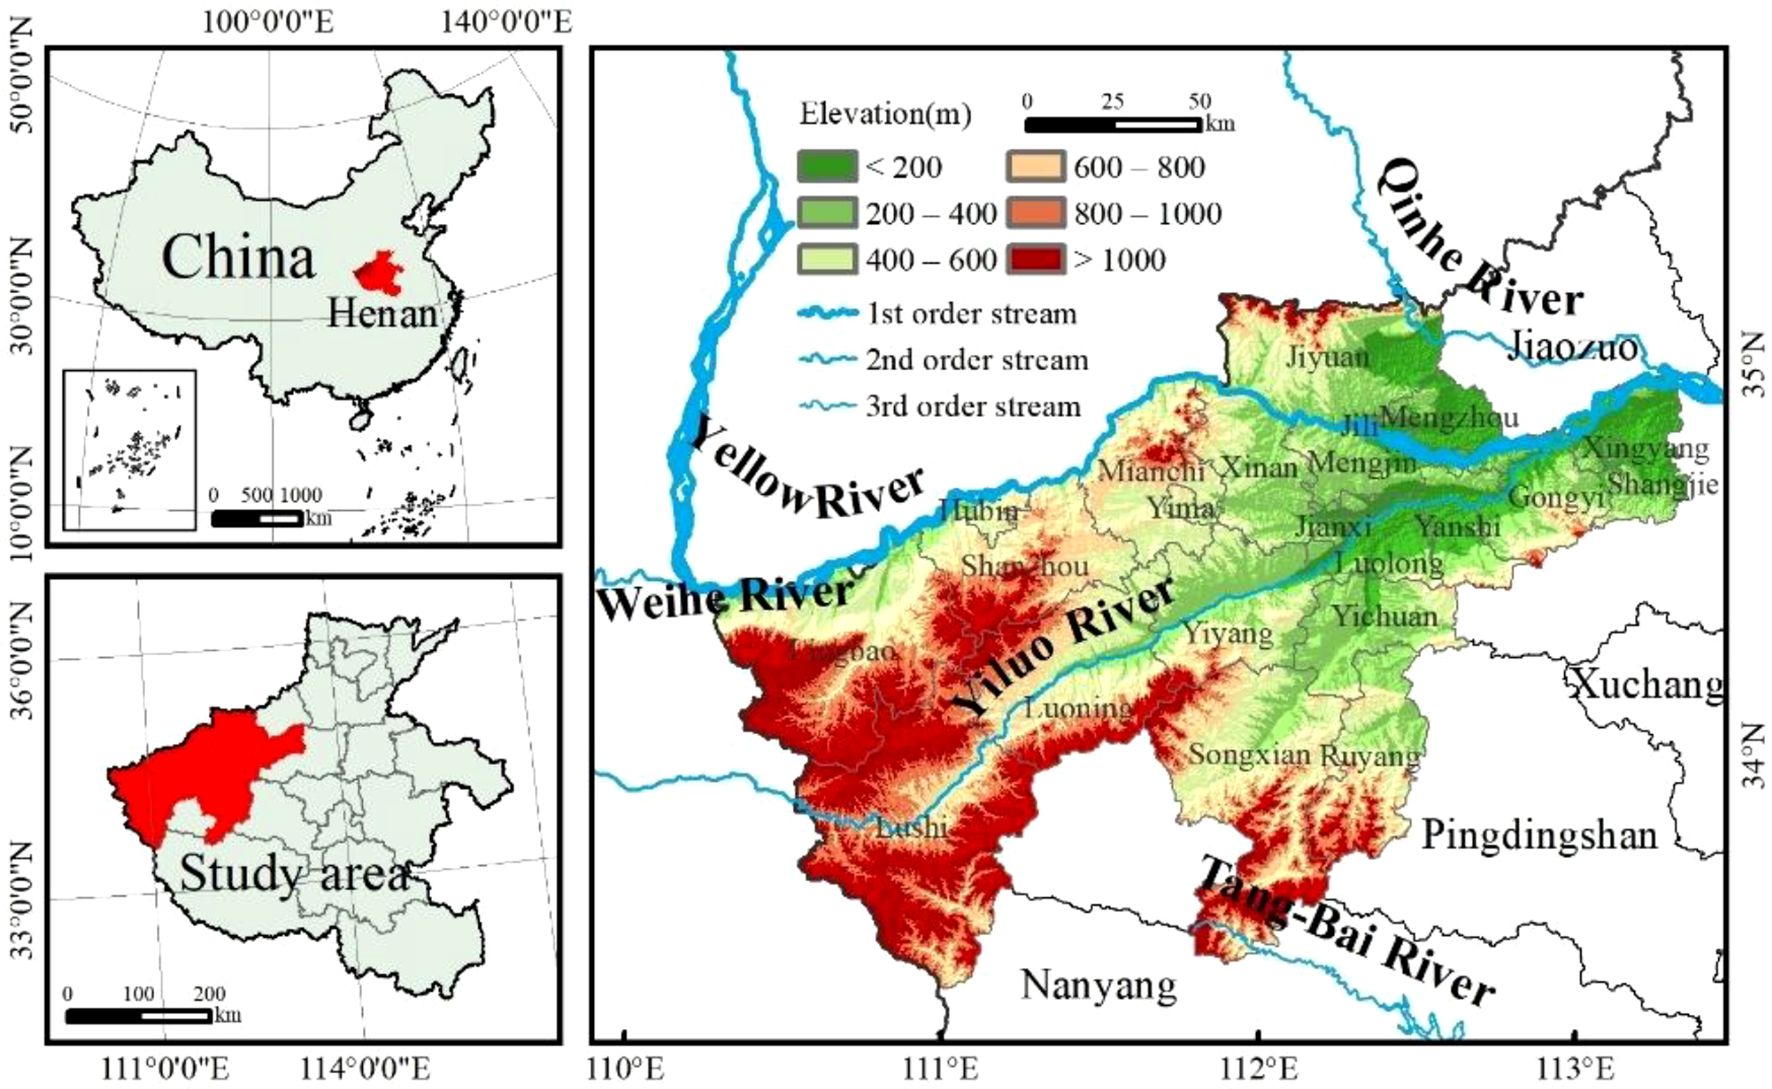
Figure 1. Location of the study area.
2.2 Data sources and preprocessing
The Moderate–Resolution Imaging Spectroradiometer (MODIS) Terra 16–day vegetation index product (MOD13Q1, 250 m spatial resolution) was from the US Geological Survey (USGS; http://glovis.usgs.gov). Images from 2000 to 2022 were decoded, reprojected, reformatted, and stitched using the Modis Reprojection Tool (MRT). The product has minimized the effect of cloud, cloud shadows, and noise through 16 days of synthetic data. ArcGIS software was used to obtain monthly NDVI data by max value composite. The annual average NDVI was derived by averaging monthly NDVI composites (MOD13Q1, 250 m) across each hydrological year. The temperature and precipitation datasets (1 km spatial resolution) were obtained from the National Earth System Science Data Center (NESDC; https://www.geodata.cn). Land use data with 30 m resolution spatially are from Institute of Remote Sensing Information Processing http://irsip.whu.edu.cn/in_eng_v2.php. Population density data comes from the Data Center for Resources and Environmental Sciences, Chinese Academy of Sciences (https://www.resdc.cn/). The night light data and elevation data are derived from the Geospatial Data Cloud at https://www.gscloud.cn/. The climate data (precipitation and temperature) from 2000 to 2019 come from the National Earth System Science Data Center, National Science and Technology Infrastructure of China at http://www.geodata.cn/.
2.3 Methods
2.3.1 Trends analysis
Theil–Sen slope is the non–parametric slope estimation method (Yang et al., 2021; Gao et al., 2022). Compared to the least square linear fitting method, Theil–Sen slope is not affected by outliers and noise in the data (Sen, 1968). Therefore, it is widely applied in time series trend of climate variables (Martinez et al., 2012). This study applied this method to calculate the interannual change trend of vegetation in the study area from 2000 to 2022, and revealed the growth dynamics of vegetation in the study area (Zhu et al., 2022). Theil–Sen slope is estimated based on the median value of the observations xi and xj at all pairwise time steps i and j. The formula is as follows:
where xi and xj are the values of NDVI at time i and j. The median is the median function. The negative values of slope indicate a negative trend of NDVI and a positive value indicates a positive trend of NDVI in the study period.
Mann–Kendall test was used to test the significance of the change trend (Mann, 1945; Kendall, 1975; Zhou and Zhang, 2023). The slope and M–K test results are combined for comprehensive analysis. The trend of NDVI changes can be divided into six categories: extremely significant increase (Slope > 0, p < 0.01), significant increase (Slope > 0, 0.01 ≤ p < 0.05), insignificant increase (Slope > 0, p ≥ 0.05), insignificant decrease (Slope < 0, p > 0.05), significant decrease (Slope < 0, 0.01 ≤ p < 0.05), and extremely significant decrease (Slope < 0, p < 0.01).
2.3.2 Partial correlation analysis
The relationship between NDVI and different climatic factors is evaluated due to the possible correlation between meteorological factors. In order to explore the influence of climate factors on NDVI, the correlation between NDVI and average temperature and annual precipitation was calculated by using partial correlation analysis (Dastigerdi et al., 2024). The partial correlation coefficients are calculated as follows:
where r12, r13, and r23 are the correlation coefficients between vegetation NDVI and temperature, precipitation, and between temperature and precipitation, respectively (Long et al., 2010). r12·3 represents the partial correlation coefficient of vegetation NDVI and temperature. r13·2 represents the partial correlation coefficient between vegetation NDVI and precipitation (Geng et al., 2022).
2.3.3 Residual analysis
The contribution rates of different driving factors to vegetation growth were different. The effects of human activities and climate change on NDVI were analyzed by multiple linear regression residual analysis (Evans and Geerken, 2004). Multivariate regression residual was used to construct a binary linear regression model based on vegetation NDVI data and meteorological data (temperature and precipitation), and then the difference between remote sensing NDVI value (NDVIOBS) and forecast NDVI value (NDVICC) was used to represent the influence of human activities on the dynamic evolution of vegetation NDVI (NDVIHA) (Jin et al., 2020). To quantitatively separate the effects of climate change and human activities on vegetation cover change. The relevant formula is as follows:
where NDVICC and NDVIOBS refer to the NDVI predicted value based on regression model and the NDVI based on remote sensing image, respectively. Measurement value (dimensionless); a, b and c are model parameters; T and P refer to the average temperature and cumulative precipitation of the growing season, respectively. The units were °C and mm, respectively. NDVIHA is the residual.
2.3.4 Geographical detector
The geographic detection can analyze the influence of different independent variables on the spatial distribution pattern of specific dependent variables. It contains the following four detectors: factor detection, interaction detection, risk detection, and ecological detection.
Factor detector
A factor detector could determine the effect of detecting the spatial heterogeneity of vegetation change. The spatial heterogeneity of X to Y could be expressed as q × 100%, and the greater the number, the greater the influence of the detection factors on vegetation change (Deng et al., 2022), which is as follows:
where h is the vegetation change or detection factor hierarchy; N is the number of class h or total region units; and Y is the change in class h or total region Y value. and σ2 are the variances of NDVI in h and entire area, respectively. A large q indicates a better explanation of the spatial heterogeneity of X about NDVI and vice versa (Chen et al., 2020).
Interaction detector
Interaction detector was used to assess interaction between two factors. The q values of individual factors (q(X1) and q(X2)) were first calculated separately, and the value of two–factor interaction (q(X1∩X2)) was calculated (Wang and Xu, 2017; Shao et al., 2023). The results are defined by comparing the q value of individual factor and two–factor interaction as shown in Table 1.
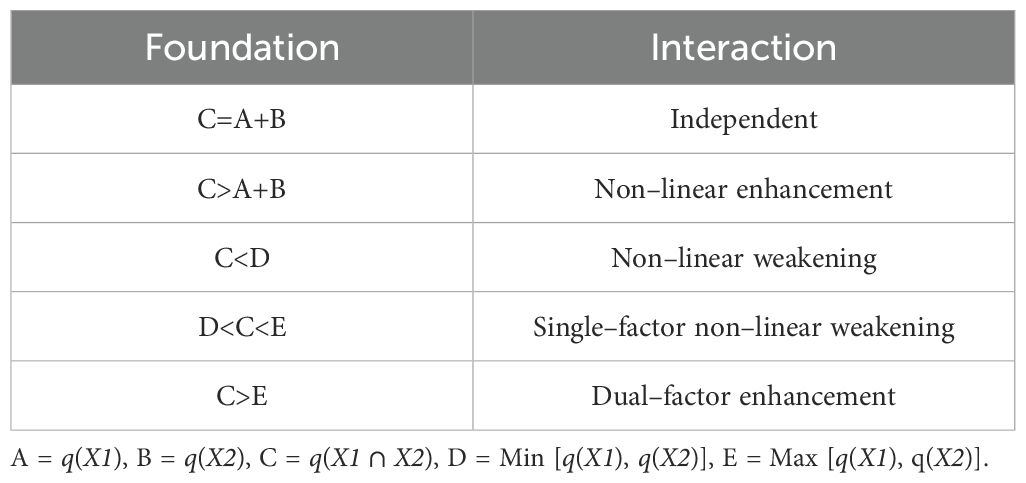
Table 1. Location of the study area.
3 Results
3.1 Features of NDVI spatial distribution
The annual average NDVI in the loess hilly area of western Henan was calculated for the period between 2000 and 2022. The spatial distribution of average NDVI in the study area is shown in Figure 2. The average annual NDVI ranged between –0.08 and 0.72 over the period 2000–2022, averaging 0.49. The NDVI in the study area presented a distinct spatial pattern: higher values in southwest and lower values in northeast, with obvious regional differences. Low NDVI values (mean <0.3) were observed in Yima, Mianchi, Shanzhou District, Xigong District of Luoyang, Jianxi District, and Shangjie District of Zhengzhou City. These densely populated areas, with a large scale and intensity of human activities, causing significant disturbance to natural vegetation, resulting in low vegetation coverage. High NDVI values were mainly distributed in the southern part of Luosi County, Luoning County and Song County, the western part of Lingbao City, and the northern part of Jiyuan City and Mianchi County. These areas, characterized by steep slopes and extensive forests and grasslands, serve as key zones for soil erosion prevention and control. There soil and water conservation capacity has been significantly enhanced, with notably high vegetation coverage.
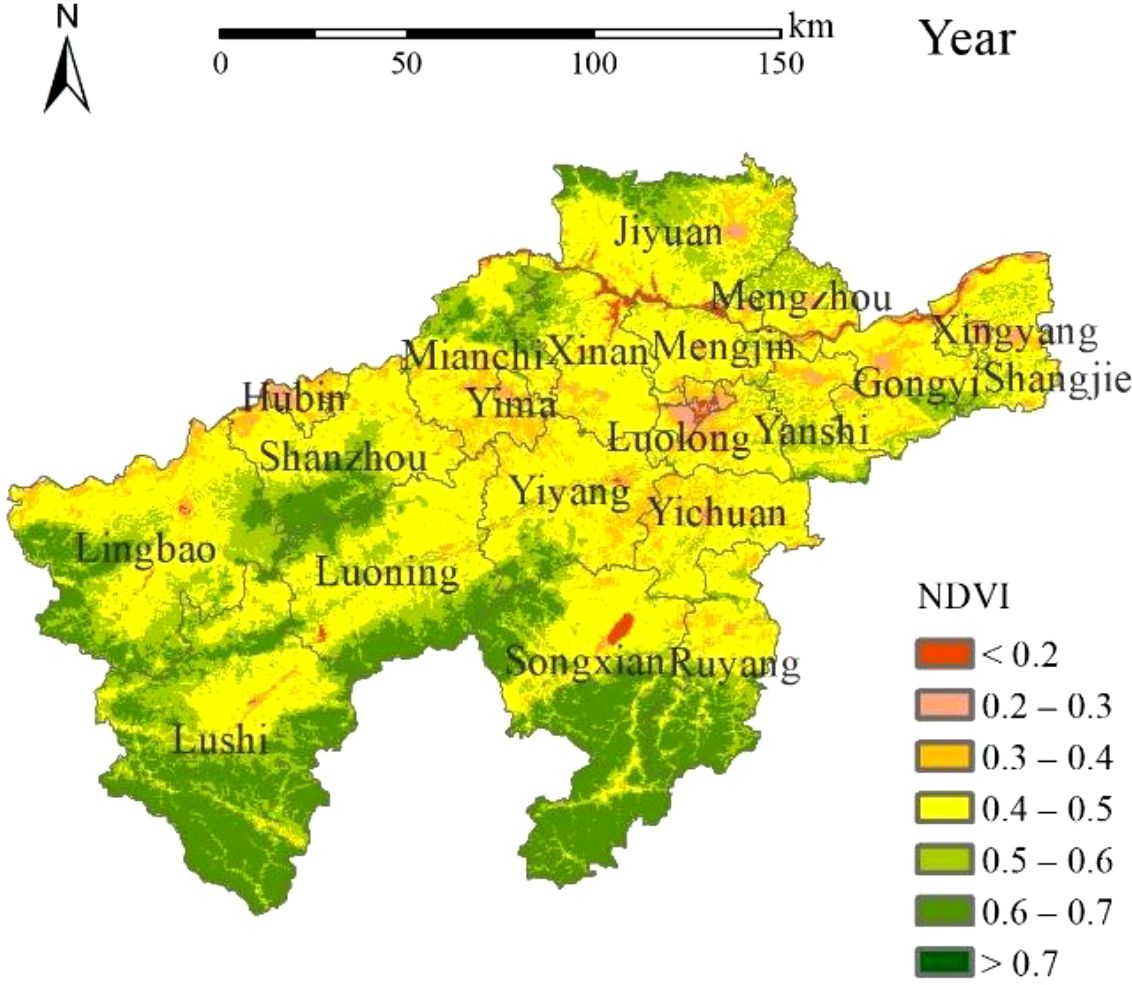
Figure 2. Spatial distribution of annual average NDVI from 2000 to 2022 in the study area.
The seasonal difference of loess hilly area in western Henan is significant. During the study period, NDVI in summer (June, July and Aug.) was the highest at 0.65, followed by NDVI in autumn (Sept., Oct., and Nov.) and spring (March, April and May) at 0.53 and 0.49, respectively, and NDVI in winter (Dec., January, Feb.) was the lowest at 0.28 (Figure 3). NDVI was highest in the western and southern parts of the study area due to the larger area of forest land, grass land and less human activities. The NDVI of the whole study area was generally lower in winter, while it was higher in summer.
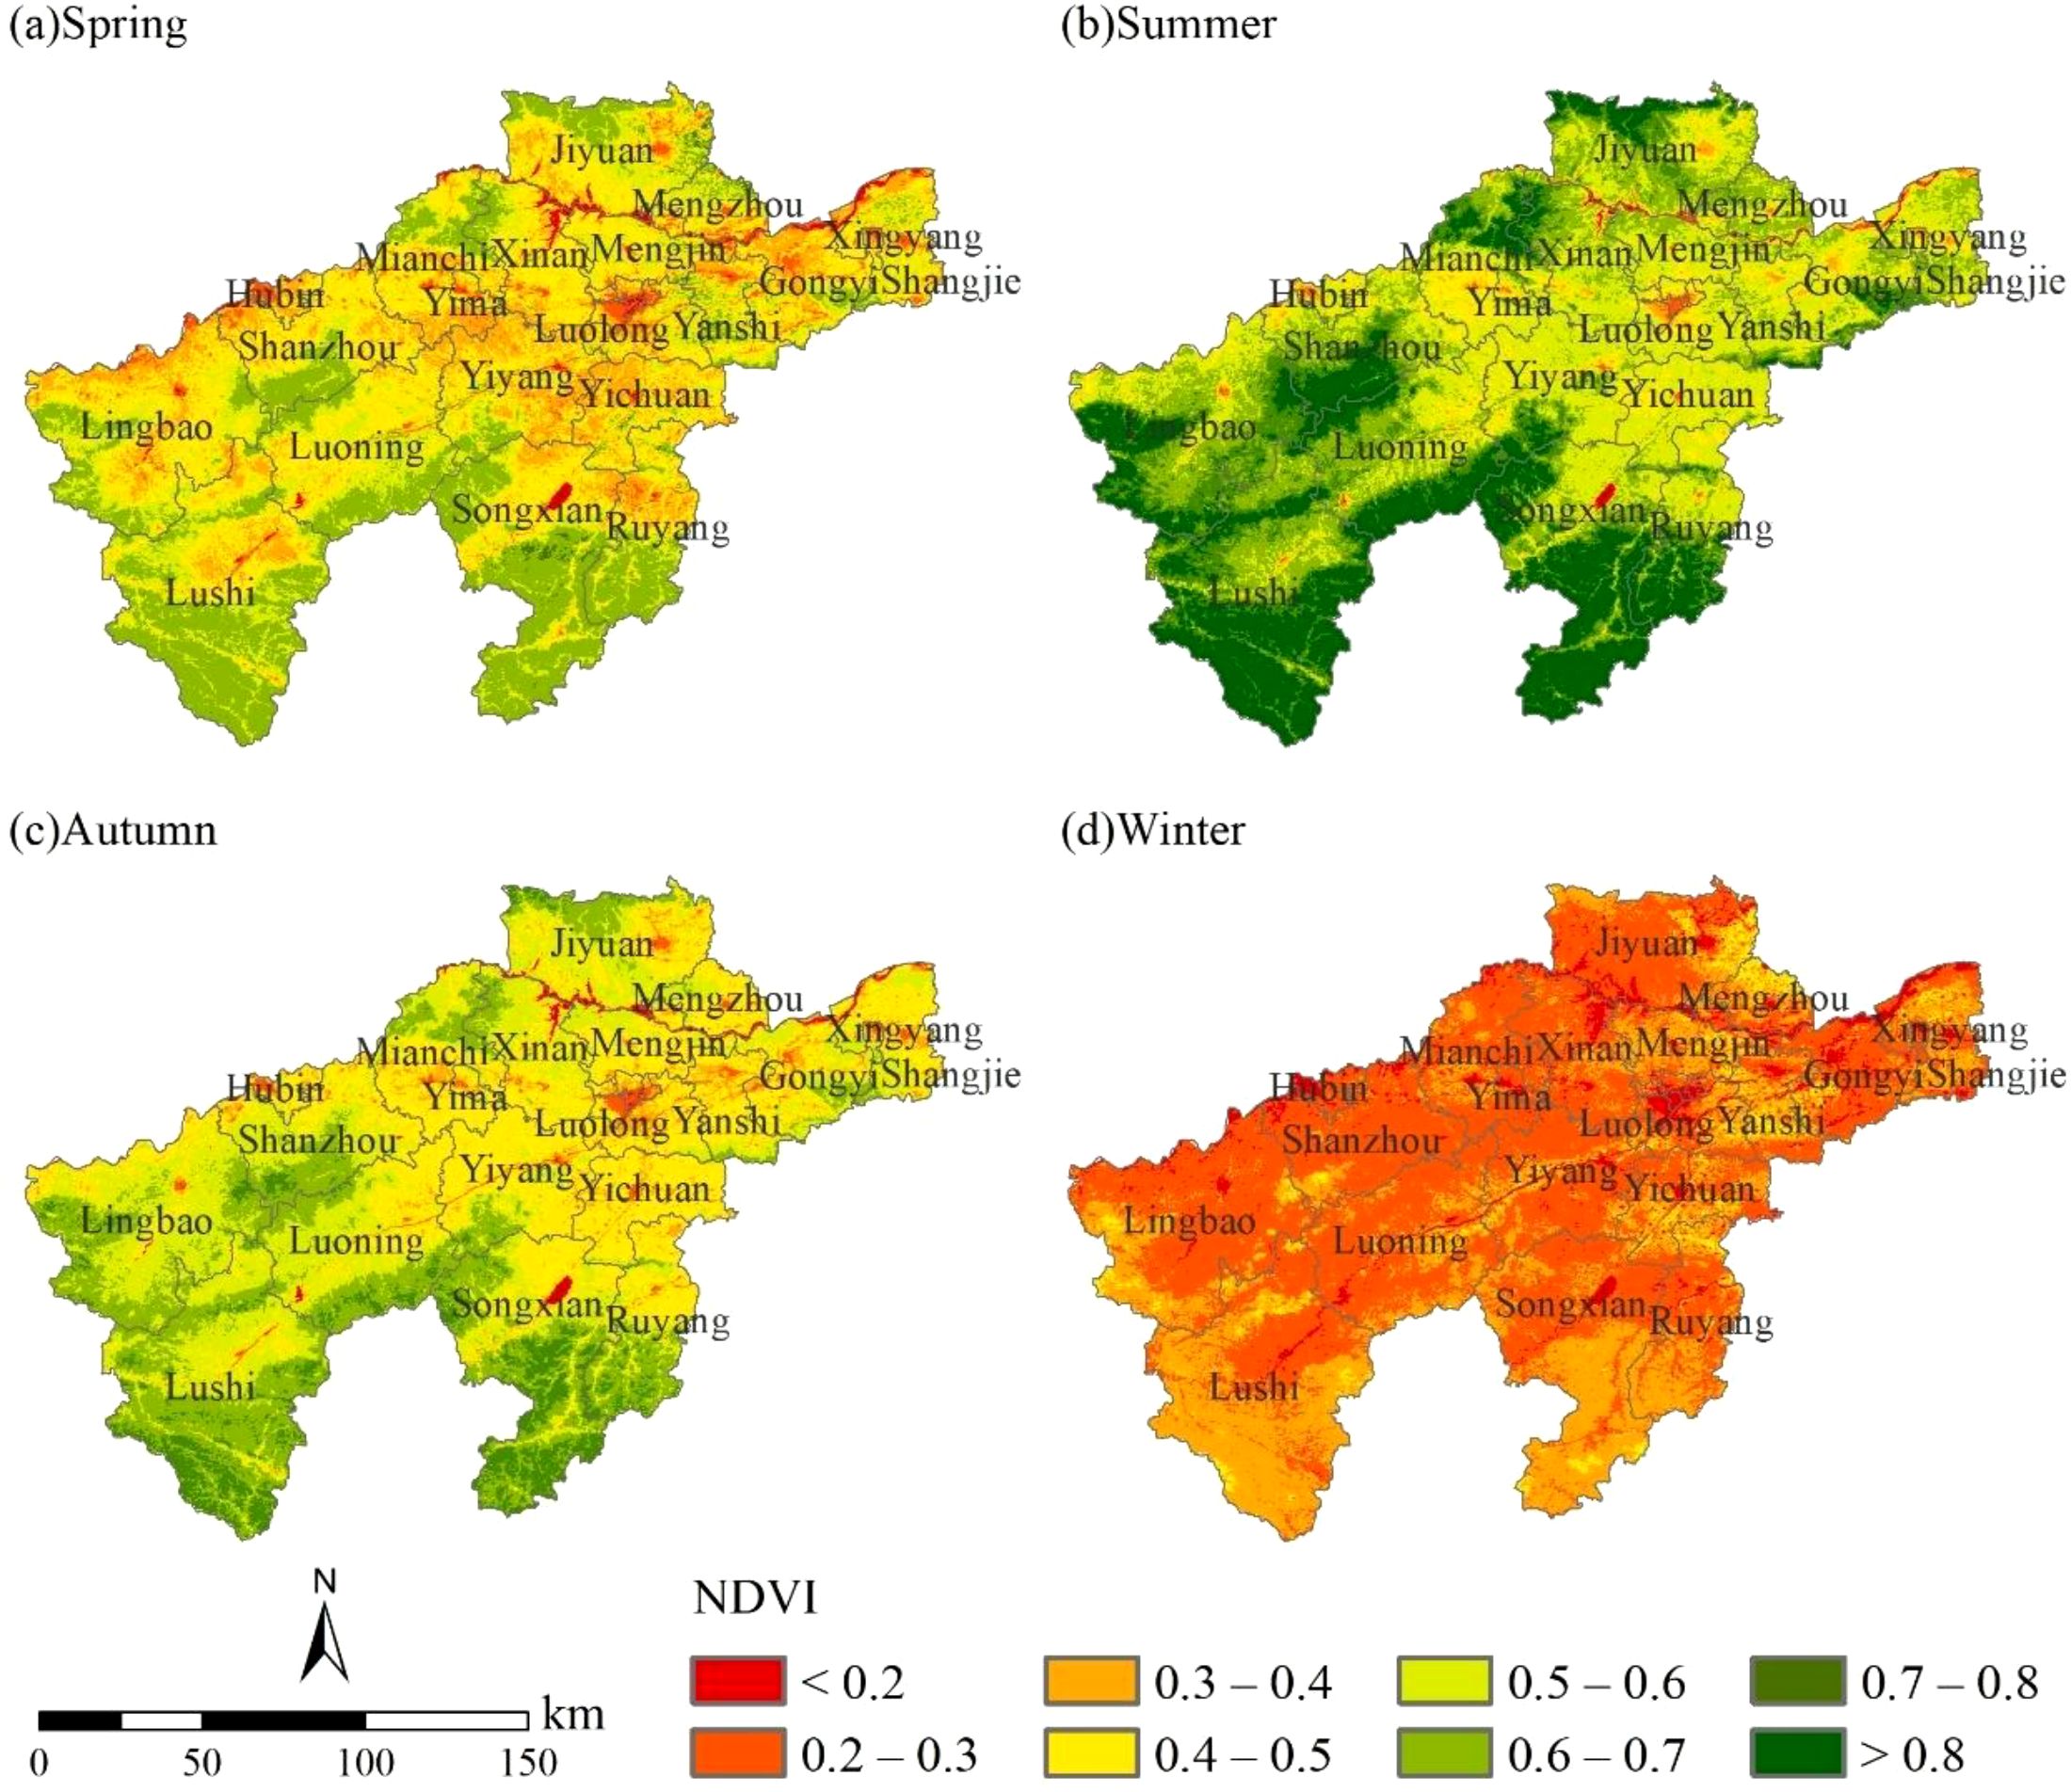
Figure 3. Spatial distribution of spring (a), summer (b), autumn (c), winter (d) average NDVI from 2000 to 2022 in the study area.
In spring, low NDVI values were mainly concentrated in Hubin County, Yima, Luolong District of Luoyang, Yiyang County, Gongyi City, Xingyang City, and more than half of the area had NDVI value lower than 0.3 (Figure 3a). In these regions, spring drought and water shortage lead to slow plant growth. Compounded by heavy water consumption from the large local population, inadequate water storage in groundwater, rivers and lakes collectively contribute to low vegetation coverage. In summer, although low NDVI values were primarily observed in Luolong District of Luoyang, Hubin County, Xingyang City, overall vegetation vigor improved with increased summer moisture, showing noticeable recovery compared to spring conditions (Figure 3b). High NDVI values appeared in Lingbao City, Lushi County, Ruyang County and Shanzhou District, and the value is basically above 0.7. NDVI values in these areas increased significantly due to three key factors: hilly topography, extensive woodland coverage, and adequate summer moisture-heat conditions, which collectively promoted high vegetation coverage. In autumn, low NDVI values were observed in Luolong District of Luoyang, Hubin District, Xingyang City, Yanshi and Gongyi City, mirroring their spring vegetation patterns (Figure 3c). In these areas, plants grow vigorously during summer while retaining partial foliage in autumn. Although vegetation coverage improves compared to spring levels, the high population density results in extensive built-up areas, consequently limiting the vegetated space. In the western and southern hilly areas, the vegetation coverage is still high due to extensive woodland, shrubs and grassland. In winter, NDVI values generally remain below 0.4, with particularly low values (<0.3) observed in Hubin County, Mianchi County, Luolong District of Luoyang, Gongyi City and Xingyang City (Figure 3d). The vegetation coverage in southern areas such as Ruyang County, Song County, Lushi County is relatively high.
3.2 Annual variation of NDVI in loess hilly area of western Henan Province
This study investigates the temporal variation characteristics of NDVI in the loess hilly area of western Henan Province, presenting time-series trend charts derived from monthly and annual NDVI data from 2000 to 2022 (Figure 4). The monthly NDVI values ranged from 0.26 to 0.72, with a mean of 0.49 and a standard deviation of 0.16. The planting of double-cropping systems in study area led to a weakly bimodal pattern of NDVI in a year, featuring the primary peak in August (about 0.72), the secondary peak in June (about 0.58), and the annual minimum in January (about 0.26) (Figure 4a). The rapid NDVI increase observed from February to April primarily results from spring vegetation phenology, including tree budburst and the growth of winter wheat and rapeseed crops. Affected by the harvest of winter wheat from May to June, the NDVI remained basically unchanged during this period. From June to August, NDVI increased again, peaking in August due to favorable summer hydrothermal conditions that enhanced vegetation productivity. From September to December, NDVI displayed a rapid decline due to the gradual maturing of crops in September and October, the falling of leaves of most crops, and the reduced vegetation coverage. The vegetation type in the study area is mainly deciduous broad–leaved. Therefore, vegetation coverage decreased rapidly in winter, and reached its lowest level in January of the next year.
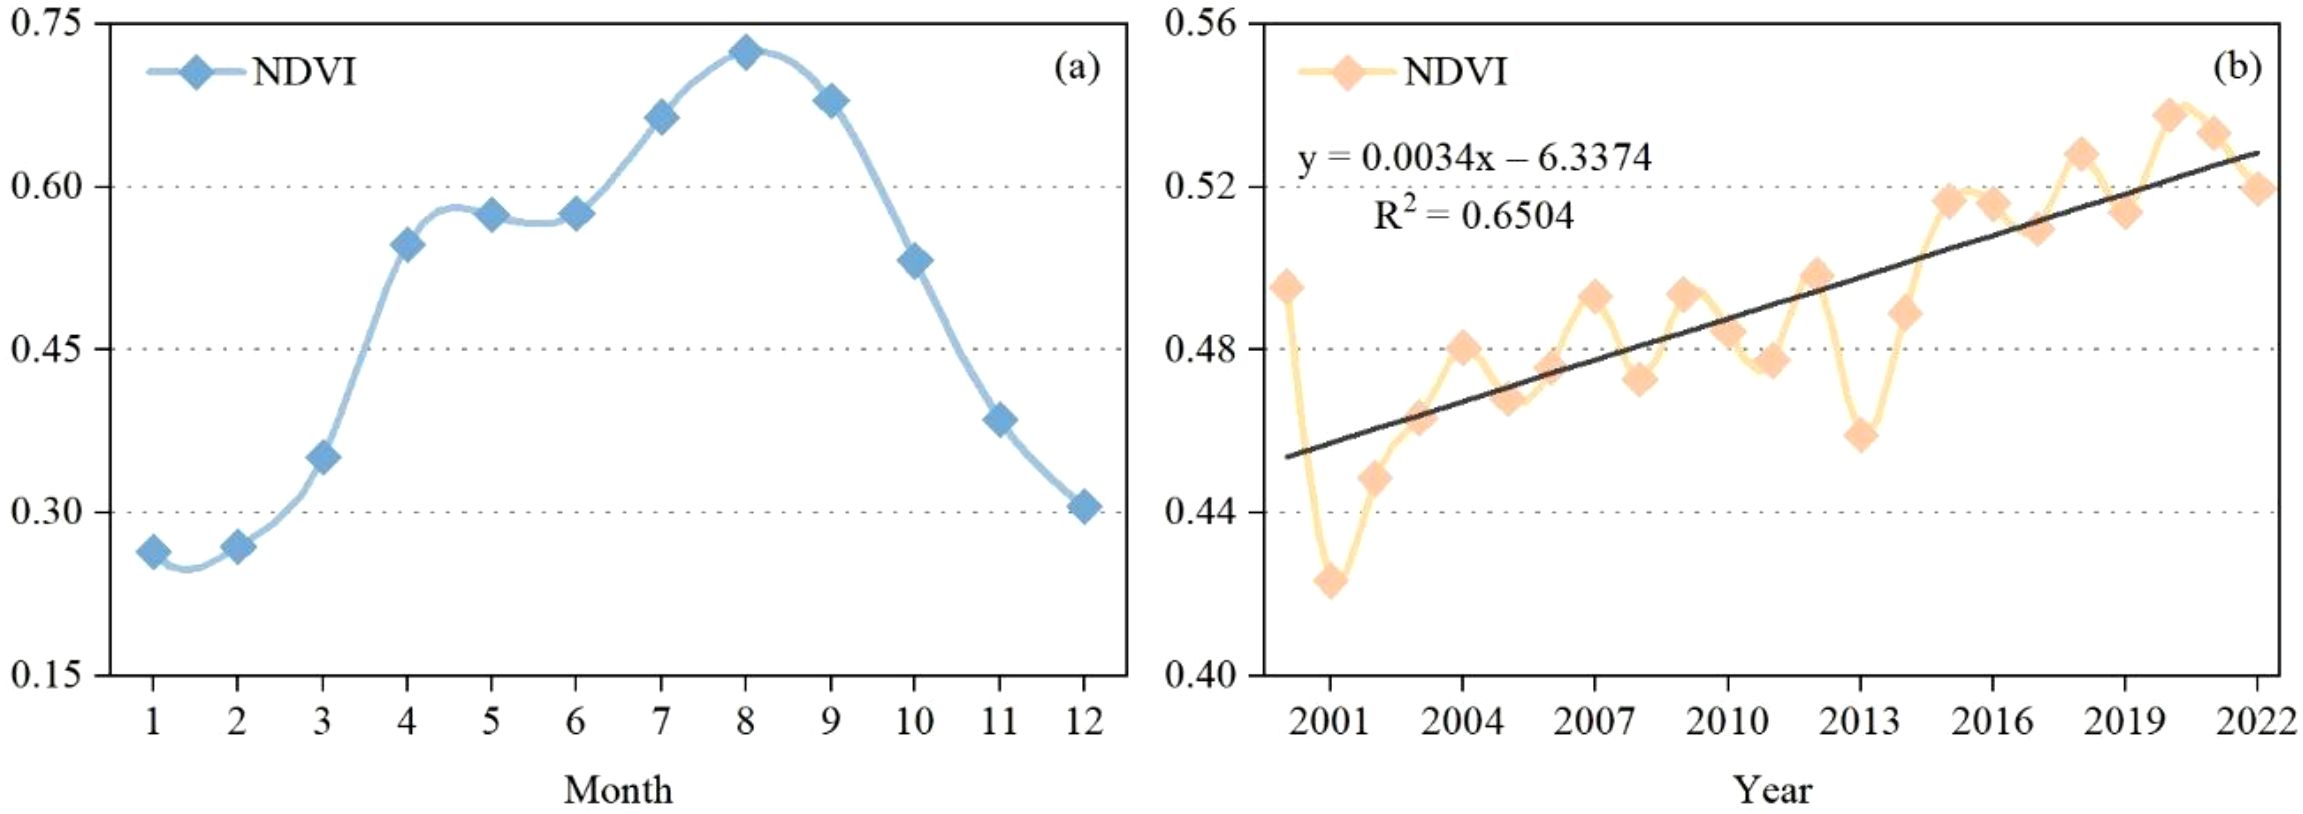
Figure 4. Monthly variation of NDVI in study area from 2000 to 2022 (a) and annual variation of NDVI in study area from 2000 to 2022 (b).
The annual variation of NDVI in the loess hilly area of western Henan, varied between 0.42 and 0.54, exhibiting a mean value of 0.49 with a standard deviation of 0.03. In the past 23 years, the annual NDVI fluctuated obviously, but the overall trend was upward (Figure 4b). The annual maximum value NDVI peaked in 2020 while hitting their lowest recorded level in 2001. During the study period, the fluctuation amplitude of NDVI showed a decreasing trend, suggesting progressive improvement in regional vegetation growth conditions. The NDVI in the study area was highest in summer, followed by autumn and spring, and lowest in winter (Figure 5). NDVI showed an increasing trend in all seasons, with slightly higher growth in summer and spring than in autumn and winter.
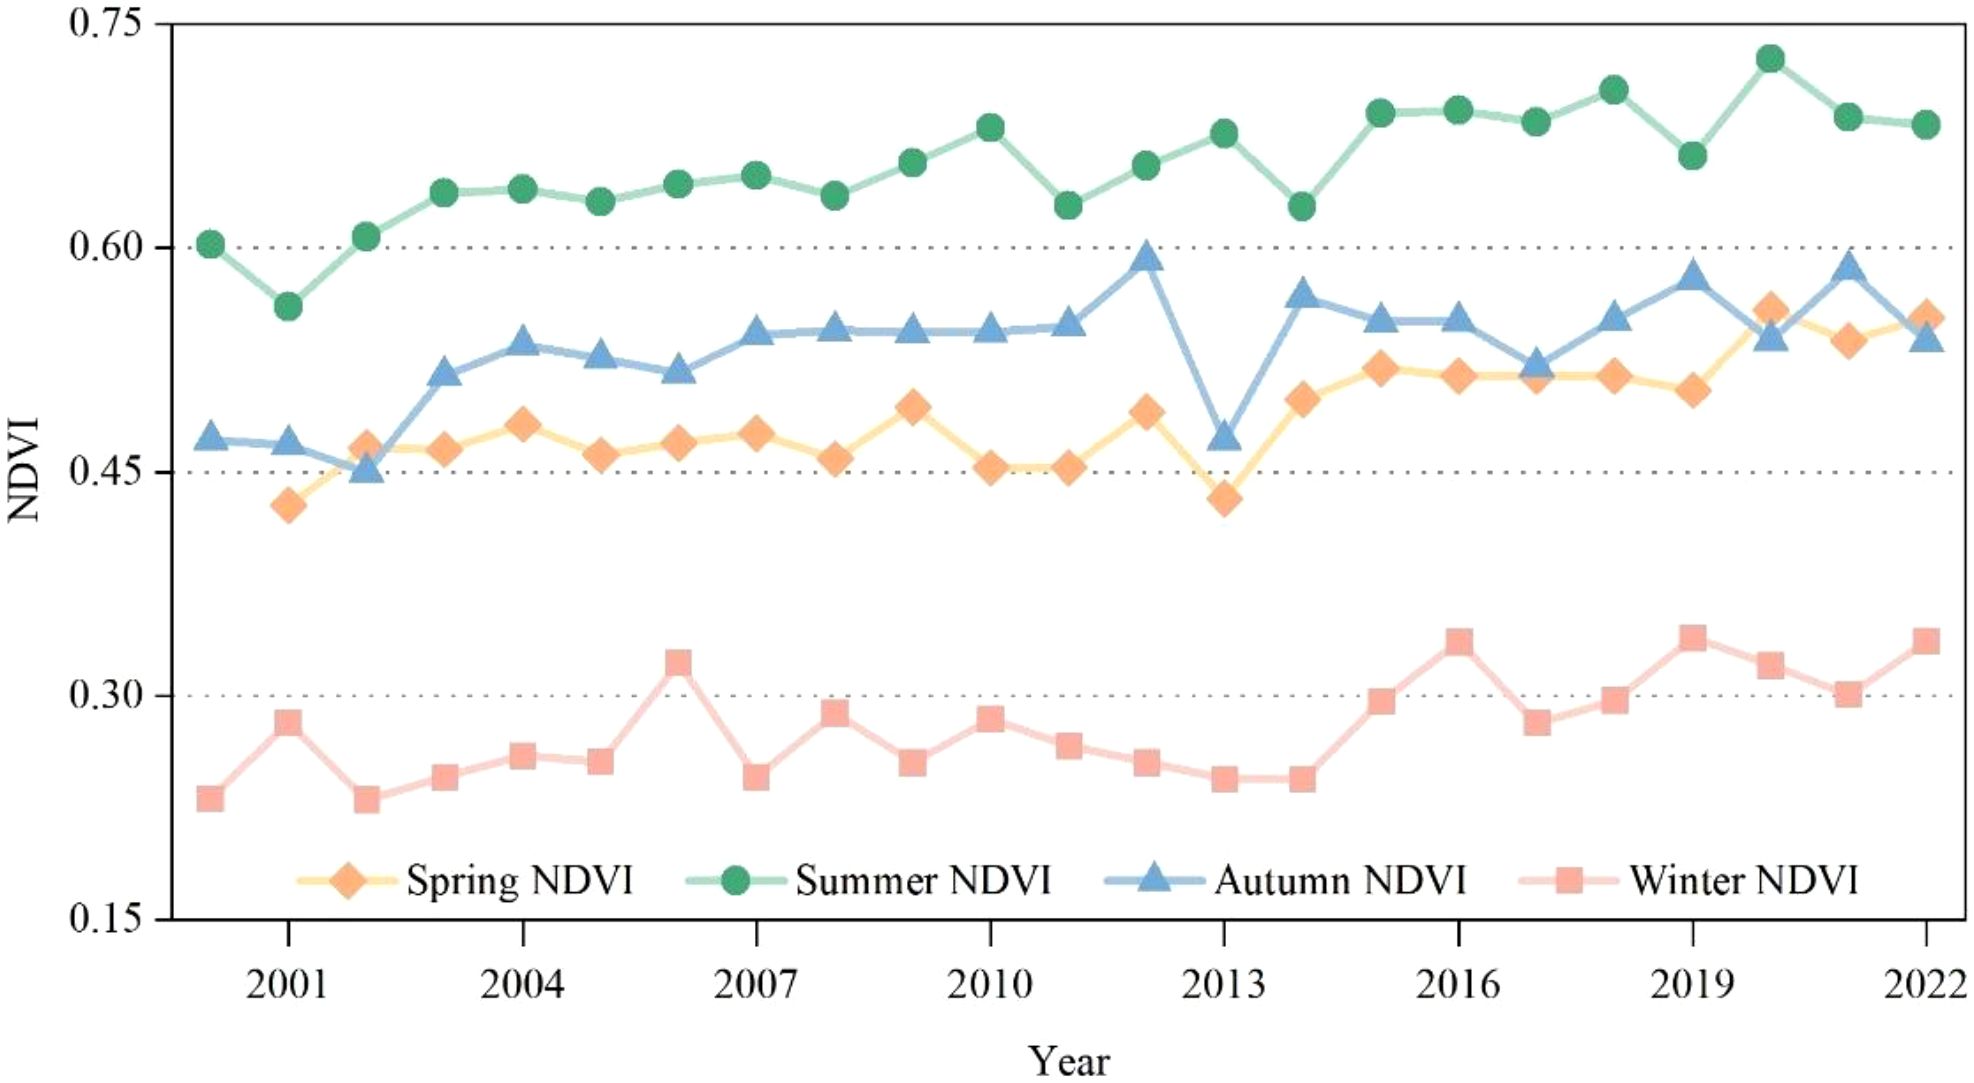
Figure 5. Seasonal variation of NDVI in study area from 2000 to 2022.
3.3 Spatial variation trend of NDVI in loess hilly area of western Henan Province
The study quantitatively analyzed the spatial variation trends of NDVI in the study area. Based on the combination of Theil–Sen Median trend analysis and Mann–Kendall test results, the pixel–scale data of NDVI change trend is obtained. NDVI changes were divided into 6 types: extremely significant increase, significant increase, insignificant increase, insignificant decrease, significant decrease and extremely significant decrease. The average slope value of annual NDVI change is greater than 0, which indicates that annual NDVI in the study area presents a positive trend from 2000 to 2022 (Figure 6a). The areas of extremely significant increase and significant increase accounted for 68.8% and 8.7%, respectively, mainly distributed in the west, south and north of the study area at Lu Shi County, south of Lingbao City, Luoning County, Mianchi County and Xinan City (Figure 6b). The non–significant increase area is distributed in the central of the study area at Yichuan County and Luolong District and the eastern sector at Xingyang City and Gongyi City, accounting for 12.3% of the total area. The proportion of vegetation decrease area in the total area is small, with extremely significant decrease and significant decrease areas accounting for 3.2% and 1.2% respectively. The vegetation degradation is more severe in Luoyang, Mengjin County, Gongyi City, northern of Lingbao City, Shangjie District, Xingyang City and Yiyang County.
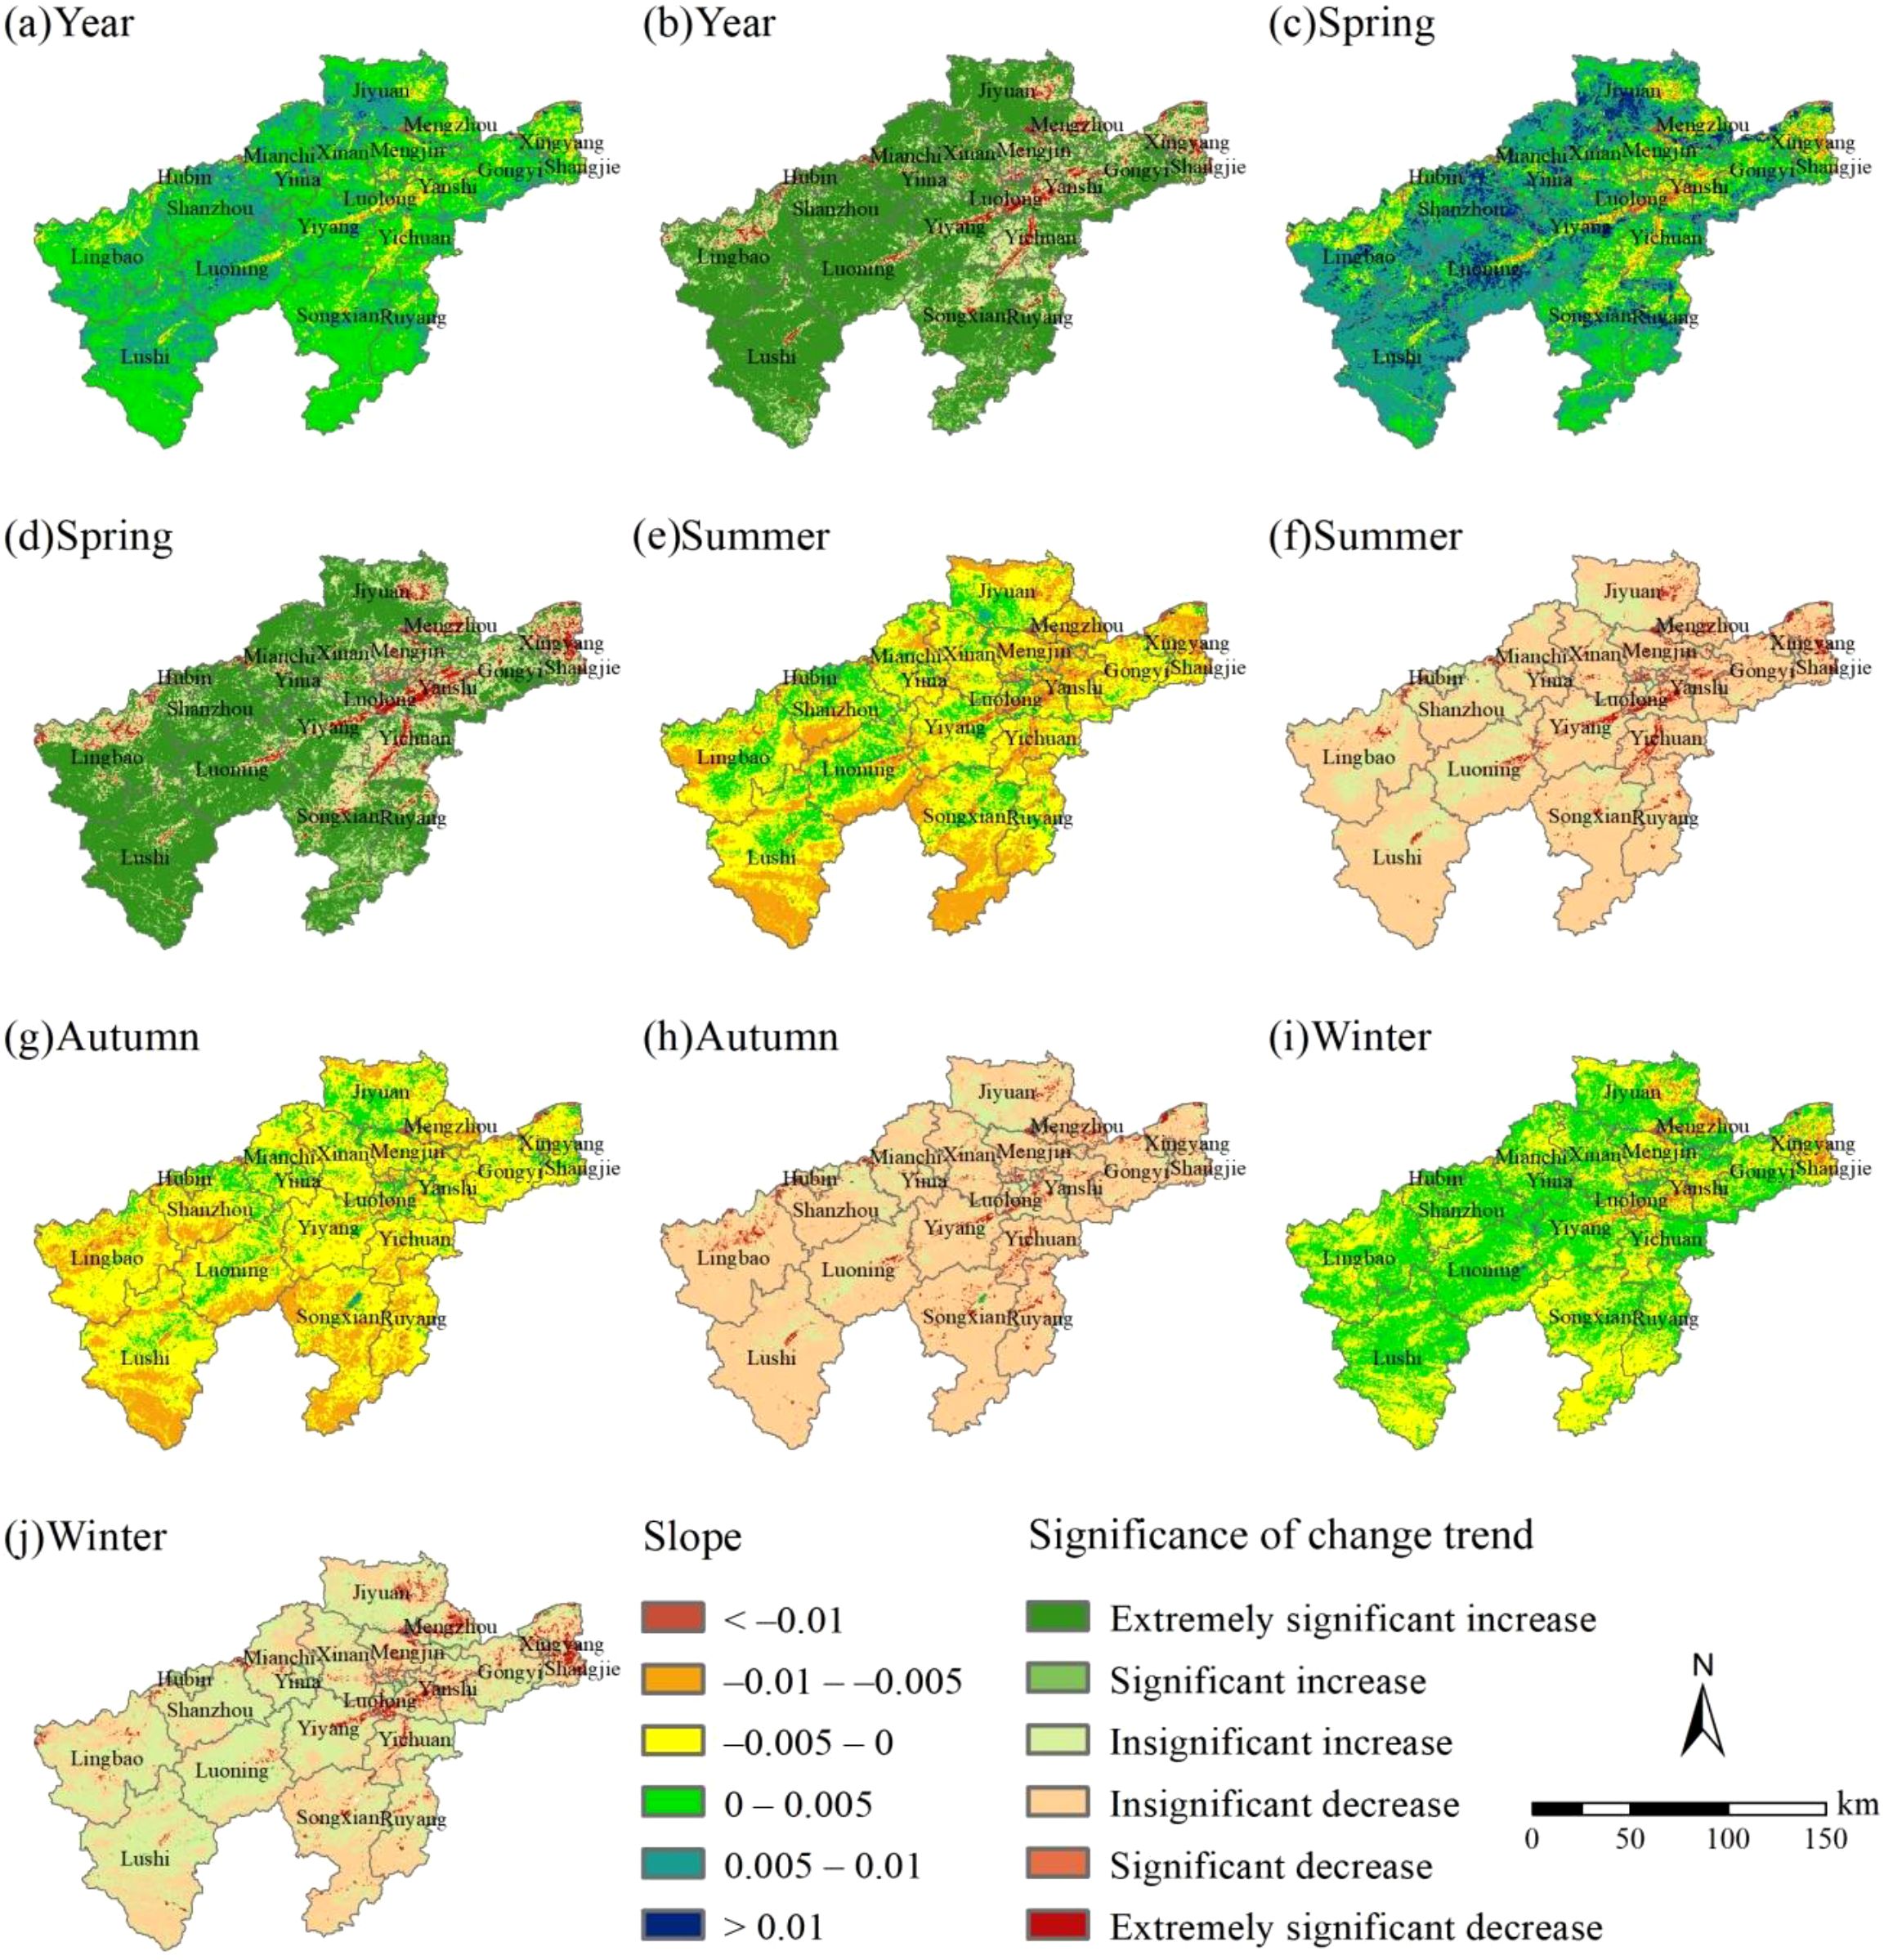
Figure 6. Spatial distribution of NDVI change trend of year (a), spring (c), summer (e), autumn (g), winter (i) and significance of NDVI change trend of year (b), spring (d), summer (f), autumn (h), winter (j) from 2000 to 2022.
The average slope value of NDVI change in spring is greater than 0, which indicates that NDVI in spring presents a positive trend from 2000 to 2022 (Figure 6c). The areas of extremely significant increase 61.4%, which is mainly distributed in the western, southern and northern of the study area at Lu Shi County, south of Lingbao City, Luoning County, Mianchi County, north of Xinan City (Figure 6d). Significantly increased areas (9.6% coverage) are concentrated in southern of Song and Ruyang County, central of the study area, and north of Jiyuan City. The proportion of extremely significant decrease and significant decrease area are 4.0% and 1.7%, respectively. The areas of vegetation degradation are mainly distributed in the northeast of the study area Luoyang, Mengjin County, Gongyi City, northern of Lingbao City, Shangjie District, Xingyang City, Mengzhou City and Yiyang County. Besides, in the northern part of Lingbao City, the vegetation degradation in spring is also more serious. The average slope values of NDVI change in summer (Figure 6e), autumn (Figure 6g) and winter (Figure 6i) all less than 0, which indicate that NDVI in summer, autumn and winter present the negative trends from 2000 to 2022. In terms of spatial distribution, vegetation coverage exhibits declining trends across most the study area during both summer and autumn (Figures 6f, h, j). However, the overall vegetation improvement observed from 2000 to 2022 is primarily driven by significant spring vegetation recovery, which compensates for the seasonal declines.
3.4 Analysis of influencing factors on vegetation NDVI changes in loess hilly area of western Henan Province
3.4.1 Effects of climatic factors on vegetation NDVI
Heat and moisture are pivotal ecological factors that influence the growth processes of plants. Adequate precipitation and temperature are conducive to the rapid growth of vegetation. To explore the correlation between temperature, precipitation, and NDVI, this paper implemented a partial correlation analysis method to conduct a pixel scale analysis of NDVI in relation to these two climatic variables. The results revealed distinct spatial patterns in how temperature and precipitation influence vegetation. As shown in Figure 7a, the partial correlation coefficient between temperature and vegetation NDVI ranges from –0.75 to 0.85, with the average of 0.19. Temperature-NDVI correlations showed spatial predominance of positive relationships (85.02% coverage), with negative correlations occupying only 14.97% of the study area. In terms of spatial distribution, the positive correlation between NDVI and temperature was mainly distributed in the west (south of Lingbao City and southeast of Lusi County), northeast (Jiyuan City and Mengzhou City) and south (Song County and Ruyang County) of the study area. The regions with negative correlation between NDVI and temperature were concentrated in the middle (middle of Yiyang County), the east (Shangjie District) and the southwest (southwest of Lushi County) of the study area. Partial correlation analysis revealed that areas exhibiting statistically significant positive NDVI-temperature relationships (extremely significant and significant levels combined) covered 9.66% of the study region. The areas with extremely significant negative correlation and significant negative correlation accounted for 0.32%, while the areas with insignificant positive correlation and non–significant negative correlation accounted for 75.35% and 14.67%, respectively (Figure 7b).
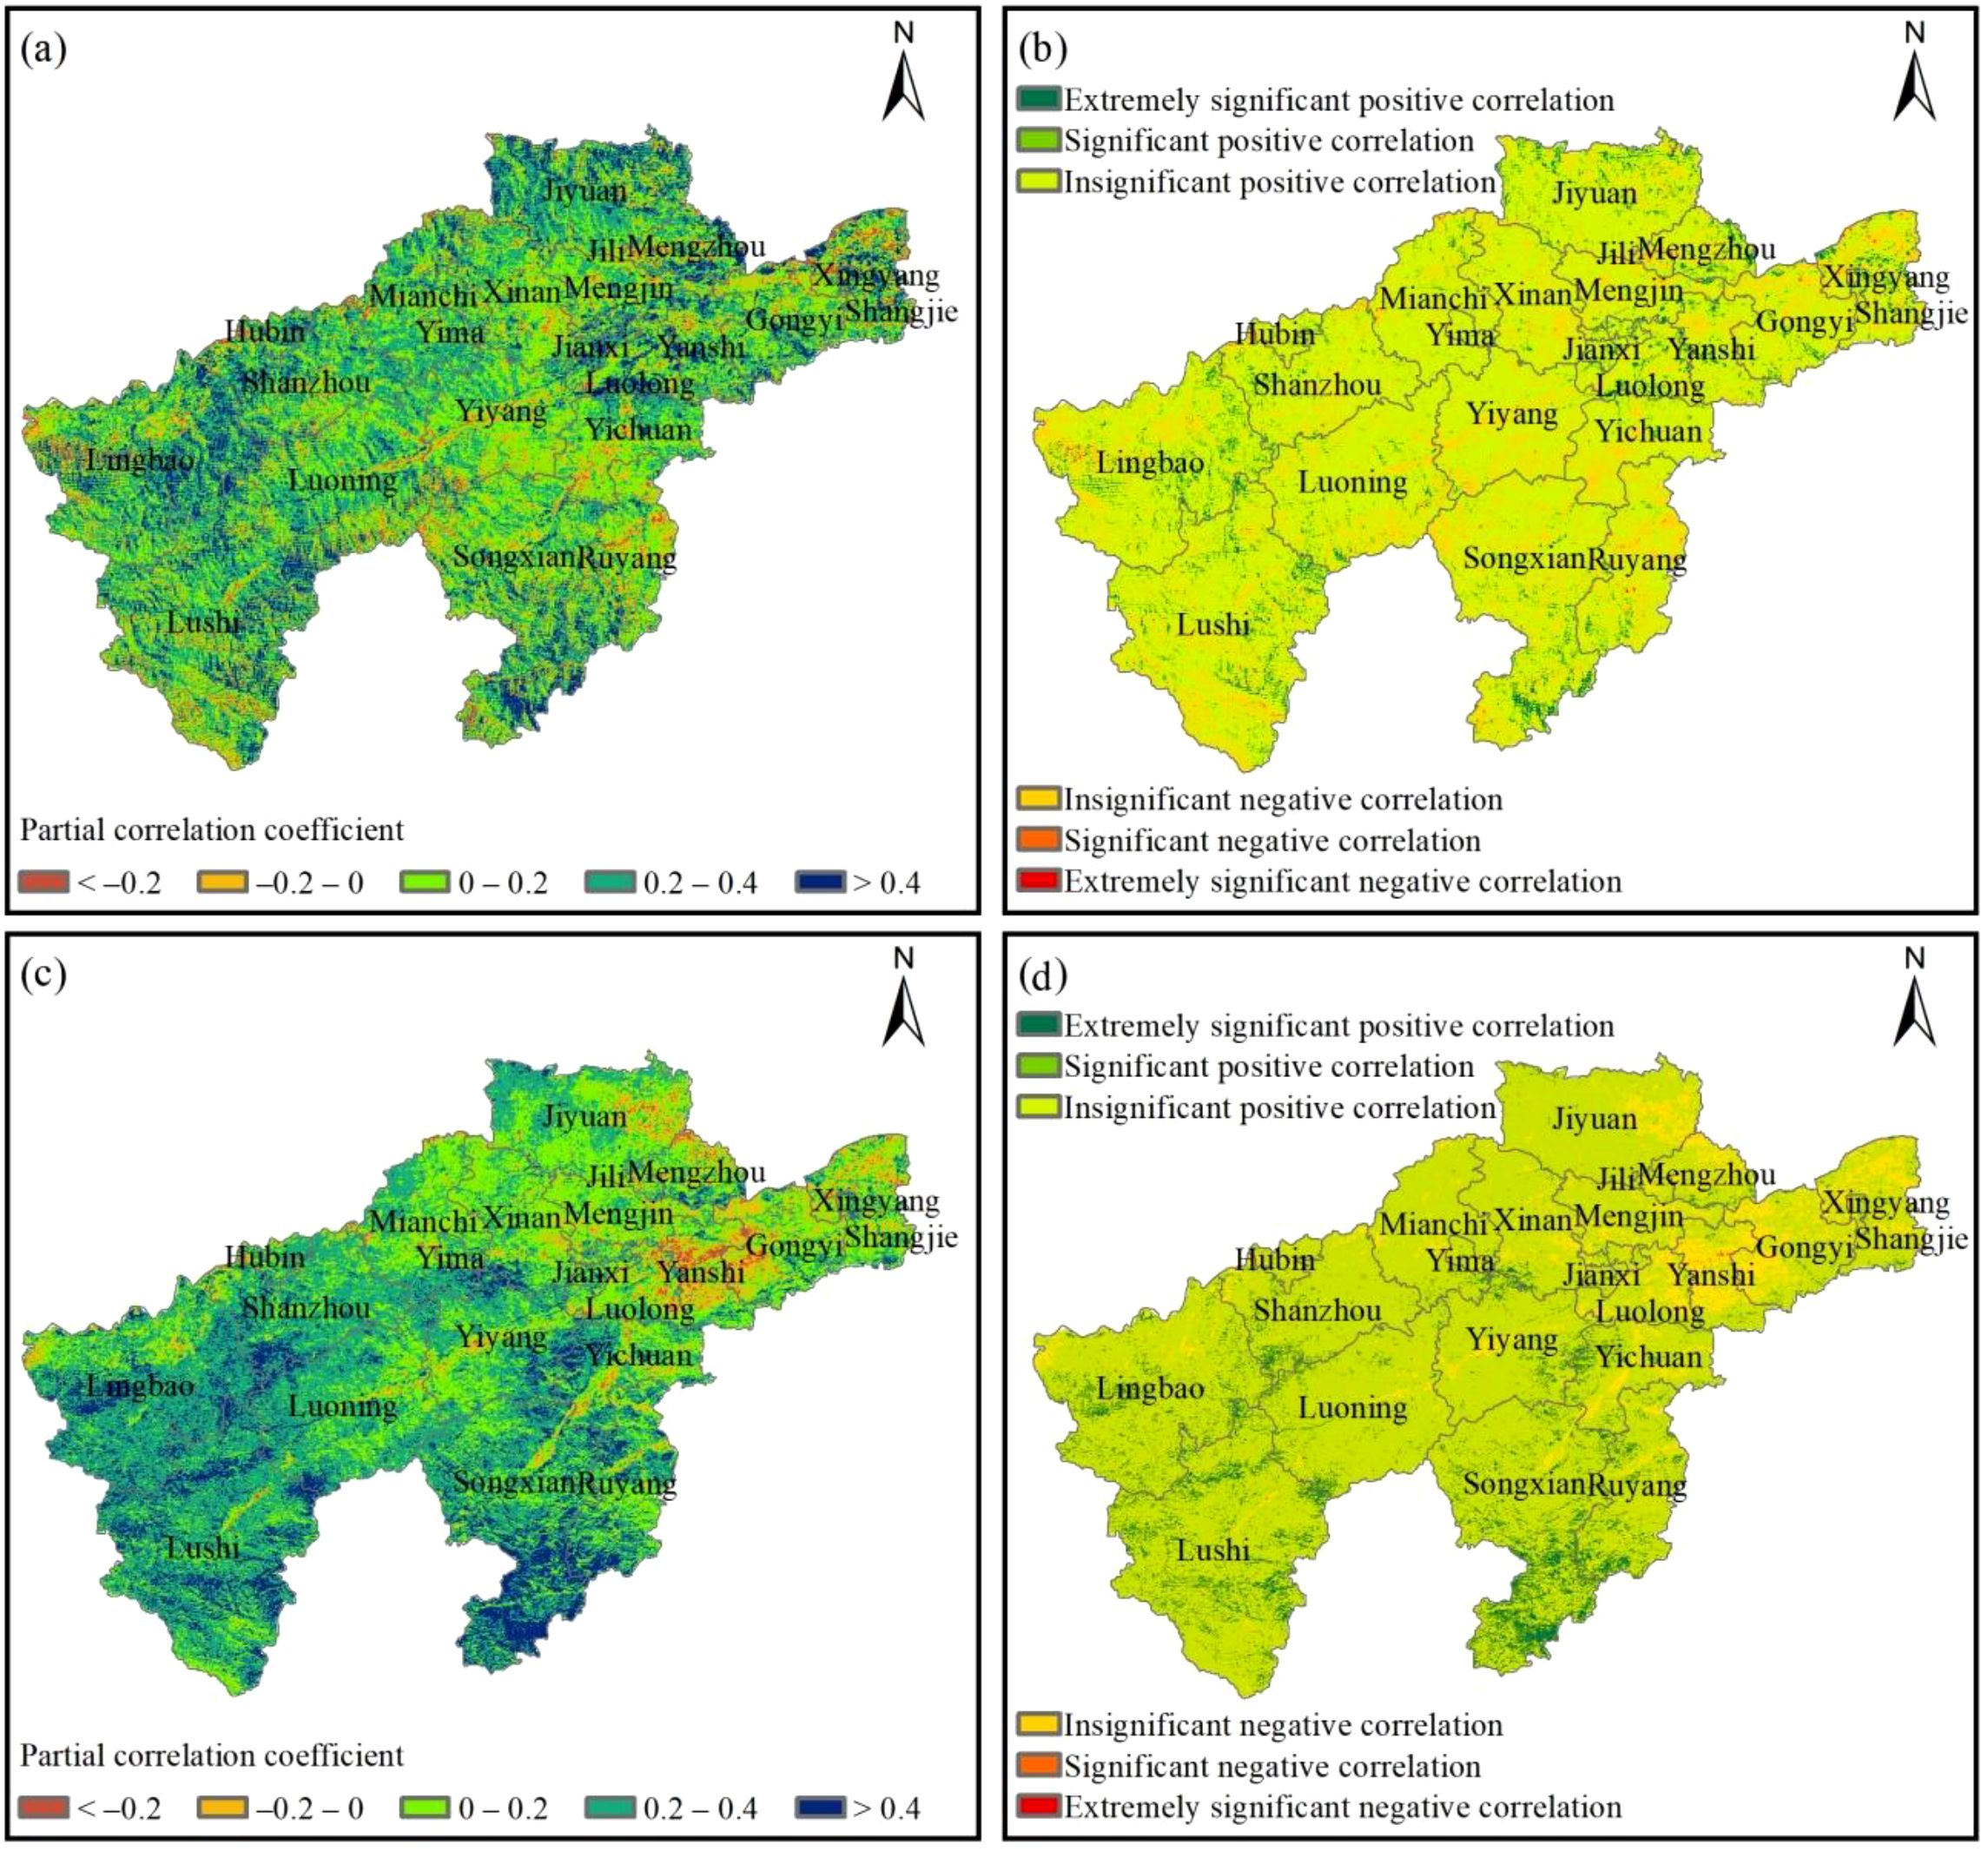
Figure 7. Spatial distribution characteristics of partial correlation between NDVI and temperature (a), and the significant map of partial correlation (b), partial correlation between NDVI and precipitation (c), and the significant map of partial correlation (d).
The partial correlation coefficient between NDVI and precipitation in the loess hilly region of western Henan Province fluctuates between –0.70 and 0.82, with an average value of 0.23. NDVI exhibited a predominantly positive correlation with precipitation, accounting for 91.63% of the total study area (Figure 7c). This positive correlation was predominantly concentrated in the central regions of the study area, including Yiyang County, Shanzhou District, and Song County, as well as in the western regions such as Lushi County and Lingbao City. Vegetation growth showed a significant positive response to precipitation in these areas. Conversely, The negative correlation areas constitute 8.37% of the total area, primarily located in the northeastern part of the study region, including Luoyang City, Gongyi City, and Mengzhou City. Areas exhibiting an extremely significant positive correlation and a significant positive correlation between NDVI and precipitation account for 10.41% of the total study area. Regions displaying an extremely significant negative correlation and a significant negative correlation constituted 0.05% of the total area. The largest proportion of the study area was characterized by insignificant positive correlations and insignificant negative correlations, collectively accounting for 89.54% of the total area (Figure 7d).
3.4.2 Effects of human activities on vegetation NDVI
Based on the residual analysis of each pixel, a trend and significance analysis was conducted on the time series of residual values from 2000 to 2022 to characterize the impact of human activities on NDVI over the 23–year period. From 2000 to 2022, the area of pixels with positive NDVI residual trends in the loess hilly region of western Henan accounted for 86.96% of the total area (Figure 8a), of which the extremely significant and significant portions accounted for 73.19% and 10.08%, respectively. These areas were primarily distributed in the southwestern part of Jiyuan City, Mianchi County, Luoning County, Lushi County, Song County, and the southern parts of Ruyang County (Figure 8b). The area of pixels with negative NDVI residual trends accounted for 13.04% of the total area. Regions exhibiting negative residuals were predominantly located in Shangjie District, Gongyi City, Luolong District and Yichuan County. Overall, the changes in NDVI were influenced by the dual effects of human activities, with positive impacts playing a dominant role. Ecological conservation measures have demonstrated significant effectiveness across most regions, substantially enhancing vegetation coverage through targeted implementation. Meanwhile, rapid economic development has driven irrational anthropogenic exploitation, significantly suppressing vegetation growth in localized areas.
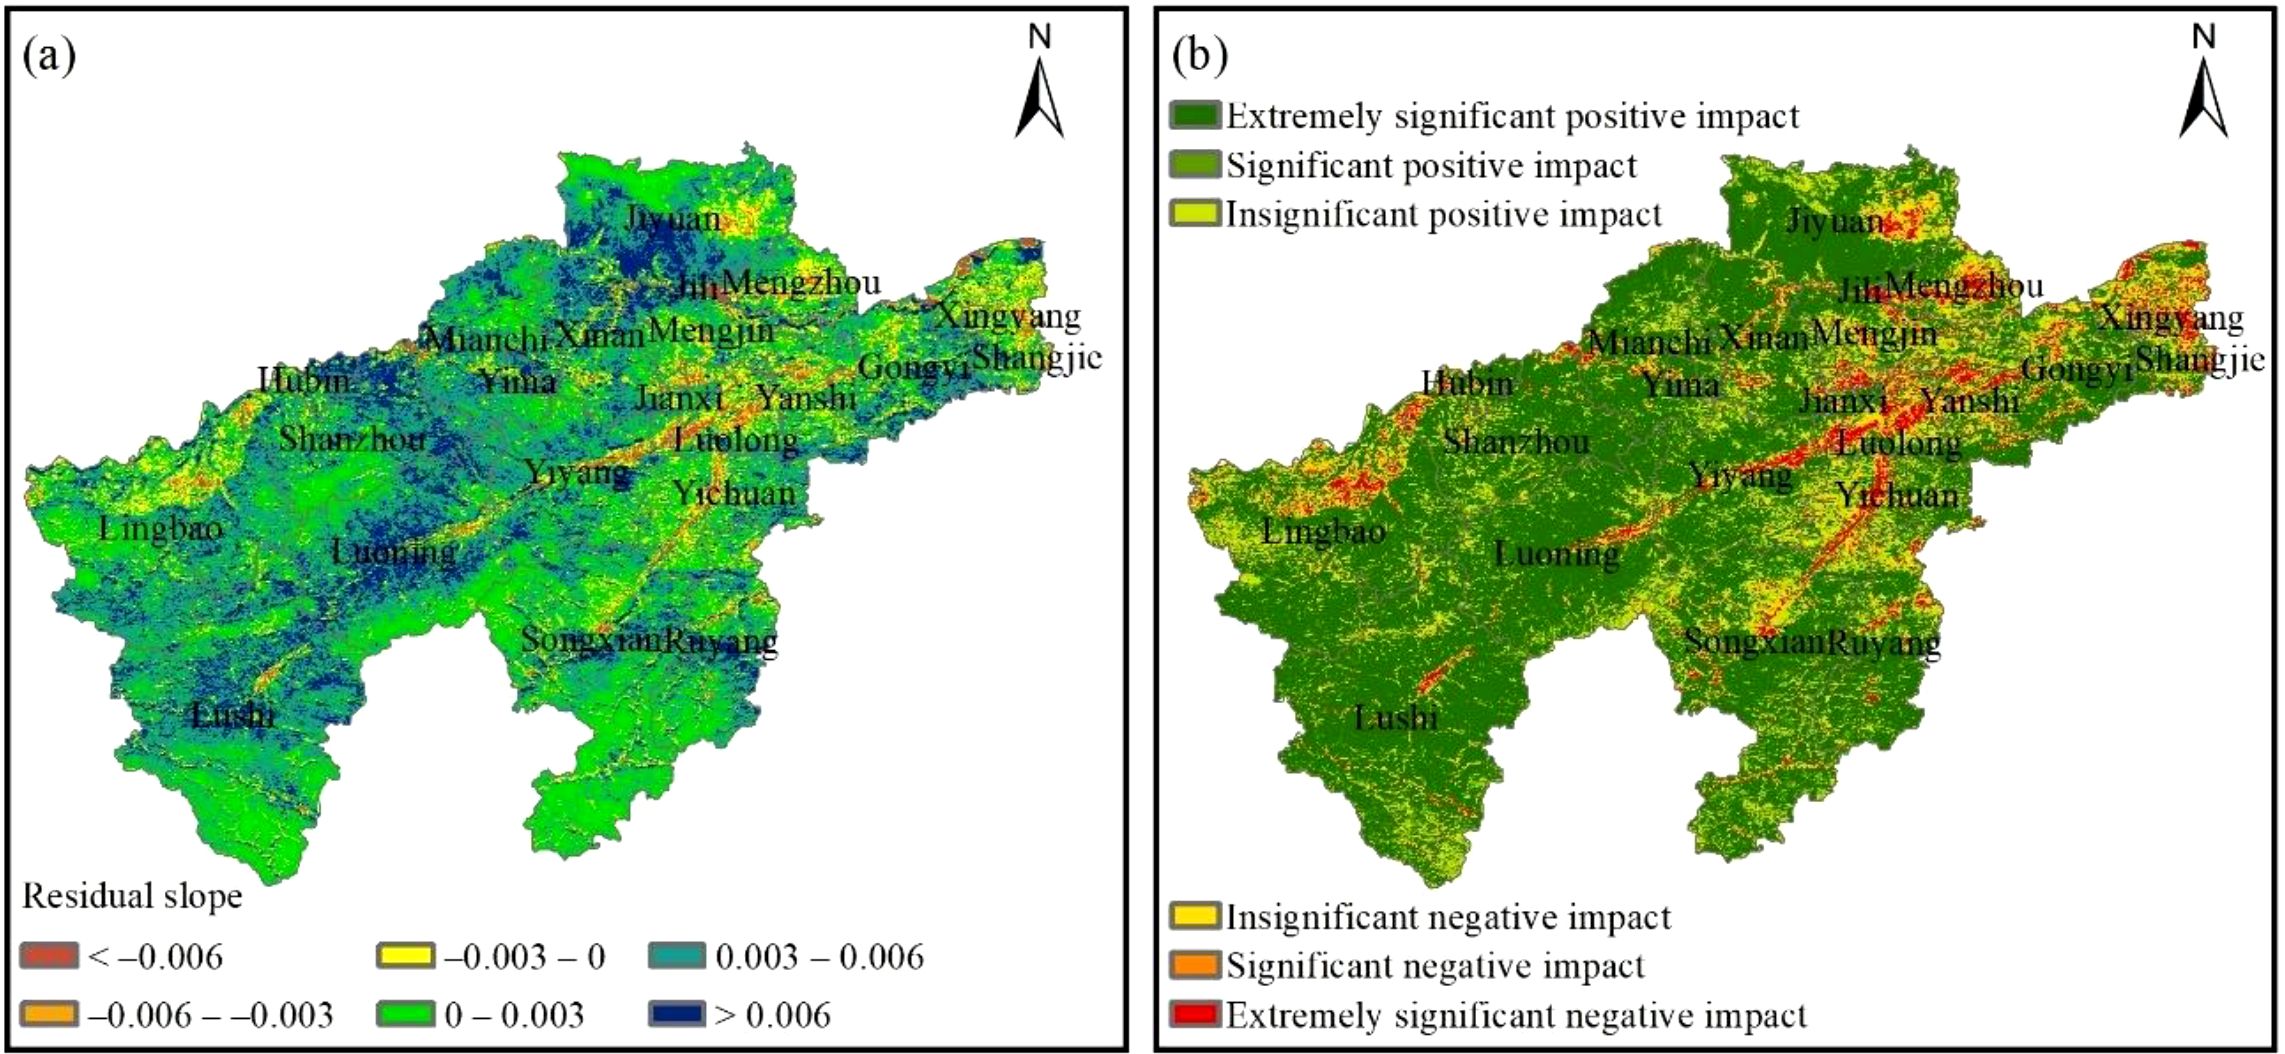
Figure 8. NDVI residual trend (a) and significance test (b) of spatial distribution from 2000 to 2022.
3.4.3 Relative contribution of climate change and human activities to vegetation coverage in improvement and degradation areas
To differentiate the relative roles of climate and human activities of vegetation NDVI dynamics in the loess hilly area of western Henan, the specific contribution rates of these two driving factors in areas with improved and degraded vegetation NDVI were statistically assessed, as illustrated in Figure 9. In NDVI improvement areas, climate change contributions to vegetation NDVI dynamics ranged 0%–20%,with spatial concentrations in central Yiyang County, Xinan County and Yichuan County, the eastern Gongyi City and Luolong District, and the southern of Song county and Ruyang County. The contribution rate of 20%–40% was distributed in Shanzhou District, Mianchi County and Jiyuan City in the north of the study area, and Lingbao City and Lushi County in the west of the study area (Figure 9a). Human activities contributed 80%–100% to vegetation NDVI dynamics, predominantly concentrated in the central and eastern parts of the loess hilly area of western Henan, including Song County, Yiyang County, Luoyang City, and Gongyi City, with sporadic distribution throughout the study area. Areas with 60%–80% contribution rates were distributed across the western, northern, and southern sectors of the study area, encompassing Lushi County, Lingbao County, and Jiyuan City. Overall, human activities exhibited greater contribution rates than climate change to vegetation NDVI increases in the study area, demonstrating anthropogenic drivers’ predominant role in vegetation restoration and conservation (Figure 9b). In NDVI degradation areas, climate change contributed 0%–20% to vegetation dynamics, with spatial concentrations in Mengzhou City, Gongyi City and Shangjie District in the east of the loess hilly area of western Henan Province (Figure 9c). Human activities contributed 80%–100% to NDVI dynamics, with these high-contribution areas predominantly concentrated in the northeast and northwest of the study area (Figure 9d). In general, human activities exerted greater influence than climate change on NDVI reduction in the study area, and the degradation of NDVI caused by human activities was mainly concentrated in urbanized zones, indicating that the rapid economic development of cities will also have a negative impact on vegetation change.
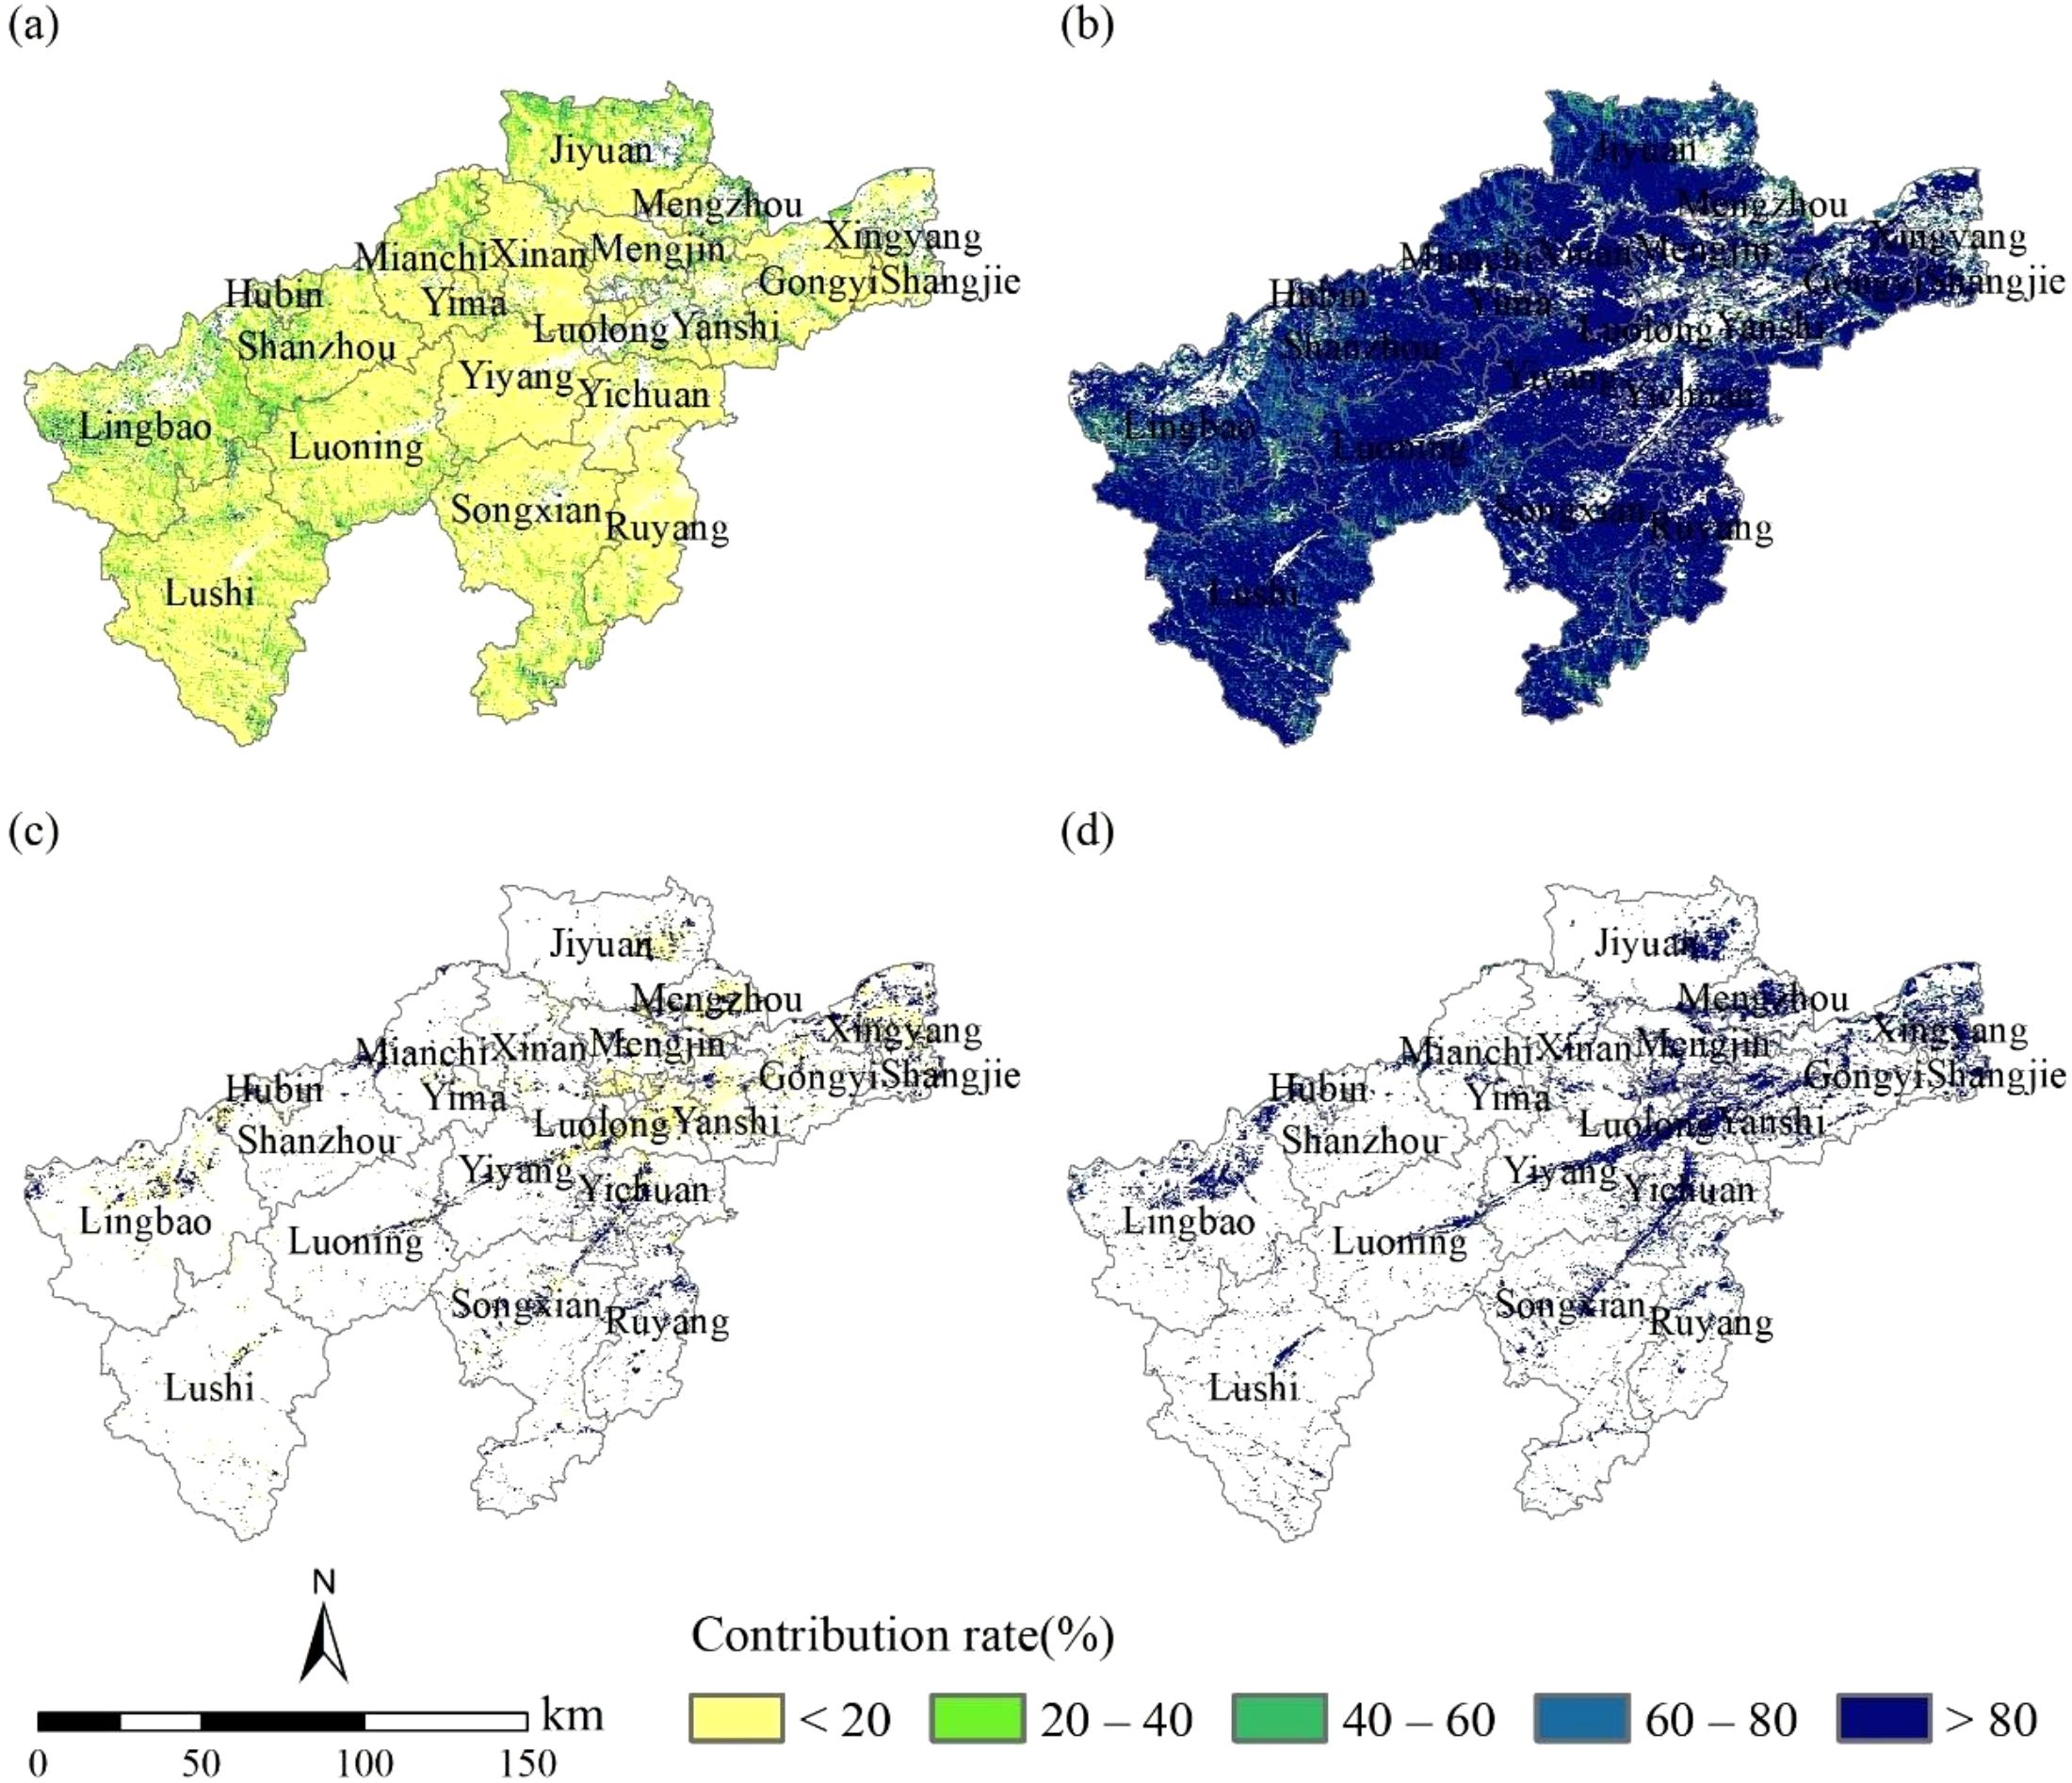
Figure 9. Spatial distribution of contribution rates of climate change (a), human activities (b) to NDVI in the improvement area, climate change (c) and human activities (d) to NDVI in the degradation area.
3.4.4 Analysis of influencing factors of vegetation variation
This study applied the factor detector method to quantify natural and anthropogenic factors’ explanatory power on NDVI spatial differentiation at three temporal nodes in 2000, 2011 and 2022. The eight independent variables’ classification scheme is documented in Table 2.
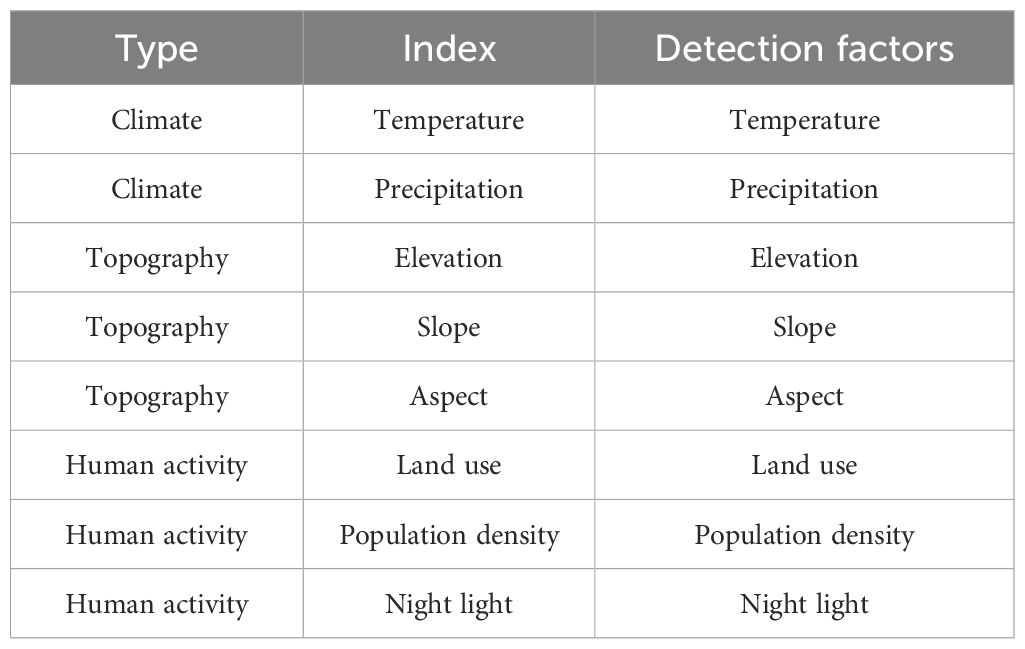
Table 2. Spatial distribution of contribution rates of climate change (a), human activities (b) to NDVI in the improvement area, climate change (c) and human activities (d) to NDVI in the degradation area.
The single factor detection results are shown in Figure 10. The q values of each factor in 2000 were ranked as follows: land use (0.603) > elevation (0.537) > temperature (0.504) > slope (0.351) > precipitation (0.294) > night light (0.239) > population density (0.160) > aspect (0.047). The q values of each factor in 2011 were ranked as follows: land use (0.570) > elevation (0.458) > temperature (0.439) > precipitation (0.424) > slope (0.335) > night light (0.309) > population density (0.254) > aspect (0.054). In 2022, the q values of each factor were ranked as follows: land use (0.611) > elevation (0.486) > temperature (0.468) > slope (0.412) > precipitation (0.399) > night light (0.390) > population density (0.251) > aspect (0.061). In the three studied periods, land use demonstrated the strongest influence on vegetation NDVI spatial distribution in the loess hilly area of western Henan, with q–values of 0.603, 0.570, and 0.611 for the years 2000, 2011, and 2022, respectively. Secondary to land use, elevation and temperature emerged as dominant drivers of NDVI spatial heterogeneity, demonstrating explanatory powers exceeding 40% throughout the study period. These factors persistently exhibited significant control over NDVI spatial heterogeneity. This phenomenon primarily stems from marked topographic variations in the loess hilly region of western Henan, featuring distinct western highlands contrasting with eastern lowlands. These topographic gradients, combined with land use diversity and thermal variations, collectively shape vegetation NDVI spatial patterns. Furthermore, nighttime light and population density q–values demonstrated sustained growth across the three study periods, reflecting intensifying anthropogenic pressures on vegetation dynamics.
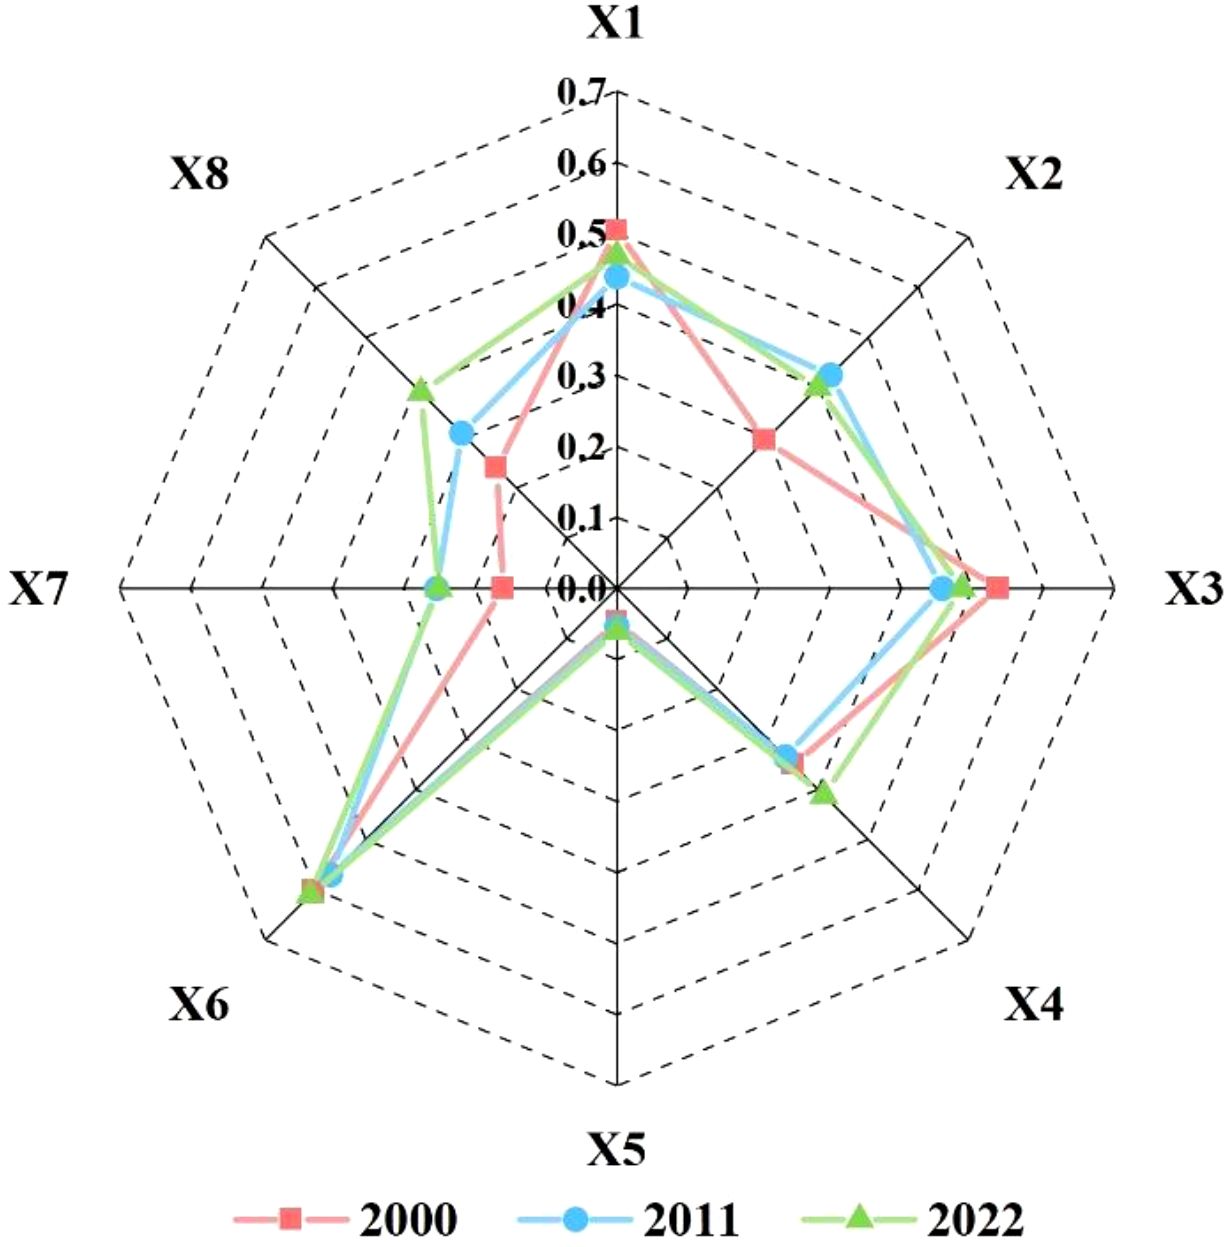
Figure 10. q value of natural and human activity factors on NDVI.
The interaction detector assesses synergistic effects between natural and anthropogenic drivers on NDVI spatial heterogeneity. Factor interactions demonstrate stronger explanatory power than individual factors, with each driver’s influence amplified through synergistic effects. The result was shown in Figure 11. Elevation and land use interactions demonstrated the highest explanatory power, which was 70.9% in 2000, 65% in 2011 and 67.4% in 2022, followed by temperature and land use interactions with a mean explanatory power of 66.63%.
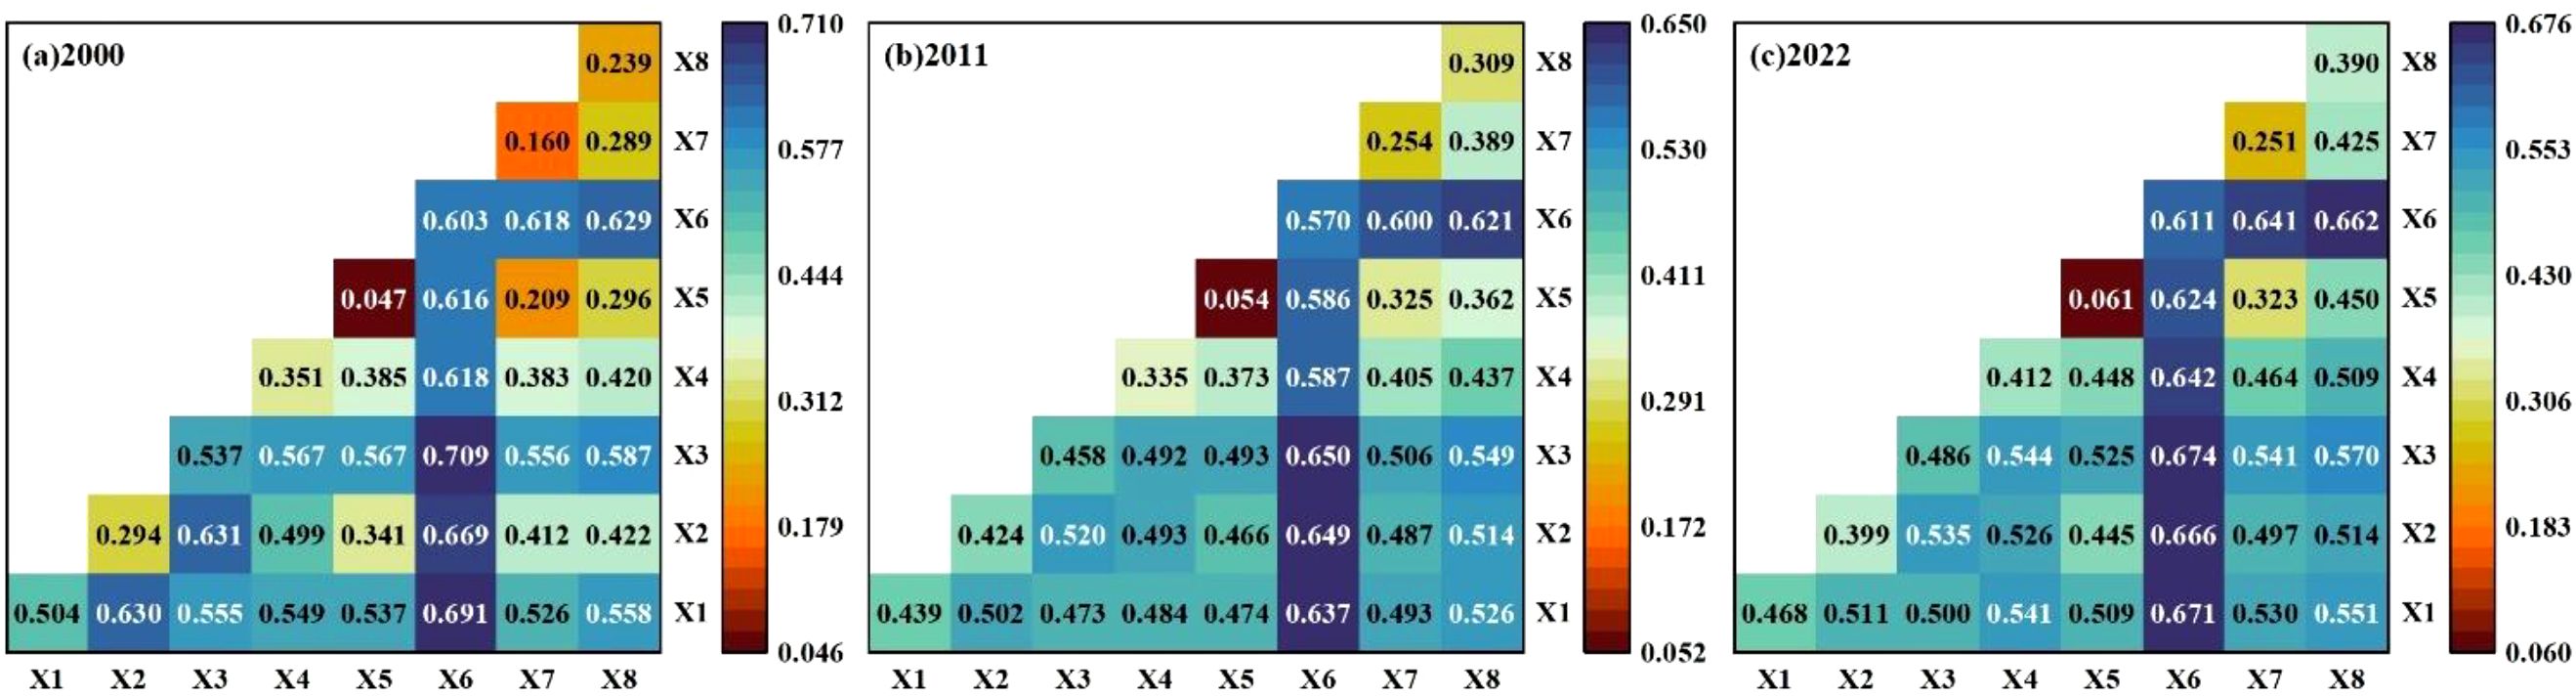
Figure 11. Interactive detection results of NDVI impact factors.
4 Discussion
From the perspective of spatial trends, the vegetation coverage in most regions has shown significant improvement, accounting for 75% of the total area. This finding is consistent with the results of existing study (Wang et al., 2022). Annual NDVI variation revealed significantly depressed values in 2001 and 2013 compared to adjacent years. It is related to the anomalies in temperature and precipitation. The spring and summer drought occurred in northern China in 2001. The corresponding NDVI is lower in spring and summer. From February to early June 2001, the rainfall in most areas north of the Yangtze River was abnormally low, the temperature was generally high, the evaporation was large, triggering severe persistent drought particularly impacting Shanxi, Shandong, Henan, Liaoning, Hebei province. Henan experienced persistent precipitation deficits in 2013, inducing multi-seasonal drought spanning spring through autumn. In the loess hilly area of western Henan, Luanchuan County recorded 367.6 mm cumulative effective rainfall by September’s end, which is only 43% of the average annual rainfall, coupled with a 2°C temperature increase relative to baseline periods.
This study applied multivariate linear residual analysis to disentangle anthropogenic impacts on vegetation dynamics, quantifying climate change versus human activity contributions to vegetation cover enhancement and reduction processes. The results revealed dualistic anthropogenic impacts on NDVI dynamics in the loess hilly region of western Henan, with positive impacts predominating over negative influences. Anthropogenic contributions exceeded 80% in both vegetation enhancement and degradation zones, establishing human activities intensity as the primary driving factor of vegetation changes in the study region. The “Grain for Green Project” has significantly enhanced vegetation restoration in the study area. Since 2000, Luoyang has completed a total of 2.178 million mu of the first round of national project to return farmland to forest, of which 565,000 mu of farmland has been returned to forest, 1.245 million mu of barren mountains and wasteland have been afforested, and 368,000 mu of forests have been closed. From 2016 to 2022, a new round of farmland conversion to forest was carried out, mainly covering non–basic farmland slope farmland with 25 degrees or more, seriously desertified farmland and non–basic farmland slope farmland with 15 to 25 degrees in important water sources. Exemplified by Luanchuan County, since 2017, Luanchuan has invested 223 million yuan to implement six ecological construction projects, such as returning farmland to forest, barren mountain afforestation, afforestation by flying afforestation, ecological restoration, corridor greening, and village landscaping. These measures have an important contribution to vegetation improvement. The correlation between precipitation and NDVI is higher than that of air temperature. Compared with the contribution distribution of climate change and human activities to NDVI in the improvement area, the influence of climate factors on the spatial differentiation of NDVI has decreased, which is consistent with the existed research on the spatio–temporal changes of NDVI pattern and its response to climate in China from 2001 to 2021 (Sun et al., 2023). Severe vegetation degradation has been noted in Luoyang City, Mengjin County, Gongyi City, northern Lingbao City, Shangjie District of Rongyang City, and Yiyang County, covering 4.4% of the total area. The primary cause of vegetation degradation in these areas stems from the spatial expansion of urban construction land, driven by multiple pressures including land resource scarcity and rapid socio-economic development under accelerated urbanization and industrialization processes due to their proximity to urban centers (Tong and Hu, 2016). Taking Zhengzhou city as an example, the city experienced an urban expansion of 583.13 km² between 1990 and 2020, representing a 3.47-fold increase in urbanized area. This has inevitably resulted in the encroachment on ecological lands, particularly woodlands and grasslands (Cai et al., 2022).
In this study, factor detection and interactive detection in geographical detectors were employed to investigate the effects of various factors on the spatial differentiation of NDVI in 2000, 2011 and 2022, taking NDVI in the loess hilly area of western Henan as dependent variables and eight natural and human factors as independent variables. In the single factor detection, land use had the highest explanatory power to NDVI, followed by elevation. In the interaction detection, the interaction between elevation and land use has the highest explanatory power. This may be because high-altitude areas in the study area are predominantly covered by forest and grassland, where land use changes can cause significant disturbances to vegetation, thereby resulting in variations in vegetation cover. Human activity factors have a more obvious impact on vegetation than natural factors, which is consistent with the existed research on spatio–temporal changes and driving forces of vegetation NDVI in Henan Province based on geographical detectors.
5 Conclusions
Based on the NDVI data, this study detected the comprehensive insights into spatial and temporal variations of NDVI in the loess hilly area of western Henan Province between 2000 and 2022. A multi–scale discussion on the reaction and drivers of vegetation NDVI variation to climatic and human activities factors was presented. The major conclusions are as follows:
1. The average annual NDVI ranged from –0.08 to 0.72 from 2000 to 2022, with an average value of 0.49. The average NDVI presented a positive trend from 2000 to 2022. NDVI in the whole study area presented a spatial distribution pattern of high in southwest and low in northeast, with obvious regional differences. The seasonal difference of loess hilly area in western Henan is significant. The areas of extremely significant increase and significant increase were 68.8% and 8.7%, respectively, mainly distributed in the west, south and north of the study area. The average slope values indicated that NDVI in summer, autumn and winter presented the negative trends from 2000 to 2022. The improvement of vegetation in the study area is mainly caused by the significant improvement of vegetation in spring from 2000 to 2022;
2. In the loess hilly area of western Henan Province, vegetation was mainly positively correlated with precipitation and temperature, accounting for 91.63% and 85.02% of the total area, respectively, and precipitation factor had more significant effect on the study area.
3. Based on the residual analysis, it showed that the improvement in vegetation NDVI was primarily driven by the combined effects of climate change and human activities. Human activities contributed more significantly to the dynamic evolution of vegetation NDVI compared to climate change, with contribution rates concentrated between 80% and 100%. In contrast, the contribution rate of climate change ranged from 0% to 20%;
4. The results of the geographical detector analysis revealed significant differences in the explanatory power of climatic and human activities factors on the spatial heterogeneity of NDVI. Land use, elevation, and temperature demonstrated relatively high average explanatory power, each exceeding 40%. Over the study period, the explanatory power of various interacting factors on NDVI showed a gradual increase trend.
Data availability statement
The original contributions presented in the study are included in the article/supplementary material. Further inquiries can be directed to the corresponding author.
Author contributions
ZG: Project administration, Writing – original draft, Methodology, Funding acquisition, Writing – review & editing, Conceptualization. KJ: Conceptualization, Writing – review & editing, Data curation. ZL: Methodology, Software, Writing – review & editing. GX: Software, Writing – review & editing. AL: Formal analysis, Supervision, Writing – review & editing. YS: Writing – review & editing, Resources. CY: Writing – review & editing, Investigation. BY: Writing – review & editing, Software.
Funding
The author(s) declare that financial support was received for the research and/or publication of this article. This research was funded by Key Scientific and Technological Research Project of Henan Province, grant number 252102320245 and 242102320032, Key Research Projects of Higher Education Institutions in Henan Province, grant number 25A170004 and Nanhu Scholars Program for Young Scholars of XYNU, grant number 2019046.
Conflict of interest
The authors declare that the research was conducted in the absence of any commercial or financial relationships that could be construed as a potential conflict of interest.
Generative AI statement
The author(s) declare that no Generative AI was used in the creation of this manuscript.
Publisher’s note
All claims expressed in this article are solely those of the authors and do not necessarily represent those of their affiliated organizations, or those of the publisher, the editors and the reviewers. Any product that may be evaluated in this article, or claim that may be made by its manufacturer, is not guaranteed or endorsed by the publisher.
References
Ahmad K., Banerjee A., Rashid W., Xia Z., Karim S., and Asif M. (2022). Assessment of long–term rainfall variability and trends using observed and satellite data in Central Punjab, Pakistan. Atmosphere 14, 60. doi: 10.3390/atmos14010060
Baniya B., Tang Q., Huang Z., Sun S., and Techato K. A. (2018). Spatial and temporal variation of NDVI in response to climate change and the implication for carbon dynamics in Nepal. Forests 9, 329. doi: 10.3390/f9060329
Cai E., Kou Z., Meng K., Zhang Y., and Hou H. (2022). Spatio-temporal characteristics of urban expansion in Zhengzhou from 1990 to 2020. J. Henan Agr. Univ. 56, 674. doi: 10.16445/j.cnki.1000-2340.20220706.001
Chen T., Xia J., Zou L., and Hong S. (2020). Quantifying the influences of natural factors and human activities on NDVI changes in the Hanjiang River Basin, China. Remote Sens. 12, 3780. doi: 10.3390/rs12223780
Chen W. Y., Xia L. H., Xu G. L., Yu S. Q., Chen H., and Chen J. F. (2022). Dynamic variation of NDVI and its influencing factors in the Pearl River Basin from 2000 to 2020. Ecol. Environ. Sci. 31, 1306–1316. doi: 10.16258/j.cnki.1674–5906.2022.07.003
Chen X., Yan Q., Yi M., Ma X., Li G., Wu Z., et al. (2024). Analysis of spatial and temporal variations of NDVI and its driving factors in the corridor of Lan–Xin railway. Front. Environ. Sci. 12. doi: 10.3389/fenvs.2024.1369974
Chen Y., Li Z., Fan Y., Wang H., and Deng H. (2015). Progress and prospects of climate change impacts on hydrology in the arid region of northwest China. Environ. Res. 139, 11–19. doi: 10.1016/j.envres.2014.12.029
Chen Y. Q., Zhou S. T., Zhu M., and Wu L. L. (2021). Correlation analysis of vegetation cover change and its driving factors in Henan Province. J. Xinyang. Norm. Univ. (Nat. Sci. Ed ) 34, 401–407. doi: 10.3969/j.issn.1003–0972.2021.03.010
Dastigerdi M., Nadi M., Sarjaz M. R., and Kiapasha K. (2024). Trend analysis of MODIS NDVI time series and its relationship to temperature and precipitation in Northeastern of Iran. Environ. Monit. Assess. 196, 346. doi: 10.1007/s10661–024–12463–y
David S. S. (1995). Terrestrial ecosystems and the carbon cycle. Glob. Change Biol. 1, 77–91. doi: 10.1111/j.1365–2486.1995.tb00008.x
Deng X. J., Hu S., and Zhan C. H. (2022). Attribution of vegetation coverage change to climate change and human activities based on the geographic detectors in the Yellow. Environ. Sci. pollut. Res. 29, 44693–44708. doi: 10.1007/s11356–022–18744–8
Eisfelder C., Asam S., Hirner A., Reiners P., Holzwarth S., Bachmann M., et al. (2023). Seasonal vegetation trends for europe over 30 years from a novel normalised difference vegetation index (NDVI) time–series—The TIMELINE NDVI product. Remote Sens. 15, 3616. doi: 10.3390/rs15143616
Evans J. and Geerken R. (2004). Discrimination between climate and human–induced dryland degradation. J. Arid. Environ. 57, 535–554. doi: 10.1016/S0140–1963(03)00121–6
Ganguly S., Friedl M. A., Tan B., Zhang X., and Verma M. (2010). Land surface phenology from MODIS: Characterization of the Collection 5 global land cover dynamics product. Remote Sens. Environ. 114, 1805–1816. doi: 10.1016/j.rse.2010.04.005
Gao X., Huang X. X., Liu K. M., Mi X. T., and Wen R. Y. (2022). Vegetation responses to climate changes in the Qilian Mountain Nature Reserve. J. Lanzhou. Univ. (Nat. Sci. ) 58, 79–88. doi: 10.13885/j.issn.0455–2059.2022.01.009
Geng J., Xu D., Wu Y. G., Geng J., Ren B. N., and Yang F. (2022). Spatio–temporal evolution of eco–environment quality and the response to climate change and human activities in Hainan Island. Acta Ecol. Sin. 42, 4795–4806. doi: 10.5846/stxb202107272035
Glina B., Sykuła M., and Mendyk Ł. (2019). Land use changes and landscape pattern dynamics of a peatland area under diversified human impact: the Grójec Valley (Central Poland). Bull. Geography. Phys. Geogr. Ser. 16), 21–30. doi: 10.2478/bgeo–2019–0002
Gonsamo A., Chen J. M., and Ooi Y. W. (2017). Peak season plant activity shift towards spring is reflected by increasing carbon uptake by extratropical ecosystems. Glob. Change Biol. 24, 2117–2128. doi: 10.1111/gcb.14001
Gu Z. J., Ji K. K., Yi Q., Cao S. M., Li P. Y., and Feng D. T. (2024). Quantitative evaluation of soil erosion in loess hilly area of western henan based on sampling approach. Water 16, 2895. doi: 10.3390/w16202895
Guo L. and Wang S. D. (2018). Correlation analysis of vegetation index and meteorological factors in Henan Province in the last 30 years. Ecol. Sci. 37, 102–112. doi: 10.14108/j.cnki.1008–8873.2018.05.014
Han W., Chen D., Li H., Chang Z., Chen J., et al. (2022). Spatiotemporal variation of NDVI in Anhui Province from 2001 to 2019 and its response to climatic factors. Forests 13, 1643. doi: 10.3390/f13101643
Jia Z., Lei R., Liu Y., Liu P., Wang Z., Chang Y., et al. (2023). Spatial–temporal variations and the driving factors of vegetation coverage in the Loess Hilly and Gully Region of China. Forests 14, 1238. doi: 10.3390/f14061238
Jin K., Wang F., Han J. Q., Shi S. Y., and Ding W. B. (2020). Contribution of climatic change and human activities to vegetation NDVI change over China during 1982–2015. Acta Geogr. Sin. 75, 961–974. doi: 10.11821/dlxb202005006
Kendall M. G. (1975). Rank correlation methods (London, UK: Charles Griffin). doi: 10.1017/S0020268100013019
Li C., Jia X., Zhu R., Mei X., Wang D., and Zhang X. (2023). Seasonal spatiotemporal changes in the NDVI and its driving forces in Wuliangsu Lake Basin, Northern China from 1990 to 2020. Remote Sens. 15, 2965. doi: 10.3390/rs15122965
Li X. Y., Xin Z. B., Yang J. L., and Liu J. H. (2024). The spatiotemporal changes and influencing factors of vegetation NDVI in the Hehuang Valley of Qinghai Province from 2000 to 2020. J. Soil Water Conserv. 38, 79–90. doi: 10.13870/j.cnki.stbcxb.2024.01.009
Long H. L., Li X. B., Wang H., Wei D. D., and Zhang C. (2010). Net primary productivity (NPP) of grassland ecosystem and its relationship with climate in Inner Mongolia. Acta Ecol. Sin. 30, 1367–1378. doi: 10.20103/j.stxb.2010.05.029
Lunetta R. S., Knight J. F., Ediriwickrema J., Lyon J. G., and Worthy L. D. (2006). Land–cover change detection using multi–temporal MODIS NDVI data. Remote Sens. Environ. 105, 142–154. doi: 10.1016/j.rse.2006.06.018
Ma Y. R., Guan Q. Y., Sun Y. F., Zhang J., Yang L. Q., Yang E. Q., et al. (2022). Three–dimensional dynamic characteristics of vegetation and its response to climatic factors in the Qilian Mountains. Catena 208, 105694. doi: 10.1016/j.catena.2021.105694
Mann H. B. (1945). Nonparametric tests against trend. Econometrica 13, 245–259. doi: 10.2307/1907187
Martinez C. J., Maleski J. J., and Miller M. F. (2012). Trends in precipitation and temperature in Florida, USA. J. Hydrol. 452, 259–281. doi: 10.1016/j.jhydrol.2012.05.066
Myneni R. B., Dong J., Tucker C. J., Kaufmann R. K., Kauppi P. E., Liski J., et al. (2001). A large carbon sink in the woody biomass of Northern forests. Proc. Natl. Acad. Sci. U.S.A. 98, 14784–14789. doi: 10.2307/3057363
Nie T., Dong G. T., Jiang X. H., Lei Y. X., Gao S. Q., and He J. Y. (2024). Temporal and spatial variations and driving force analysis of NDVI in Henan Province based on Geodetector. Chin. J. Ecol. 43, 273–281. doi: 10.13292/j.1000–4890.202401.003
Petus C., Lewis M., and White D. (2013). Monitoring temporal dynamics of Great Artesian Basin wetland vegetation, Australia, using MODIS NDVI. Ecol. Indic. 34, 41–52. doi: 10.1016/j.ecolind.2013.04.009
Piao S., Nan H., Huntingford C., Ciais P., Friedlingstein P., et al. (2014). Evidence for a weakening relationship between interannual temperature variability and northern vegetation activity. Nat. Commun. 5, 5018. doi: 10.1038/ncomms6018
Sardiña L. C., Irisarri G., and Texeira M. (2023). Climate factors rather than human activities controlled NDVI trends across wet meadow areas in the Andes Centrales of Argentina. J. Arid. Environ. 214, 104983. doi: 10.1016/j.jaridenv.2023.104983
Sen P. K. (1968). Estimates of the regression coefficient based on Kendall’s tau. J. Am. Stat. Assoc. 63, 1379–1389. doi: 10.2307/2285891
Shao J. H., Li J., Yan X. G., Ma T. Y., and Zhang R. (2023). Analysis of spatiotemporal variation characteristics and driving forces of NPP in Shanxi Province from 2000 to 2020 based on geodetector. Environ. Sci. 44, 312–322. doi: 10.13227/j.hjkx.202203010
Sun R., Zhang F. M., Weng S. H., and Liu Q. (2023). Spatio–temporal changes of NDVI and its response to climate in China from 2001 to 2021. China Environ. Sci. 43, 5519–5528. doi: 10.19674/j.cnki.issn1000–6923.20230509.002
Tong L. Y. and Hu S. G. (2016). Characterizations of urban sprawl in major Chinese Cities. Resour. Sci. 38, 50. doi: 10.18402/resci.2016.01.06
Tuoku L., Wu Z., and Men B. (2024). Impacts of climate factors and human activities on NDVI change in China. Ecol. Inf. 81, 102555. doi: 10.1016/j.ecoinf.2024.102555
Wang J. F., Li X. H., Christakos G., Liao Y. L., Zhang T., Gu X., et al. (2010). Geographical detectors–based health risk assessment and its application in the neural tube defects study of the Heshun region, China. Int. J. Geogr. Inf. Sci. 24, 107–127. doi: 10.1080/13658810802443457
Wang X., Li Y., Wang X., Li Y., Lian J., and Gong X. (2021). Temporal and spatial variations in NDVI and analysis of the driving factors in the Desertified Areas of Northern China from 1998 to 2015. Front. Environ. Sci. 9. doi: 10.3389/fenvs.2021.633020
Wang J. F. and Xu C. D. (2017). Geodetector: principle and prospective. Acta Geogr. Sin. 72, 116–134. doi: 10.11821/dlxb201701010
Wang W. C., Xue P., and Liu S. H. (2022). Spatiotemporal evolution of vegetation cover in Henan Province from 1999 to 2018. Res. Soil Water Conserv. 29, 243–248. doi: 10.13869/j.cnki.rswc.2022.02.016
Wei Y., Sun S., Liang D., and Jia Z. (2022). Spatial–temporal variations of NDVI and its response to climate in China from 2001 to 2020. Int. J. Digital. Earth 15, 1463–1484. doi: 10.1080/17538947.2022.2116118
Wu S. P., Gao X., Lei J. Q., Zhou N., and Wang Y. D. (2020). Spatial and temporal changes in the normalized difference vegetation index and their driving factors in the desert/grassland biome transition zone of the sahel region of Africa. Remote Sens. 12, 4119. doi: 10.3390/rs12244119
Wu Y., Yang J., Li S., Guo C., Yang X., Xu Y., et al. (2023). NDVI–based vegetation dynamics and their responses to climate change and human activities from 2000 to 2020 in miaoling karst mountain area, SW China. Land 12, 1267. doi: 10.3390/land12071267
Xu Y., Huang W. T., Lu M. Y., Ou Y. X., Zhang Z. Y., Li M. J., et al. (2022). Vegetation cover change and the relative role of climate change and human activities in Southwest Karst Areas. Res. Soil Water Conserv. 29, 292–299. doi: 10.13869/j.cnki.rswc.2022.03.036
Yang Y. L., Yang K., Luo Y., Yu Z. Y., Meng C., and Li C. (2021). Effect of vegetation coverage on the temporal and spatial distribution of PM2.5 concentration in China’s eight major economic regions from 1998 to 2016. Environ. Sci. 42, 5100–5108. doi: 10.13227/j.hjkx.202101277
Yang S., Zhao Y., Yang D., and Lan A. (2024). Analysis of vegetation NDVI changes and driving factors in the Karst concentration distribution area of Asia. Forests 15, 398. doi: 10.3390/f15030398
Yu Y. Y., Song F. Y., and Zhang S. J. (2022). Quantitative analysis of temporal and spatial changes of NDVI and its driving factors in Henan province from 2000 to 2020. Ecol. Environ. Sci. 31, 1939–1950. doi: 10.16258/j.cnki.1674–5906.2022.10.002
Zhang Y., Jiang X., Lei Y., and Gao S. (2022). The contributions of natural and anthropogenic factors to NDVI variations on the Loess Plateau in China during 2000–2020. Ecol. Indic. 143, 109342. doi: 10.1016/j.ecolind.2022.109342
Zhang H. F., Wang Y. E., Gu Z. J., Li P. Y., Yi Q., Guo W. H., et al. (2023). Study on spatiotemporal dynamic and correlation of NPP and NDVI in Dabie Mountain Area based on MODIS. J. Xinyang. Norm. Univ. (Nat. Sci. Ed ) 36, 362–366. doi: 10.3969/j.issn.1003–0972.2023.03.003
Zhang J. J., Zheng H., Zhu L. Q., Cui Y. P., Zhang X. D., and Ye L. P. (2017). Multi–dimensional changes of vegetation NDVI and its response to climate in Western Henan Mountains. Geogr. Res. 36, 765–778. doi: 10.11821/dlyj201704014
Zhou L. H. and Zhang K. (2023). Spatio–temporal variation of vegetation cover and its influencing factors in yan’an city from 2000 to 2020. Bull. Soil Water Conserv. 43, 356–365. doi: 10.13961/j.cnki.stbctb.2023.04.041
Keywords: NDVI, climate change, human activities, geographical detector, loess hilly area of western Henan Province
Citation: Gu Z, Ji K, Li Z, Xu G, Li A, Shen Y, Yao C and Yang B (2025) Spatiotemporal variations of vegetation and its response to climate change and human activities in loess hilly area of western Henan Province, China. Front. Ecol. Evol. 13:1597342. doi: 10.3389/fevo.2025.1597342
Received: 21 March 2025; Accepted: 20 June 2025;
Published: 08 July 2025.
Edited by:
Shuisen Chen, Guangzhou Institute of Geography, ChinaReviewed by:
Zhifeng Jia, Chang’an University, ChinaLiang He, Beijing Forestry University, China
Cheng Li, Yangzhou University, China
Copyright © 2025 Gu, Ji, Li, Xu, Li, Shen, Yao and Yang. This is an open-access article distributed under the terms of the Creative Commons Attribution License (CC BY). The use, distribution or reproduction in other forums is permitted, provided the original author(s) and the copyright owner(s) are credited and that the original publication in this journal is cited, in accordance with accepted academic practice. No use, distribution or reproduction is permitted which does not comply with these terms.
*Correspondence: Zhijia Gu, Z3V6aGlqaWFAeHludS5lZHUuY24=