 Fang Yu
 Fei Peng1
 Guoxia Ma
 Peipei Guo
- 1Center for Eco-Environmental Accounting, Chinese Academy of Environmental Planning, Beijing, China
- 2Environmental Protection Key Laboratory of Environmental Damage Identification and Restoration, Chinese Academy of Environmental Planning, Beijing, China
- 3Research Center for Eco-Environment Protection, Yunnan Research Academy of Eco-Environmental Sciences, Kunming, China
Biodiversity is the foundation of human survival, and its accurate assessment is a prerequisite for effective conservation and sustainable use. Most studies only assessed the state of biodiversity, but lacked a comprehensive understanding of the pressures and responses of biodiversity. In this paper, we took Yunnan Province (Yunnan) as a pilot area and constructed a comprehensive assessment system of biodiversity pressure-state-response (PSR) to comprehensively evaluate biodiversity in Yunnan. The results showed that: (1) Yunnan was one of the richest regions in the world in terms of biodiversity resources, and among the 16 cities and prefectures, Honghe Hani and Yi Autonomous Prefecture (Honghe), Nujiang Lisu Autonomous Prefecture (Nujiang), and Xishuangbanna Dai Autonomous Prefecture (Banna) ranked in the top three for biodiversity state index; (2) From 2010 to 2020, the pressure on biodiversity in Yunnan decreased by 19%, with only a slight increase in the biodiversity pressure index in Nujiang; in 2020, Kunming City (Kunming) faced the greatest pressure on biodiversity, scoring 2.21, while Diqing Tibetan Autonomous Prefecture (Diqing) had the least pressure, scoring 0.32; (3) Diqing had the highest biodiversity response index of 1.46, while Lincang City (Lincang) had the lowest response index of 0.61. Most of cities and prefectures had not shown good balance and consistency in their responses to biodiversity conservation in Yunnan Province. (4) Considering the comprehensive PSR assessment results, Nujiang had the highest biodiversity score, while Kunming had the lowest. The study comprehensively evaluated the biodiversity state and the main pressures faced by each city and prefecture in Yunnan, and the findings can provide theoretical support for the assessment and policy formulation of biodiversity conservation in Yunnan and the indicator system and assessment methods developed in the paper have reference significance for biodiversity assessment and management in other similar areas in the international arena.
1 Introduction
Biodiversity is the ecological complex formed by the interaction between organisms and the environment, as well as the sum of various ecological processes involved in the formation of this complex (Ma, 1993). Biodiversity is crucial for maintaining the stability of ecosystems and the sustainable development of productivity, serving as an important material foundation for human society (Millennium Ecosystem Assessment, 2005). Also, biodiversity, as an important link in the complex ecological network structure, has diverse species occupying different ecological niches (Loreau and Hector, 2001), and is an important carrier of material flow, energy flow, and information flow in ecosystems (Yue et al., 2022), playing a significant role in the normal functioning of ecosystems and the stability of ecosystem services (Fu et al., 2017). On the other hand, biodiversity has diverse economic and cultural values, and as the source of the biological gene pool, biodiversity provides human society with abundant genetic resources, which provides important support for the development of agriculture, medicine, industry and other fields (Le Provost et al., 2023; Yang et al., 2004; Geijzendorffer et al., 2019). Therefore, an objective and comprehensive biodiversity assessment is the basis for biodiversity policy formulation and effective conservation, as well as the key to the rational development and utilization of ecological and environmental resources.
Biodiversity assessment remains a hot and challenging topic in academia. Early biodiversity assessments mainly focused on single-dimensional index assessments, such as the α diversity index, β diversity index, and γ diversity index for species diversity (Whittaker, 1977). By the late 19th century to the early 21st century, the connotation of biodiversity assessment became increasingly refined, and the assessment system had been initially formed. Due to the role of biodiversity in providing food, raw materials, medicines, and various ecosystem services to humans (Ehrlich and Ehrlich, 1992), scholars had proposed to quantify the services provided by ecosystems to human beings in terms of ecosystem service values, including biodiversity values (Gretchen, 1997; Costanza et al., 1997). The past two decades had seen rapid development in biodiversity assessment, with research becoming diversified and forming a comprehensive assessment system that included “ecosystem services”, “habitat”, “functional diversity”, and “sustainable development” (Czajkowski et al., 2009; Hungate et al., 2017; Seddon et al., 2020).
International organizations have successively promoted a series of ecosystem and biodiversity assessment studies. The Intergovernmental Science-Policy Platform on Biodiversity and Ecosystem Services (IPBES) released the “Global Assessment Report on Biodiversity and Ecosystem Services” in 2019 (IPBES, 2019). The United Nations Sustainable Development Goals (SDG) proposed a series of indicators related to biodiversity, forming the green sustainable development indicators, which have certain reference significance for conducting biodiversity value assessments at regional or local levels. In recent years, economic valuation of biodiversity and ecosystem services had increasingly been incorporated into management decision-making and policy research.
The biodiversity assessment based on the Pressure-State-Response (PSR) model was a major method widely adopted for evaluating biodiversity. The index of biodiversity state, pressure and response reflected the basic condition of biodiversity, the degree of threat, and the effectiveness of protection, respectively, and were mainly used for comprehensive quantitative assessment of biodiversity. The biodiversity pressure mainly focused on major causes of biodiversity loss, such as climate change, degradation or loss of natural habitats, overexploitation of natural resources, environmental pollution, and invasion of alien species. In terms of state, the assessment mainly focused on species diversity, genetic diversity, ecosystem functions and so on, exploring species composition, quantity and quality, as well as interspecies relationships. For the aspect of response, biodiversity conservation was combined with human socio-economic attributes, using socio-economic indicators such as the formulation of conservation policies, conservation and restoration and financial investment, to evaluate the status of biodiversity conservation.
Yunnan, as an important biodiversity treasure trove and ecological security barrier in Southwest China, encompassed more than half of the country’s ecosystem diversity and biodiversity (Yang et al., 2004). It was also one of the 36 biodiversity hotspots globally that were the richest in species and most threatened (Hu et al., 2018), making it an ideal experimental site for biodiversity research. This study conducted a comprehensive assessment of biodiversity in Yunnan Province based on the PSR model, exploring the current state of biodiversity in Yunnan under the combined influence of existing natural and social factors, as well as the pressures it may face. The research results could provide a theoretical basis for the formulation of biodiversity conservation policies in Yunnan and can also serve as a methodological reference for biodiversity assessments in different regions.
2 Methodology and data
2.1 Study area
Yunnan is located between 97°31′ and 106°11′ east longitude, and 21°8′ and 29°15′ north latitude. It belongs to the subtropical plateau monsoon region, with significant three-dimensional climate characteristics. The average annual temperature in the province is around 18°C, and the distribution of precipitation is extremely uneven both seasonally and geographically, with the rainy season accounting for 85% of the total rainfall. The total land area of Yunnan Province is 394,100 square kilometers, and it has 16 prefecture-level administrative regions. It is situated in the core and intersection of three major areas: the “Southwest Mountain Region of China,” the “Eastern Himalayas” and the “India-Myanmar” region, which are among the 36 most biologically rich and threatened terrestrial biodiversity hotspots in the world (Figure 1). Yunnan is the province with the richest biodiversity in China and one of the most critical areas for biodiversity conservation in the country. It is known as the “Kingdom of Animals,” “Kingdom of Plants,” and “Gene Pool of Species,” and is an important treasure trove of biodiversity and a vital ecological security barrier in the southwest China.
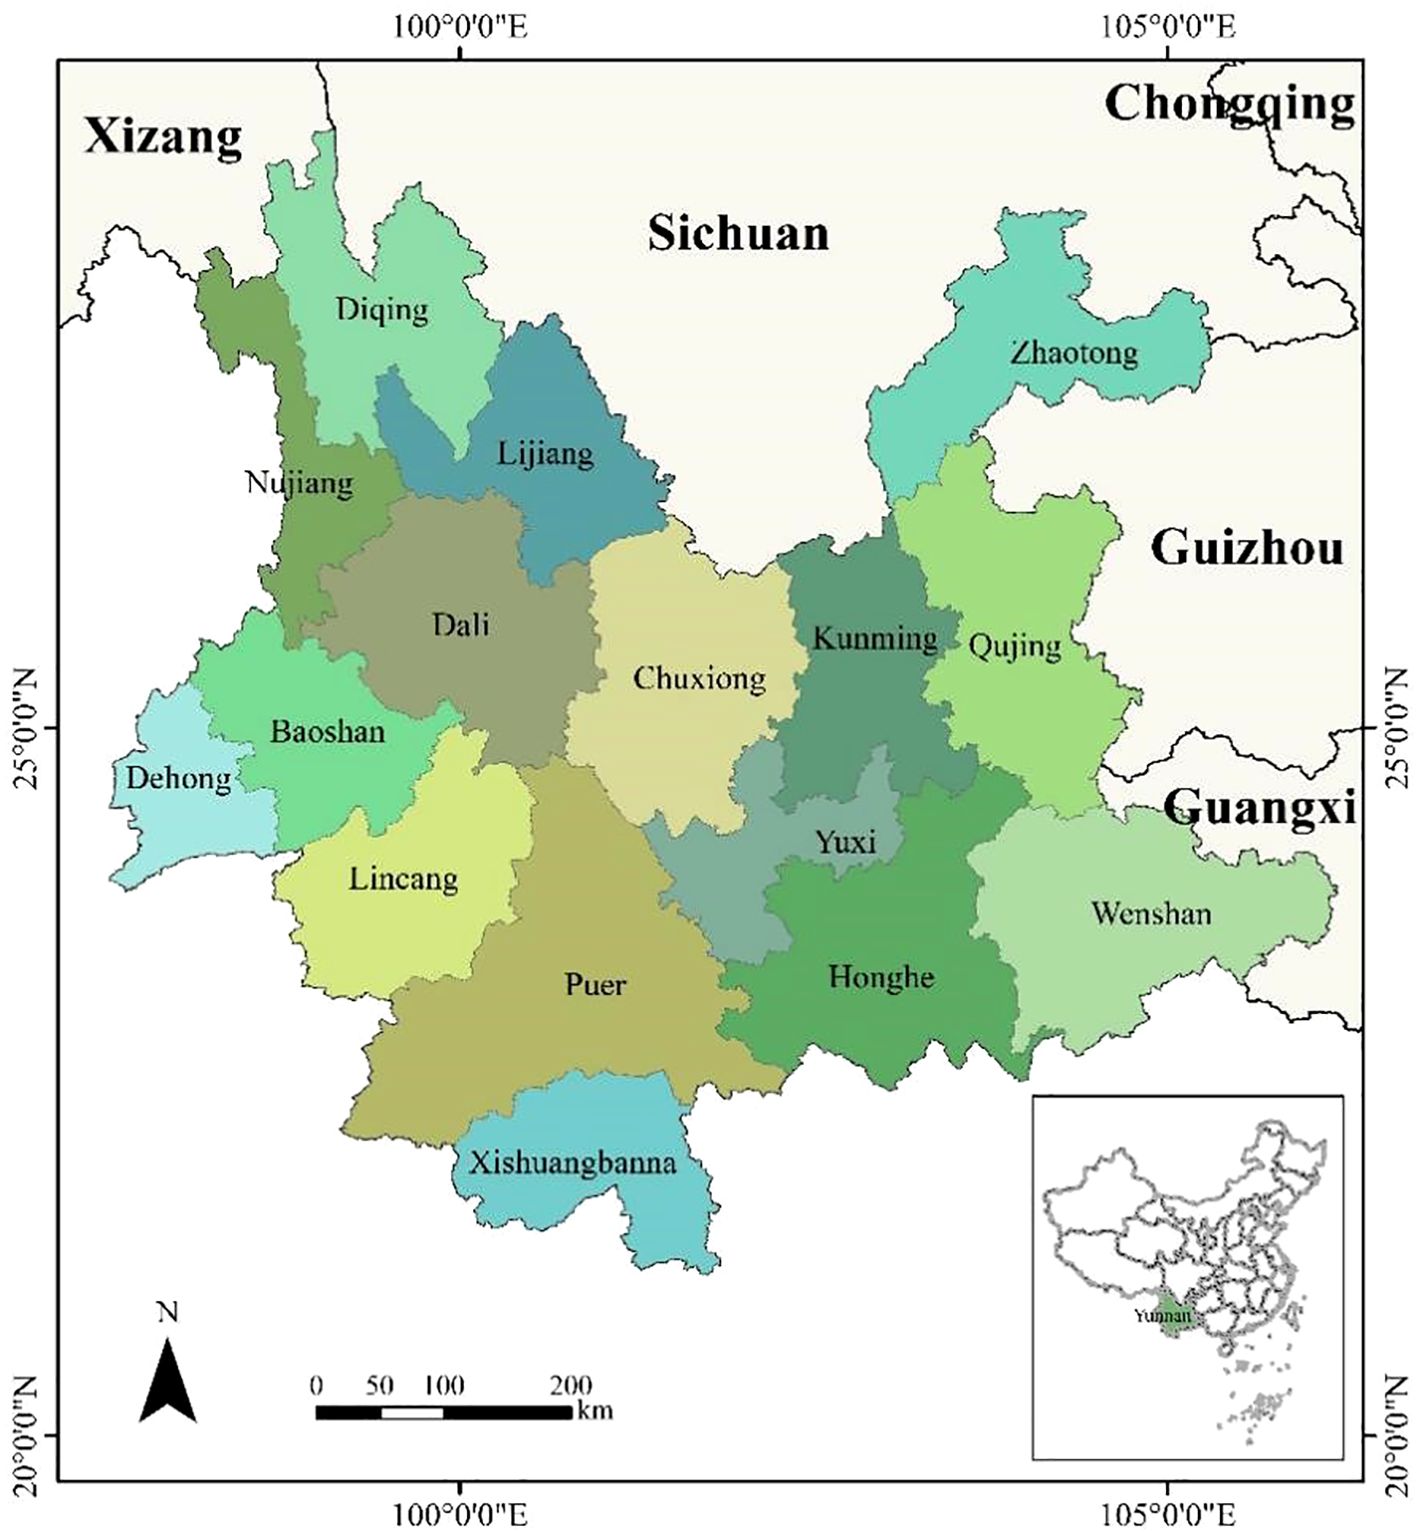
Figure 1. Geographical location and distribution of 16 cities and prefectures in Yunnan Province.
2.2 Construction of indicator system
With reference to the Aichi Biodiversity Target of the Convention on Biological Diversity and the United Nations Sustainable Development Goals, and drawing on the new trend of biodiversity assessment in both national and international arena (Soto-Navarro et al., 2021; Wang et al., 2021; Fu et al., 2017), this study constructed a comprehensive assessment indicator system for biodiversity quality in Yunnan based on the PSR conceptual framework (Li et al., 2022), which evaluated biodiversity in the context of three aspects: state, pressure and response (Table 1), with 8 state indicators, 6 pressure indicators and 5 response indicators, with corresponding secondary and tertiary indicators under each primary indicator. The weight setting was obtained through expert scoring methods.
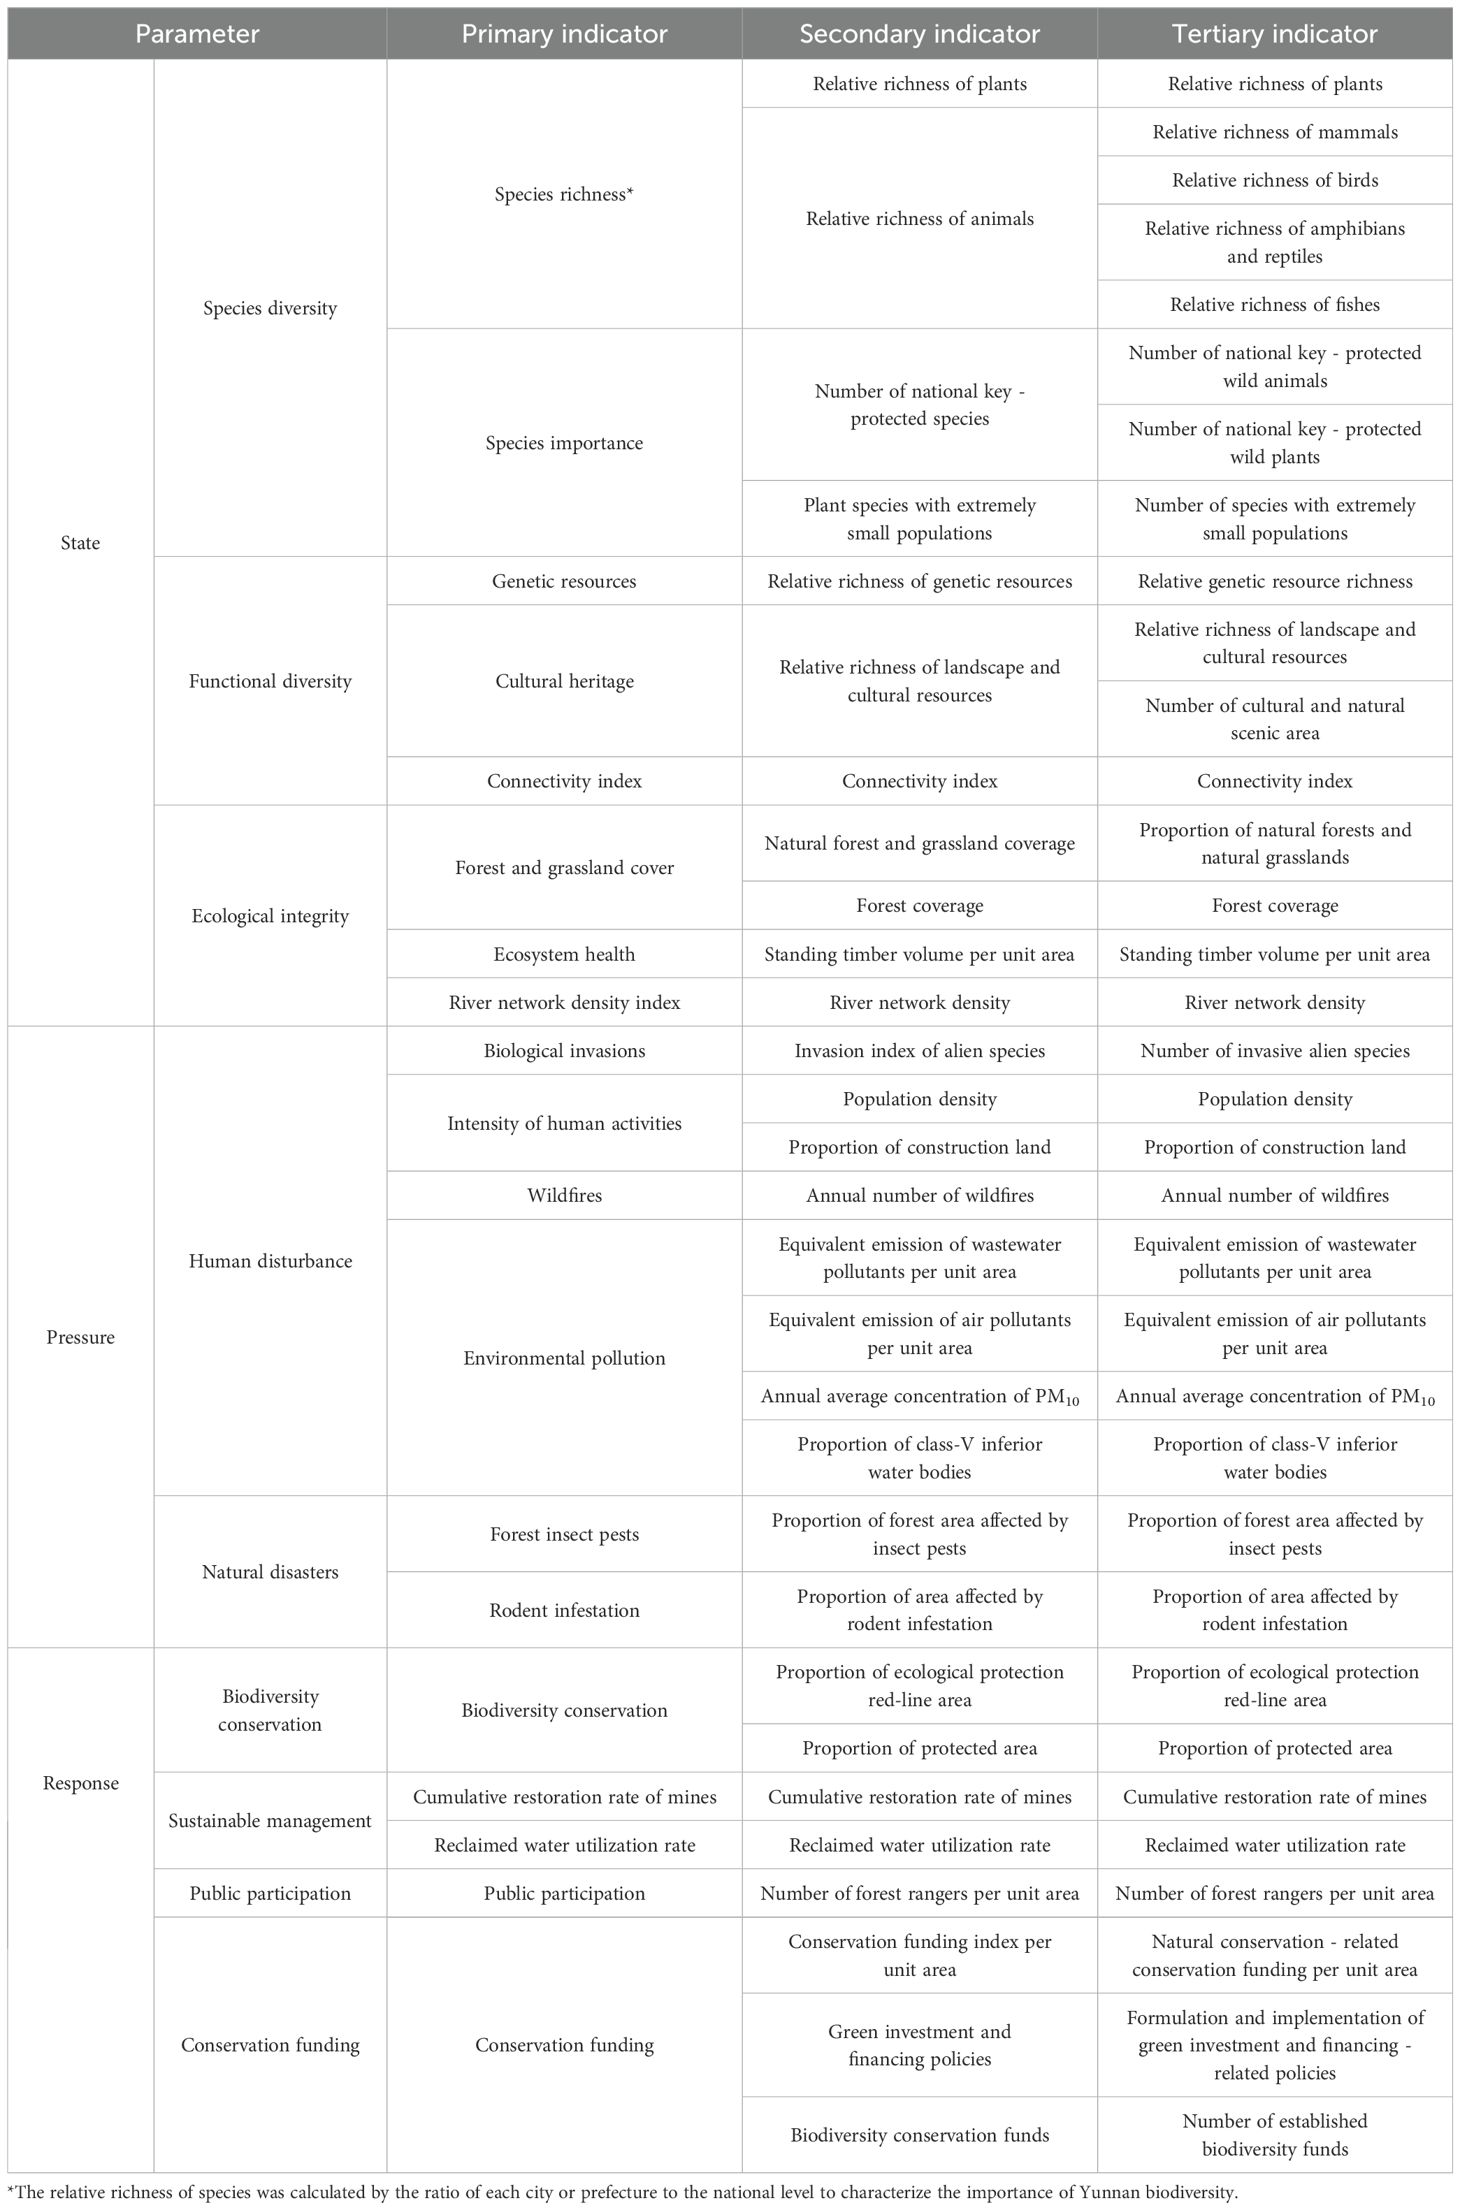
Table 1. Assessment indicators system of biodiversity in Yunnan province.
The biodiversity state indicators referred to the MBI assessment index system (Soto-Navarro et al., 2021), including parameters of three aspects: species diversity, functional diversity, and ecological integrity. Species diversity included two primary indicators: species richness and species importance, where species importance was measured by the number of nationally protected species and the number of internationally critically endangered species. Functional diversity was reflected through three primary indicators: genetic resources, cultural heritage, and connectivity index. Ecological integrity was reflected through three primary indicators: forest and grassland coverage, ecosystem health, and river network density index.
The biodiversity pressure index was set from two aspects: human disturbance and natural disasters. Human disturbance included four primary indicators: biological invasions, intensity of human activities, wildfires, and environmental pollution. Biological invasions used the indicator of invasive alien species, while the intensity of human activities was measured by population density and the proportion of construction land area to the total land area. The fire indicator was the annual number of forest fires, and environmental pollution was measured by the equivalent discharge of wastewater pollutants per unit area, the equivalent discharge of air pollutants per unit area, the annual ambient average concentration of PM10, and the proportion of class-V inferior water bodies to the total water bodies. Natural disasters were set with two primary indicators: forest insect pests and rodent infestation, which included the proportion of forest area affected by insect pests and diseases and the proportion of area affected by rodent infestation.
The biodiversity response index included parameters of four aspects: biodiversity conservation, sustainable management, public participation and conservation funding. Biodiversity conservation included the proportion of ecological protection red line area and the proportion of protected area to the total land area. The sustainable management indicators used two primary indicators: cumulative restoration rate of mines and reclaimed water utilization rate. Public participation adopted the number of forest rangers per unit area as an indicator. Conservation funding adopted the indicator of financial investment per unit area, green investment and financing policy and biodiversity conservation funds.
2.3 Data collection and processing
2.3.1 Data source
The data used in this paper mainly came from publicized official monitoring and statistical yearbooks, species lists, literature and remote sensing data. The sources of data included: i. The number of livestock and poultry genetic resources was sourced from the Yunnan Provincial Livestock and Poultry Genetic Resource Protection List provided by the department of Agriculture and Rural Affairs of Yunnan Province, the population, land area, and construction land area, as well as wildfire data were sourced from statistical yearbooks (Statistics Bureau of Yunnan Province, 2011; Statistics Bureau of Yunnan Province, 2021), the forest and grassland coverage and standing timber volume, forest insect pests, rodent infestation area, and biological invasions were provided by Yunnan Forestry and Grassland Bureau, the watershed area and river length were provided by the department of Water Resources, the air pollutants emissions, water pollutant emissions, ambient air quality and water quality, ecological protection red line, protected area size were provided by the department of Ecological Environment, the ecological protection-related funding, and cumulative restoration rate of mines were provided by the department of Natural Resources; ii. Data on Yunnan Province’s plant and animal species, as well as nationally key-protected species and extremely small populations, came from the website of Yunnan Forestry and Grassland Bureau (http://lcj.yn.gov.cn/html/2022/zdlyxxgkqt_1012/67268.html), scientific expedition reports and literatures (Han et al., 2013; Wu et al., 2013; Li, 2014; He et al., 2017; Han, 2021), while world natural and cultural heritage data from the Forestry and Grassland Bureau, and the number of natural scenic spots came from cultural and tourism bulletins; iii. Land use data was sourced from the 250 m resolution national land use data of Resources and Environmental Science Data Platform, Chinese Academy of Sciences (https://www.resdc.cn/).
2.3.2 Data processing and indicator calculation
Most of PSR indicators were processed for standardization by the ratio of primary data for each city and prefecture to the average of all cities and prefecture, while the indicators of land connectivity and the river network density were calculated with the following formulas. An indicator value greater than 1 indicated a status better than the average, while a value less than 1 represented a status below the average. Due to the lack of biodiversity state and response indicator data for 2010, the state and response indicators only included the results for 2020, while the pressure indicator data calculated results for both 2010 and 2020, reflecting the changes in biodiversity pressure due to socio-economic activities from 2010 to 2020.
i. The connectivity index was calculated using fragstats 4.0 based on the land use data as Equation 1:
where Cijk represents the connectivity status of patches j and k associated with patch type i within a critical distance; ni represents the number of patches of patch type i in the landscape. The connectivity is then equal to the number of nodes between all patches in a given patch type (Cijk = 1 when patch j was connected to k; otherwise, Cijk = 0) divided by the number of all possible nodes.
ii. The river network density was calculated as Equation 2:
where represents the river network density (kilometers per square kilometer), represents the total length of rivers (kilometers), and represents the drainage basin area (square kilometers).
3 Results
3.1 Current distribution of biodiversity
According to the Bulletin on the Ecological and Environmental Status of Yunnan Province in 2021, Yunnan had a total of 19,333 species of vascular plants, accounting for 50.1% of the national total; it had 305 species of mammals (Yunnan Biodiversity Conservation Joint Conference, 2013), 944 species of birds (CNC-DIVERSITAS, 2010), 297 species of amphibians and reptiles (CNC-DIVERSITAS, 2010), and a total of 590 species of fish (Han, 2021), with 236 species of national key-protected wild animals (Yunnan Forestry and Grassland Bureau, 2021), being 4.93 times the national average, and 146 species of key-protected wild plants (Yunnan Forestry and Grassland Bureau, 2021), being 7.96 times the national average. In terms of regional distribution, Banna had the highest number of vascular plant species, accounting for 35% of the total plant species in Yunnan; The city of Pu’er had the highest number of terrestrial mammal species, accounting for 64% of the province; Dali had the highest number of bird species, accounting for 68% of the total in Yunnan; the top three regions for amphibians and reptiles were Yuxi, Honghe and Wenshan, accounting for 67%, 62%, and 60% of the total in Yunnan, respectively; Pu’er had the highest number of fish species, accounting for 42% of the total in Yunnan (Figure 2).
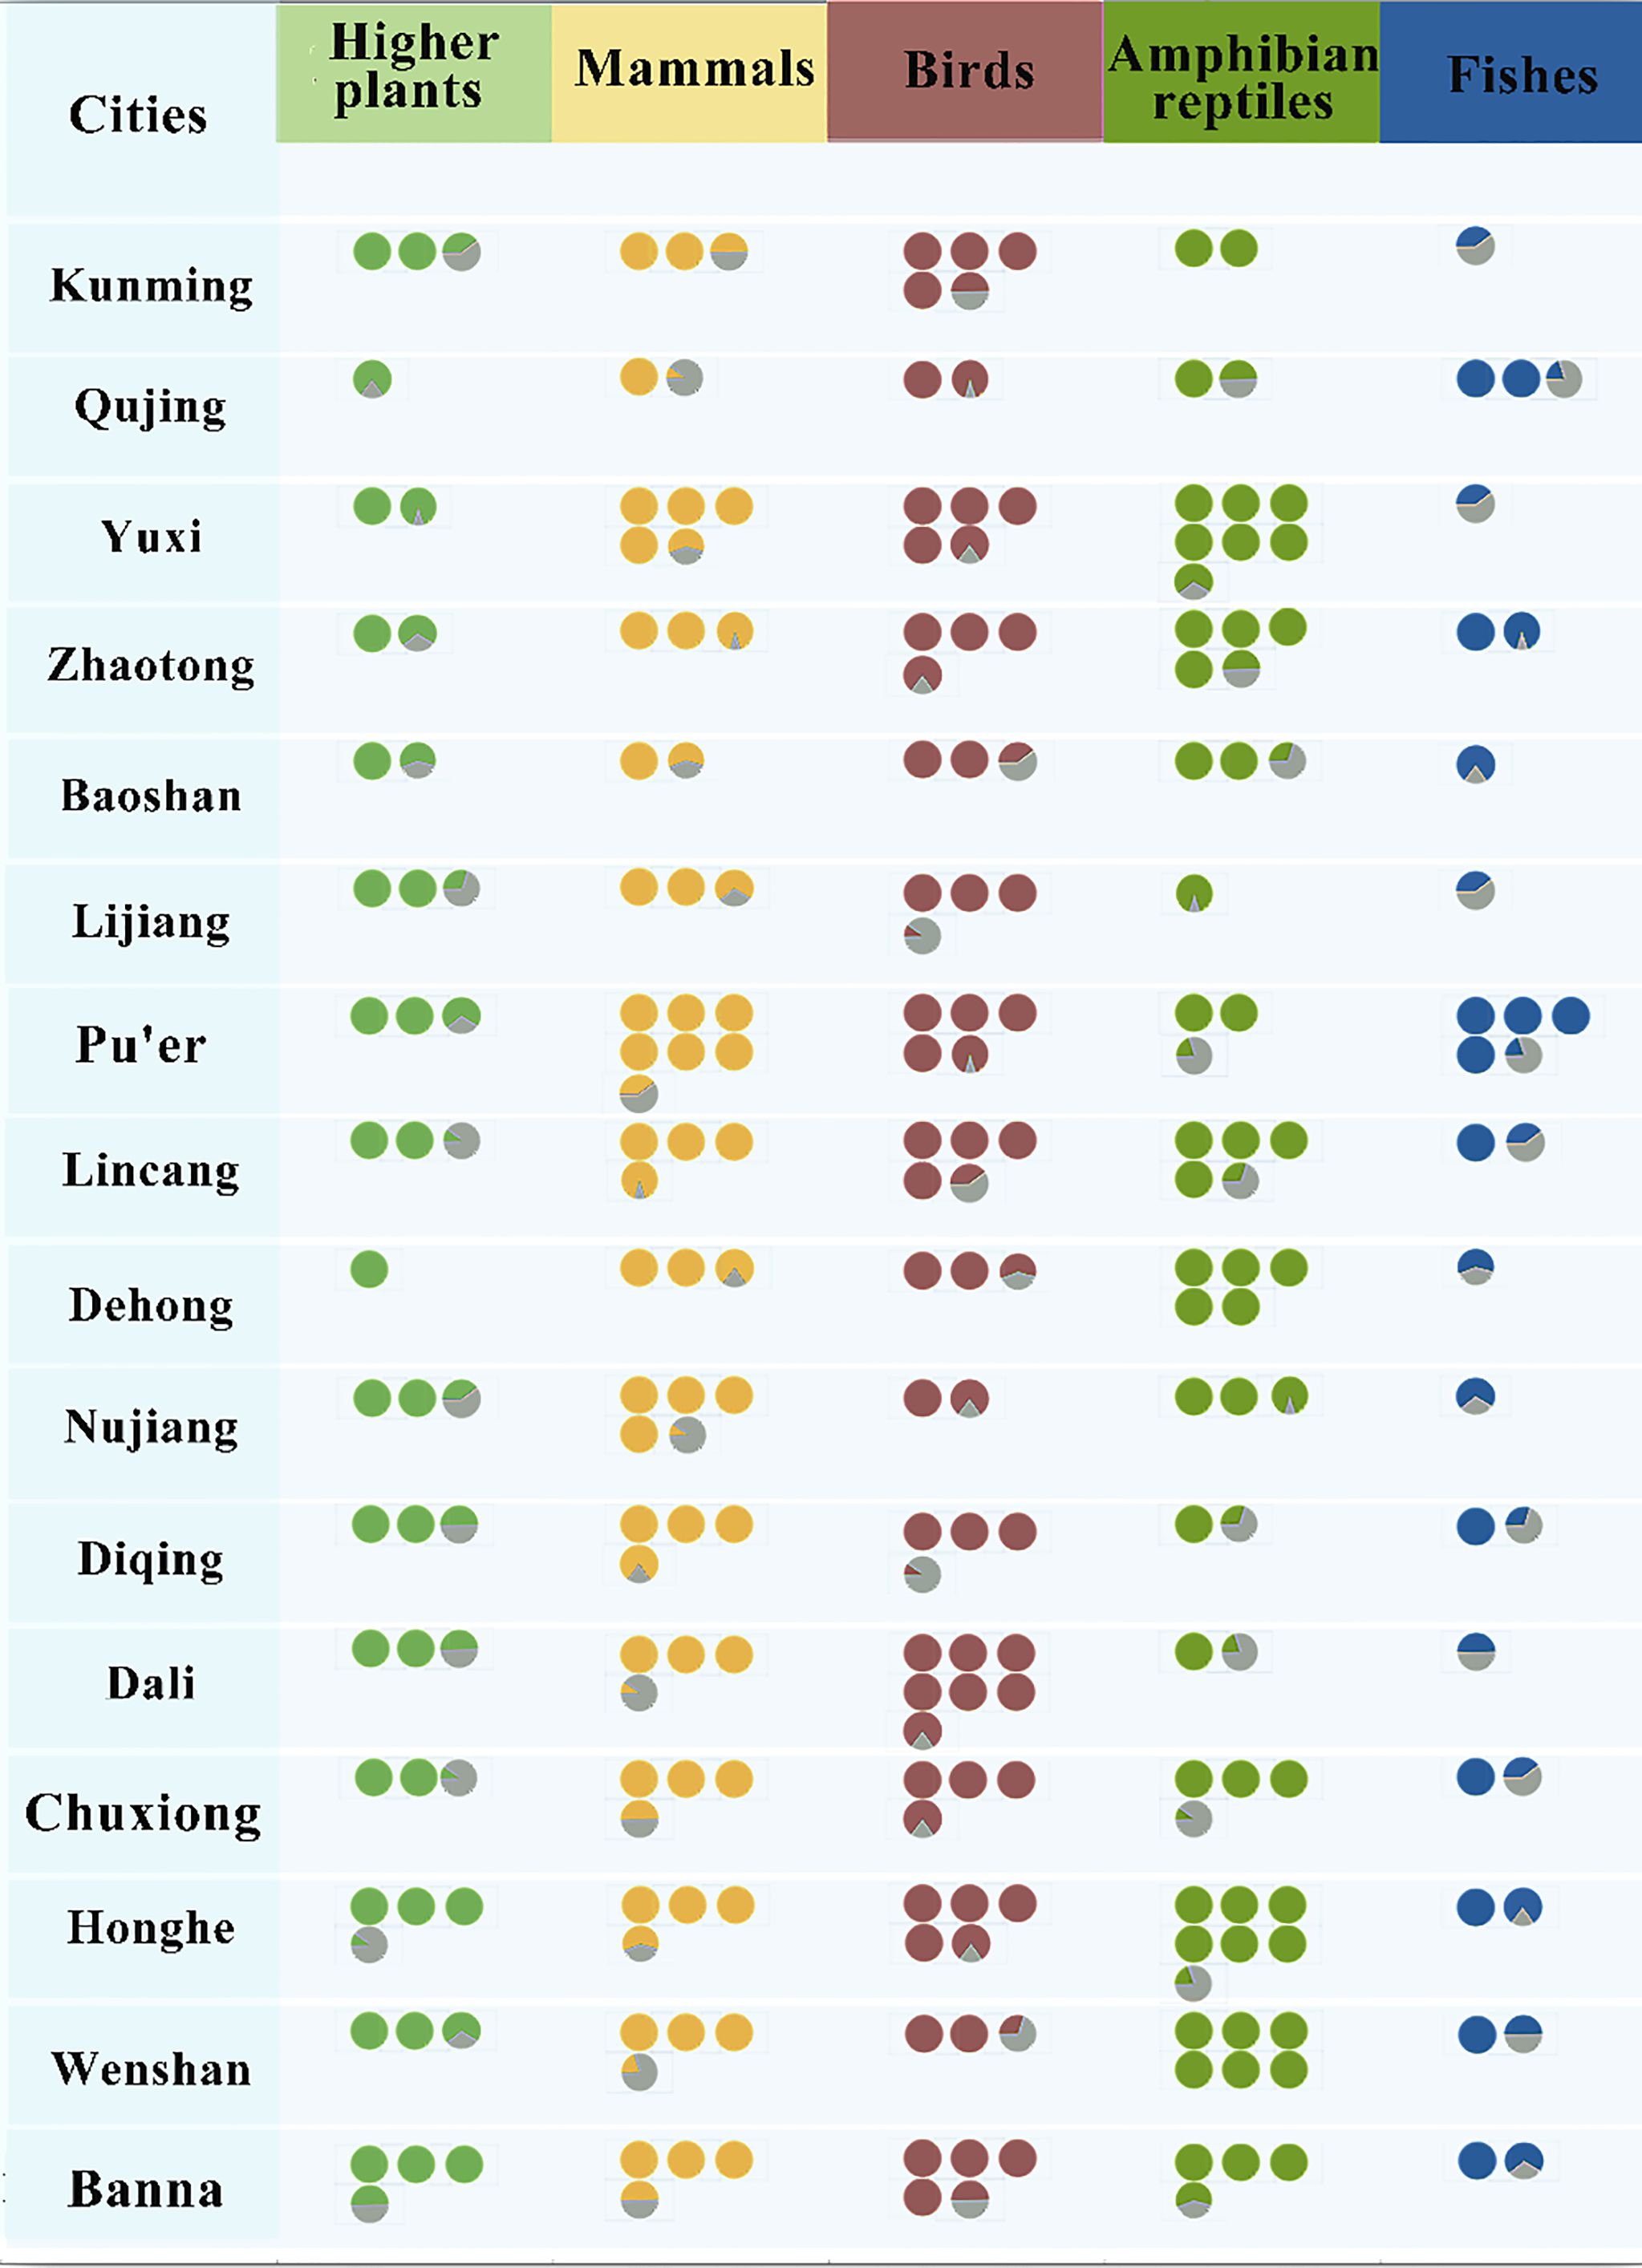
Figure 2. Relative abundance of species in each city and prefecture of Yunnan province. The color of light green, orange, brown, dark green and blue represent vascular plants, mammals, birds, amphibian reptiles and fishes respectively, the number of circle represents the proportion (%) to the total number of species in Yunnan, in which one circle represents 10%. (Kunming represents Kunming City; Qujing represents Qujing City; Yuxi represents Yuxi City; Baoshan represents Baoshan City; Zhaotong represents Zhaotong City; Lijiang represents Lijiang City; Pu’er represents Pu’er City; Lincang represents Lincang City; Chuxiong represents Chuxiong Yi Autonomous Prefecture; Honghe represents Honghe Hani and Yi Autonomous Prefecture; Wenshan represents Wenshan Zhuang and Miao Autonomous Prefecture; Banna represents Xishuangbanna Dai Autonomous Prefecture; Dali represents Dali Bai Autonomous Prefecture; Dehong represents Dehong Dai and Jingpo Autonomous Prefecture; Nujiang represents Nujiang Lisu Autonomous Prefecture; Diqing represents Diqing Tibetan Autonomous Prefecture).
3.2 Assessment of biodiversity PSR indicators
3.2.1 Biodiversity state index
The biodiversity state indicators of the 16 cities and prefectures in Yunnan province showed a spatial pattern of decreasing from southwest to northeast, among which Honghe had the highest biodiversity state indicator score of 3.96 (Figure 3). In terms of secondary indicators of biodiversity state, Honghe had the highest animal richness index and ranked second in plant richness, with 5,953 species of vascular plants, second only to Banna (6,774 species). In addition, Honghe’ s functional diversity score ranked second in the province, reaching 1.59. The biodiversity state indicator scores of Honghe, Nujiang, Banna, Pu’er and Diqing were all above 3 (Figure 3), with Nujiang ranking first in both functional diversity and ecological integrity (Figure 4), while the biodiversity state indicator scores of the other cities and prefectures were all below 3. Qujing had the lowest biodiversity state indicator score of 1.31, with the lowest number of plant species among all cities and prefectures, only 1,623 species, and its animal richness index and the number of nationally protected species were also lower than those of other cities and prefectures.
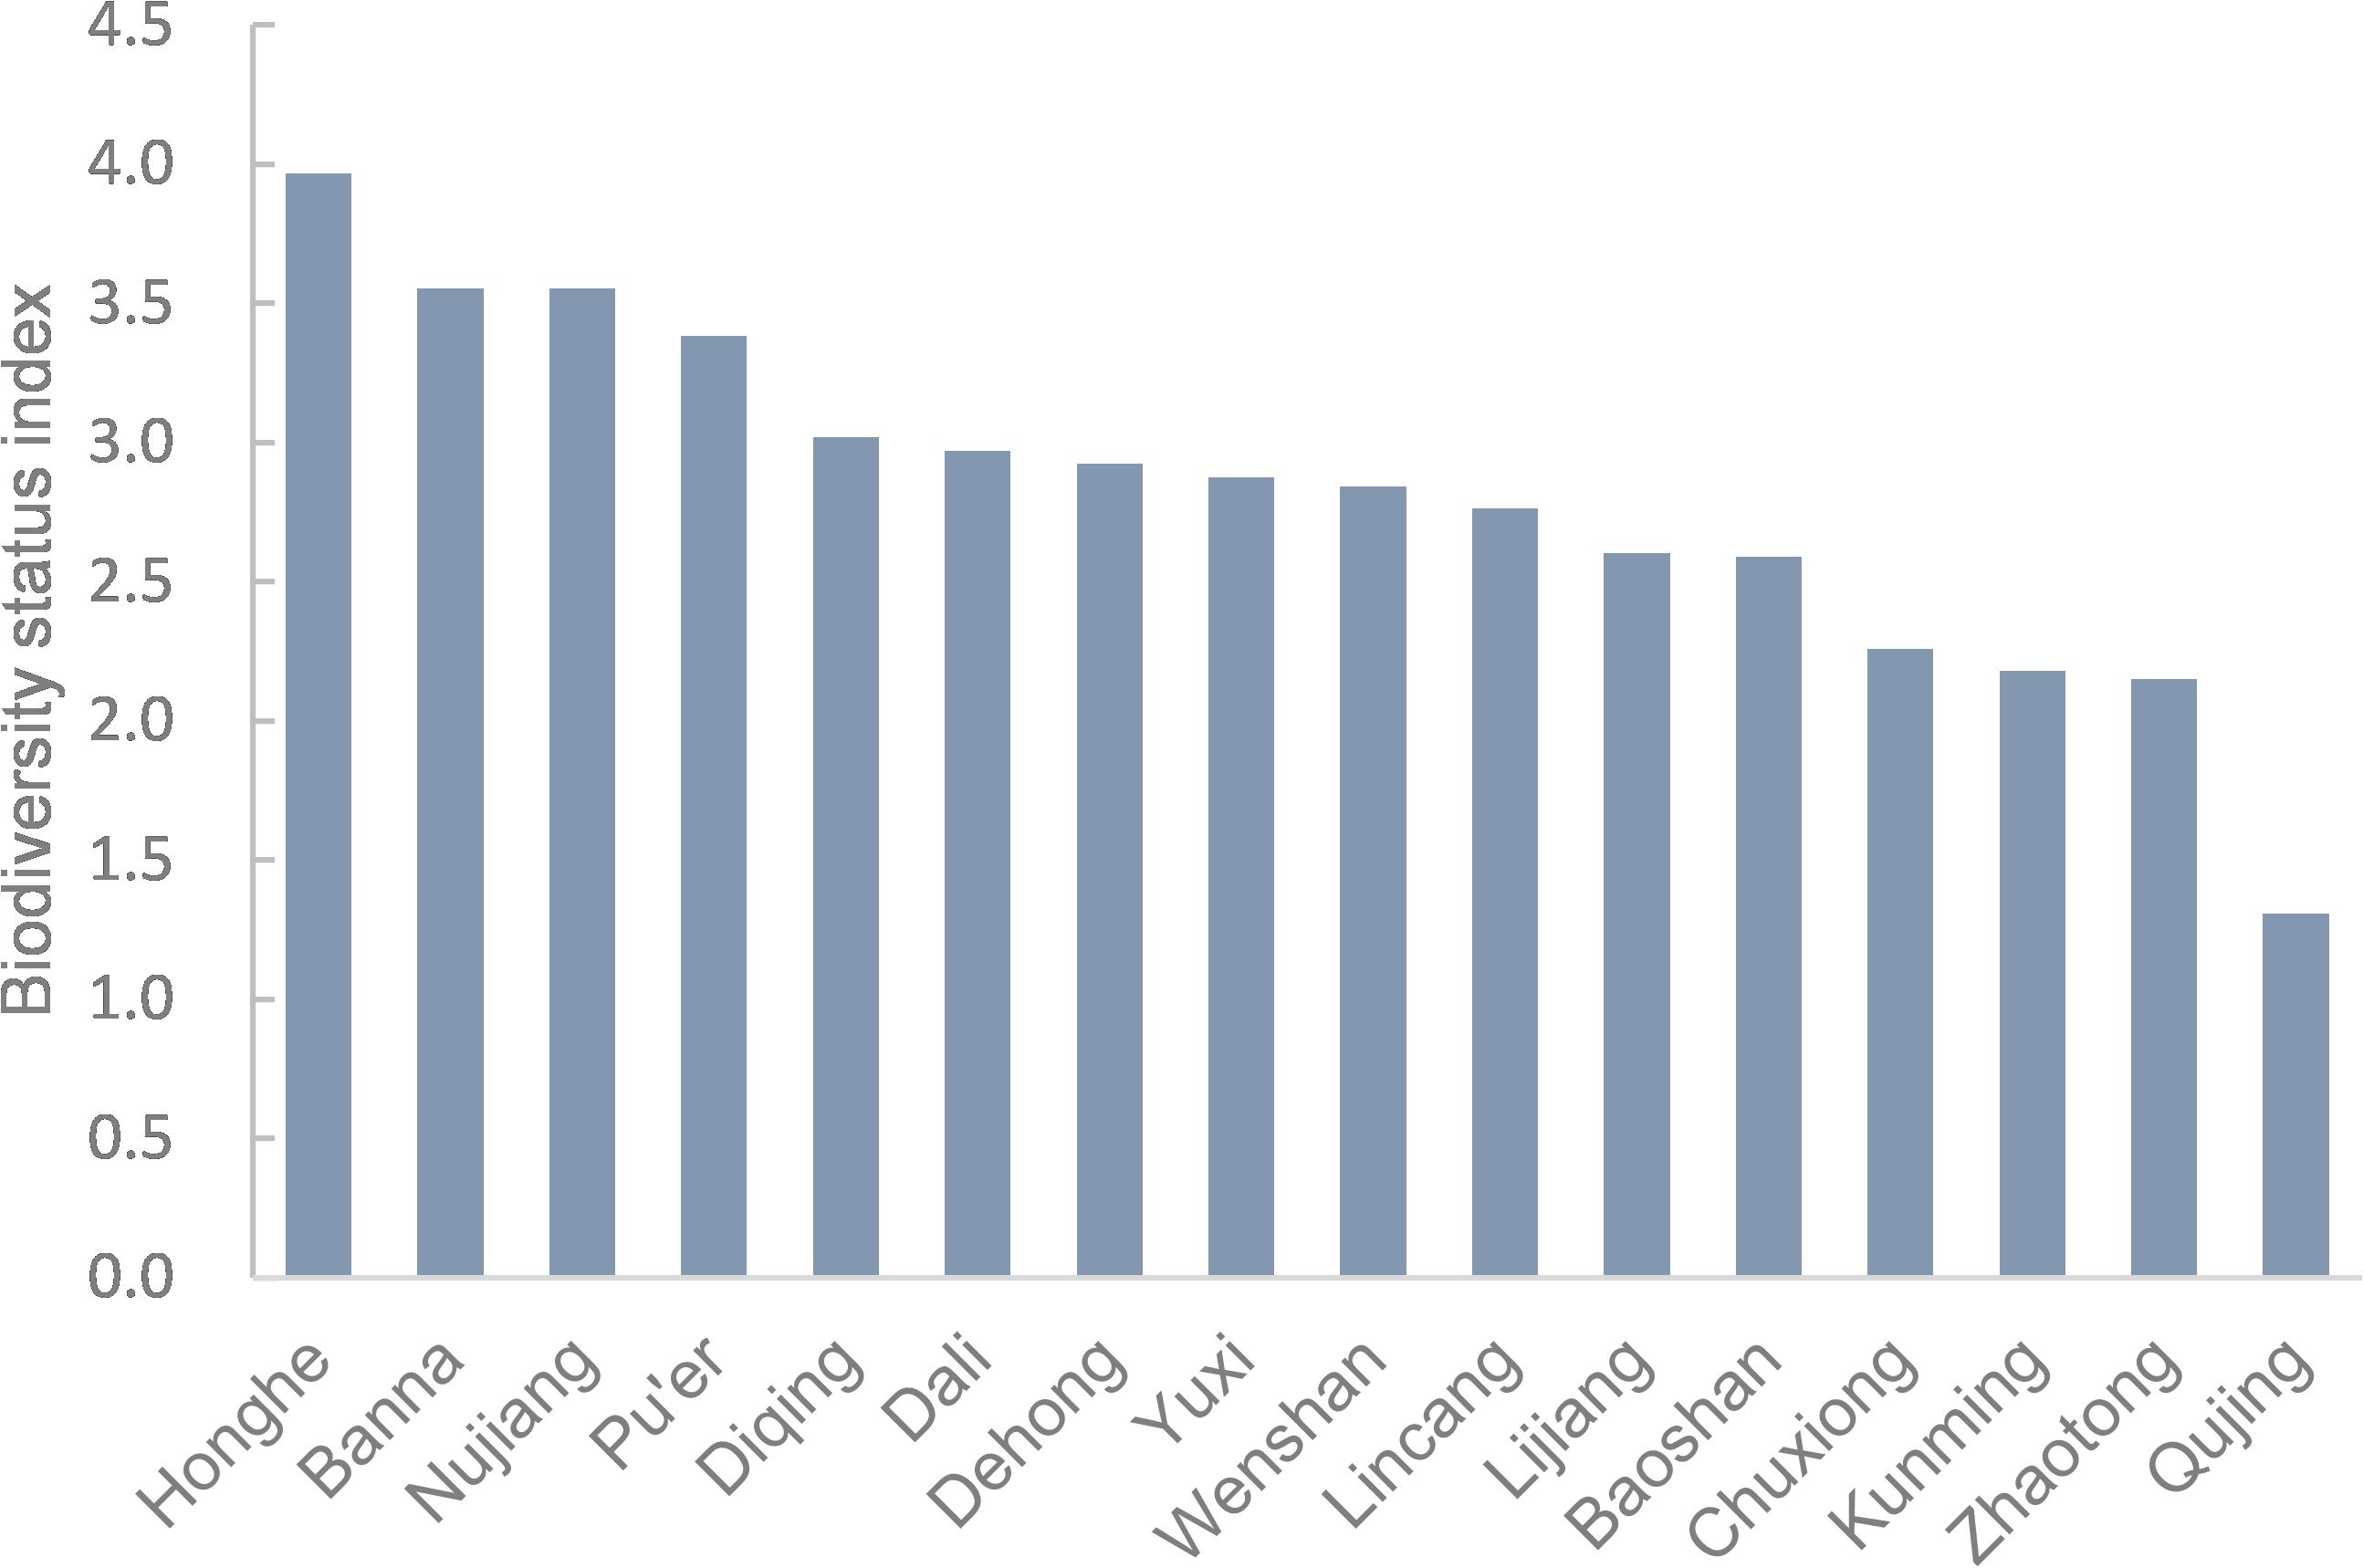
Figure 3. Biodiversity state index in each city and prefecture of Yunnan Province.
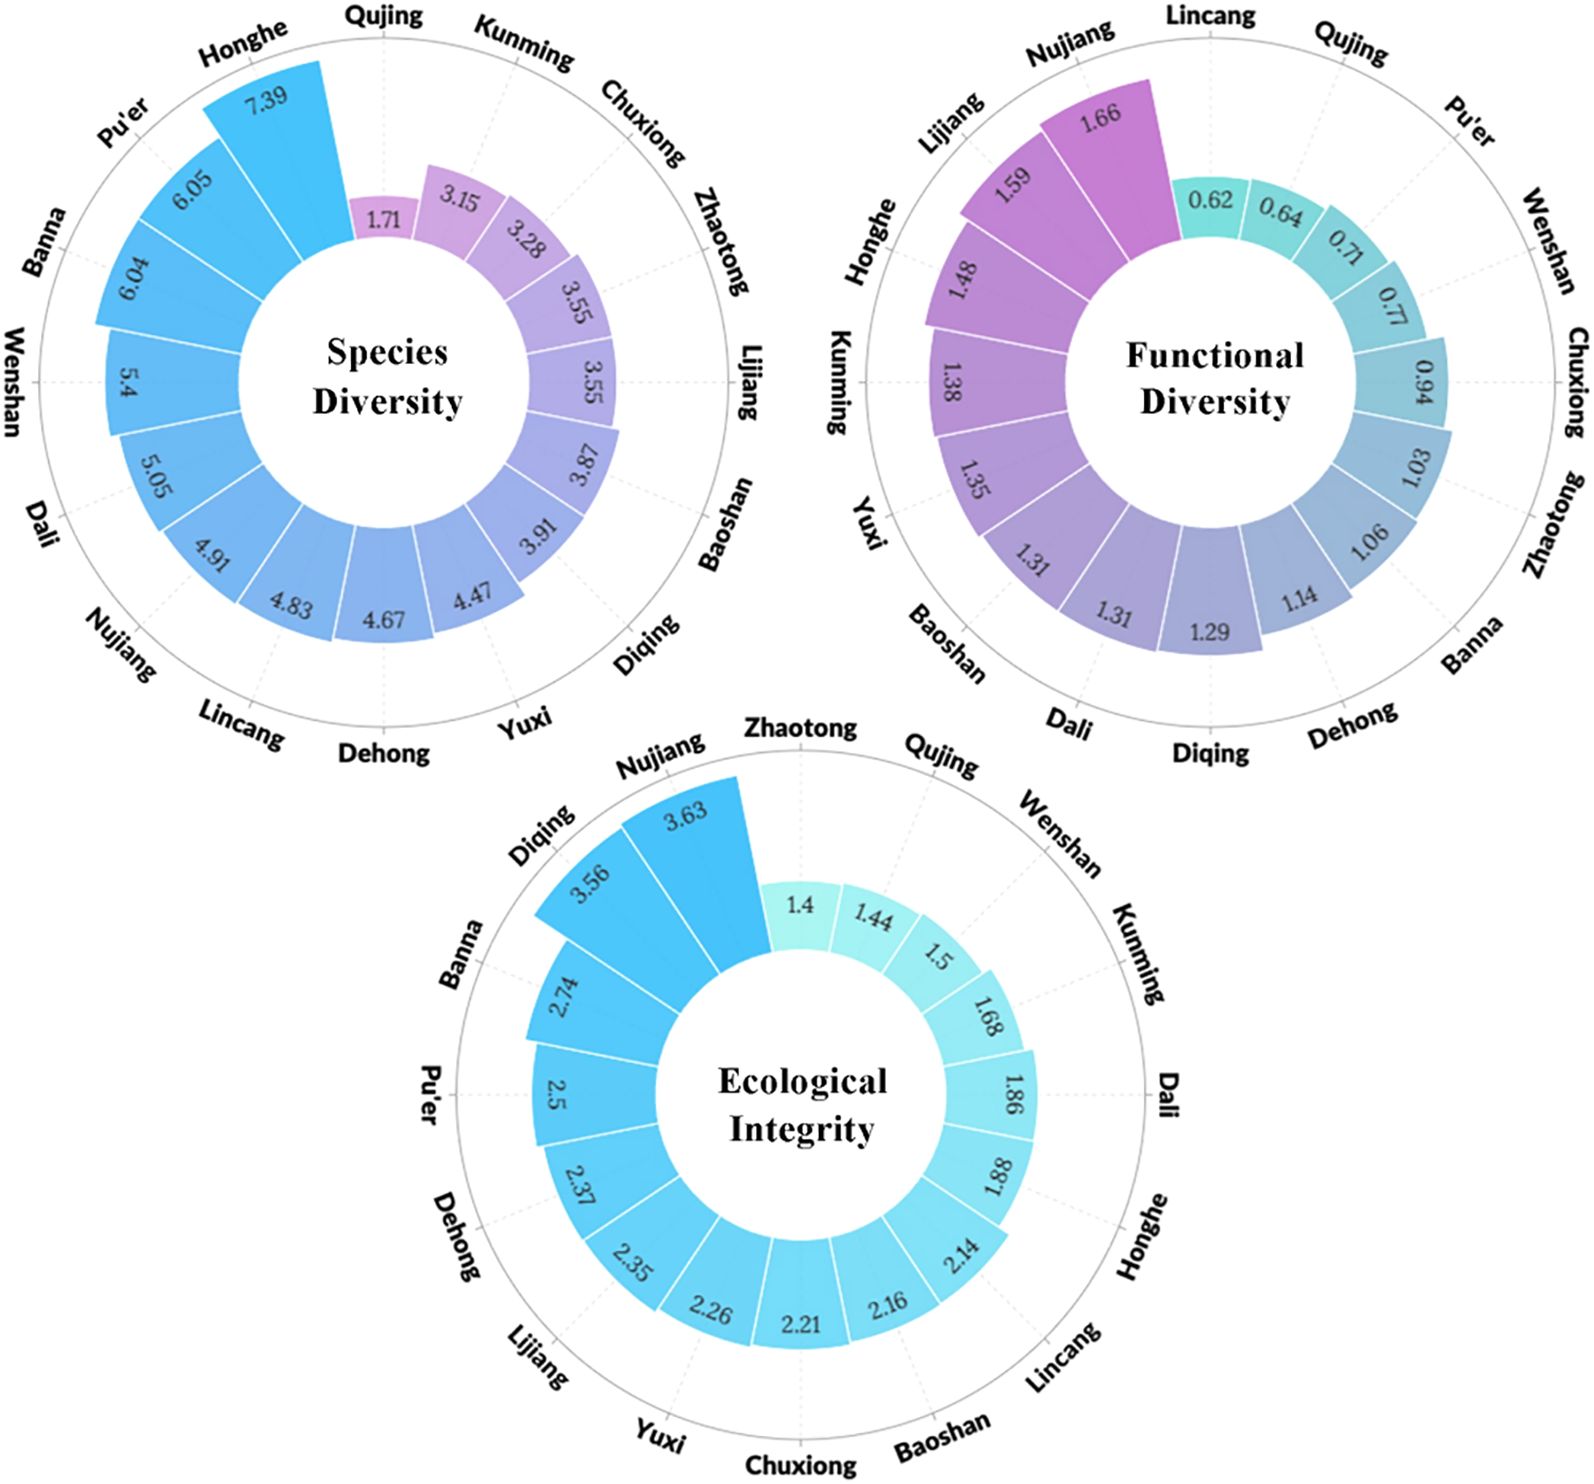
Figure 4. Composition of biodiversity state index in each city and prefecture of Yunnan province.
3.2.2 Biodiversity pressure index
The biodiversity pressure in Yunnan Province was mainly concentrated in the central and eastern regions. The biodiversity pressure index for Kunming, Yuxi, Qujing and Honghe in 2020 were 2.21, 1.66, 1.49 and 1.36 respectively. Kunming had the highest population density, intensity of land development, annual number of fires, and pollutants emission per unit area among all cities and prefectures, with a biodiversity pressure indicator score significantly higher than that of other cities and prefectures. Yuxi, Qujing, and Honghe had high level of economic development, followed by high degree of human disturbance, and biodiversity conservation was also under the considerable pressure. Zhaotong was located in the upper reaches of the Chishui River basin, with significant topographical fluctuations and unstable natural conditions, facing a high risk of natural disasters, and its biodiversity pressure indicator score exceeds 1. The biodiversity pressure index for the remaining cities and prefectures was less than 1. Diqing had low human activity intensity, with the lowest biodiversity pressure score among all 16 cities and prefectures, only 0.32 (Figure 5).
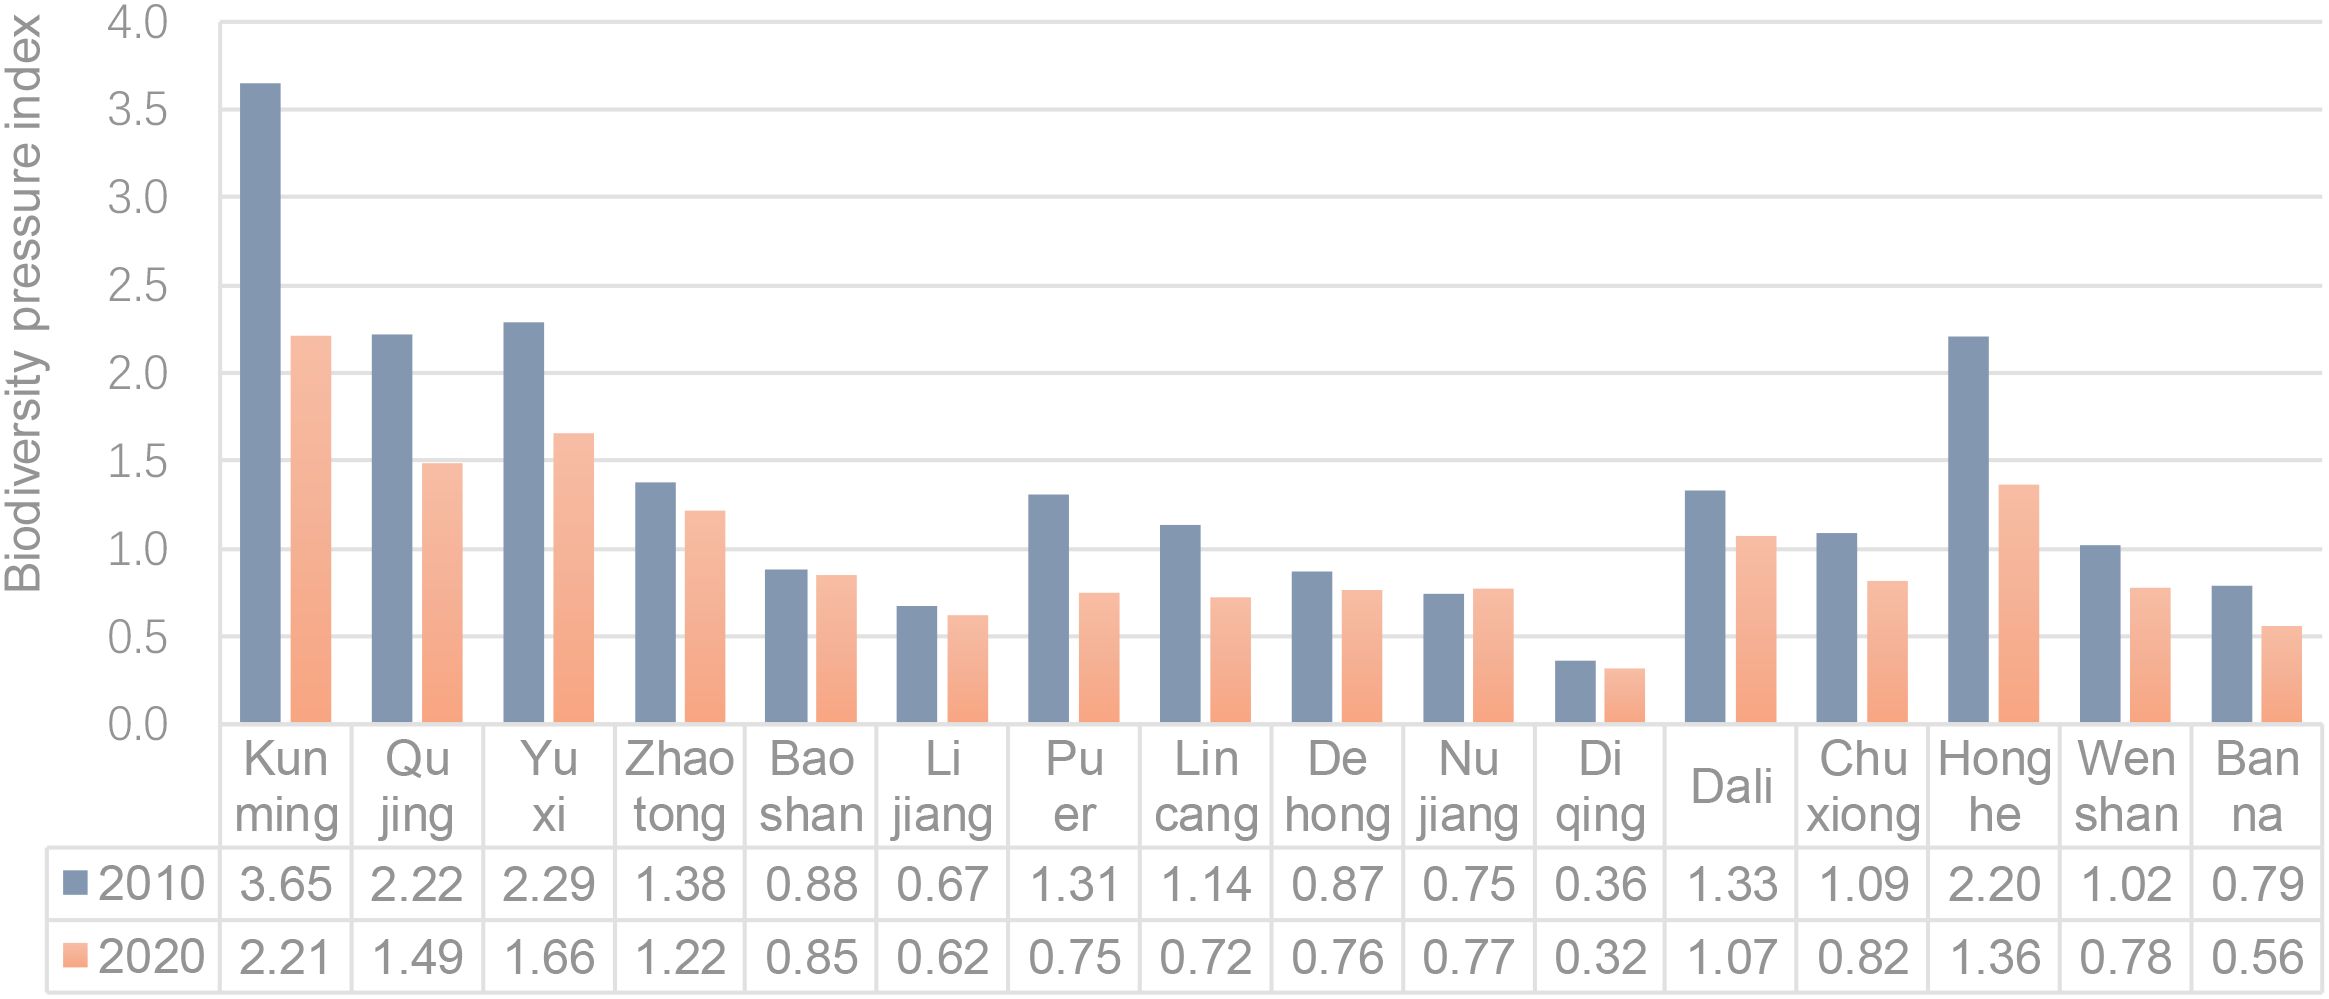
Figure 5. Biodiversity pressure index in each city and prefecture of Yunnan province.
In terms of changes in biodiversity pressure, the provincial pressure index had decreased by 19% from 2010 to 2020, while the population density in Yunnan had increased by 6.15%, the intensity of construction and development had increased by 40.6%, and the intensity of human activities had grown by 30%. However, the management level had significantly improved, the number of wildfires and the intensity of pollutants emission had decreased significantly, and the environmental quality had noticeably improved, in 2020, there were 53 fires in Yunnan Province, a 90% decrease from 2010, also the emission intensity of environmental pollutants dropped significantly, and the environmental quality was notably improved, with the province’s average environmental pollution index decreased by 37%, leading to an overall downward trend in biodiversity protection pressure. Nujiang was the only region in Yunnan Province where the pressure index had increased, due to the increase in the human activity index and environmental pollution index in 2020 compared to 2010, as well as a higher score for the natural disaster index. Analysis of variance (ANOVA) was used to compare the difference of pressure index in 2010 and 2020, and the results showed that there was a significant difference in biodiversity pressure index between 2010 and 2020 (p< 0.01).
3.2.3 Biodiversity response index
The regions in Yunnan province with high biodiversity response index were mainly in the northwest, specifically Diqing and Nujiang, with scores of 1.46 and 1.44, respectively. Diqing ranked second in both the biodiversity conservation index and public participation index in the province, and its conservation funding index ranked fifth in the province, resulting in the highest overall score. Nujiang had high scores in biodiversity conservation and conservation funding, but due to low public participation and sustainable management, its biodiversity response index score was lower than that of Diqing. Lincang had low scores in biodiversity conservation, sustainable management, public participation and conservation funding input, leading to the lowest biodiversity response index score in the province, which was 0.61 (Figure 6).
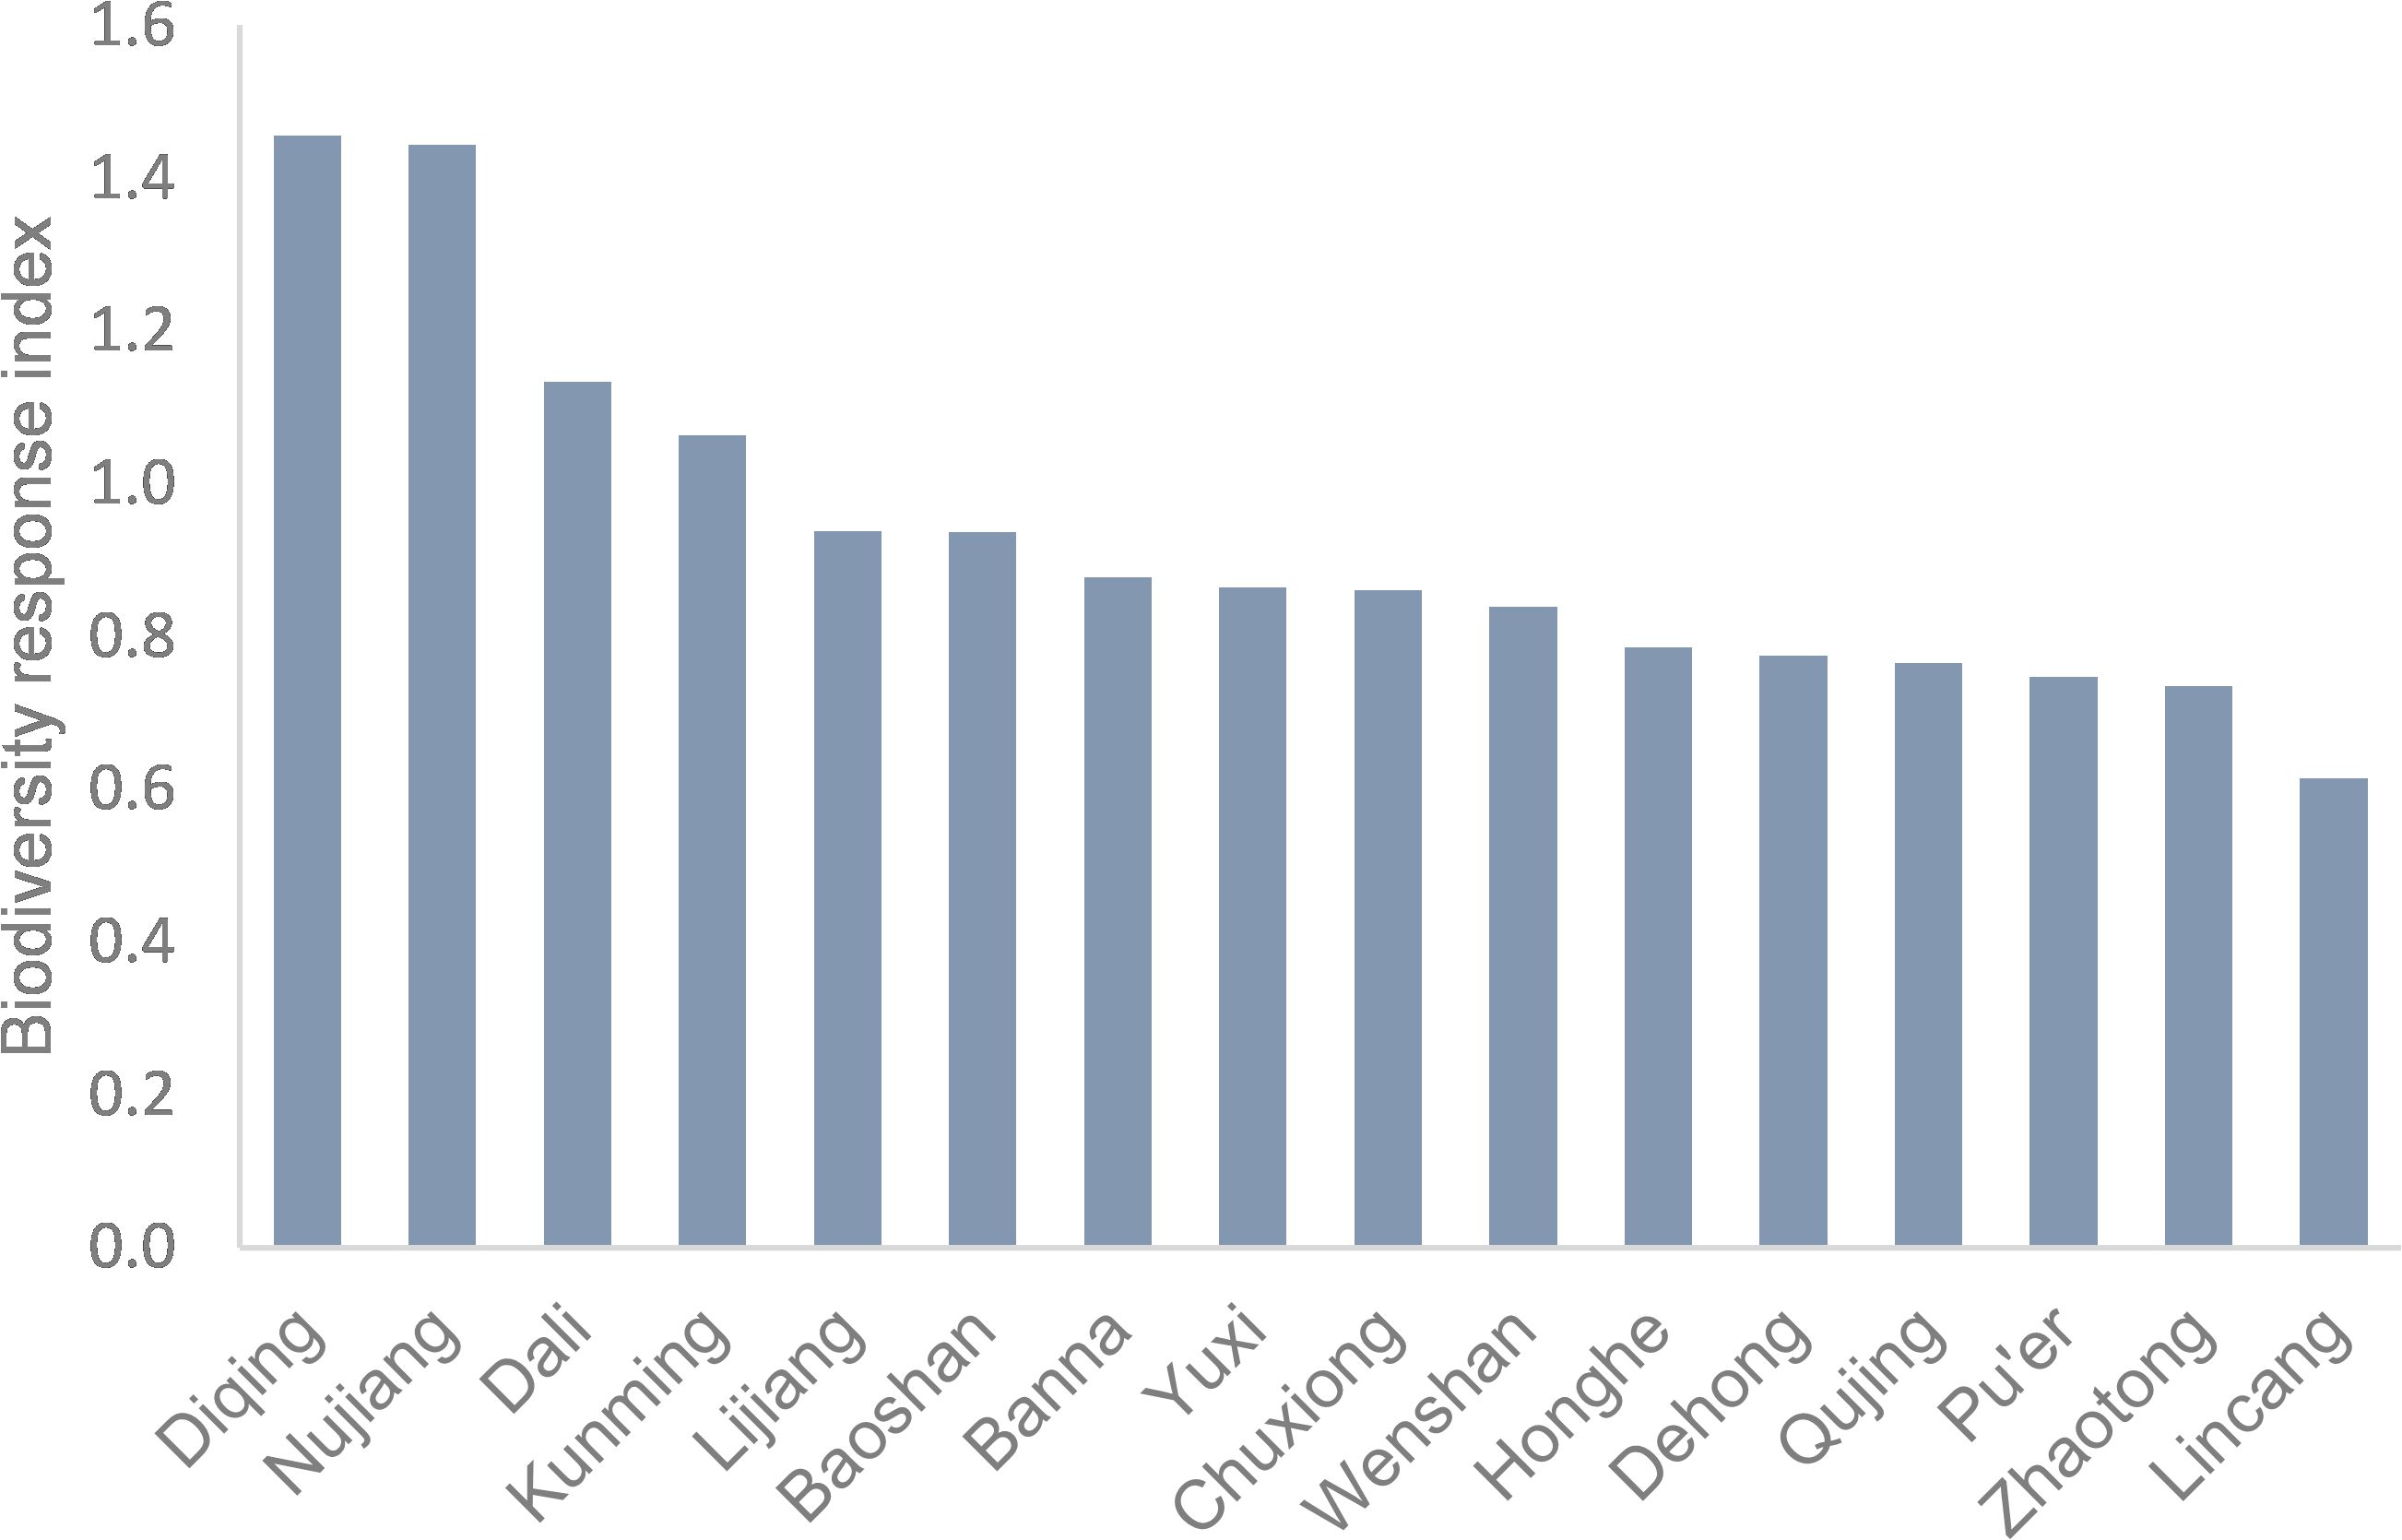
Figure 6. Biodiversity response index in each city and prefecture of Yunnan province.
The biodiversity response of 16 cities and prefectures showed different characteristics due to different causes. Diqing and Nujiang had higher biodiversity response scores mainly due to the larger area of ecological protection in the region. Dali and Kunming performed well in terms of protection index and sustainable management index, with biodiversity response index scores greater than 1. Zhaotong and Baoshan, which ranked first in the conservation funding and public participation respectively, performed poorly in other indices. In general, the biodiversity response indexes of most cities and prefectures were less than 1 (Figures 6 and 7), which represents that the provincial endeavor on financial input and public participation in biodiversity conservation was still insufficient.
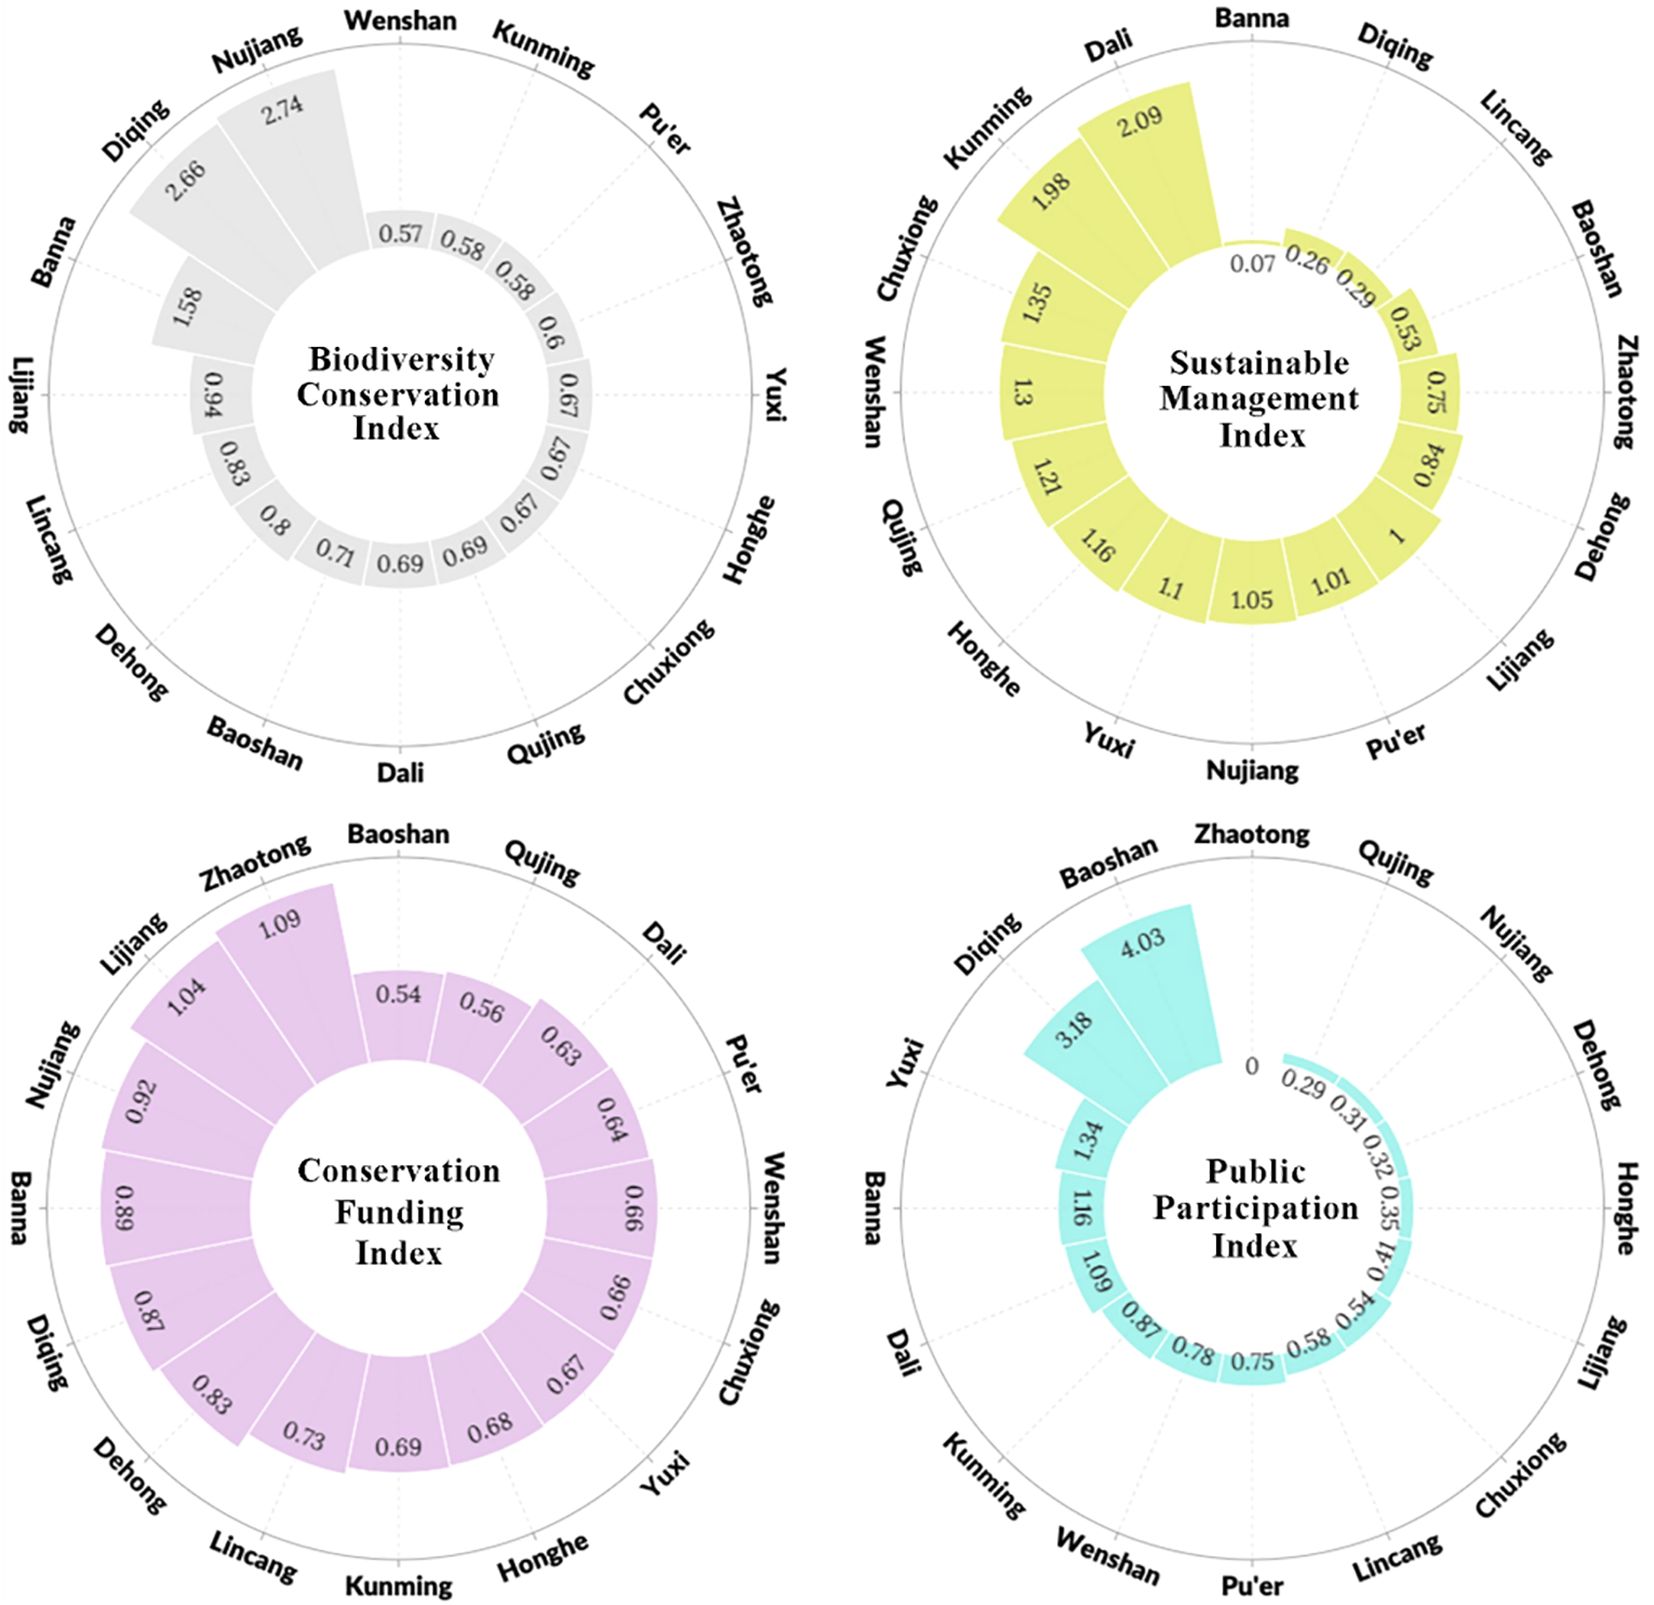
Figure 7. Composition of response index in each city and prefecture of Yunnan province.
3.3 Comprehensive assessment of biodiversity
Among the 16 cities and prefectures, Nujiang showed the highest comprehensive biodiversity index of 4.22, followed by Diqing and Banna with 4.16 and 3.87, respectively (Figure 8). Among them, Nujiang and Banna had relatively high biodiversity state index, inferior only to Honghe, ranking first in the province; Diqing, which had better environmental quality, showed the lowest biodiversity pressure index, and its response index was second only to Nujiang, which ranked top in the province. The comprehensive biodiversity index of Qujing and Kunming ranked last in the province, with scores around 1. Qujing had the lowest biodiversity state index, and its response index was also among the lowest in the province, with a high pressure index, resulting in its bottom position for comprehensive score. The biodiversity pressure score of Kunming was much higher than that of other cities and prefectures, and the scores for state and response were generally average, resulting in a lower comprehensive score.
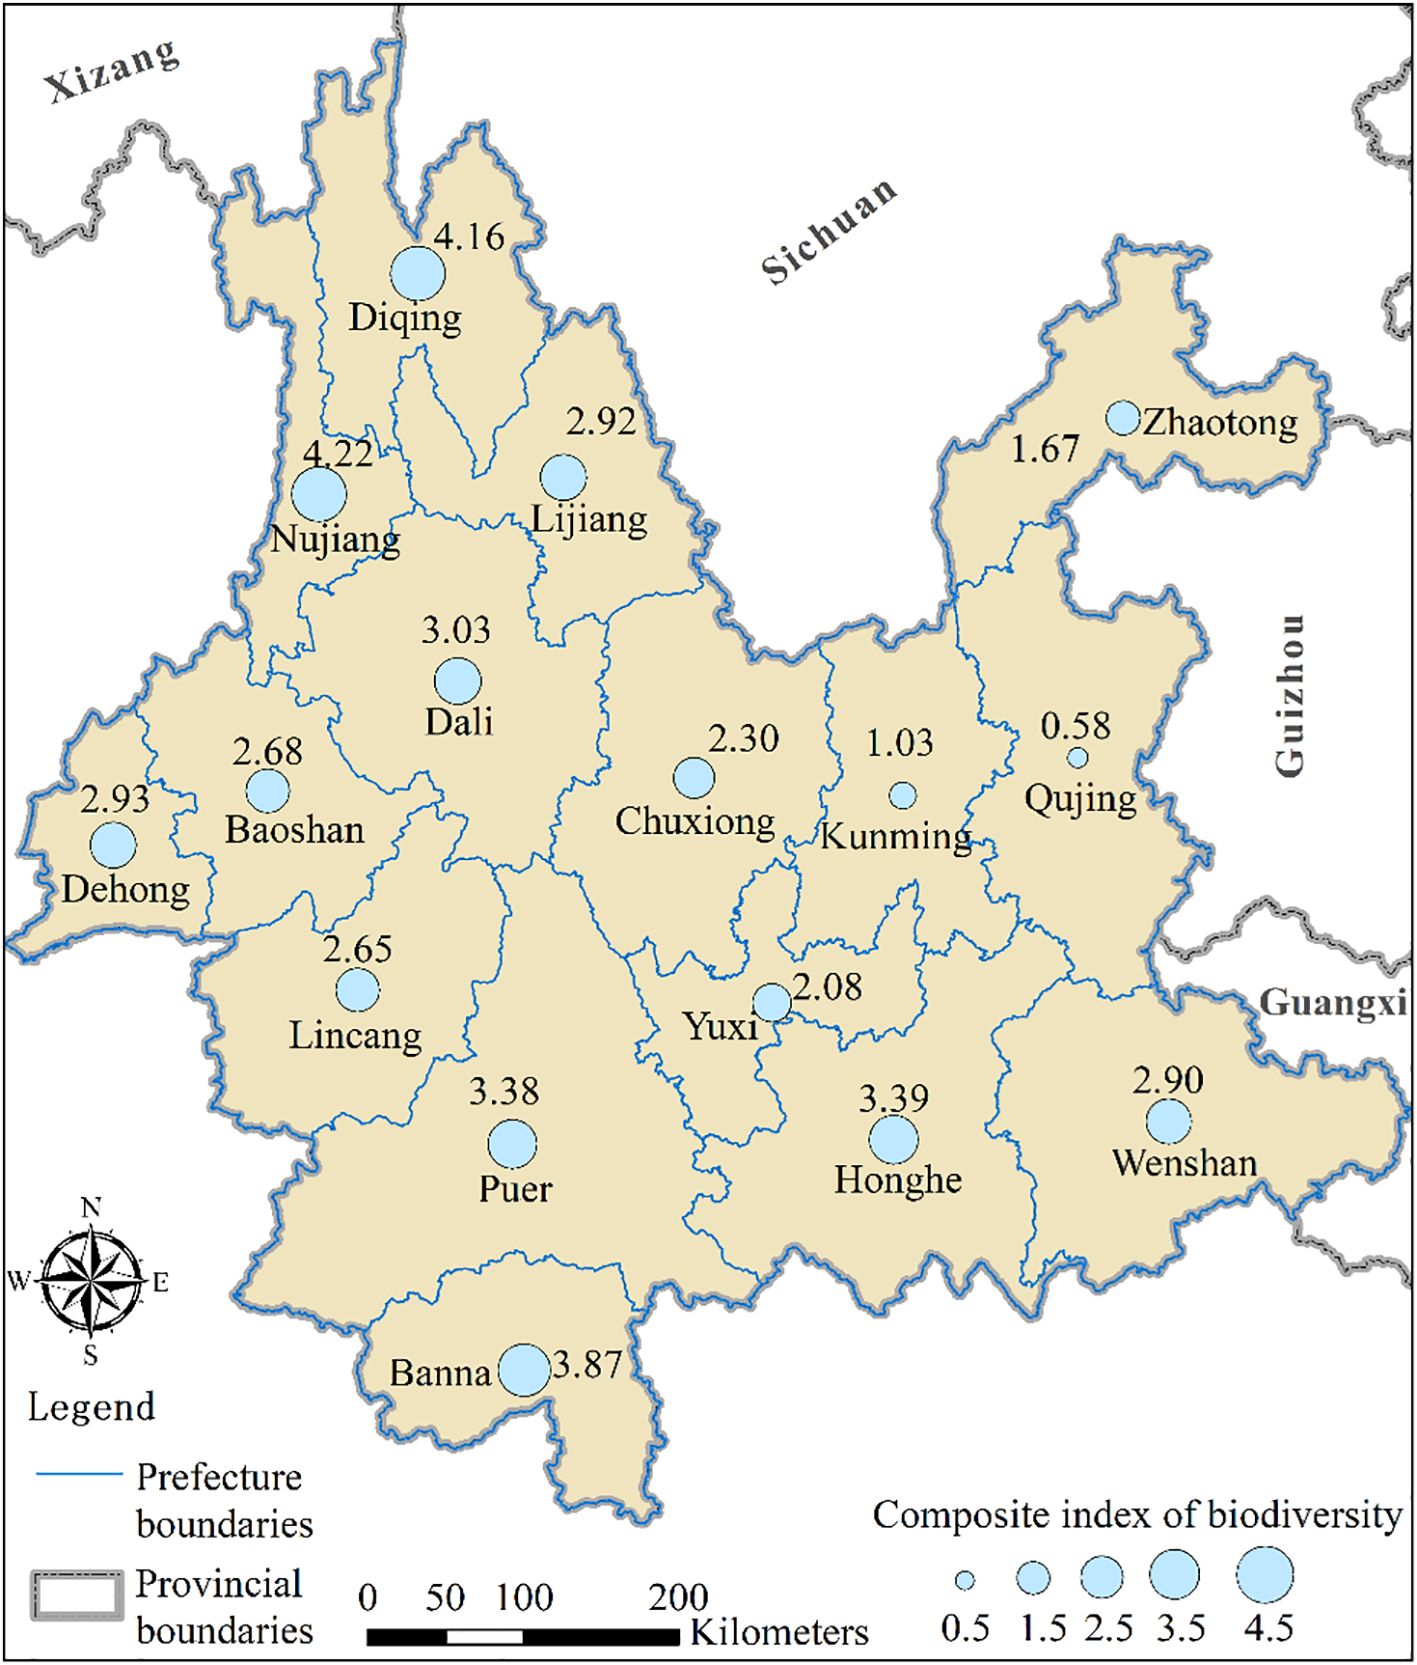
Figure 8. Comprehensive index of biodiversity in each city and prefecture of Yunnan province.
4 Discussion
4.1 Biodiversity assessment methods and reliability
As the core of ecosystem function, biodiversity is facing the dual pressures of climate change and human activities. The key of biodiversity conservation was to develop accurate and efficient biodiversity assessment methods (Altermatt et al., 2025). In recent years, biodiversity assessment techniques have undergone a paradigm shift from traditional field surveys to multi-source data fusion, and a variety of methodological systems have emerged. However, there was a lack of a unified methodological standard for biodiversity assessment, due to differences in evaluation objects, scales, and selected indicators (Hu et al., 2024). The Economics of Ecosystems and Biodiversity (TEEB) was a comprehensive methodological framework for assessing, demonstrating, and applying the value of biodiversity and ecosystem services, led by the United Nations Environment Programme, which aimed to monetize the services and products provided by forests, wetlands, farmlands, grasslands and other ecosystems through the valuation of ecosystem services, and to promote the incorporation of the economic value of biodiversity and ecosystem services into decision-making (Kumar, 2011). The United Nations Statistics Division developed the Ecosystem Accounting (EA) based on the System of Environmental-Economic Accounting (SEEA), proposing indicators for habitat conservation services and establishing a Species Accounting Thematic Account (United Nations, 2021). The Project Report Building a Multidimensional Biodiversity Index: A Scorecard for Biodiversity Health published by the United Nations Environment Programme, World Conservation Monitoring Center proposed a conceptual framework for the assessment of a multidimensional biodiversity index, describing the selection and assessment methods for the multidimensional biodiversity index, and suggested evaluating biodiversity health using welfare economics algorithms, integrating various aspects of biodiversity on a comprehensive scale, and establishing a methodological system for measuring biodiversity health at the national level (Soto-Navarro et al., 2020).
The biodiversity assessment systems established in the Aichi Biodiversity Targets of the Convention on Biological Diversity and the United Nations Sustainable Development Goals were all based on the theory of the PSR. The PSR model considered the intrinsic process relationship between humans and the environment and could be applied to regional environmental sustainability research. Some studies had used this method to conduct biodiversity assessments, verifying the feasibility of this method for biodiversity assessment (Tu et al., 2022; Li et al., 2022). The PSR conceptual framework had also been used to construct the biodiversity assessment indicator system of the Kun-meng Framework (Zhu et al., 2025).
In this paper, a comprehensive assessment of Yunnan province, one of the regions with the richest biodiversity resources in China, was carried out by constructing a PSR assessment system. The PSR system comprehensively considered the interactive relationship between biodiversity protection and socio-economic development, effectively identifying the current state of biodiversity, the pressures it faces, and the level of conservation and financial support. It could provide a scientific basis for the management and protection of biodiversity and be applied to the comprehensive assessment of biodiversity in similar regions from the international perspective.
4.2 Biodiversity conservation in Yunnan is under great pressure
Located at the southeastern edge of the Qinghai- Xizang Plateau, Yunnan is crisscrossed by mountain ranges with complex terrain and numerous water systems, spanning 8 latitudinal zones and 7 climate types (Department of Ecology and Environment of Yunnan Province, 2021). The elevation difference between high mountains and low valleys reaches 4000 to 5000 meters. Its unique geographical location, complex topography, and diverse climatic conditions have nurtured Yunnan’s rich biodiversity. Studies showed that the elevation and geographic location were the main environmental gradients influencing the species composition of communities, the complex geological history had profoundly shaped the intricate terrain and landforms in Yunnan, which providing unique environmental conditions for its biodiversity with most species have small distributions or small population sizes (Sherman et al., 2007; Li et al., 2024). This study showed that the biodiversity in Yunnan Province is higher than the national average, with the number of national key protected animals and national key protected plants in the province being 4.93 times and 7.96 times the national average, respectively. Among them, Nujiang in the northwest, and Honghe, Xishuangbanna and Pu’er in the south showed particularly high biodiversity state index, ranked among the top four in the province.
The unique natural and geographical conditions that endow Yunnan with rich biodiversity, but also cause its strong vulnerability, manifested in small population sizes, few individual numbers, narrow geographical distribution, small distribution area, low ecological adaptability, and high sensitivity to external disturbances. In case of natural disasters or human damage, it is easy to fall into an endangered situation or even become extinct. These objective reasons have led to a wide range of inputs and difficulties in Yunnan’s biodiversity conservation. Based on eight site-level case studies, the research in northwest Yunnan found that livelihood activities such as agricultural production, livestock grazing, and the collection of fuel wood are the main driving forces of biodiversity loss, and changes in demography, market conditions, resource tenure policies and development policies and projects also were underlying factors (Xu and Wilkes, 2004). Study had integrated socio-economic and environmental factors to construct a “Pressure-State-Response” (PSR) model, analyzed the historical changes in environment and biodiversity in Yunnan Province, and obtained a comprehensive indicator value of 38.8 points for biodiversity in Yunnan Province, which has not reached a moderate level (Yang et al., 2004).
This study conducted a comprehensive assessment of biodiversity in the 16 prefectures and cities of Yunnan Province. The results showed that although the pressure on biodiversity conservation in Yunnan generally alleviated during the period from 2010 to 2020, with the pressure index decreasing by 19% in 2020 compared with 2010, specifically, the number of fires decreased by 90%, and the environmental pollution index dropped by an average of 37%. Over the past decade, the national and local governments have enacted and implemented a series of environmental protection and pollution control policies. The State Council issued the Air Pollution Prevention and Control Action Plan (implemented in 2013) and the Water Pollution Prevention and Control Action Plan (implemented in 2015), the effective control of pollutant emissions contributed to the improvement of urban air quality and the increase of the proportion of water bodies with good quality nationwide. The Implementation Plan for Comprehensive Strengthening of Ecological and Environmental Protection and Resolute Fight the Battle to prevent and control Pollution (issued in 2018) developed specific measures for the three major defense battles of “Blue Sky, Clear Water, and Clean Soil”, and established specific targets for pollution control and environmental improvement. Yunnan Province had implemented a range of local biodiversity conservation regulations and pollution control measures. Among them, the 13th Five-Year Plan for Economic and Social Development of Yunnan Province (2016–2020) identified Pollution Control and biodiversity conservation as key tasks. The implementation of these regulations, planning and policies had effectively reduced pollution emissions as PM10, SO2, NOx, wastewater and solid waste which promoted the overall reduction of biodiversity pressure index inclusive of the annual average concentration of PM10 and the proportion of inferior Class V water, etc. However, due to the high intensity of anthropogenic interference, the intensity of construction and human activity in Yunnan Province increased by 40.6% and 30% respectively From 2010 to 2020, which still posed potential threats pressure on biodiversity conservation in Yunnan.
The gross economic output of Yunnan Province was still relatively low, in 2020, its per capita GDP ranked 9th from the bottom nationwide (National Bureau of Statistics, 2021) and a considerable number of people have just reached the poverty alleviation threshold set by the Chinese government, with an annual income of 570 dollar. Economic and social development still faced the challenge of transforming resource advantages into economic and development advantages. In terms of reducing the impact of driving factors, especially anthropogenic interference, biodiversity conservation in Yunnan still faces many challenges.
4.3 Limitations
Biodiversity assessment based on PSR has a complex and multidimensional evaluation system, including multidimensional indicators and data involving natural environment and socio-economic conditions related to state, pressure and response. For this study, due to the lack of basic data, species diversity assessment has not yet been extended to groups such as insects and microorganisms, limiting the assessment accuracy.
Researchers had pointed out that phylogenetic diversity data were often used in biodiversity assessment (Zhang et al., 2025). While for the biodiversity state analysis of the current study, only the total number of species in each city and prefecture were available, lacking the specific quantity and distribution of each species, as well as the related genetic information, which led to the inability to conduct analyses on phylogenetic diversity, and to some extent limited the in-depth study on phylogenetic diversity and may cause certain deviation in biodiversity assessment. Future research needs to incorporate phylogenetic diversity indicators in the biodiversity assessment index system, to integrate multi-dimensional and high-resolution data of phylogenetic, taxonomic and functional and socio-economic factors to enhance the precision of biodiversity assessments.
5 Conclusion and recommendations
Based on the PSR model, this study assessed the biodiversity of each city and prefecture in Yunnan Province from the perspectives of the state, the pressures faced, and the degree of conservation input of biodiversity. The comprehensive biodiversity index of Yunnan province showed great spatial variability, with high values occurring mainly in the northwestern and southwestern regions, which had good natural resource conditions and were less affected by human activities.
In terms of the comparison among the administrative regions, Honghe, Nujiang, Xishuangbanna and Pu’er ranked among the top four in the province in terms of biodiversity state index. The inherent vulnerability including the small size of the biodiversity populations, the narrow geographical distribution, the low ecological adaptive capacity and the sensitivity to external disturbances lead to the difficulty of biodiversity conservation in Yunnan province. Although the pressure index decreased from 2010 to 2020, biodiversity conservation in Yunnan was still facing significant potential pressure due to the increasing intensity of construction and human activities. The overall level of biodiversity conservation in Yunnan Province was relatively low, and there were great differences in the response of biodiversity conservation among the 16 cities and prefectures, with just Diqing, Nujiang, Dali and Kunming showing higher response scores than the average level, among them, the investment in funds and manpower for Nujiang and Diqing was still extremely insufficient. The basis of biodiversity survey, monitoring and scientific research was still weak. At the sub-provincial level, the special planning still lack overall consideration for biodiversity, and green finance provided insufficient support for biodiversity. The degree of biodiversity conservation in Yunnan province was still relatively low. To consolidate and enhance the biodiversity of Yunnan province, it was recommended:
In line with Target 1 of the Kunming-Montreal Global Biodiversity Framework “… to bring the loss of areas of high biodiversity importance, including ecosystems of high ecological integrity, close to zero by 2030”, and in the face of the risk of biodiversity loss caused by climate change and intensified human activities, Yunnan province urgently needs to improve the capacity of biodiversity conservation, development and utilization, increase the investment of funds and personnel for biodiversity conservation, and improve the biodiversity assessment and management system, conduct public education on biodiversity protection, enhance awareness among the general public, and adapt to the biodiversity protection management needs of the post-Kunming-Montreal era.
Enhance the level of biodiversity by continuously optimizing the distribution of nature reserves. For regions with good natural resource conditions but relatively fragile environments, such as Nujiang, Diqing, Pu’er, Xishuangbanna and Honghe, the integration and expansion of protected areas will enhance the functional diversity within these areas, thereby stabilizing and consolidating biodiversity state; for areas with lower species diversity state, such as Kunming, Qujing, and Chuxiong, it is necessary to increase the number of protected area nodes according to local conditions, improving biodiversity state to enhance functional connectivity and integrity.
Under the premise of ensuring ecological integrity, it is necessary to fully grasp the spatial relationship between biodiversity conservation and regional economic development, strictly implement buffer zone policy for protected areas, ensure effective space for biological activities, and develop a green low-carbon economy to reduce the interference of industrial activities and pollutant discharge on the core protected areas.
Data availability statement
The raw data supporting the conclusions of this article will be made available by the authors, without undue reservation.
Author contributions
FY: Conceptualization, Methodology, Writing – original draft, Writing – review & editing. FP: Writing – review & editing, Data curation. ZT: Writing – review & editing, Data curation. GM: Funding acquisition, Writing – review & editing. XX: Data curation, Visualization, Writing – review & editing. XZ: Resources, Writing – review & editing. PG: Methodology, Data curation, Writing – original draft, Writing – review & editing.
Funding
The author(s) declare financial support was received for the research and/or publication of this article. This study was supported by the National Natural Science Foundation of China (Grant No.: 42277491).
Conflict of interest
The authors declare that the research was conducted in the absence of any commercial or financial relationships that could be construed as a potential conflict of interest.
Generative AI statement
The author(s) declare that no Generative AI was used in the creation of this manuscript.
Publisher’s note
All claims expressed in this article are solely those of the authors and do not necessarily represent those of their affiliated organizations, or those of the publisher, the editors and the reviewers. Any product that may be evaluated in this article, or claim that may be made by its manufacturer, is not guaranteed or endorsed by the publisher.
References
Altermatt F., Couton M., Carraro L., Keck F., Lawson-Handley L., Leese F., et al. (2025). Utilizing aquatic environmental DNA to address global biodiversity targets. Nat. Rev. Biodivers. 1, 332–346. doi: 10.1038/s44358-025-00044-x
CNC-DIVERSITAS (2010). Progress in Biodiversity Conservation and Research in China (Beijing, China: China National Committee of An International Programme of Biodiversity Science).
Costanza R., d’Arge R., de Groot R., Farber S., Grasso M., Hannon B., et al. (1997). The value of the world’s ecosystem services and natural capital. Nature 387, 253–260. doi: 10.1038/387253a0
Czajkowski M., Buszko-Briggs M., and Hanley N. (2009). Valuing changes in forest biodiversity. Ecol. Econ. 68 12, 2910–2917. doi: 10.1016/j.ecolecon.2009.06.016
Department of Ecology and Environment of Yunnan Province (2021). Biodiversity in Yunnan [White paper] (Kunming, China). Available online at: https://sthjt.yn.gov.cn/zrst/swdyxbh/202105/P020210522377361485275.pdf.
Ehrlich P. R. and Ehrlich A. H. (1992). The value of biodiversity. AMBIO 21, 219–226. Available online at: https://www.jstor.org/stable/4313931.
Fu B. J., Yu D. D., and Lü N. (2017). An indicator system for biodiversity and ecosystem services evaluation in China. Acta Ecol. Sin. 37, 341–348. doi: 10.5846/stxb201611092273
Geijzendorffer I. R., Beltrame C., Chazee L., Gaget E., Galewski T., Guelmami A., et al. (2019). A more effective ramsar convention for the conservation of Mediterranean wetlands. Front. Ecol. Evol. 7, 21. doi: 10.3389/fevo.2019.00021
Gretchen D. C. (1997). “Introduction: what are ecosystem services?,” in Nature’s Services (Island Press, Washington, D.C).
Han D., Mao K. Y., and Luo F. Y. (2013). A brief discussion on the status of indigenous fish resources in Dehong and their development and protection strategies. Sci. Fish Farming 3), 26–27.
He D. B., Ke S. X., He L. D., Xie G. L., Chen Z. X., and Yang S. X. (2017). The study of forest resources characteristic, operation and administration of Dehong Prefecture. Cent. South For. Invent. Plann. 36, 1–4, 25. doi: 10.16166/j.cnki.cn43-1095.2017.02.001
Hu J. M., Yang F. L., Liu F., Qiu C., and Zuo X. X. (2018). Optimizing the protected areas based on the analysis of human pressure and priority conservation habitats in Yunnan, China. J. Yunnan Univ. (Natural Sci. Edition) 40, 1159–1170. doi: 10.7540/j.ynu.20180386
Hu X. J., Lin Y. Q., Gao X. L., Xu W. H., and Ouyang Z. Y. (2024). Research progress on the connotation of biodiversity value and assessment methods. Acta Ecol. Sin. 44, 8957–8967.
Hungate B. A., Barbier E. B., Ando A. W., Marks S. P., Reich P. B., Gestel N. V., et al. (2017). The economic value of grassland species for carbon storage. Sci. Adv. 3, e1601880. doi: 10.1126/sciadv.1601880, PMID: 28435876
IPBES (2019). Global assessment report of the Intergovernmental Science - Policy Platform on Biodiversity and Ecosystem Service (Bonn: IPBES secretariat).
Kumar P. (2011). The economics of ecosystems and biodiversity: ecological and economic foundations (London: Routledge).
Le Provost G., Schenk N. V., Penone C., Thiele J., Westphal C., Allan E., et al. (2023). The supply of multiple ecosystem services requires biodiversity across spatial scales. Nat. Ecol. Evol. 7, 236–249. doi: 10.1038/s41559-022-01918-5, PMID: 36376602
Li Q. F. (2014). Protecting the forest biodiversity in Dehong and developing the green economy. Fujian Agric. 8), 61–62.
Li F., Gao N. N., Peng R., He L. B., Lai Y. P., and Yang S. Q. (2022). Selecting the appropriate urban biodiversity restoration indices based on the pressure-state-response model and a multi-scale management problem investigation in zhuhai city. J. Resour. Ecol. 13, 518–527. doi: 10.5814/j.issn.1674-764x.2022.03.016
Li S., Spicer R. A., Su T., Zhou Z., and Deng C. (2024). An updated chronostratigraphic framework for the Cenozoic sediments of southeast margin of the Tibetan Plateau: Implications for regional tectonics. Global Planet. Change 236, 104436. doi: 10.1016/j.gloplacha.2024.104436
Loreau M. and Hector A. (2001). Partitioning selection and complementarity in biodiversity experiments. Nature 412, 72–76. doi: 10.1038/35083573, PMID: 11452308
Ma K. (1993). Discussion on the concept of biodiversity. Biodivers. Sci. 1, 20–22. doi: 10.17520/biods.1993005
Millennium Ecosystem Assessment (2005). Ecosystems and Human Well-being: Desertification Synthesis (Washington, DC: World Resources Institute).
National Bureau of Statistics (2021). China Statistical Yearbook 2021 (Beijing: China Statistics Press).
Seddon N., Chausson A., Berry P., Girardin C. A. J., Smith A., and Turner B. (2020). Understanding the value and limits of nature-based solutions to climate change and other global challenges. Philos. Trans. R. Soc. B Biol. Sci. 375, 20190120. doi: 10.1098/rstb.2019.0120, PMID: 31983344
Sherman R., Mullen R., Li H., Fang Z., and Wang Y. (2007). Alpine ecosystems of Northwest Yunnan, China: an initial assessment for conservation. J. Mountain Sci. 4, 181–192. doi: 10.1007/s11629-007-0181-6
Soto-Navarro C. A., Harfoot M., Hill S. L. L., Campbell J., Campos Santos H.-C., Mora F., et al. (2020). Building a Multidimensional Biodiversity Index–A scorecard for biodiversity health. Project report (Gland, Switzerland: UN Environment Programme World Conservation Monitoring Centre (UNEP-WCMC), Cambridge, UK and Luc Hoffmann Institute (LHI).
Soto-Navarro C. A., Harfoot M., Hill S., Campbell J., Mora F., Campos C., et al. (2021). Towards a multidimensional biodiversity index for national application. Nat. Sustain. 4, 933–942. doi: 10.1038/s41893-021-00753-z
Statistics Bureau of Yunnan Province (2011). Yunnan statistical yearbook 2011 (Beijing, China: China Statistics Press).
Statistics Bureau of Yunnan Province (2021). Yunnan statistical yearbook 2021 (Beijing, China: China Statistics Press).
Tu J., Wan M., Chen Y., Tan L., and Wang J (2022). Biodiversity assessment in the near-shore waters of Tianjin city, China based on the Pressure-State-Response (PSR) method. Mar. Pollut. Bull. 184, 114123., PMID: 36126484
United Nations. (2021). System of Environmental-Economic Accounting—Ecosystem Accounting (SEEA EA). (United Nations).
Wang Q., Shi N. N., Han Y., and Xiao N. W. (2021). Establishment of an indicator system for comprehensive assessment on terrestrial biodiversity in China. Chin. J. Appl. Ecol. 32, 2773–2782. doi: 10.13287/j.1001-9332.202108.004, PMID: 34664450
Whittaker R. H. (1977). Evolution of species diversity in land communities. Evol. Biol. 10, 1–67. doi: 10.1126/science.147.3655.250, PMID: 17788203
Wu Y. M., Sang Z. L., Yang S. Q., and Tian H. (2013). Analysis of the current status and conservation strategies for biodiversity protection and nature reserves in Zhaotong. J. Anhui Agric. Sci. 41, 5531–5532. doi: 10.13989/j.cnki.0517-6611.2013.12.150
Xu J. and Wilkes A. (2004). Biodiversity impact analysis in northwest Yunnan, southwest China. Biodivers. Conserv. 13, 959–983. doi: 10.1023/B:BIOC.0000014464.80847.02
Yang Y., Wang J., Tian K., Wang J., and Wang J. (2004). “"Research on biodiversity assessment methods and evaluation index system in Yunnan.” in Advances in biodiversity conservation and research in China VI: Proceedings of the sixth national symposium on biodiversity conservation and sustainable utilization. (Southwest Forestry University; Southwest Ecological Research Center, Chinese Academy of Forestry; Yunnan Forestry Survey and Planning Institute), 35–47.
Yue Q., Hao M., Geng Y., Wang X. R., Gadow K. V., Zhang C. Y., et al. (2022). Evaluating alternative hypotheses behind biodiversity and multifunctionality relationships in the forests of Northeastern China. For. Ecosyst. 9, 100027. doi: 10.1016/j.fecs.2022.100027
Yunnan Biodiversity Conservation Joint Conference (2013). Yunnan Biodiversity Conservation Strategy and Action Plan, (2012-2030) (Kunming, China). Available online at: https://sthjt.yn.gov.cn/xxgk (Accessed May 9, 2013).
Yunnan Forestry and Grassland Bureau (2021). List of National Key Protected Wild Animals and Plants Distributed in Various Prefectures and Cities in Yunnan Province (Kunming, China). Available online at: https://lcj.yn.gov.cn/html/2022/zdlyxxgkqt_1012/67268.html.
Zhang P. Y., Duan M. Q., Xu Z. W., Gong L. Q., Shen R. C., Xiang X. G., et al. (2025). Floristic regionalization of Jiangxi province based on phylogenetic diversity. J. Nanchang Univ. (Natural Science) 49, 109–118. doi: 10.13764/j.cnki.ncdl.2025.02.004
Keywords: biodiversity assessment, pressure-state-response, index, comprehensive quality, Yunnan province
Citation: Yu F, Peng F, Tang Z, Ma G, Xu X, Zeng X and Guo P (2025) Biodiversity assessment of Yunnan province based on the pressure-state-response model. Front. Ecol. Evol. 13:1598561. doi: 10.3389/fevo.2025.1598561
Received: 27 March 2025; Accepted: 20 July 2025;
Published: 12 August 2025.
Edited by:
Javid Ahmad Dar, SRM University, IndiaReviewed by:
Leroy Soria-Díaz, Universidad Autónoma de Tamaulipas, MexicoHeliot Zarza, Metropolitan Autonomous University, Mexico
Copyright © 2025 Yu, Peng, Tang, Ma, Xu, Zeng and Guo. This is an open-access article distributed under the terms of the Creative Commons Attribution License (CC BY). The use, distribution or reproduction in other forums is permitted, provided the original author(s) and the copyright owner(s) are credited and that the original publication in this journal is cited, in accordance with accepted academic practice. No use, distribution or reproduction is permitted which does not comply with these terms.
*Correspondence: Peipei Guo, Z3VvcHBAY2FlcC5vcmcuY24=