 Yujia Zhang
 Wenhai Lu*
 Zhaoyang Liu
 Lu Yang
 Rong Zeng
- Marine Ecology Research Lab, National Marine Data and Information Service, Tianjin, China
Introduction: Coastal ecosystems are experiencing rapid degradation and biodiversity loss, driving large-scale restoration efforts, particularly in China. Traditional methods for evaluating restoration outcomes are often limited by high costs and restricted spatial coverage.
Methods: This study introduces an Improved Remote Sensing Ecological Index (IRSEI), which incorporates a salinity-sensitive component into the conventional RSEI framework to better capture the complexity of coastal zones.
Results: Applied to the Liaohe Estuary over ten years (2014–2024) using six Landsat 8 images, the index revealed a 23% increase in mean ecological quality and improvements across 48.3% of the area. The spatial recovery exhibited a “core-to-edge” pattern, with gains exceeding 0.2 in restored regions.
Discussion: The results underscore the index's utility as a cost-effective and scalable tool for monitoring coastal wetland restoration and supporting adaptive management in transitional ecosystems.
1 Introduction
China’s (Mohammadi et al., 2017) coastal zones, which accommodate approximately 40% of the national population and generate roughly 60% of China’s GDP, are both the country’s most densely populated and economically active regions, yet they face the greatest conflict between conservation and development. Subject to intense human pressures—land reclamation, aquaculture, urbanization—and compounded by frequent marine and climate hazards (e.g. storm surges, typhoons), these areas suffer accelerating environmental pollution, ecosystem degradation, and biodiversity loss. Compared to the 1950s, China’s coastal wetlands have diminished by 57%, with mangrove coverage declining by 40%, alongside significant reductions in reef-building coral coverage and seagrass bed density. To address these challenges, the Chinese government has implemented 175 marine ecological restoration projects across 50+ coastal cities since 2016, achieving nationwide rehabilitation of 1,680 km of coastline and over 50,000 hectares of coastal wetlands (The State Council Information Office of the People’s Republic of China, 2024). Rigorous ecological monitoring and assessment are not only critical for verifying the effectiveness of these restoration measures but also essential for guiding adaptive management and ensuring restoration investments translate into lasting ecosystem services.
Traditional field-based assessments rely on point-source sampling methods such as water quality testing, benthic fauna surveys, and vegetation transects. While accurate, these are labor-intensive, costly, and limited in capturing the spatial complexity of large, dynamic coastal systems. In contrast, remote sensing offers synoptic views, high revisit frequencies, and multispectral data ideal for tracking landscape-scale ecological changes (Mohammadi et al., 2017).To date, remote sensing assessments of coastal restoration have focused largely on land cover classification (Wang et al., 2023), landscape pattern analysis (Wei et al., 2021), and ecological indices (Xu, 2013).While land cover classification and landscape metrics derived from ecosystem distribution maps effectively document habitat extent changes and land conversion patterns, they fail to evaluate ecological quality improvements (Frazier and Kedron, 2017). The Remote Sensing-based Ecological Index (RSEI) has been widely adopted for evaluating environmental quality across urban (Hu et al., 2024; Duo et al., 2024), rural (Zhang et al., 2024), island (Li et al., 2023), and mining landscapes (Sahak and Karsli, 2024). RSEI synthesizes greenness (NDVI), wetness (Wet), dryness (NDBSI), and heat (LST) via principal component analysis to reflect overall ecosystem conditions. Recent advances have led to modified versions (e.g., ERSEI, MRSEI) incorporating tailored indicators to better address specific ecosystem contexts (Ge et al., 2024; Wang et al., 2024; Zhao et al., 2024).
However, coastal systems present distinct challenges—marked intertidal fluctuations, steep salinity gradients, and complex land–sea interfaces—that standard RSEI frameworks fail to capture adequately. Salinity, in particular, is a critical determinant of halophyte succession, soil chemistry, and wetland function (Barletta et al., 2005; Pennings et al., 2010; Dang et al., 2019). Some recent studies have begun integrating salinity-sensitive indices to evaluate coastal wetland ecological status. For example, Zhang et al. (2024) applied a combination of soil and vegetation salinity indices to assess ecological integrity in the Yellow River Delta. Yet only a small fraction (< 1%) of RSEI-related publications over the past five years target coastal wetlands, and they typically apply inland-derived indicator suites without coupling salinity metrics. This study builds on these examples by fully integrating an Enhanced Salinity Index (ESI) into a modified RSEI (IRSEI), offering a more comprehensive evaluation index of the effectiveness of ecological restoration measures tailored to the unique hydrological and edaphic dynamics of coastal zones.
As a case study, it focus on the Liaohe Estuary wetland, a prototypical land–sea transitional ecosystem characterized by a sequential landscape of shallow sea, bare tidal flats, estuarine zones, Suaeda salsa communities, mixed Suaeda salsa–Phragmites australis communities, and extensive Phragmites australis reed beds. This distinctive zonation exemplifies the dynamic interplay between marine and terrestrial influences, making the Liaohe Estuary Wetland a focal point for coastal wetland research (Ke et al., 2024). Over the past 30 years, the region has suffered significant wetland loss (>40%) and saltmarsh degradation (>50%) due to water diversion, aquaculture, and land reclamation (Wang et al., 2021). In response, restoration projects since 2016—such as the Panjin Blue Bay Action and Daling River Estuary Restoration—have employed both nature-based and engineered approaches to improve hydrological connectivity and curb secondary salinization. By 2020, these efforts restored 57.3 km² of wetlands and 17.6 km of shoreline. This study takes the Liaohe Estuary as a case study to develop and apply an Improved Remote Sensing Ecological Index (IRSEI) for assessing ecological restoration outcomes. By analyzing pre- and post-restoration trends in IRSEI values, it aim to quantify the effectiveness of ongoing interventions and provide a scientific basis for long-term monitoring, management, and sustainable development in the region. Additionally, the IRSEI framework proposed here offers a transferable method for evaluating the effectiveness of coastal restoration measures more broadly.
2 Materials and methods
2.1 Overview of the study area
The Liaohe Estuary Wetland is situated at the northernmost point of Liaodong Bay in the Bohai Sea, within the administrative boundaries of Panjin City, Liaoning Province (40°35′–40°58′ N, 121°10′–122°7′ E). This low-lying, flat region comprises alluvial and marine plains formed by sediment deposition from the Daliao, Liao, Daling, and Xiaoling rivers. The predominant soil types—coastal saline soils, salinized marsh soils, and salinized meadow soils—developed from marine silt deposits, with saline soils and marsh soils covering over 90% of the area. The wetland landscape includes coastal tidal flats, shallow marine waters, and aquaculture ponds. Tidal flats account for approximately 45% of the coastal wetland area, of which about 30% is emergent marsh dominated by Phragmites australis (common reed). The remainder comprises brackish marshes—featuring extensive Suaeda salsa (seepweed) communities—and silty mudflats. The confluence of nutrient-rich freshwater and seawater creates an ideal habitat for diverse biota. This wetland nurtures numerous nationally protected species and serves as a vital habitat for key species such as Saunders’s gull (Larus saundersi), red-crowned crane (Grus japonensis), spotted seal (Phoca largha),and black-faced spoonbill (Platalea minor) (Chang et al., 2022). For this study, the delineated area encompasses the region from the current coastline inland to the 0-meter isobath seaward, effectively covering the coastal zone (Figure 1).
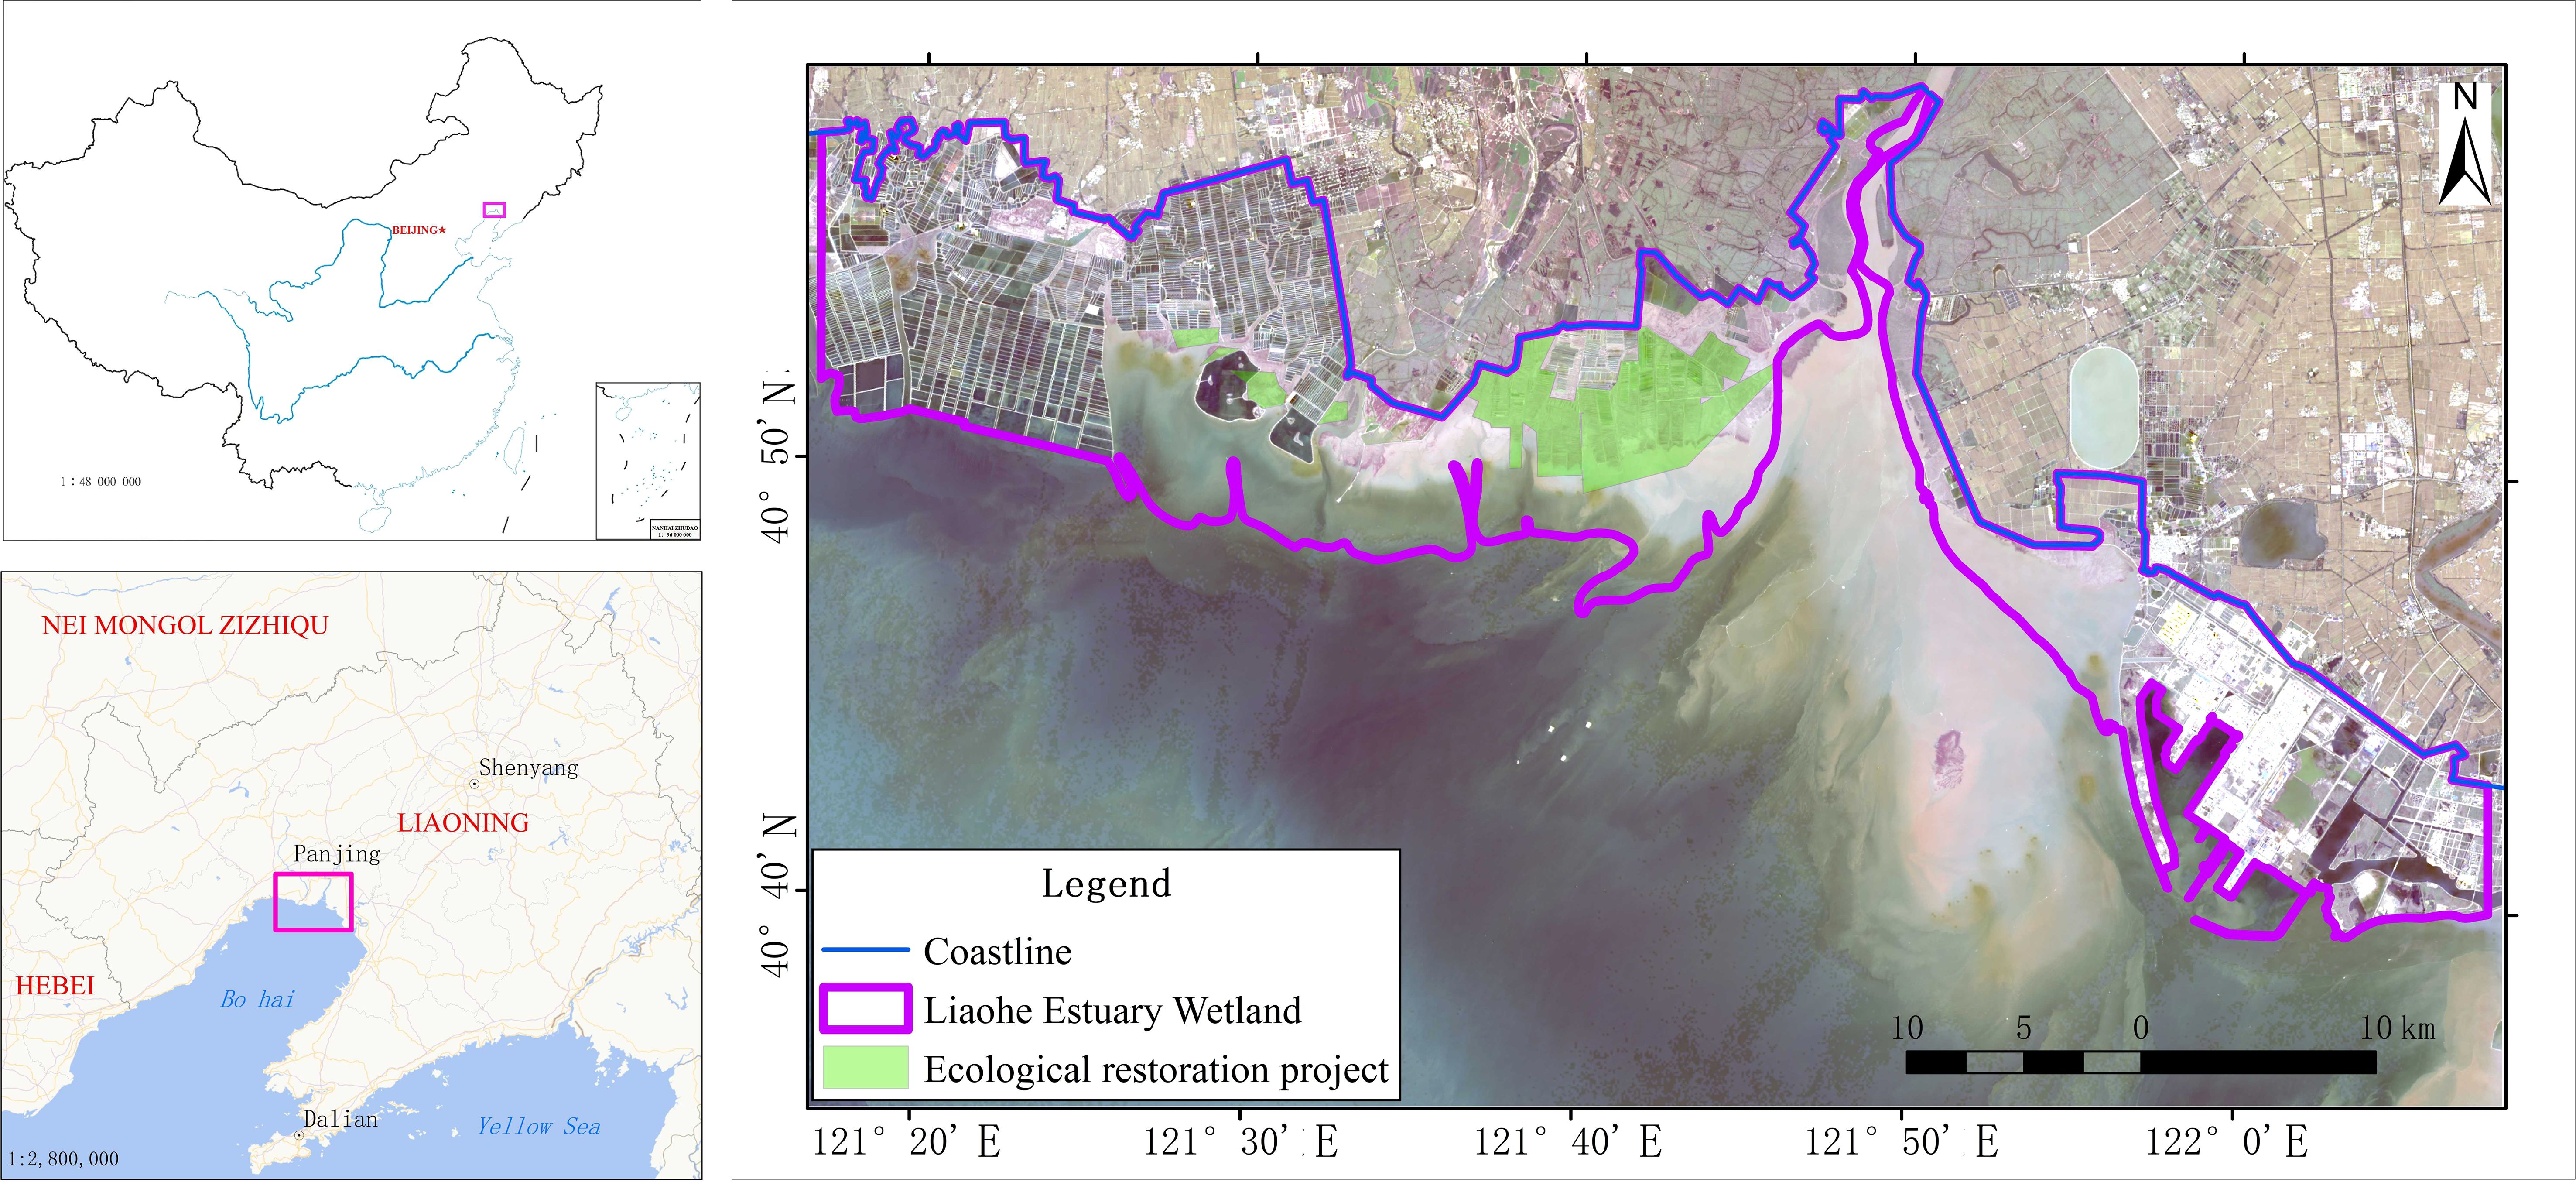
Figure 1. Geographical location of Liaohe estuary.
To enhance the ecological function of the Liaohe Estuary Wetland, two major marine ecological restoration projects was implemented between 2016 and 2020, with a total investment of approximately 350 million RMB. The project included two primary components. First, on the western bank of the estuary, 14.6 km of artificial shoreline was rehabilitated, 2.646 million m³ of tidal channels were dredged, and 1.9408 million m³ of man-made structures were removed, thereby restoring the natural tidal network and coastal wetland, including the planting of 6,667 ha of Suaeda salsa. Second, in the Daling River estuary, particularly within the “Saunders’s gull protection area”, restoration efforts included tidal channel clearance (13.5 km), dredging (234,400 m³), benthic organism proliferation over 38 ha (targeting Neanthes japonica), Suaeda salsa vegetation and coastal wetland restoration. The project significantly improved the structure and function of the estuarine wetland ecosystem, increasing the extent of coastal wetlands and restoring natural shoreline dynamics.
2.2 Data source and preprocessing
The remote sensing data used in this study were obtained from the Earth Explorer platform of the United States Geological Survey (USGS).To align with the implementation period of the restoration projects in Panjin City and to assess the lag effects of ecological restoration, six Landsat 8 OLI scenes were selected, covering the pre-restoration baseline (2014), project implementation phase (2016, 2018, 2020), and post-restoration stage (2022, 2024).
To ensure comparability across multi‐temporal imagery and time‐series analysis, a systematic data screening and preprocessing strategy was implemented: first, images were restricted to the vegetation growing season (June–September) with cloud cover < 20%, and only those acquired at low tide according to tidal tables were retained to minimize inundation effects; second, the Landsat Collection 2 Level-2 Surface Reflectance (SR) products —already radiometrically calibrated (sensor‐response normalization), atmospherically corrected (LEDAPS algorithm) and terrain‐corrected (SRTM V3 DEM)—were used to ensure radiometric consistency; further, each scene was geometrically fine‐registered to 2 m Google Earth Pro imagery via multiple stable ground control points, achieving an RMSE < 0.5 pixel, and residual clouds/shadows were masked using the QA_PIXEL band; finally, all reflectance values were rescaled to 0–1 normalized surface reflectance using USGS scaling coefficients, providing a high‐quality data foundation for subsequent ecological parameter retrieval (Masek et al., 2006; Zhu and Woodcock, 2012).
In addition, the field survey data on salt marsh vegetation were obtained from the salt marsh ecosystem early warning and monitoring program organized by the Ministry of Natural Resources in 2024; the coastline data were derived from the results of the National Nearshore Marine Comprehensive Survey and Evaluation Program, and the 0-meter isobath data were interpolated based on depth points from nautical charts.
2.3 Research methods
Based on the remote sensing ecological index proposed by Xu (2013), this study introduced salinity index to improve the sensitivity to coastal ecological restoration dynamics.
2.3.1 Ecological factor indicators
IRSEI was developed by integrating salinity metrics with four foundational ecological indicators (greenness, wetness, dryness, and heat) to holistically assess coastal ecosystem changes pre- and post-restoration. The ecological indicators and their derivation methods are as follows:
(1) Greenness: Normalized Difference Vegetation Index (NDVI, Equation 1) was adopted to capture vegetation cover and photosynthetic activity (Tucker, 1979).
In the formula, P represents the surface reflectivity of image band, Red: red band, NIR: near infrared band.
(2) Wetness: Modified Normalized Difference Water Index (MNDWI, Equation 2) was selected to reflect surface water content (Xu, 2006).
In the formula, P represents the surface reflectivity of image band, green: green band, SWIR1: short-wave infrared band 1.
(3) Dryness: A Normalized Difference Built-up and Bare Soil Index (NDBSI, Equation 3) was constructed, combining the Soil Index (SI) and the Index-based Built-up Index (IBI) through mean fusion (Zha et al., 2003; Xu, 2013), to address the complexity of coastal artificial and bare surfaces.
In the formula, P represents the surface reflectivity of image band, green: green band, SWIR1: short-wave infrared band 1.
(4) Heat: Land Surface Temperature (LST) was derived from Landsat Collection 2 Level-2 products (Band 10) based on the single-window algorithm (Jiménez-Muñoz and Sobrino, 2003).
(5) Salinity: To assess salinity, remote sensing data were used to estimate the salt content of the surface or water body. A systematic comparison of typical salt inversion models revealed that although the Normalized Salinity Index (NDSI) is simple to compute, it is sensitive to soil moisture; the Salinity Sensitivity Index (SSI) performs well in low-vegetation areas but is significantly affected by the solar elevation angle. Consequently, an enhanced salinity index (ESI, Equation 4)—characterized by strong resistance to atmospheric interference and suitability for coastal wetlands—was ultimately selected (Nguyen et al., 2019; Sun et al., 2024).
In the formula, P represents the surface reflectivity of image band, green: green band, SWIR2: short-wave infrared band 2.
2.3.2 Construction of IRSEI
To holistically capture the synergistic evolution of coastal ecological factors, Principal Component Analysis (PCA) was used to integrate the five normalized indicators (NDVI, MNDWI, NDBSI, LST, and ESI). The detailed steps are as follows:
(1) Normalization
All indicators were rescaled to [0,1] using the min-max method to eliminate dimensional and magnitude disparities. Positive indicators (greenness, wetness) and negative indicators (dryness, heat, salinity) were standardized accordingly.
In the Equation 5, denotes the normalized ecological factor value, represents the original pixel value of the ecological factor, Xmax is the global maximum pixel value of the ecological factor, and Xmin is the global minimum pixel value of the ecological factor.
(2) Principal component analysis
The first principal component (PC1, Equation 6) was selected to construct the IRSEI, as it captured the largest proportion of total variance across ecological dimensions:
In the formula, IRSEI is the improved remote sensing ecological index, and PC1 is the obtained first principal component.
(3) Standardization and Classification
To facilitate inter-annual comparability, IRSEI values were further normalized to [0,1]. Ecological quality was categorized into five classes: Degraded (0–0.2], Poor (0.2–0.4], Moderate (0.4–0.6], Good (0.6–0.8], and Excellent (0.8–1.0].
To better illustrate the classification of ecological restoration levels, a grading standard table was established based on the comprehensive IRSEI scores. The classification considers relevant literature benchmarks, ecological quality thresholds, and field validation results. The restoration state associated with each grade is also described accordingly (Table 1).
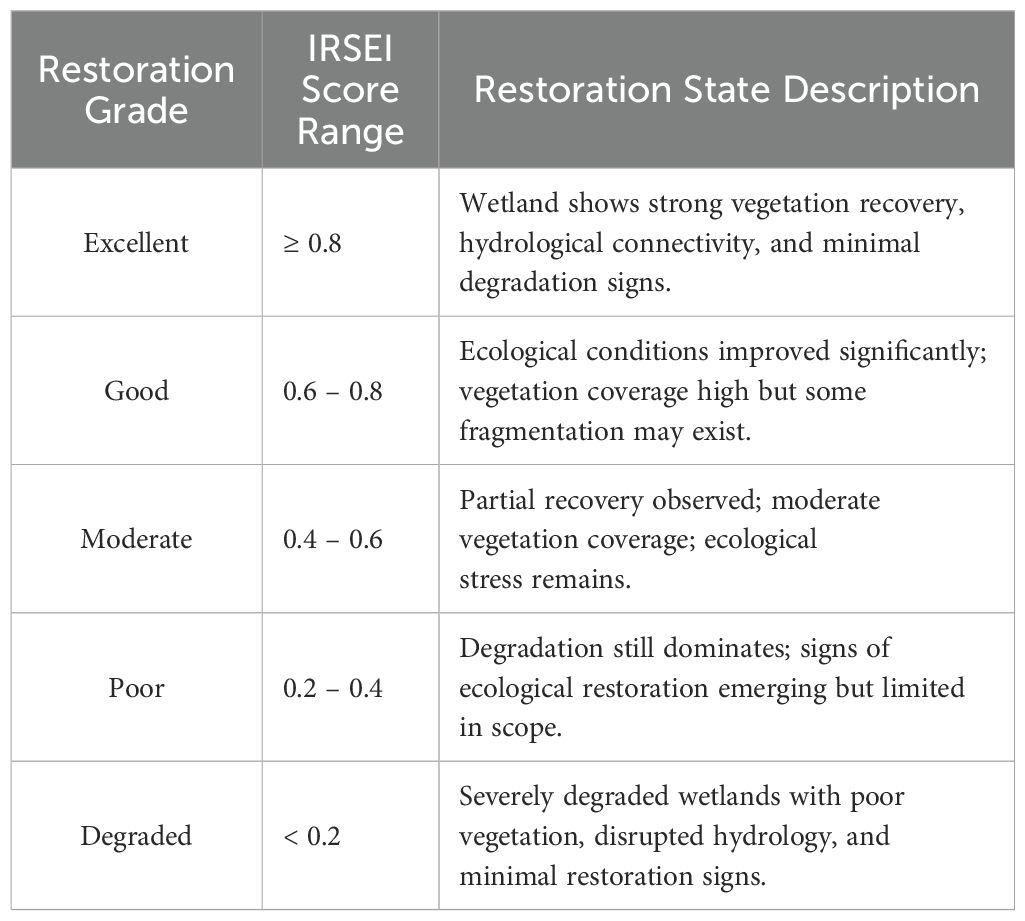
Table 1. Classification standard of wetland restoration levels based on IRSEI.
3 Results
3.1 Validation of IRSEI effectiveness
3.1.1 Comparative analysis with RSEI
The IRSEI model was first validated by comparing its statistical performance with the traditional RSEI (Table 2). Using 2024 as an example, the first principal component (PC1) explained 63.91% of the total variance in the RSEI model and 71.94% in the IRSEI model—both exceeding the 60% threshold generally accepted for effective dimensionality reduction. The higher explanatory power of PC1 in the IRSEI suggests enhanced integration of ecological indicators.
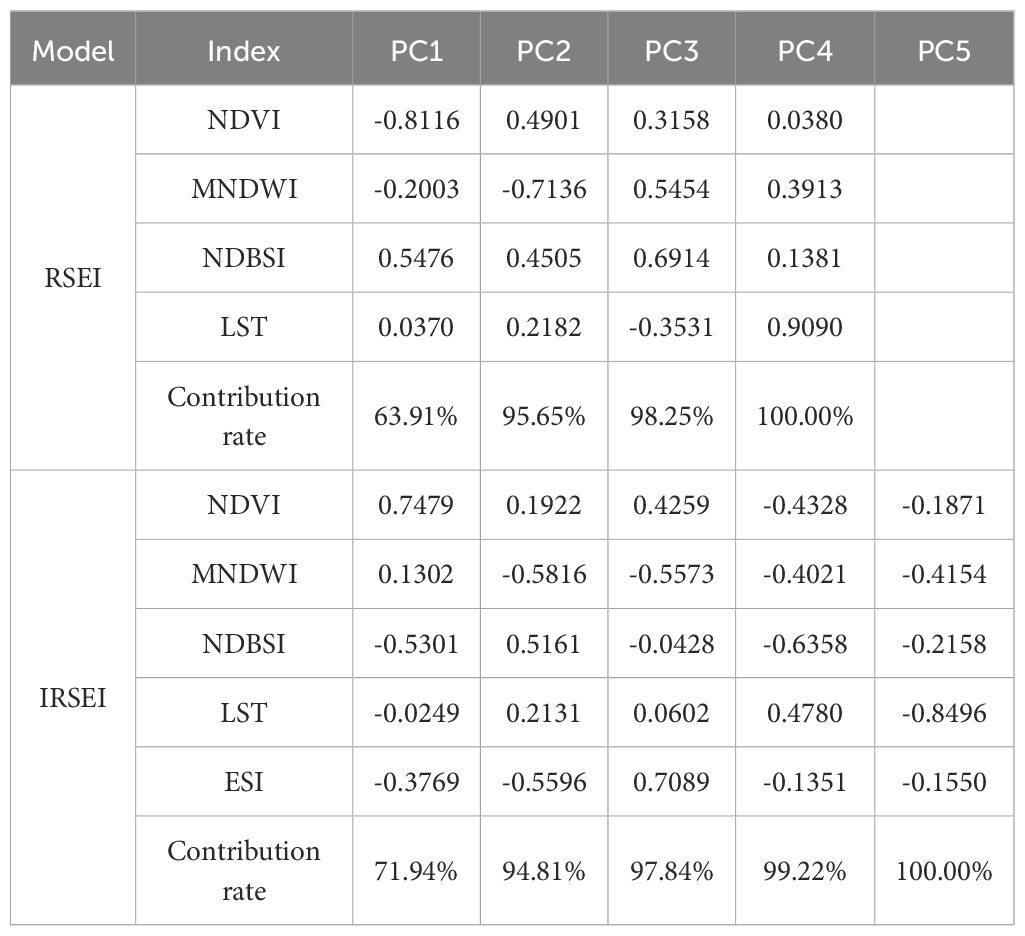
Table 2. PCA results of RSEI and IRSEI in 2024.
Consistent interannual loading patterns were observed across all indicators. Greenness and wetness indices contributed positively to PC1, whereas dryness, heat, and salinity loaded negatively, aligning with findings from previous studies (e.g., Wang et al., 2023). This supports the interpretation that vegetation coverage and hydrological improvement enhance ecological quality, while urbanization, heat islands, and salinization lead to degradation.
To evaluate spatial performance, three representative land cover types—built-up lands, aquaculture ponds, and salt marshes—were compared (Figure 2). In built-up lands, IRSEI more clearly delineated urban features and assigned lower index values, resulting in better discrimination of urban and agricultural zones. In aquaculture ponds, IRSEI highlighted the low ecological quality of hardened dikes more effectively, while in salt marshes, it identified unvegetated or degraded patches more prominently than RSEI. Overall, IRSEI provided more accurate spatial representations of ecological condition across varied land uses.
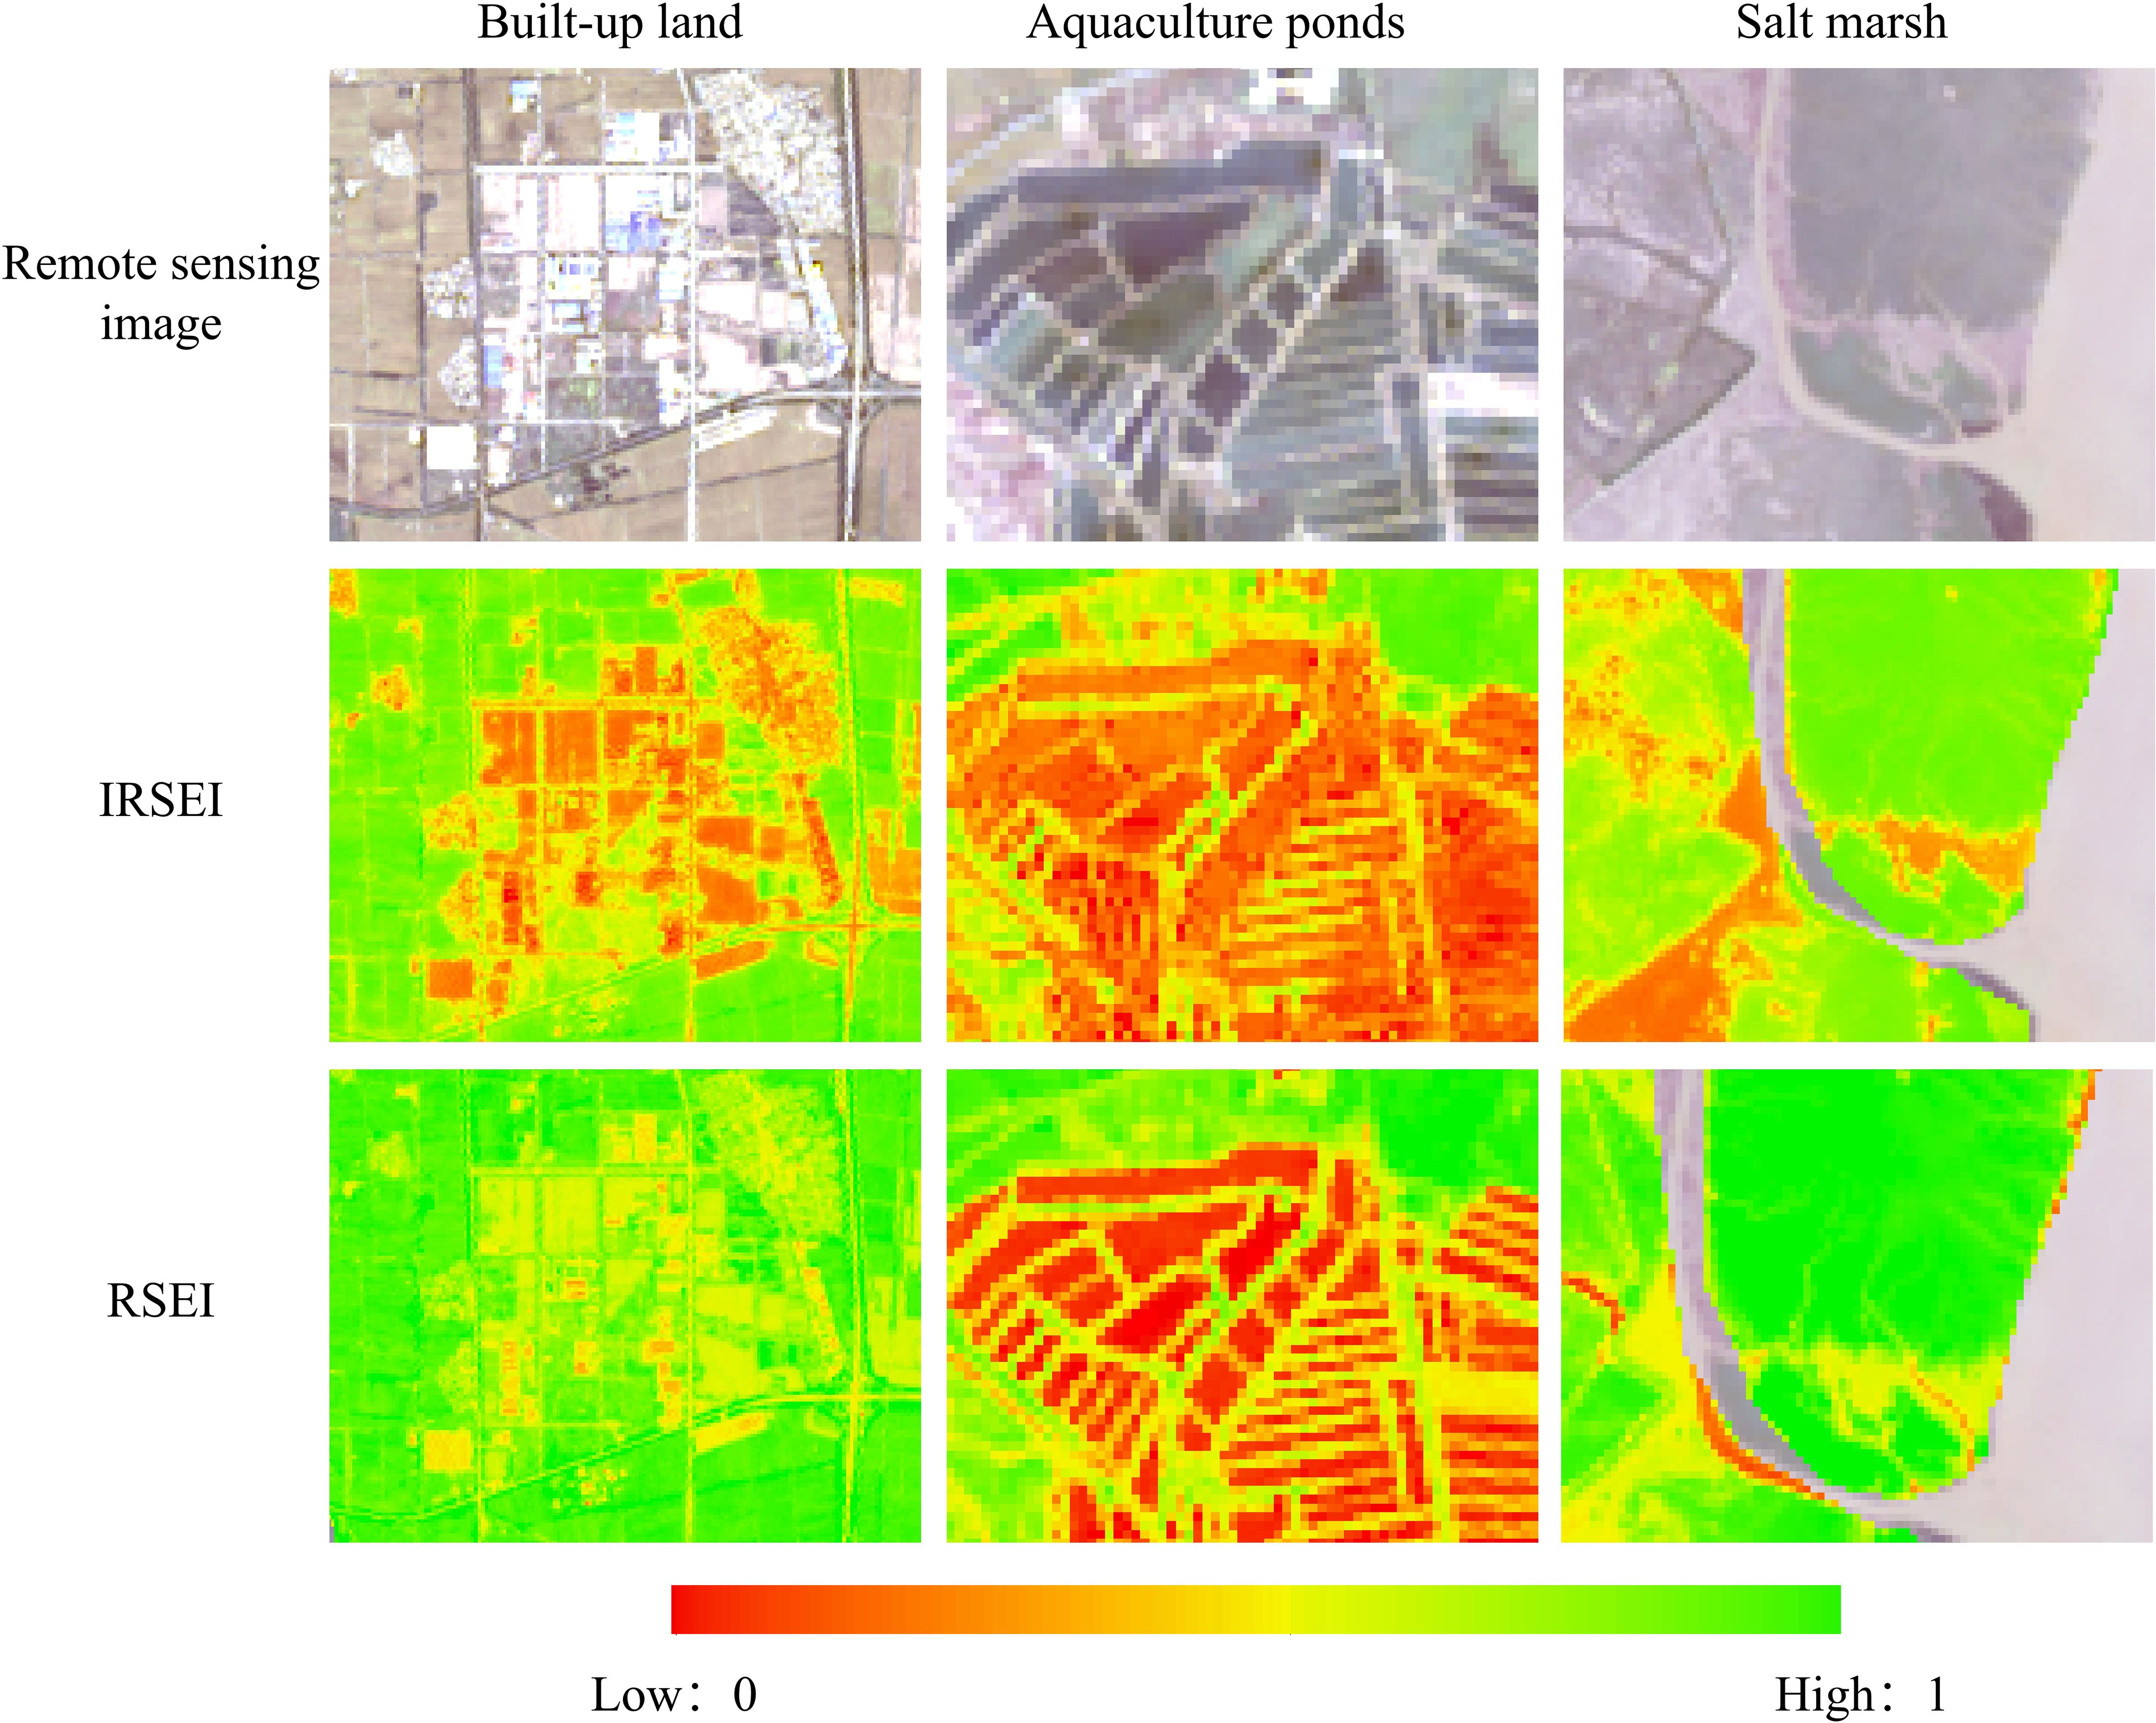
Figure 2. Local comparison of IRSEI and RSEI outputs.
3.1.2 Validation with field survey data
To assess ecological accuracy, IRSEI values were regressed against field-measured vegetation coverage data from 24 salt marsh sampling sites in 2024. IRSEI values were extracted from Landsat imagery corresponding to each sampling station and month. A strong logarithmic relationship was observed between IRSEI values and field-measured vegetation cover (R² = 0.81), indicating a high level of responsiveness to actual vegetation conditions (Figure 3). For comparison, the same analysis using RSEI values yielded a moderate correlation (R² = 0.63), suggesting that the traditional RSEI is less sensitive to coastal zone. The inclusion of salinity as an additional ecological stressor in the IRSEI model likely contributed to this improvement, as salt stress and hydrological conditions are critical limiting factors in coastal wetland ecosystems.
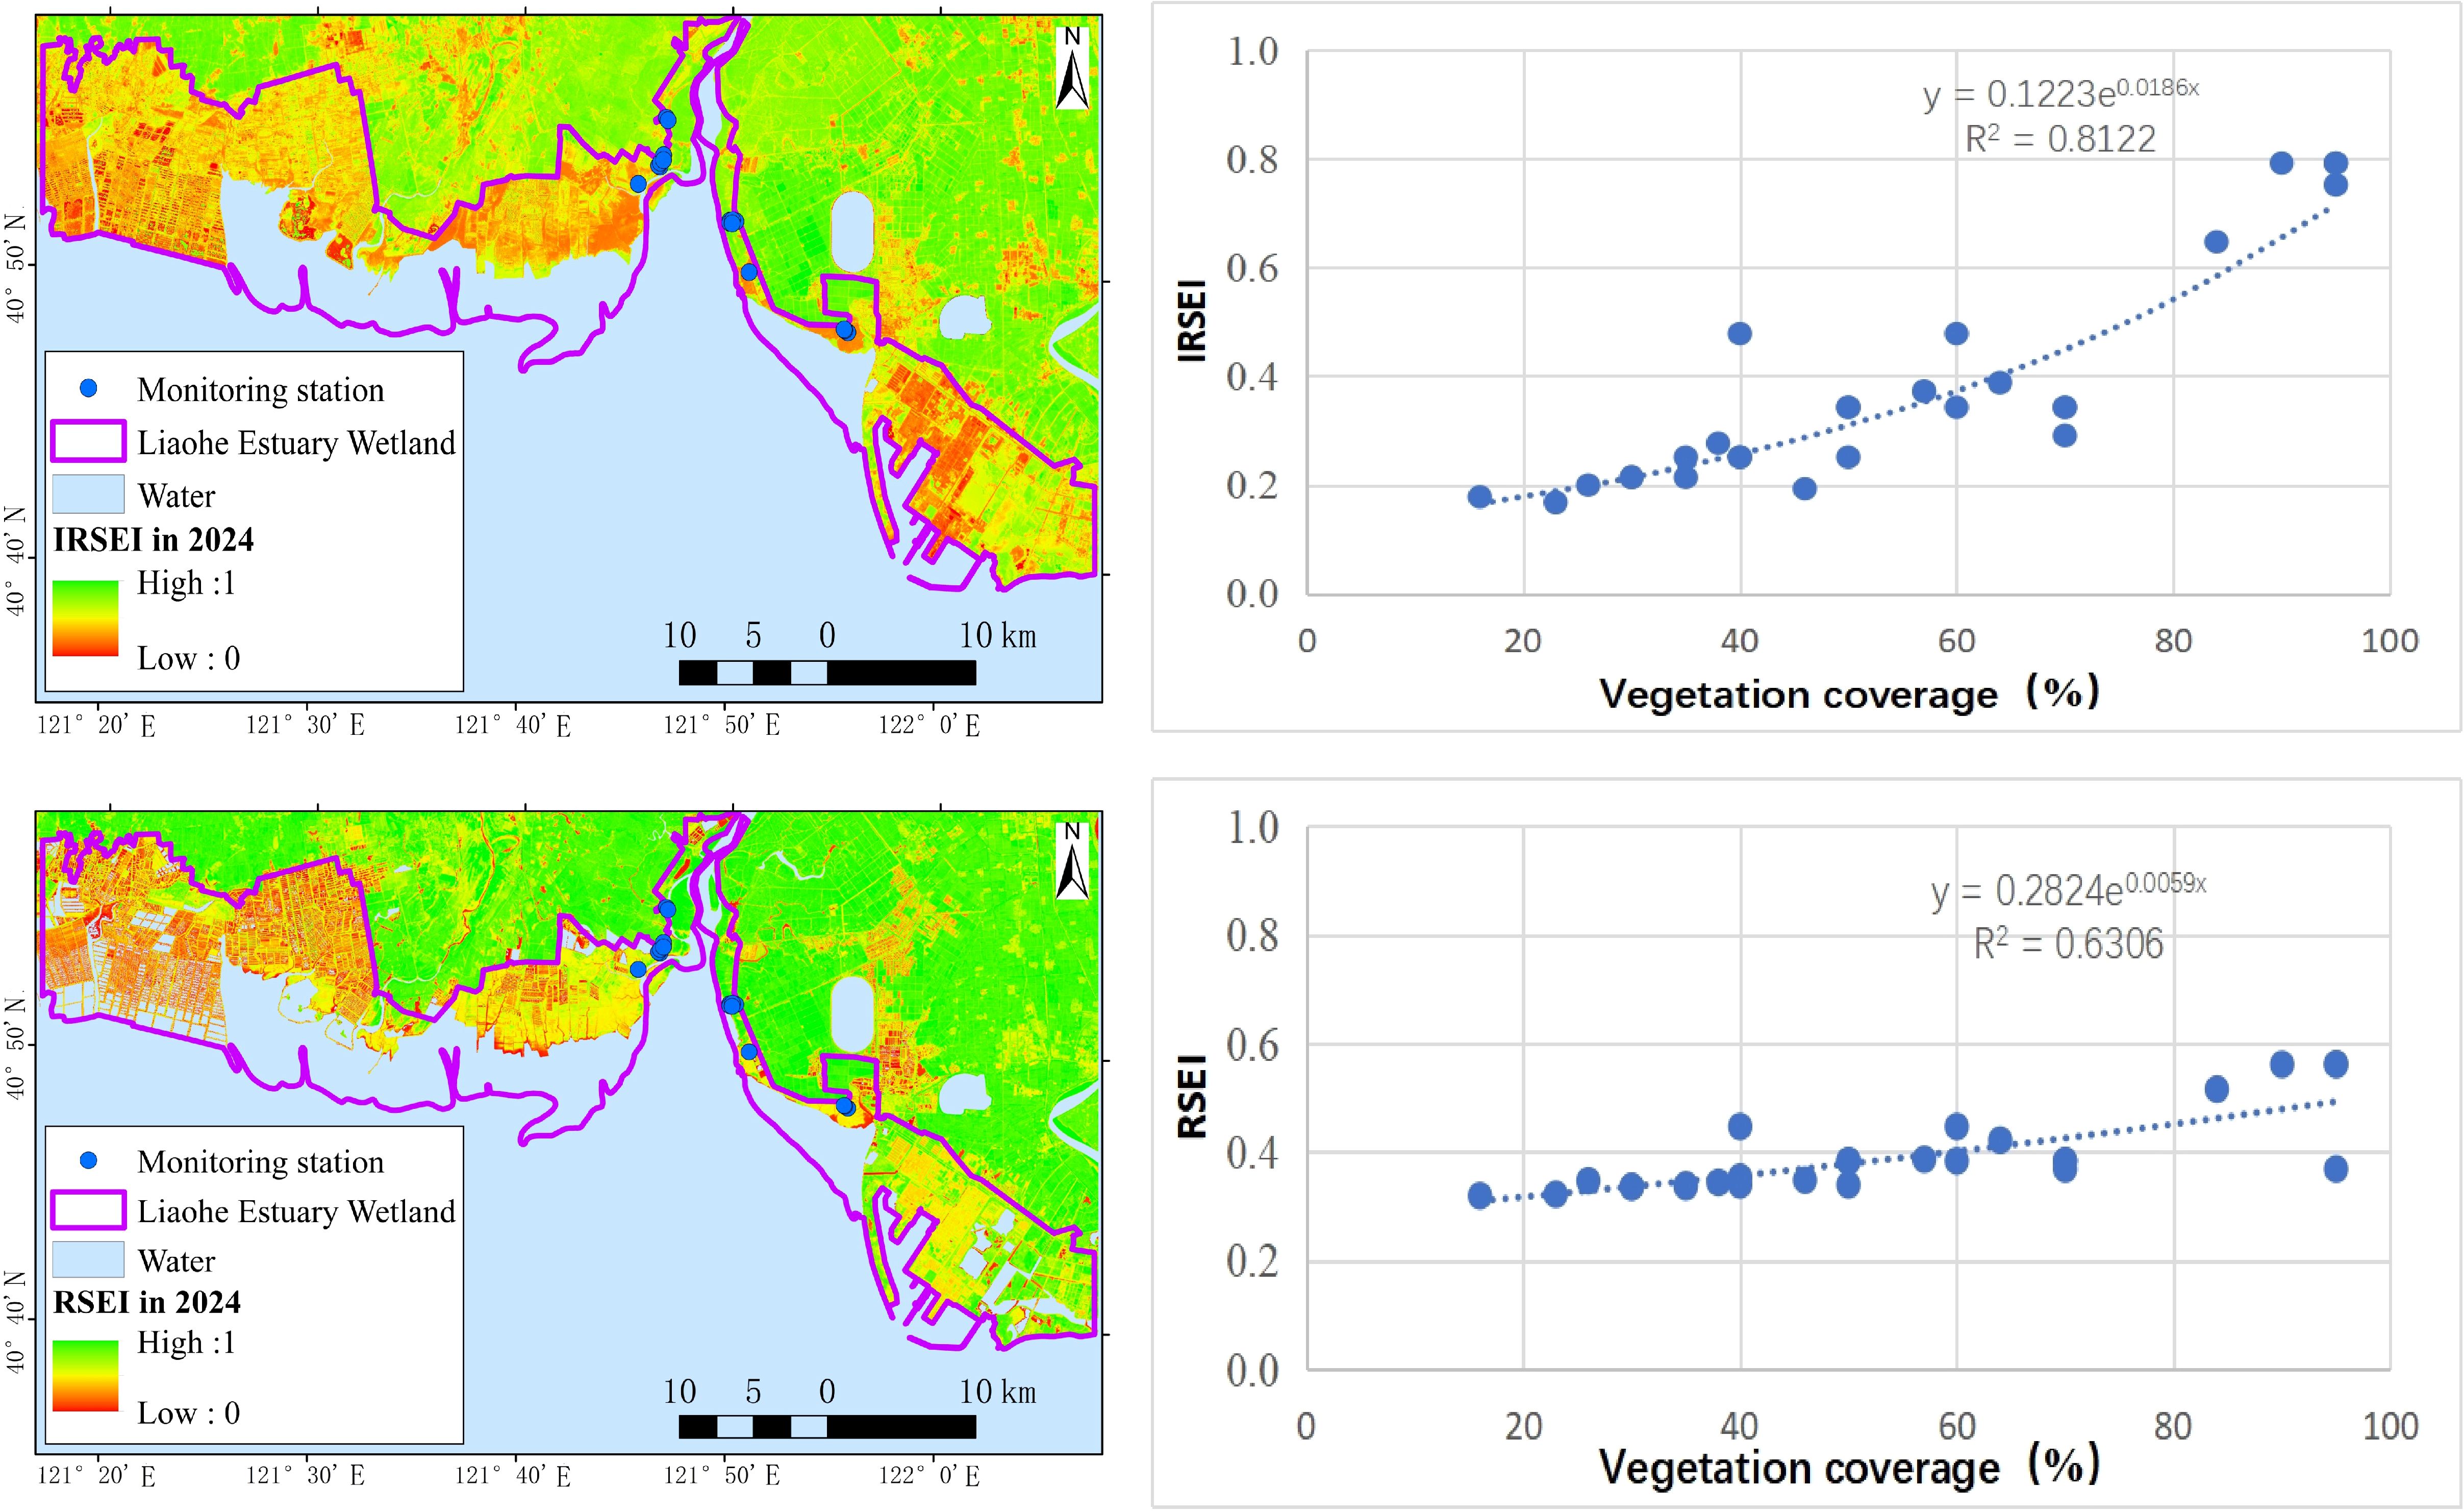
Figure 3. Correlation between field-measured vegetation cover and remote sensing indices.
These validation results confirm that IRSEI provides a more ecologically representative and operationally reliable tool for evaluating wetland restoration in coastal zones.
3.2 Spatiotemporal analysis of IRSEI results
3.2.1 Temporal and spatial variation of IRSEI
From 2014 to 2024, the IRSEI exhibited a phased trend: initial decline followed by improvement (Figures 4, 5). The average IRSEI increased from 0.35 during the 2014 baseline period to 0.43 in 2024, an increase of 22.86%, indicating a significant improvement in regional ecological quality following the implementation of ecological restoration projects. Notably, during the early restoration phase (2016–2018), the average IRSEI dropped by 0.05. This decrease suggests that the disturbances caused by restoration activities—combined with the fact that the newly planted Suaeda salsa seedlings had not yet matured—resulted in a temporary degradation of the ecosystem. However, as the restoration efforts entered the consolidation phase (2018–2024), a series of systematic measures were implemented. The area of coastal salt marshes increased significantly, aquaculture ponds were reverted to tidal flats, and the Suaeda salsa seedlings gradually developed into mature stands. Collectively, these measures led to an overall improvement in regional ecological quality, with the IRSEI increasing by 0.09.
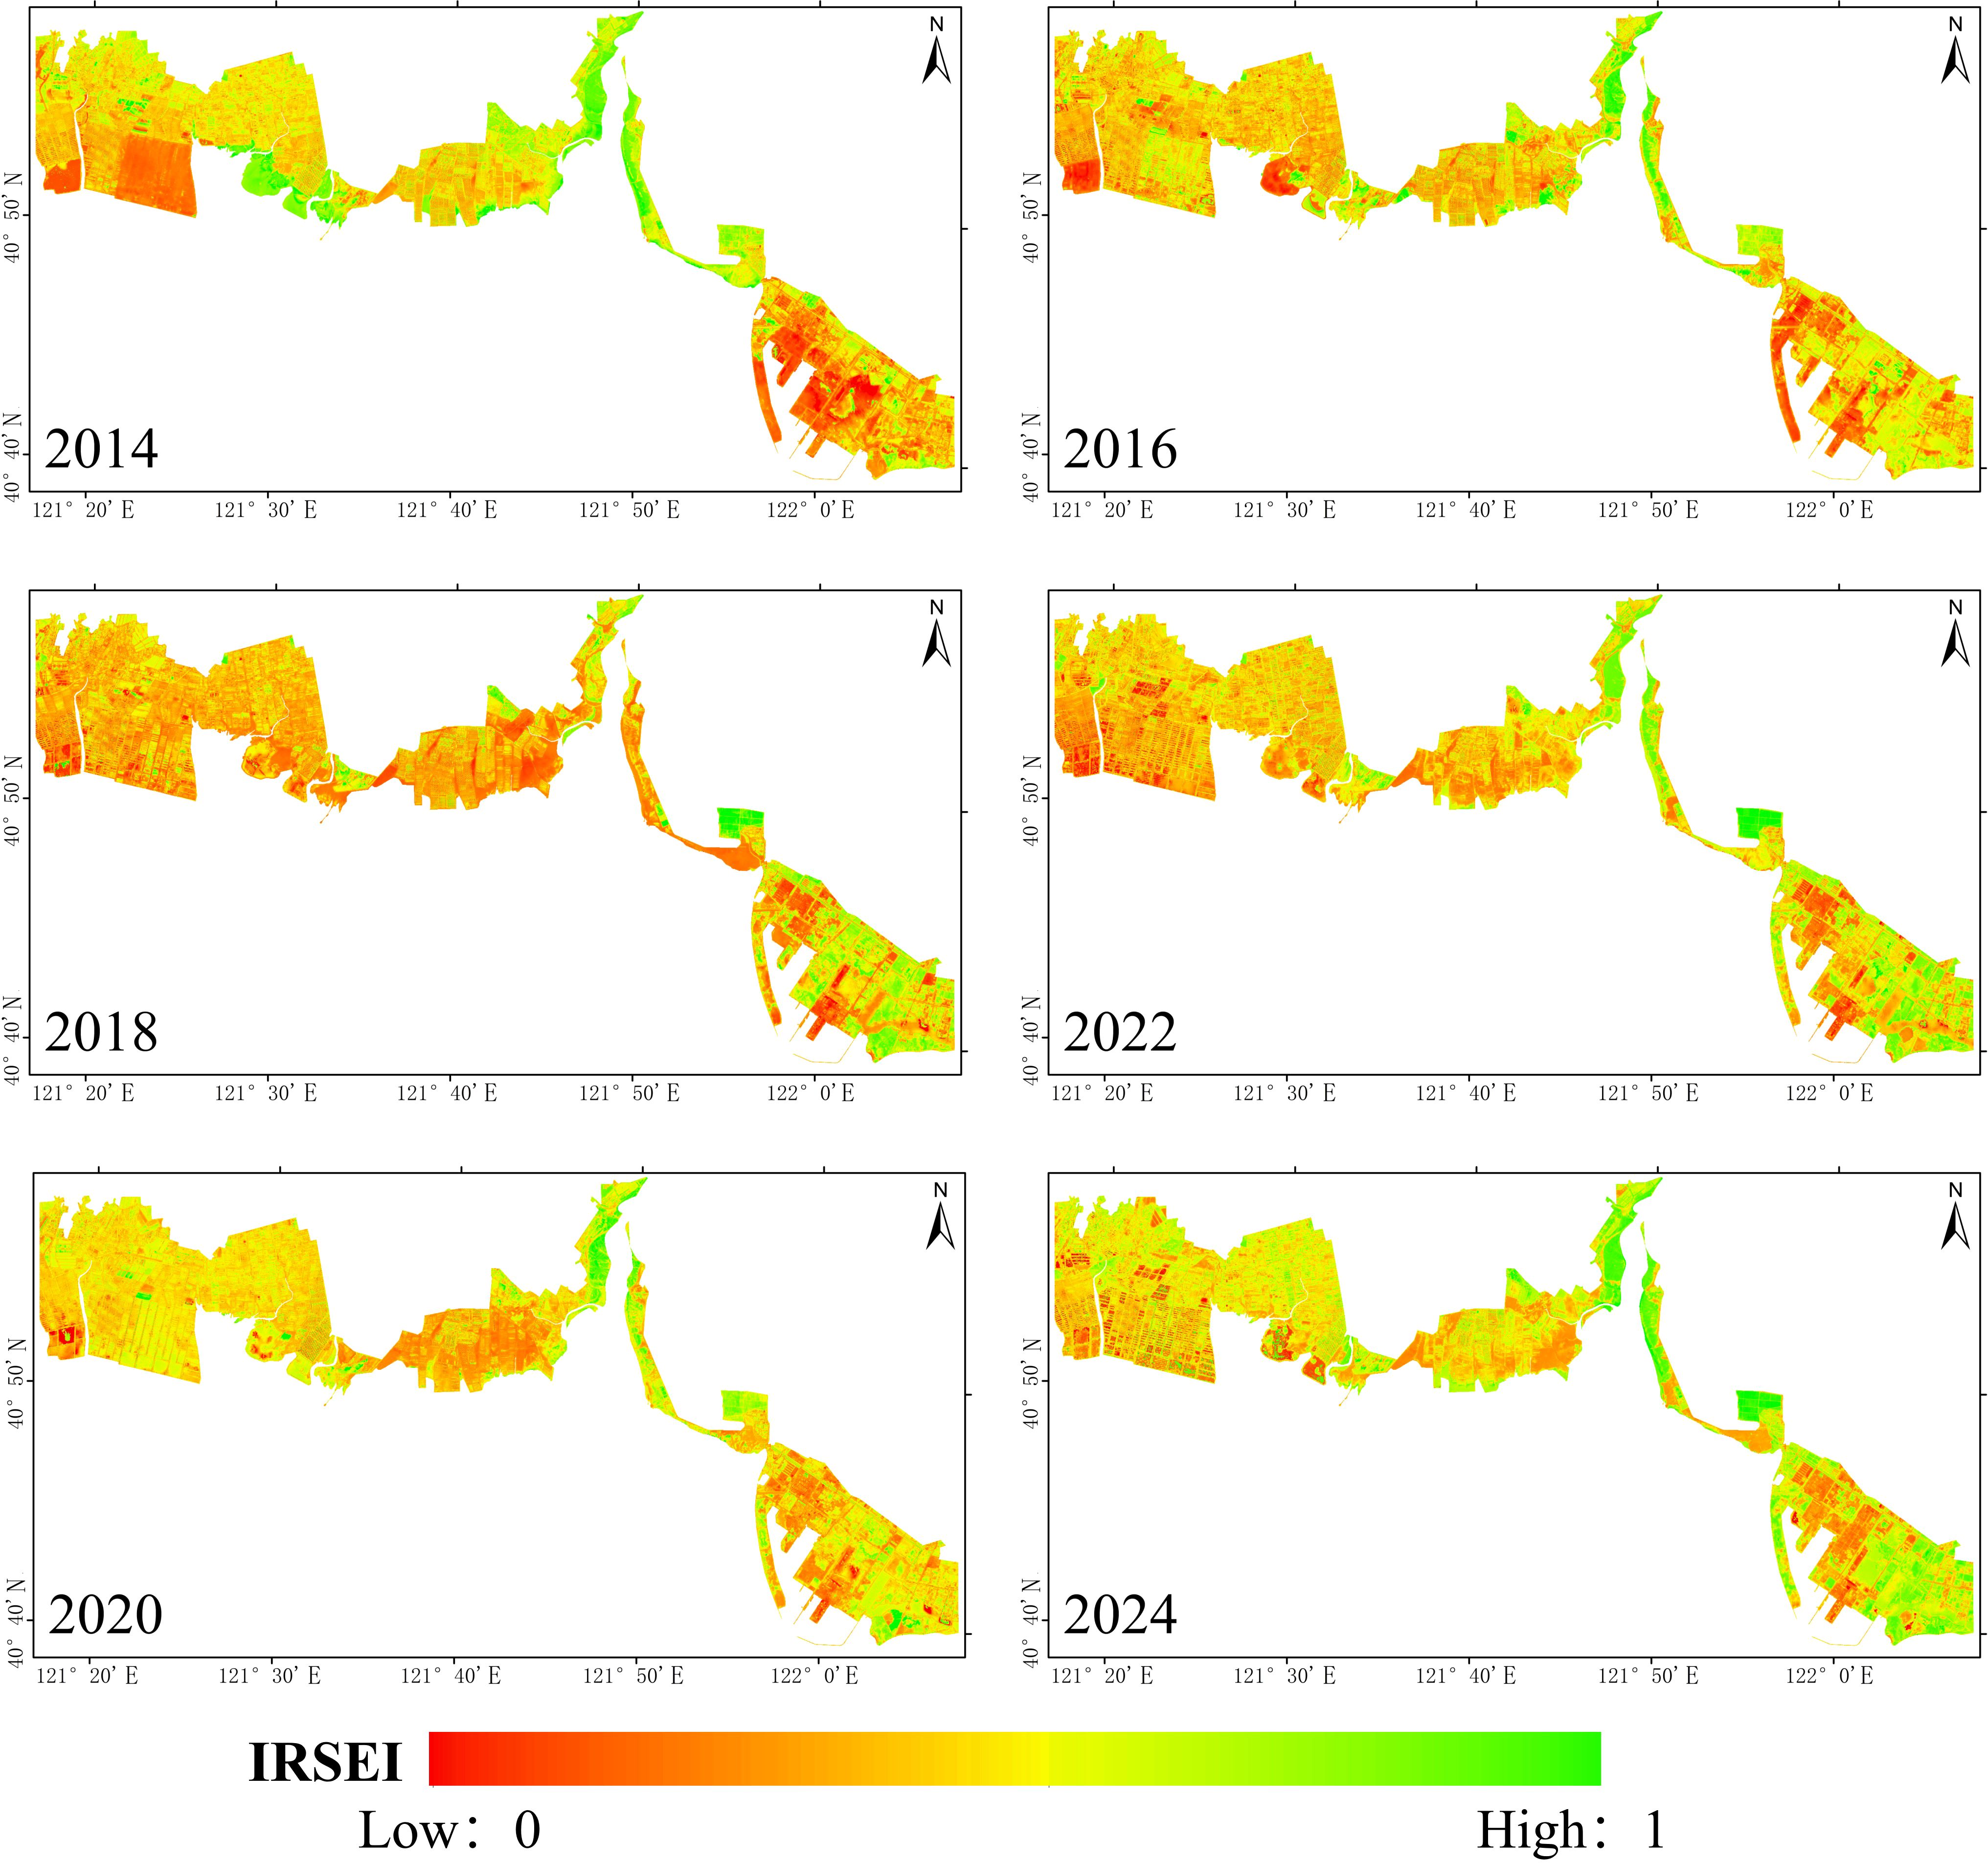
Figure 4. Spatial distribution of IRSEI from 2014 to 2024.
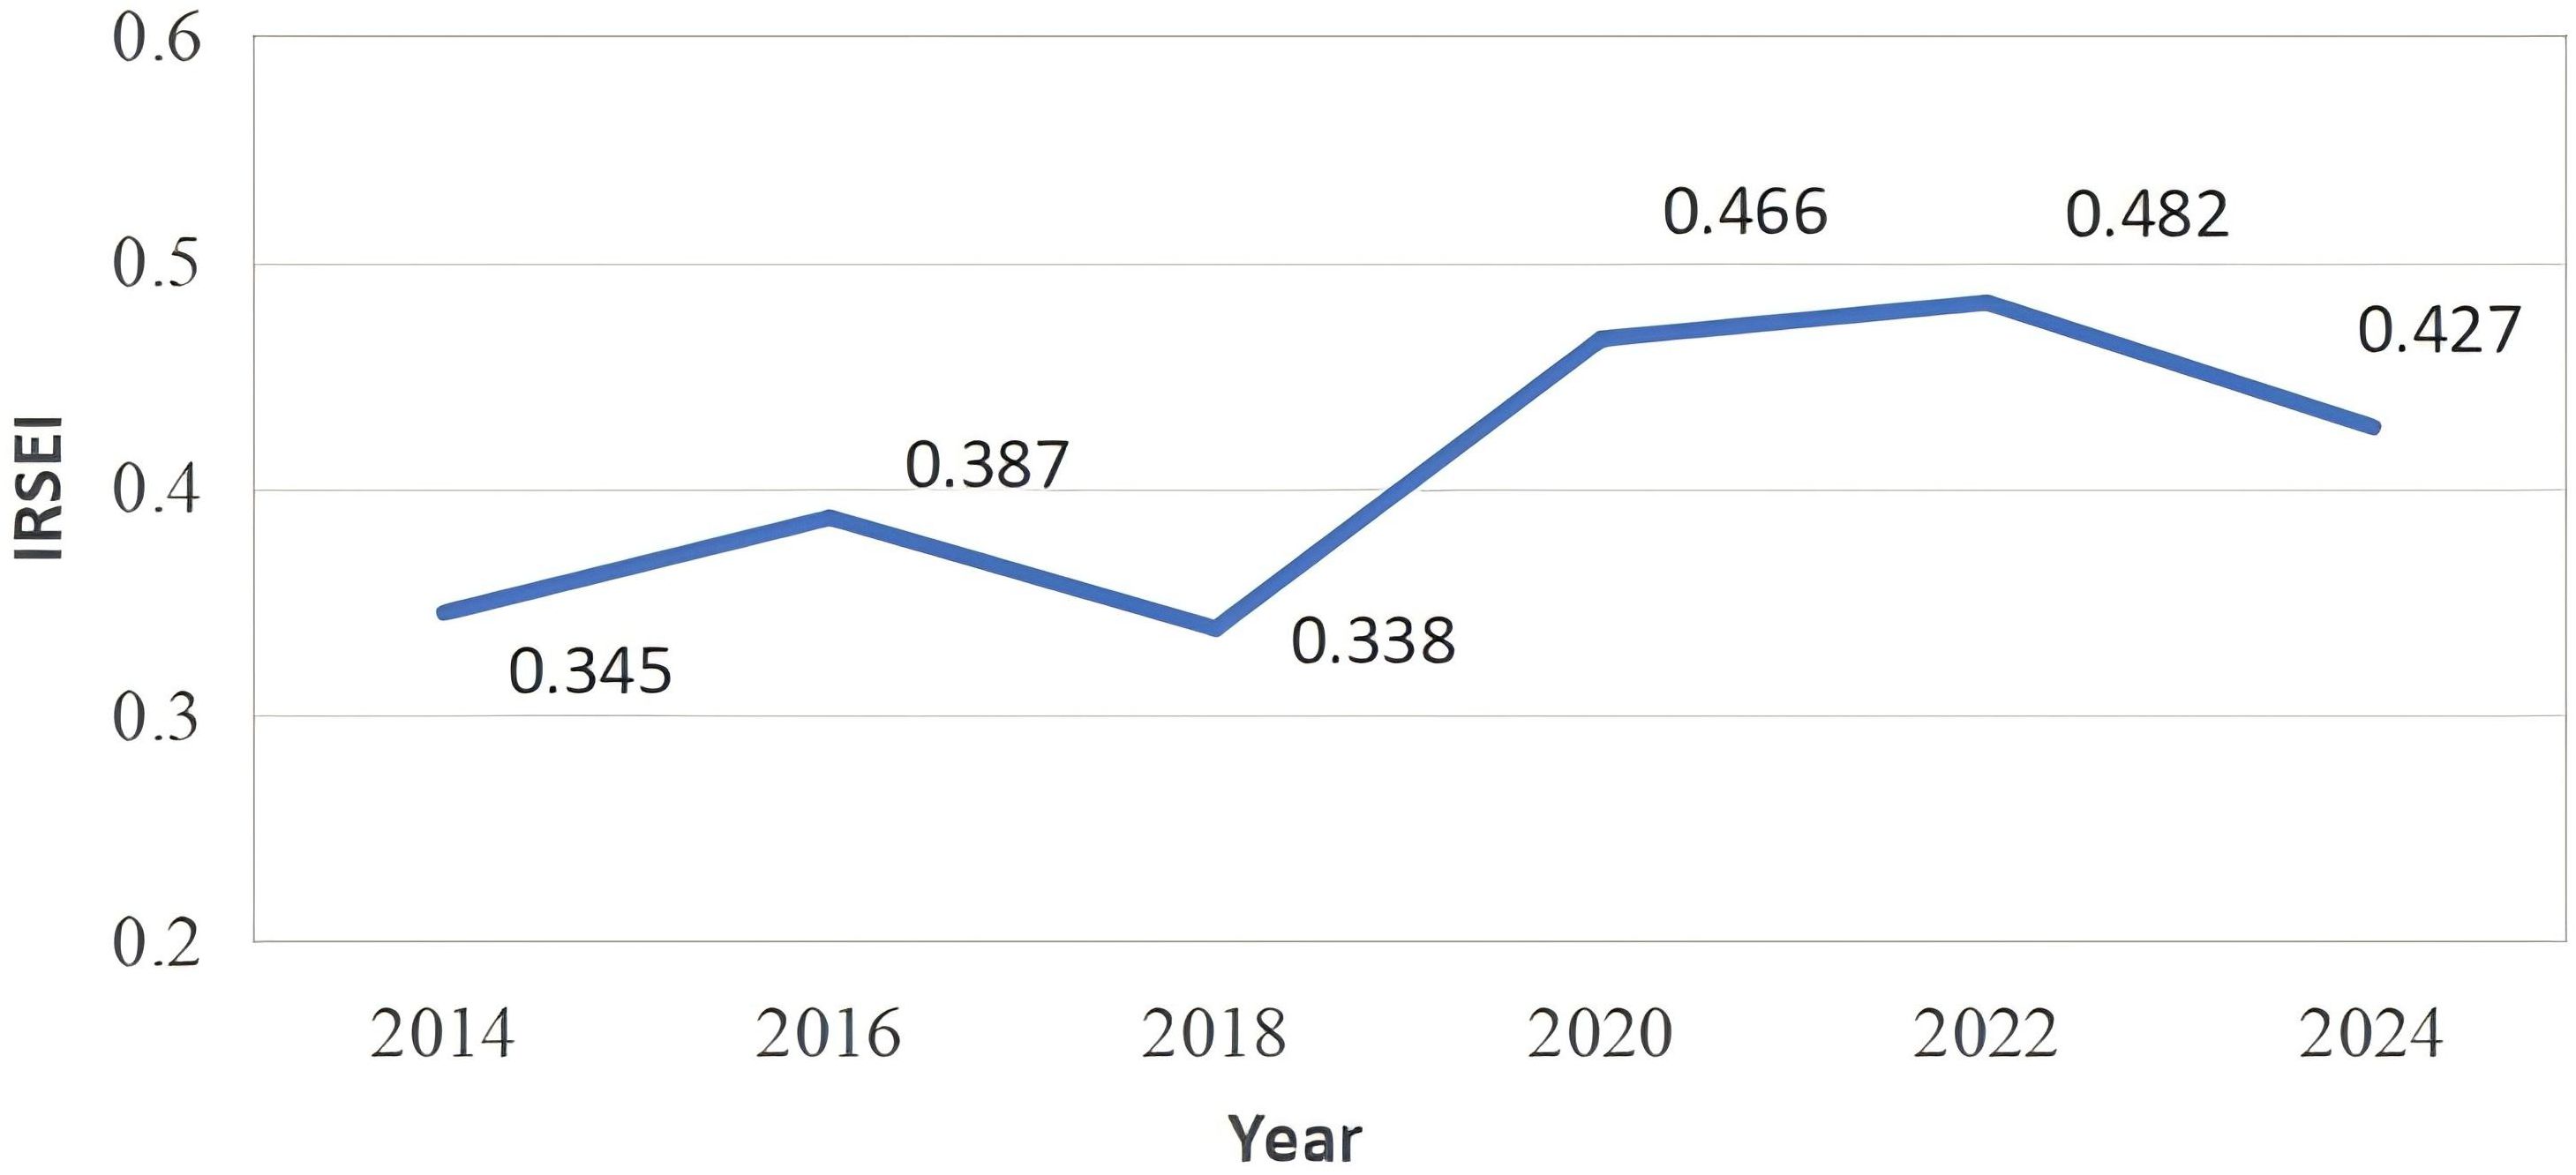
Figure 5. Average change of IRSEI from 2014 to 2024.
3.2.2 Spatial comparison between restoration and non-restoration areas
To further evaluate the effectiveness of ecological restoration and the robustness of the IRSEI in detecting ecological improvements, it selected three representative 2 km × 2 km sub-regions within the Liaohe Estuary for comparative analysis. These included: (A) the core restoration area where major interventions such as aquaculture pond removal and Suaeda salsa planting were implemented; (B) a typical salt marsh area; and (C) a representative aquaculture zone. Both B and C served as control regions, sharing similar climatic, geomorphological, and socio-economic conditions with A, but without undergoing restoration from 2016 to 2024.
IRSEI-based comparison revealed distinct ecological trajectories among the three zones (Figure 6). In the restoration area (A), the average IRSEI value increased by 16.2%, from 0.37 in 2014 to 0.43 in 2024, indicating substantial ecological improvement. In contrast, the salt marsh control area (B) exhibited a slight decline in ecological condition, with IRSEI decreasing from 0.428 to 0.413 over the same period. The aquaculture control area (C) showed only a marginal increase, from 0.359 to 0.364, suggesting limited spontaneous recovery. Spatially, Area A demonstrated marked ecological enhancement, with aquaculture ponds successfully converted into vegetated tidal flats and ecological stress substantially mitigated. In comparison, Areas B and C remained dominated by fragmented aquaculture infrastructure and degraded salt marshes. A significant portion of these areas continued to be classified as “Poor” or “Degraded” (IRSEI < 0.4), highlighting the absence of natural regeneration in the absence of active intervention.
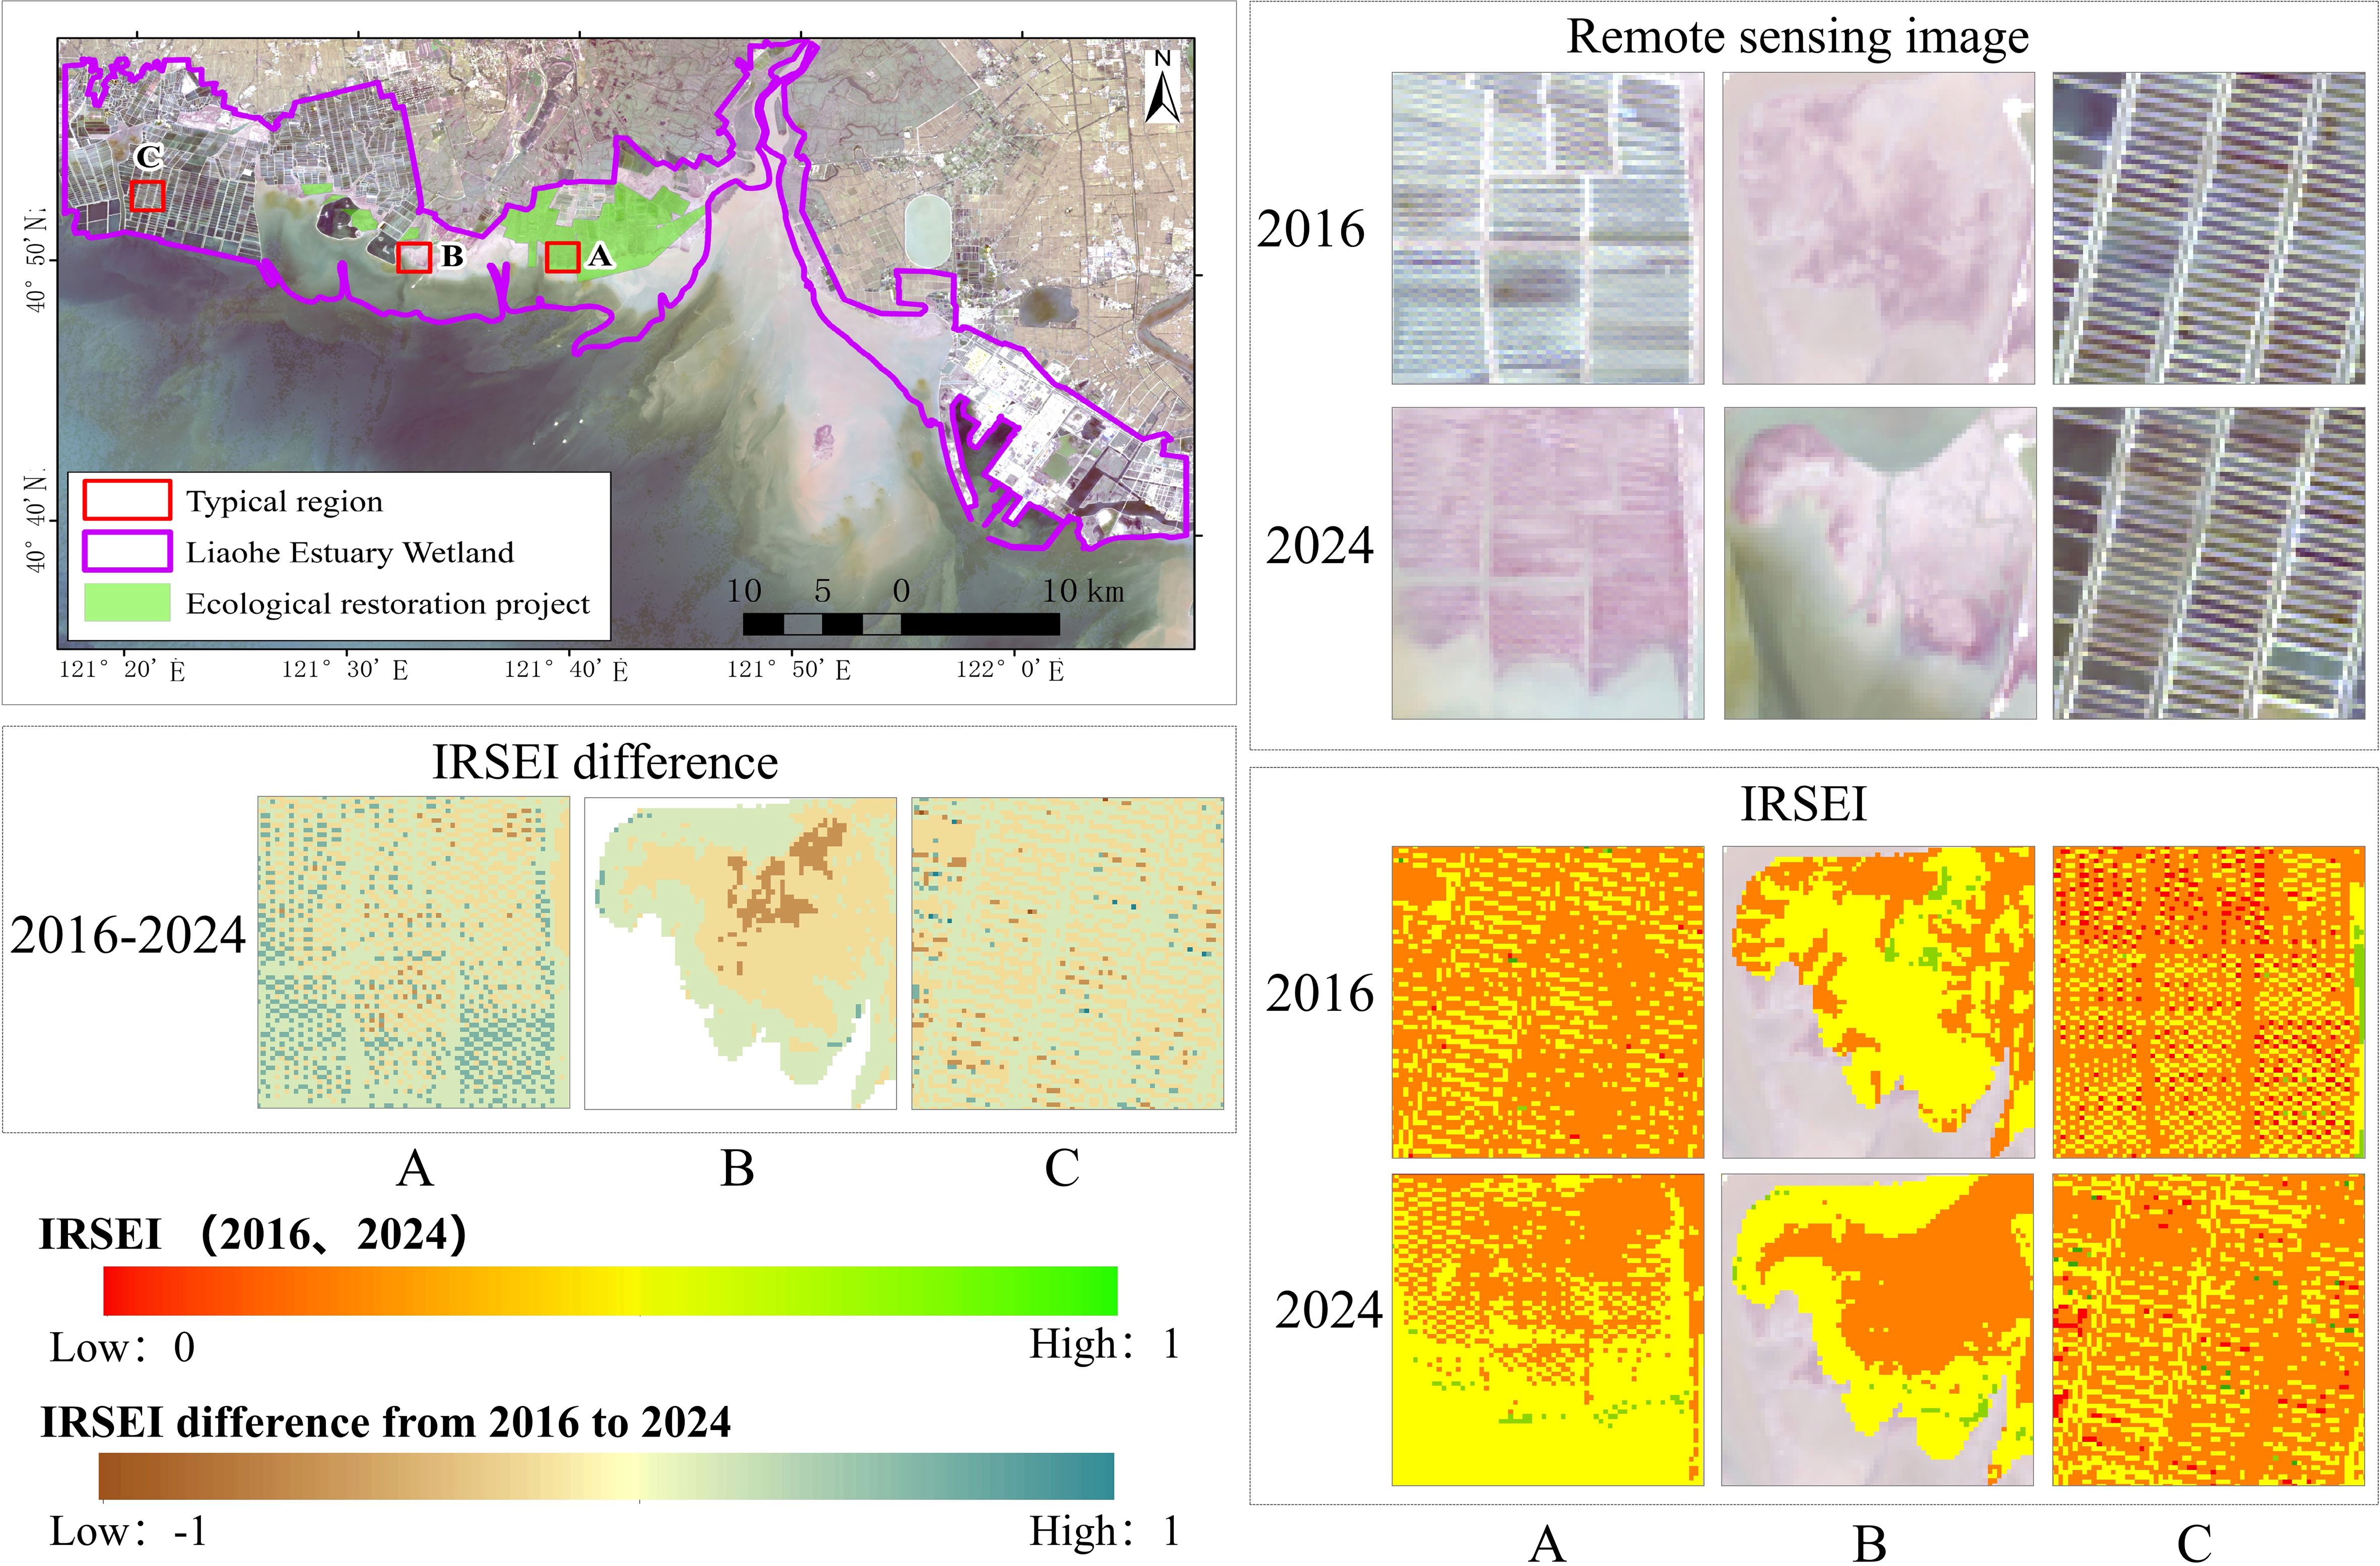
Figure 6. IRSEI differences among restoration and non-restoration areas.
This comparative analysis underscores the tangible ecological benefits of restoration efforts such as tidal channel reconfiguration and Suaeda salsa reestablishment. The pronounced ecological improvement observed in the restoration zone, relative to the control areas, provides compelling empirical evidence for the effectiveness of coastal wetland restoration, and further validates the applicability of IRSEI for monitoring ecological change in complex coastal systems.
3.3 Assessment of restoration effectiveness
3.3.1 Classification-based evaluation
Based on IRSEI classification statistics (Table 3, Figure 7), the ecological quality of the Liaohe Estuary coastal zone exhibited distinct spatiotemporal heterogeneity:
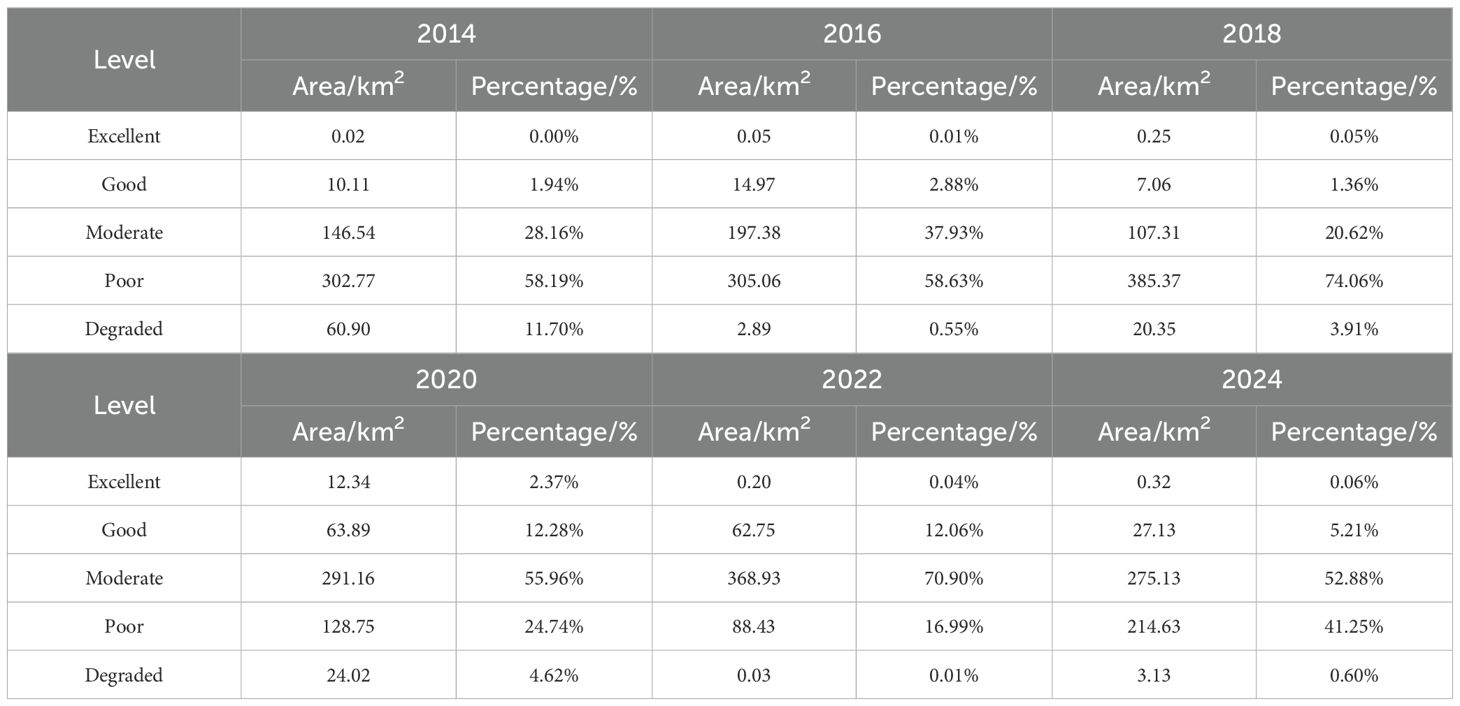
Table 3. Area percentages by ecological grade in each year.
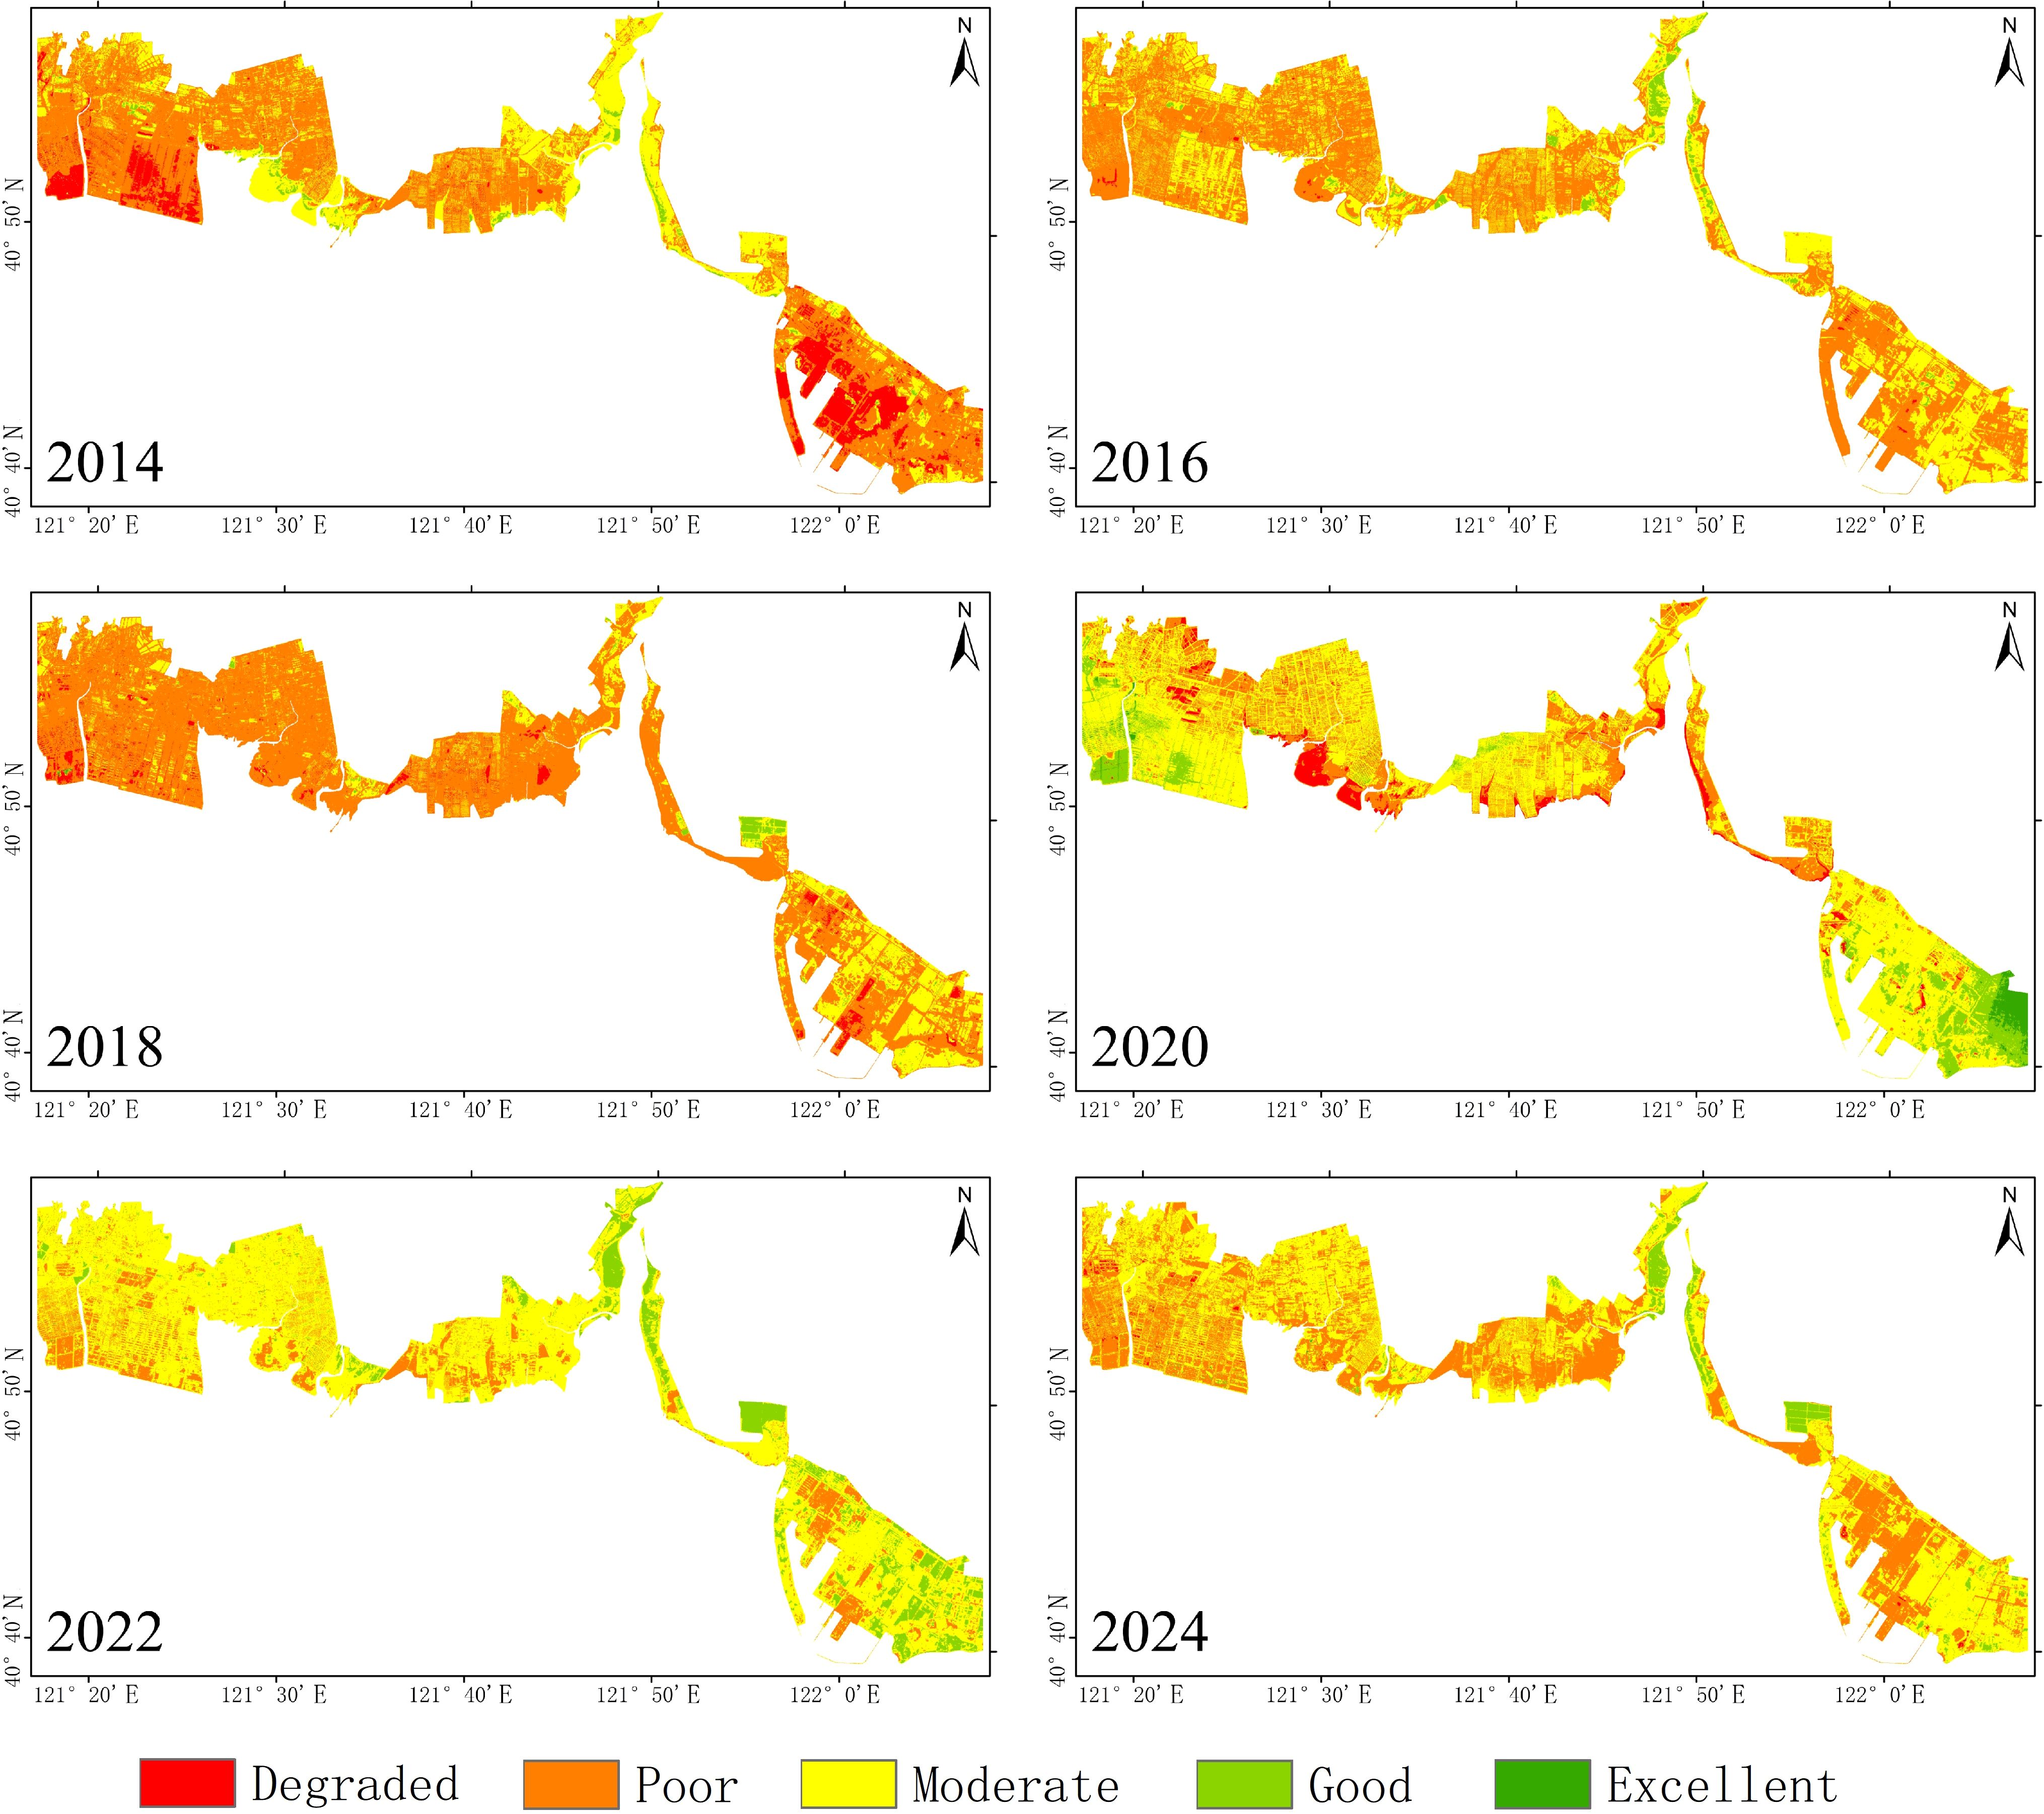
Figure 7. Spatiotemporal variation of ecological quality from 2014 to 2024.
From 2014 to 2018, the ecological quality was predominantly classified as “poor” (averaging 63.6% of the area annually), mainly due to increased wetland fragmentation caused by densely distributed aquaculture ponds on the western shore and the construction of Panjin Port on the eastern shore, compounded by a simultaneous decline in vegetation cover and hydrological connectivity that led to a “three-high stress” pattern of high dryness, high salinity, and high heat. After 2018, with the implementation of ecological restoration projects, the “Moderate” level became dominant by 2024 (averaging 59.9% of the area annually); on the western shore, the removal of aquaculture embankments restored the tidal channel network, and the growth of Suaeda salsa reached a significant scale, leading to increased vegetation cover and subsequent reductions in salinity, dryness, and heat. Overall, the proportion of the area showing ecological improvement increased by 3.3%, while the areas classified as poor or degraded decreased by 28%, indicating a marked enhancement of the ecological environment.
During the pre-restoration phase (2014–2018), the coastal zone exhibited a “dual-polar degradation” pattern, with the eastern side, affected by port operations, forming an ecological depression (IRSEI < 0.2), while the western side experienced a sharp reduction in wetlands due to the expansion of aquaculture ponds. However, in the post-restoration phase (2018–2024), the spatial pattern shifted to a “core–edge gradient recovery” model, where key restoration areas saw an approximate IRSEI increase of 0.2, and the restoration of hydrological connectivity generated an ecological radiation effect that enhanced the ecological quality of the surrounding areas.
3.3.2 Magnitude of ecological change
After reclassifying the IRSEI for each year into categories (Excellent: 5; Good: 4; Moderate: 3; Poor: 2; degraded: 1) and computing the difference values, the changes were divided into five levels: significantly detected (ΔIRSEI ≤ -3), slightly detected (ΔIRSEI ≤ -1), Remained Stable(ΔIRSEI = 0), slightly improved (ΔIRSEI ≥ 1) and significantly improved (ΔIRSEI ≥ 3), and the ecology before and after the ecological restoration in the coastal area of Liaohe Estuary is further analyzed (Table 4, Figure 8). From 2014 to 2024, the study area exhibited an overall pattern of “overall improvement, local deterioration.” Specifically, 48.1% of the area showed slightly improved (ΔIRSEI ≥ 1), mainly concentrated in zones where aquaculture areas were converted back to wetlands, tidal channels were restored, and Suaeda salsa was planted. A mere 0.24% of the area experienced significant improved (ΔIRSEI ≥ 3), which spatially overlapped with the Suaeda salsa plantation zones, confirming the effectiveness of the restoration measures, while 11.1% of the area exhibited slight deteriorated (ΔIRSEI ≤ -1), primarily distributed in the eastern coastal zone where aquaculture ponds were not dismantled.
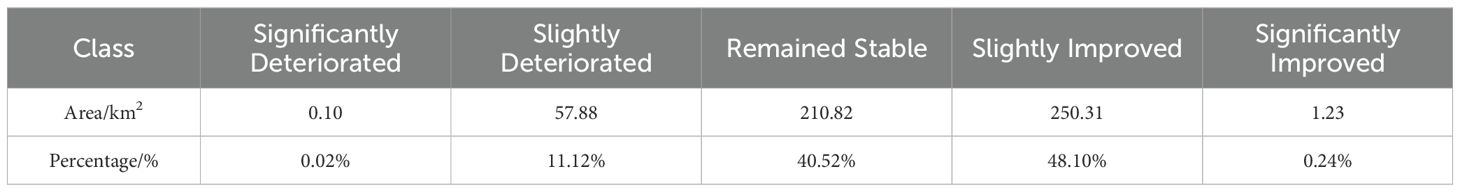
Table 4. Degree of ecological change 2014 to 2024.
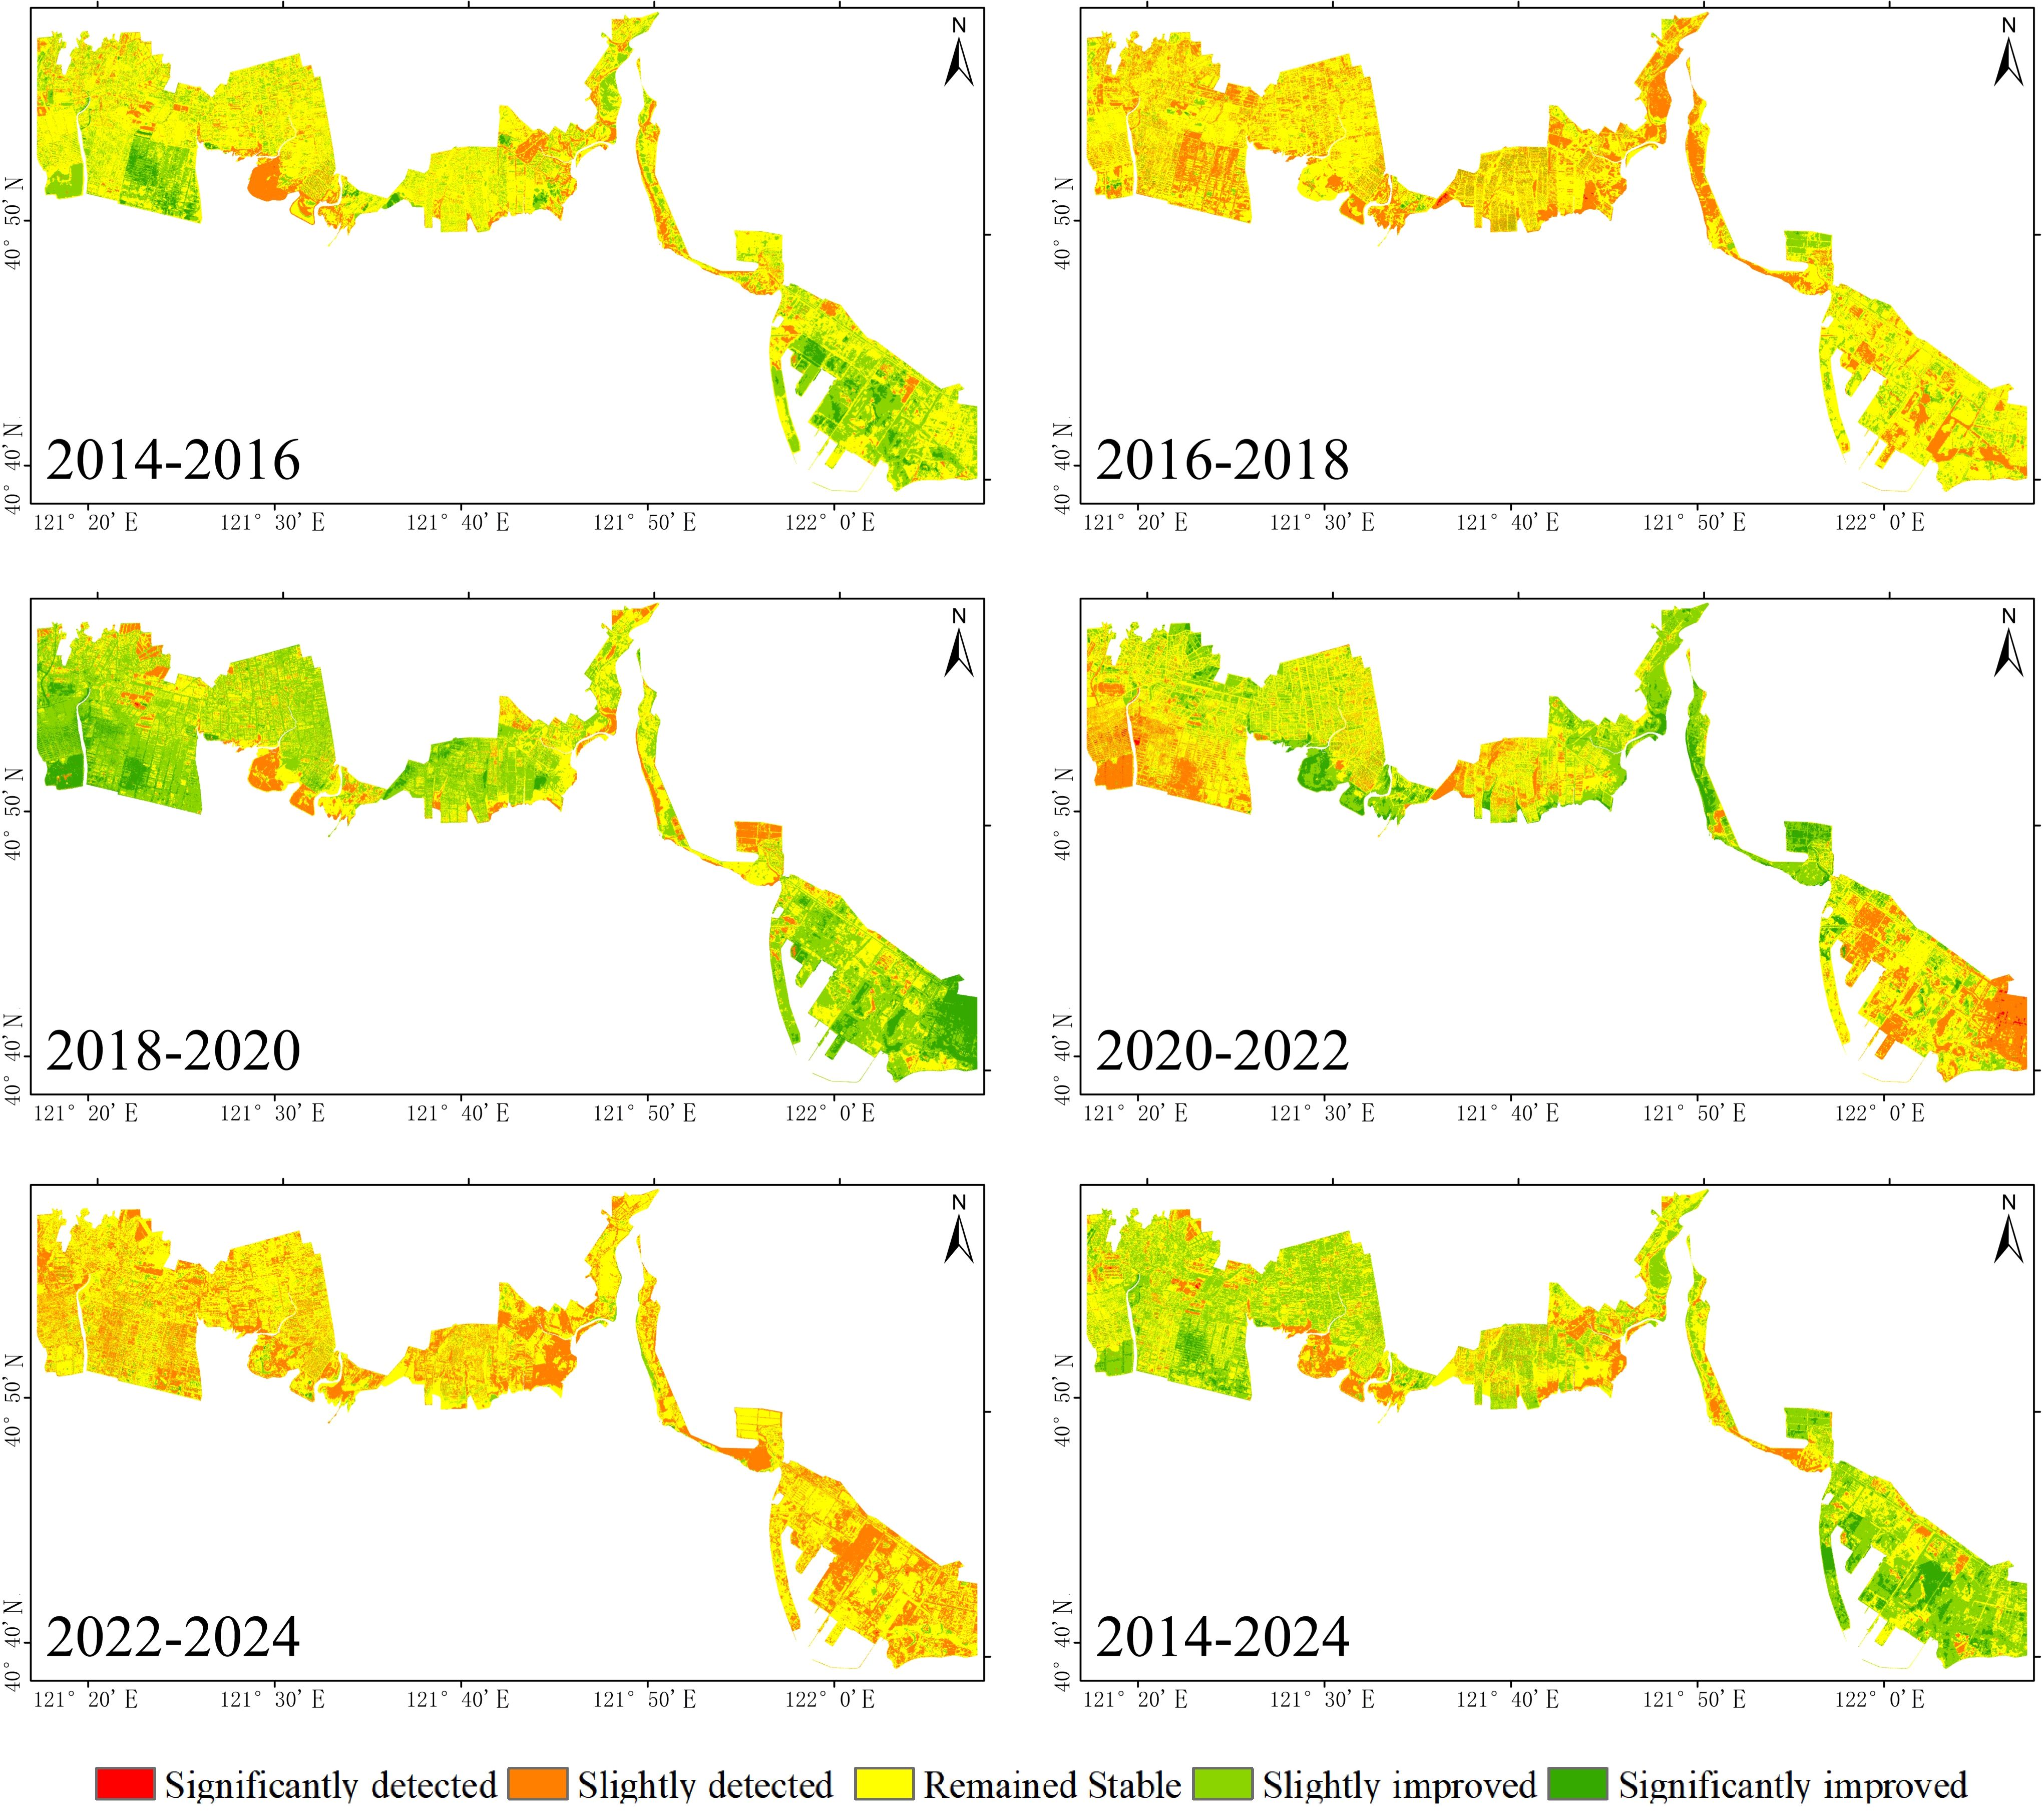
Figure 8. Area distribution by degree of ecological change from 2014 to 2024.
4 Discussion
4.1 Advantages of IRSEI in assessing coastal wetland restoration
Compared to the traditional RSEI, the Improved Remote Sensing Ecological Index (IRSEI) exhibits enhanced sensitivity, specificity, and ecological interpretability in complex coastal systems. By integrating salinity as a fifth indicator, IRSEI captures the edaphic and hydrological nuances that define wetland recovery trajectories in the Liaohe Estuary. Principal Component Analysis (PCA) showed that the first component (PC1) consistently explained over 71.94% of the total variance across years—an improvement from 63.91% in RSEI—underscoring the stronger ecological representativeness of IRSEI.
This improvement is particularly critical in salt-affected coastal areas where saline intrusion and secondary salinization are key limiting factors for vegetation succession and soil health. Spatial comparison further confirms that IRSEI effectively distinguishes ecological gradients across land-use types. In particular, salt marshes and Suaeda salsa zones exhibit more precise and sensitive responses in IRSEI values than in RSEI, which tends to overgeneralize ecological improvement based solely on greenness or wetness indicators.
4.2 Ecological impacts of restoration measures in the Liaohe Estuary
The temporal evolution of IRSEI from 2014 to 2024 reveals a clear positive trend in coastal wetland restoration. The average IRSEI increased from 0.35 to 0.43 over the ten-year period, representing a 23% enhancement in ecological quality. Despite a transient decline between 2016 and 2018 due to construction-related disturbances, post-2018 recovery accelerated with the implementation of targeted interventions such as tidal creek dredging, shoreline retreat, and Suaeda salsa replanting. Regionally, the most significant improvements were concentrated in zones undergoing hydrological rehabilitation, salinity reduction, and vegetation recolonization. Notably, transition areas between Phragmites australis and Suaeda salsa communities demonstrated strong gains, suggesting that restoration efforts not only enhanced structural connectivity but also reinstated critical ecosystem functions such as nutrient cycling, sediment retention, and habitat provision.
Furthermore, spatial patterns reveal a “core-edge gradient recovery” mechanism, wherein ecological improvements originated from intensively managed core areas and radiated outward to surrounding buffer zones. This ecological diffusion effect created measurable “restoration radiation belts,” which helped improve the quality of adjacent low-intervention areas. For example, 48.1% of the “slightly improved” and 0.24% of the “significantly improved” zones were concentrated in moistening zones, restored tidal creeks, and vegetation replanting areas, reflecting the synergistic impact of integrated management. Nevertheless, some aquaculture-converted regions showed only moderate IRSEI improvements, likely due to persistent soil compaction, residual salinity, or inadequate freshwater inflows. These findings highlight the necessity of combining land-use restructuring and hydrological connectivity with vegetation-based restoration strategies.
4.3 Applicability and transferability of IRSEI
The incorporation of a salinity-sensitive metric makes IRSEI particularly suitable for evaluating ecological quality in coastal wetlands subject to tidal fluctuations, seawater intrusion, and saline-alkaline soils. Constructed using standardized normalization and PCA, IRSEI facilitates comparability across different years, sites, and satellite datasets, demonstrating its scalability and transferability to other coastal zones in China and beyond, such as the Yellow River Delta, Yangtze Estuary, and Mekong Delta.
However, due to significant human disturbances (e.g., embankments and salinization), the IRSEI values in coastal wetlands are substantially lower than those in terrestrial ecosystems such as croplands and forests (mean difference: 0.2–0.4). To ensure comparability in pre- and post-restoration assessments, this study did not apply separate normalization to coastal zones, potentially underestimating the absolute ecological benefits of restoration. Future efforts should establish a zonal and hierarchical evaluation framework, incorporating differentiated baselines, tailored reference systems, and land-sea parameter weighting to accurately assess ecological conditions.
Moreover, while the inclusion of salinity enhances IRSEI’s responsiveness, the dynamic nature of coastal systems calls for more refined and process-specific indicators. Future research should integrate Tidal Inundation Frequency (TIF), Sediment Mobility Index (SMI), and hyperspectral retrievals of soil sulfide or organic carbon content to evaluate hydrological restoration effects and carbon sequestration capacity. Additionally, multi-scale data sources, including high-resolution satellites (e.g., Sentinel-2, PlanetScope) and UAV imagery, can enhance temporal continuity and enable microscale monitoring of vegetation growth, germination, and habitat change, overcoming current limitations of Landsat’s 30 m spatial resolution and 16-day revisit cycle.
4.4 Implications for coastal restoration policy and monitoring
This study offers an operational, cost-effective remote sensing framework for monitoring and evaluating wetland restoration in large-scale coastal settings. By objectively quantifying ecological gains from restoration, IRSEI supports evidence-based decision-making for adaptive management and funding allocation. The classification scheme based on IRSEI values enables straightforward interpretation of ecological status and priority areas for intervention. In policy terms, IRSEI can be integrated into China’s “Marine ecological protection and restoration project” and “Ecological protection red line” monitoring systems, serving as a diagnostic tool for restoration progress and ecological compensation.
However, translating IRSEI trends into long-term sustainability assessments requires integrating biological indicators such as avian biodiversity, or benthic biomass. Future studies should seek to develop coupled index systems that link remote sensing products with biological and socio-ecological outcomes, thereby closing the gap between technical monitoring and holistic ecosystem service evaluation.
By advancing from an evaluation metric to a regulatory engine, IRSEI holds potential to inform data-driven, participatory, and adaptive management of coastal wetlands under climate change and human pressure.
Data availability statement
The raw data supporting the conclusions of this article will be made available by the authors, without undue reservation.
Author contributions
YZ: Conceptualization, Data curation, Formal Analysis, Funding acquisition, Investigation, Methodology, Project administration, Resources, Software, Supervision, Validation, Visualization, Writing – original draft, Writing – review & editing. WL: Conceptualization, Methodology, Project administration, Resources, Supervision, Writing – original draft, Writing – review & editing. ZL: Data curation, Formal Analysis, Investigation, Methodology, Visualization, Writing – original draft, Writing – review & editing. YX: Conceptualization, Methodology, Resources, Validation, Visualization, Writing – original draft, Writing – review & editing. LY: Conceptualization, Methodology, Visualization, Writing – original draft, Writing – review & editing. RZ: Conceptualization, Formal Analysis, Methodology, Writing – original draft, Writing – review & editing.
Funding
The author(s) declare that financial support was received for the research and/or publication of this article. This work was supported by the National Key R&D Program of China (2023YFC3108003); the National Marine Data and Information Service: “Revealing the List and Taking the Lead” project – Research on Ecological Evaluation Techniques Based on Marine Ecological Zones; the Study on key technologies of regional effect evaluation of marine ecological protection and restoration (2024ZRBSHZ102); and the Study on Key Technologies for Evaluating the Effectiveness of Marine Ecological Conservation and Restoration Areas (2024ZRBSHZ100).
Conflict of interest
The authors declare that the research was conducted in the absence of any commercial or financial relationships that could be construed as a potential conflict of interest.
Generative AI statement
The author(s) declare that Generative AI was used in the creation of this manuscript. Text Polishing and English Translation.
Publisher’s note
All claims expressed in this article are solely those of the authors and do not necessarily represent those of their affiliated organizations, or those of the publisher, the editors and the reviewers. Any product that may be evaluated in this article, or claim that may be made by its manufacturer, is not guaranteed or endorsed by the publisher.
References
Barletta M., Barletta-Bergan A., Saint-Paul U., and Hubold G. (2005). The role of salinity in structuring the fish assemblages in a tropical estuary. J. Fish Biol. 66, 45–72. doi: 10.1111/j.0022-1112.2005.00582.x
Chang Y., Chang C., Li Y., Liu M., Lv J., Hu Y., et al (2022). Predicting Dynamics of the Potential Breeding Habitat of Larus saundersi by MaxEnt Model under Changing Land-Use Conditions in Wetland Nature Reserve of Liaohe Estuary, China. Remote Sens. 14 (3), 552. doi: 10.3390/rs14030552
Dang C., Morrissey E. M., Neubauer S C., and Franklin R. B. (2019). Novel microbial community composition and carbon biogeochemistry emerge over time following saltwater intrusion in wetlands. Global Change Biol. 25 (2), 549–561. doi: 10.1111/gcb.14486
Duo L., Wang J. Q., Zhong Y. P., Jiang C. Q, Chen Y. Y., and Guo X. F. (2024). Ecological environment quality assessment of coal mining cities based on GEE platform: A case study of Shuozhou, China. Int. J. Coal Sci. Technol. 11, 162–176. doi: 10.1007/s40789-024-00723-8
Frazier A. E. and Kedron P. (2017). Landscape metrics: Past progress and future directions. Current Landscape Ecology Reports. 2 (3), 63–72. doi: 10.1007/s40823-017-0026-0
Ge S. B., Song X. J., Chen R., Yang Y. J., Ma J., and Chen F. (2024). Spatiotemporal changes and driving factors of the improved remote sensing ecological index in the northern slope of the Tianshan Mountains over the past 30 years. J. Ecol. Rural Environ. 40, 865–876. doi: 10.19741/j.issn.1673-4831.2023.0832
Hu Y. Y., Luo H. X., Dai S. P., Yu X., Deng C. M., Li H. L., et al. (2024). Evaluation and driving forces analysis of ecological environment quality in Wuzhishan City based on remote sensing ecological index. Ecol. Environ. Sci. 33, 1624–1633. doi: 10.16258/j.cnki.1674-5906.2024.10.014
Jiménez-Muñoz J. C. and Sobrino J. A. (2003). A generalized single-channel method for retrieving land surface temperature from remote sensing data. J. Geophys Res: Atmosph 108, 4688. doi: 10.1029/2003JD003480
Ke L., Tan Q., Lu Y., Wang Q. M., Zhang G. S., Zhao Y., et al. (2024). Classification and spatio-temporal evolution analysis of coastal wetlands in the Liaohe Estuary from 1985 to 2023: based on feature selection and sample migration methods. Front. Forests Global Change. 7, 1406473. doi: 10.3389/ffgc.2024.1406473
Li S. Z., Wang L. Z., Zhao S., and Gui F. (2023). Dynamic evaluation of ecological environment quality in Zhoushan Island based on the Google Earth Engine platform. Bull. Soil Water Conserv. 43, 293–302.
Masek J. G., Vermote E. F., Saleous N E., Wolfe R., Hall F. G., and Huemmrich K. F.. (2006). A Landsat surface reflectance dataset for North America 1990-2000. IEEE Geosci. Remote Sens. Lett. 3, 68–72. doi: 10.1109/LGRS.2005.857030
Mohammadi A., Costelloe J. F., and Ryu D. (2017). Application of time series of remotely sensed normalized difference water, vegetation and moisture indices in characterizing flood dynamics of large-scale arid zone floodplains. Remote Sens. Environ. 190, 70–82. doi: 10.1016/j.rse.2016.12.003
Nguyen H. T., Van T. T. H., and Tran T. T. (2019). Examining spatiotemporal salinity dynamics in the Mekong River Delta using Landsat data and an enhanced salinity index. Sci. Total Environ. 687, 1086–1096. doi: 10.1016/j.scitotenv.2019.06.016
Pennings S. C., Grant M. B., and Bertness M. D. (2010). Plant zonation in low-latitude salt marshes: disentangling the roles of flooding, salinity and competition. J. Ecol. 93, 159–167. doi: 10.1111/j.1365-2745.2004.00959.x
Sahak A. S. and Karsli F. (2024). A new approach for the assessment of urban eco-environmental quality based on remote sensing: A case study of Herat City, Afghanistan. J. Spatial Sci. 69, 937–962. doi: 10.1080/14498596.2024.2333743
Sun Y. Y., Cao H. T., Zhang J. B., Liu X. H., Yao J. Q., and Cui T. J. (2024). Study on the inversion method of coastal water salinity based on optical satellite remote sensing. J. Mar. Info. Technol. Appl. 39 (04), 211–223.
The State Council Information Office of the People’s Republic of China. (2024). Marine Eco-Environmental Protection in China. Beijing. Available at: http://www.scio.gov.cn/zfbps/zfbps_2279/202407/t20240711_854815.html
Tucker C. J. (1979). Red and photographic infrared linear combinations for monitoring vegetation. Remote Sens. Environ. 8, 127–150. doi: 10.1016/0034-4257(79)90013-0
Wang Y., Kang Y., Chen X., Guo C. C., Zhang M. L., and Ding C. L. (2021). Dynamic analysis of spatial evolution of tidal flat wetland landscape pattern in Liaohe Estuary. J. Dalian Ocean Univ. 36, 1009–1017. doi: 10.16535/j.cnki.dlhyxb.2020
Wang Y. K., Liu P. D., Liu J. T., Zhang D., Wang L. X., and Huang L. (2024). Spatiotemporal variation analysis of ecological environment quality in the Yellow River Delta based on an improved remote sensing ecological index. J. Ecol. Rural Environ. 40, 1179–1190. doi: 10.19741/j.issn.1673-4831.2023.1175
Wang Y., Wang X., Khan S., Zhou D., and Ke Y. (2023). Evaluation of mangrove restoration effectiveness using remote sensing indices-a case study in Guangxi Shankou Mangrove National Natural Reserve, China. Front. Mar. Sci. 10, 1280373. doi: 10.3389/fmars.2023.1280373
Wei W., Li C., and Chen X. (2021). Study on the changes and characteristics of urban coastal landscape pattern driven by coastal zone renovation and restoration —— Taking Shanghai Yingwuzhou Ecological Wetland as an example. J. Northwest Normal University: Natural Sci. Edition 57, 8. doi: 10.16783/j.cnki.nwnuz.2000
Xu H. (2006). Modification of Normalized Difference Water Index (NDWI) to Enhance Open Water Features in Remotely Sensed Imagery. International Journal of Remote Sensing 27 (14), 3025–3033. doi: 10.1080/01431160600589179
Xu H. (2013). Creation and application of the remote sensing-based ecological index for urban ecological quality assessment. Acta Ecol Sin. 33, 7853–7862. doi: CNKI
Zha Y., Gao J., and Ni S. (2003). Use of normalized difference built-up index in automatically mapping urban areas from TM imagery. Int. J. Remote Sens. 24, 583–594. doi: 10.1080/01431160304987
Zhang N., Liu Q., Yin K., Wang C. Y., and Guo X. H. (2024). Dynamic monitoring of ecological environment quality in rural settlements of the Three Gorges Reservoir Area based on RSEI. Ecol. Sci. 43, 7–14. doi: 10.14108/j.cnki.1008-8873.2024.05.002
Zhao X. Y., Tan S. C., Zhang S., Li Y. P., Wu H., and Wang C. (2024). Spatiotemporal variation and driving forces of ecological environment quality in the Tuojiang River Basin based on an improved RSEI model. J. Soil Water Conserv. 38, 151–163. doi: 10.13870/j.cnki.stbcxb.2024.05.017
Keywords: improved remote sensing ecological index (IRSEI), enhanced salinity index (ESI), Liaohe Estuary, coastal zone ecological restoration, ecological restoration effectiveness evaluation
Citation: Zhang Y, Lu W, Liu Z, Xu Y, Yang L and Zeng R (2025) Assessment of coastal ecological restoration effectiveness using an improved remote sensing ecological index: a case study of the Liaohe Estuary. Front. Ecol. Evol. 13:1603614. doi: 10.3389/fevo.2025.1603614
Received: 31 March 2025; Accepted: 21 May 2025;
Published: 09 June 2025.
Edited by:
Jesús Ernesto Arias González, National Polytechnic Institute of Mexico (CINVESTAV), MexicoReviewed by:
Haifu Li, Shenyang Agricultural University, ChinaChenxu Wang, Beijing Normal University, China
Copyright © 2025 Zhang, Lu, Liu, Xu, Yang and Zeng. This is an open-access article distributed under the terms of the Creative Commons Attribution License (CC BY). The use, distribution or reproduction in other forums is permitted, provided the original author(s) and the copyright owner(s) are credited and that the original publication in this journal is cited, in accordance with accepted academic practice. No use, distribution or reproduction is permitted which does not comply with these terms.
*Correspondence: Wenhai Lu, bHUtd2VuaGFpQDE2My5jb20=