 Gina P. Sykes1,2
 Louisa Normington2Jenna Poelzer2
 Shiyang Zhao3Dana Allen2Samuel Stuart2Eponine Oler2Komal Jot2Vasuk Gautam4
 Xin Zhao2
 Jianguo Xia5
 Glen C. Jickling1
 David S. Wishart2,6,7,8*
- 1Department of Medicine, University of Alberta, Edmonton, AB, Canada
- 2Department of Biological Sciences, University of Alberta, Edmonton, AB, Canada
- 3Department of Ecosystem Science & Management, University of Northern British Columbia, Prince George, BC, Canada
- 4Norton Neuroscience Institute, Norton Healthcare, Louisville, KY, United States
- 5Department of Microbiology and Immunology, McGill University, Montreal, QC, Canada
- 6Department of Computing Science, University of Alberta, Edmonton, AB, Canada
- 7Department of Laboratory Medicine and Pathology, University of Alberta, Edmonton, AB, Canada
- 8Faculty of Pharmacy and Pharmaceutical Sciences, University of Alberta, Edmonton, AB, Canada
Community ecology studies how species interact in their ecosystems, influenced by environmental and phenotypic factors. Analyzing these complex interactions requires specialized software or proficiency in statistical programming. While many stand-alone community ecology software tools exist, there is a gap for a free and widely available webserver to support community ecology analysis. To address this shortcoming we have developed WEGAN (Web-based Ecological Group Analysis), an easy-to-use webserver for analyzing and visualizing community ecology data. WEGAN is designed to provide features offered by popular programs such as vegan through a point-and-click web interface. Specifically, WEGAN provides a wide range of community ecology methods to support the analysis and visualization of trends in dispersal, diversity, and taxonomy as well as univariate and multivariate statistics for clustering, classification, correlation, and ordination analysis. WEGAN offers intuitive workflows and generates detailed tables, publication quality figures and a complete (reproducible) R coding history of all inputs, operations and outputs for every user session, together with comprehensive tutorials. WEGAN was developed to help with the teaching and training of community ecology and to encourage wider use of sophisticated community ecology techniques. WEGAN is freely available at https://www.wegan.ca.
1 Introduction
Analyzing community ecology data poses several computational challenges due to its complexity and high dimensionality (McCune et al., 2002). Ecological communities often consist of numerous interacting species, each responding to environmental factors and other species in unique ways. This results in data with intricate, non-linear relationships. Furthermore, community ecology datasets are typically sparse, with many species appearing infrequently, making the results prone to biases from sampling limitations or variations in detection methods. Temporal and spatial variability adds further layers of complexity, as community structures can shift drastically across locations or seasons. As a result, community ecologists often require sophisticated modeling techniques that balance interpretability with computational demands. Historically, most community ecologists have relied heavily on their knowledge of R programming to perform statistical analysis and data presentation. Indeed, the vegan R package (Oksanen et al., 2022) has become ubiquitous in the field of community ecology. Unfortunately, the effective use of R necessitates overcoming a considerable learning curve and can pose a significant barrier to those with limited programming skills. Developing more accessible, user-friendly tools with point-and-click graphical user interfaces (GUIs) is important to facilitate education in the best practices for community ecology data analysis.
For instance, BiodiversityR is an R Commander GUI that has been adapted for the vegan package (Kindt and Coe, 2005). However, it still requires some knowledge of R, access to high-end computing resources, and must be downloaded and installed locally. Ade4shiny (Thioulouse et al., 2018) is another example of a community ecology webserver with a simple GUI, but it is limited to only providing an interface for ordination analysis. Several other community ecology webservers with sophisticated GUIs have also appeared such as MicrobiomeAnalyst (Lu et al., 2023) and the SPECIES webserver (Stephens et al., 2019). However, these servers are limited to analyzing specific types of communities (i.e., microbes) or supporting specific analytical methods (i.e., niche and community inference). In addition to these freeware packages and webservers, there are several comprehensive commercial tools with sophisticated GUIs such as Canoco (Šmilauer and Lepš, 2014), PC-ORD (McCune, 1986), PRIMER 7 (Anderson, 2024), and Pisces-CAP (Henderson, 2019). However, these tools require a paid license, must be downloaded and run on a high-end computer with a specific operating system.
The lack of a free, and comprehensive webserver for community ecology data analysis led us to develop WEGAN (Web-based Ecological Group Analysis). WEGAN is essentially an easy-to-use, point-and-click webserver that builds on concepts found in vegan (Oksanen et al., 2022). Indeed, just like vegan, WEGAN has been designed to assist users with exploring and visualizing community ecology data by providing a wide range of tools to support correlation, dispersal, diversity, and taxonomy analysis. WEGAN also supports a large number of univariate and multivariate statistical analyses for clustering and ordination. WEGAN uses a state-of-the-art GUI that allows users to easily load and process data as well as create, visualize and modify high quality tables and figures for use in publications. WEGAN also provides users with a complete R coding history of all inputs, operations and outputs for each session. This allows users to reproduce their analyses by re-running the generated R history file on a downloadable, Dockerized environment identical to that employed by WEGAN. While primarily designed to serve community ecology researchers, WEGAN is ideal as a teaching tool, allowing students and novices to quickly become familiar with advanced ecological data analysis concepts and techniques. WEGAN also contains frequently asked questions (FAQs) and offers an extensive tutorial. WEGAN is freely available at https://www.wegan.ca.
2 Webserver description
2.1 Design and GUI
WEGAN has been designed specifically for ease-of-use by providing efficient workflows that simplify complex analytical tasks and provide visually appealing output. Figure 1 summarizes WEGAN’s overall design and data analysis workflow. The WEGAN GUI was modeled after the Analyst suite of webservers (Ewald et al., 2024; Pang et al., 2024). The landing page (Figure 2) allows users to easily navigate to each of its eight analysis modules: 1) Clustering and Classification; 2) Correlation; 3) Dispersal; 4) Diversity; 5) Ordination; 6) Plotting; 7) Statistics and 8) Taxonomy. Each module incorporates “Upload”, “Export”, and “Customize Graph” buttons for parameter selection and for output customization. “Submit” and “Proceed” buttons streamline task execution, while download options allow users to save graphical or tabular data in various formats for further analysis. WEGAN also offers interactive visualization options for several modules such as Statistics and Clustering. Users can easily update graphs or charts, interactively zoom in or out on specific areas, and adjust various visualization parameters.

Figure 1. The WEGAN workflow. WEGAN’s workflow consists of four steps: 1) analysis module selection; 2) data upload; 3) data processing and 4) data analysis (via its eight functional modules). Data types required for each module are identified with a solid border. Optional data types for each module are identified with a dotted border. Arrangements of sites, species, variables, and taxonomic rank(s) (as applicable) in the various data types are outlined in the data upload section. Arrows with a grey outline indicate the pathway for uploading community abundance data. Arrows without a grey outline indicate the pathway for uploading taxonomic, environmental, and trait data. Created in https://BioRender.com.
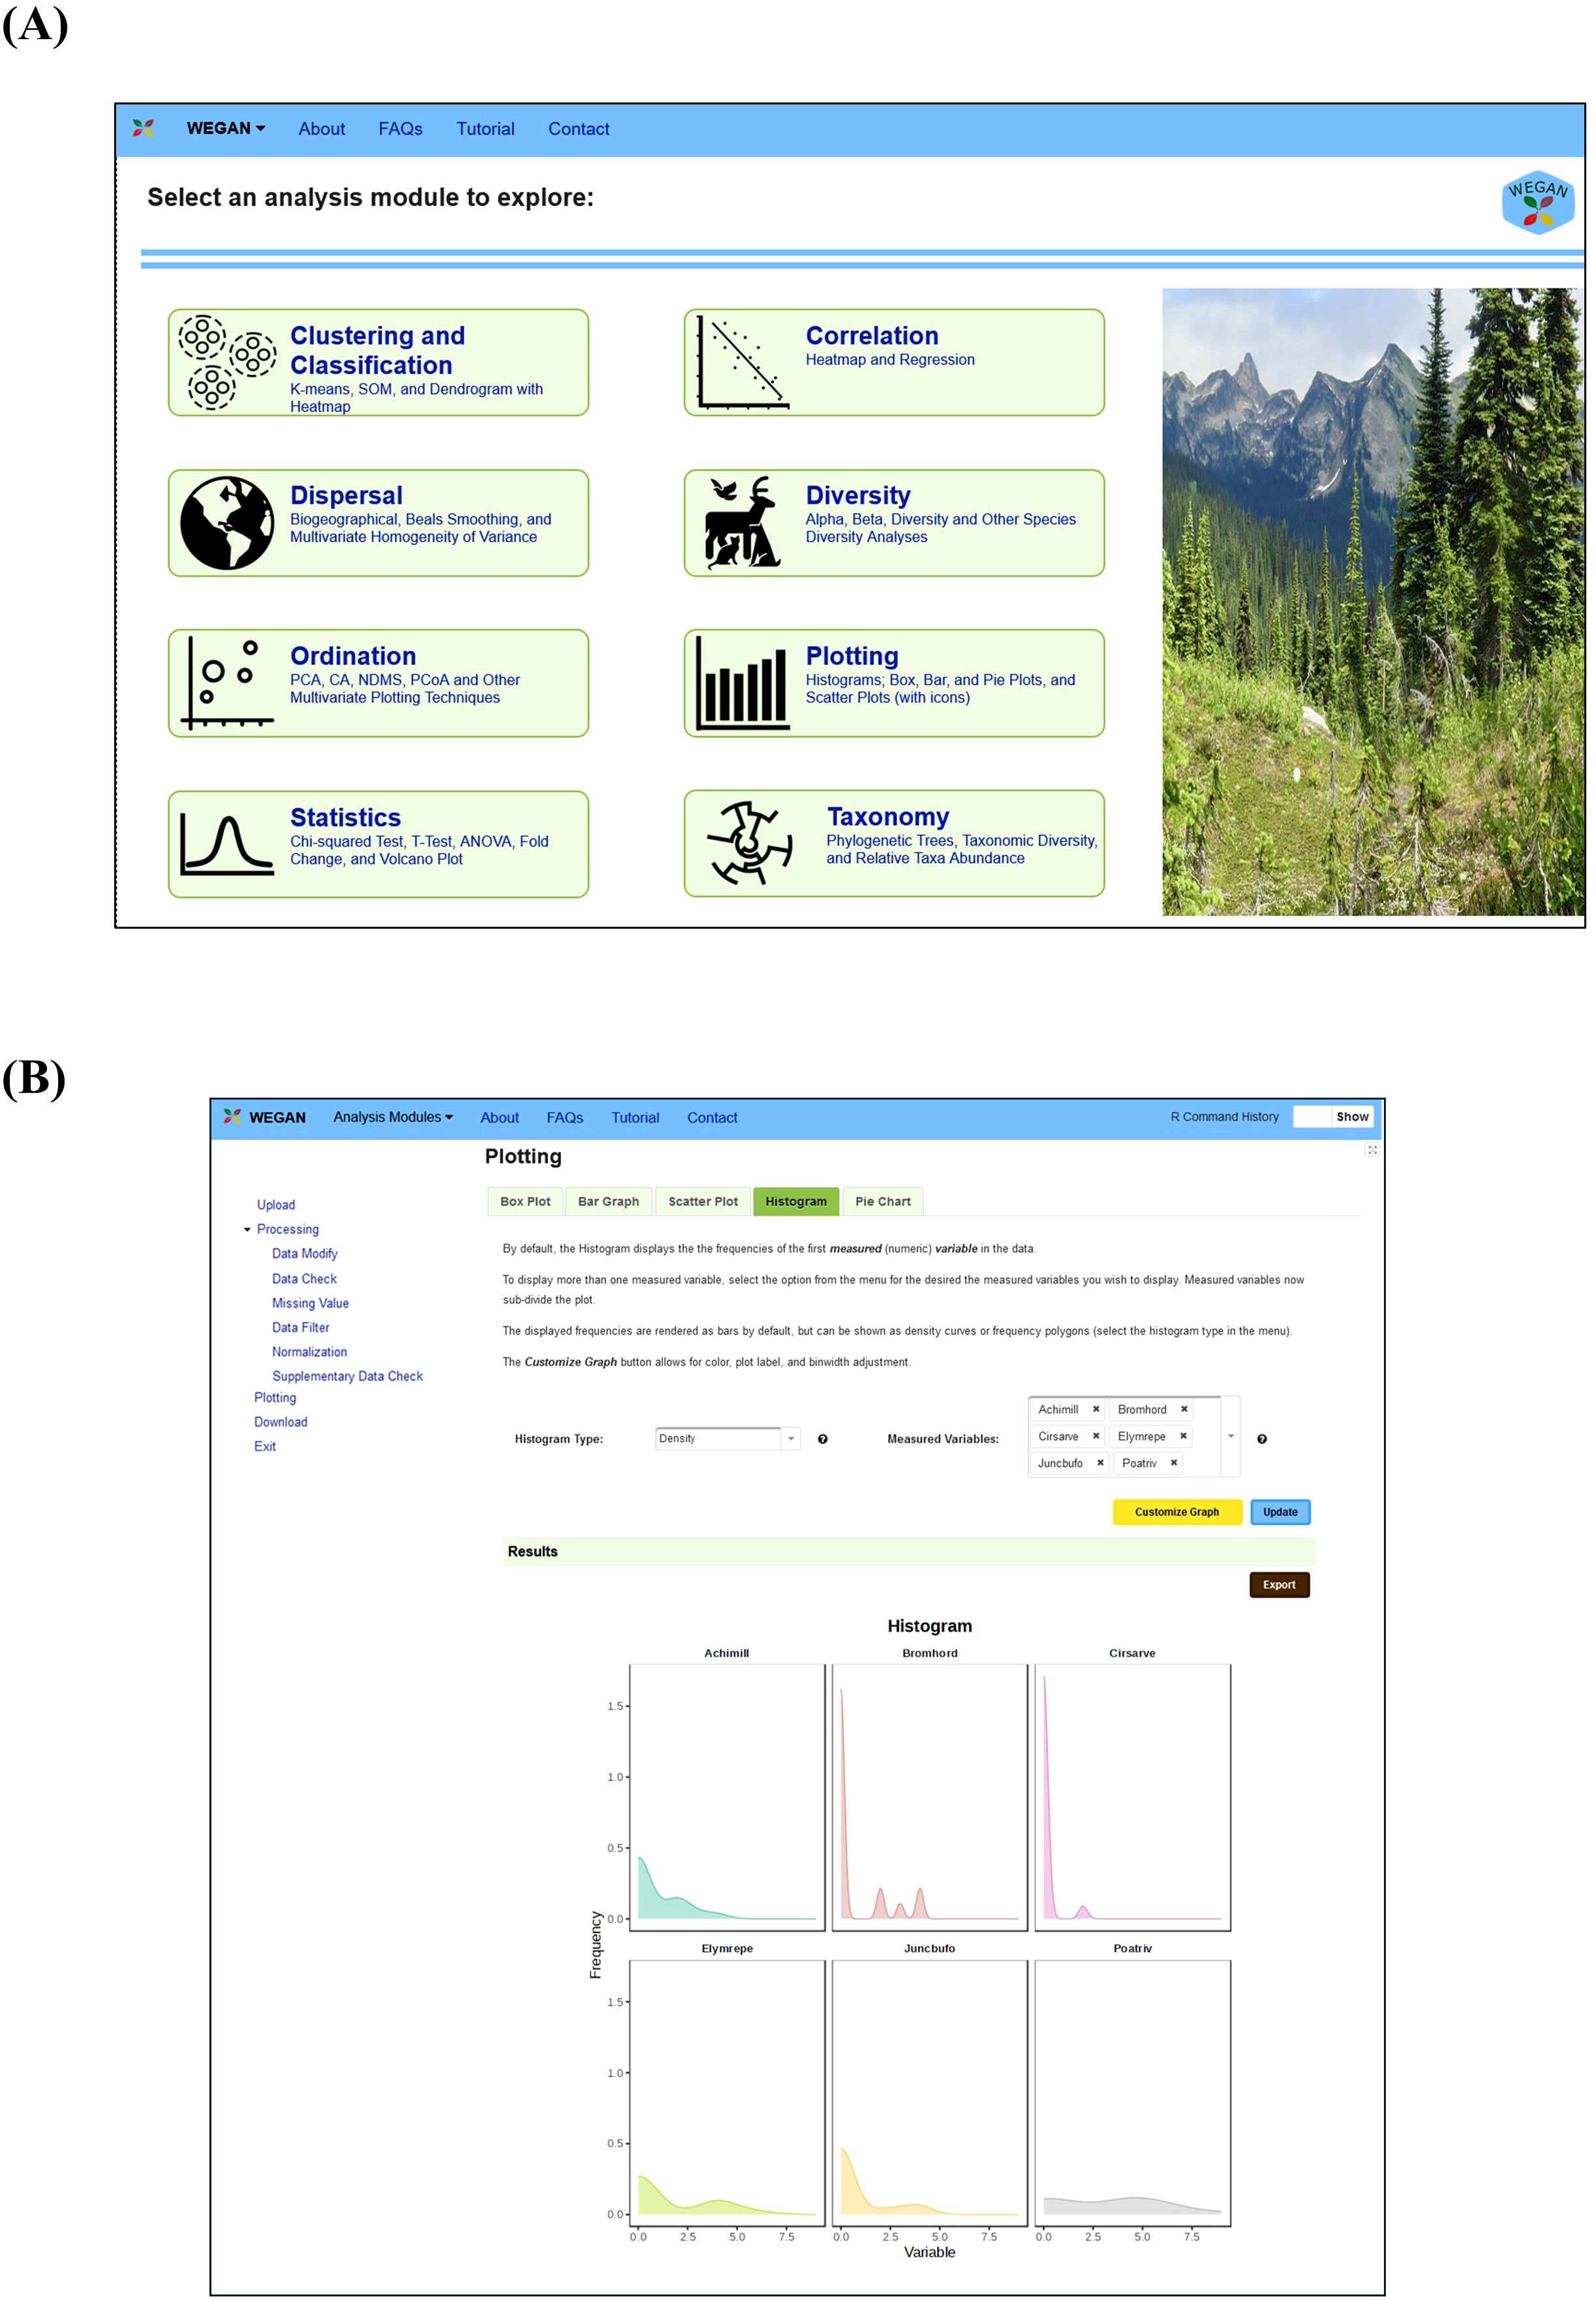
Figure 2. Screenshots of WEGAN web pages. (A) The WEGAN homepage. Module icons allow users to easily navigate to each of the eight analysis modules (Clustering and Classification, Correlation, Dispersal, Diversity, Ordination, Plotting, Statistics and Taxonomy). (B) The plotting webpage in WEGAN, shown with the Dune example dataset presenting select species in a density histogram.
2.2 Implementation
WEGAN was implemented using the PrimeFaces library (version 6.1), which is based on JavaServer Faces (Jakarta Faces) technology. Most of the backend computation and visualization functions are written in R (version 4.0.5). Over two hundred and fifty different R functions and over five hundred core Java methods consisting of thousands of lines of code were written and tested during the development of WEGAN. Communication between Java and R is done through TCP/IP using the Rserve program. WEGAN is hosted on the Google Cloud Platform (GCP) on a server equipped with a 2.2 GHz CPU running Ubuntu 20.04.6 LTS (GNU/Linux 5.15.0-1068-gcp x86_64) with 8 GB of RAM and 500 GB of hard drive storage. The WEGAN webserver is hosted at https://www.wegan.ca by the Wishart Lab at the University of Alberta. The code for the WEGAN webserver is available on bitbucket (https://bitbucket.org/wishartlab/wegan). All example datasets are also bundled with the WEGAN codebase. A Dockerized (Merkel, 2014) environment for reproducing WEGAN analyses is also available for local installation (see below). All code is released under a GNU GPL v2 or greater license.
2.3 Locally reproducible results
One of the distinctive features of WEGAN’s GUI is its R-command window. As a user proceeds through their WEGAN analysis session, they can directly observe (on the right side of the window) the R commands that are used to generate each step of the workflow (Figure 3). This R-command window provides novice R programmers with the ability to see and link specific R commands to analytical functions, figures and tables that WEGAN generates. This is useful for helping aid the transition to more independent analyses using R, so that users become more comfortable using R, and are able to extend these capabilities to other analyses and applications. This R-command history can also be used to precisely replicate a WEGAN analysis session within a user’s local computing environment. To enable this, WEGAN offers a Dockerized solution (Figure 3). Docker (Merkel, 2014) is a tool that allows a software application, its operating system, and all the necessary components to be placed in a portable container. This containerized program suite can be downloaded and run on any computer using any local operating system. To reproduce the results of a specific WEGAN session users can download the R-command history for their specific session. They can also download and install the provided Docker environment on their computer and upload the R-command history to precisely regenerate their session results, locally. Instructions for running the R script in the Docker container are provided, as well as information about installing the Docker container.
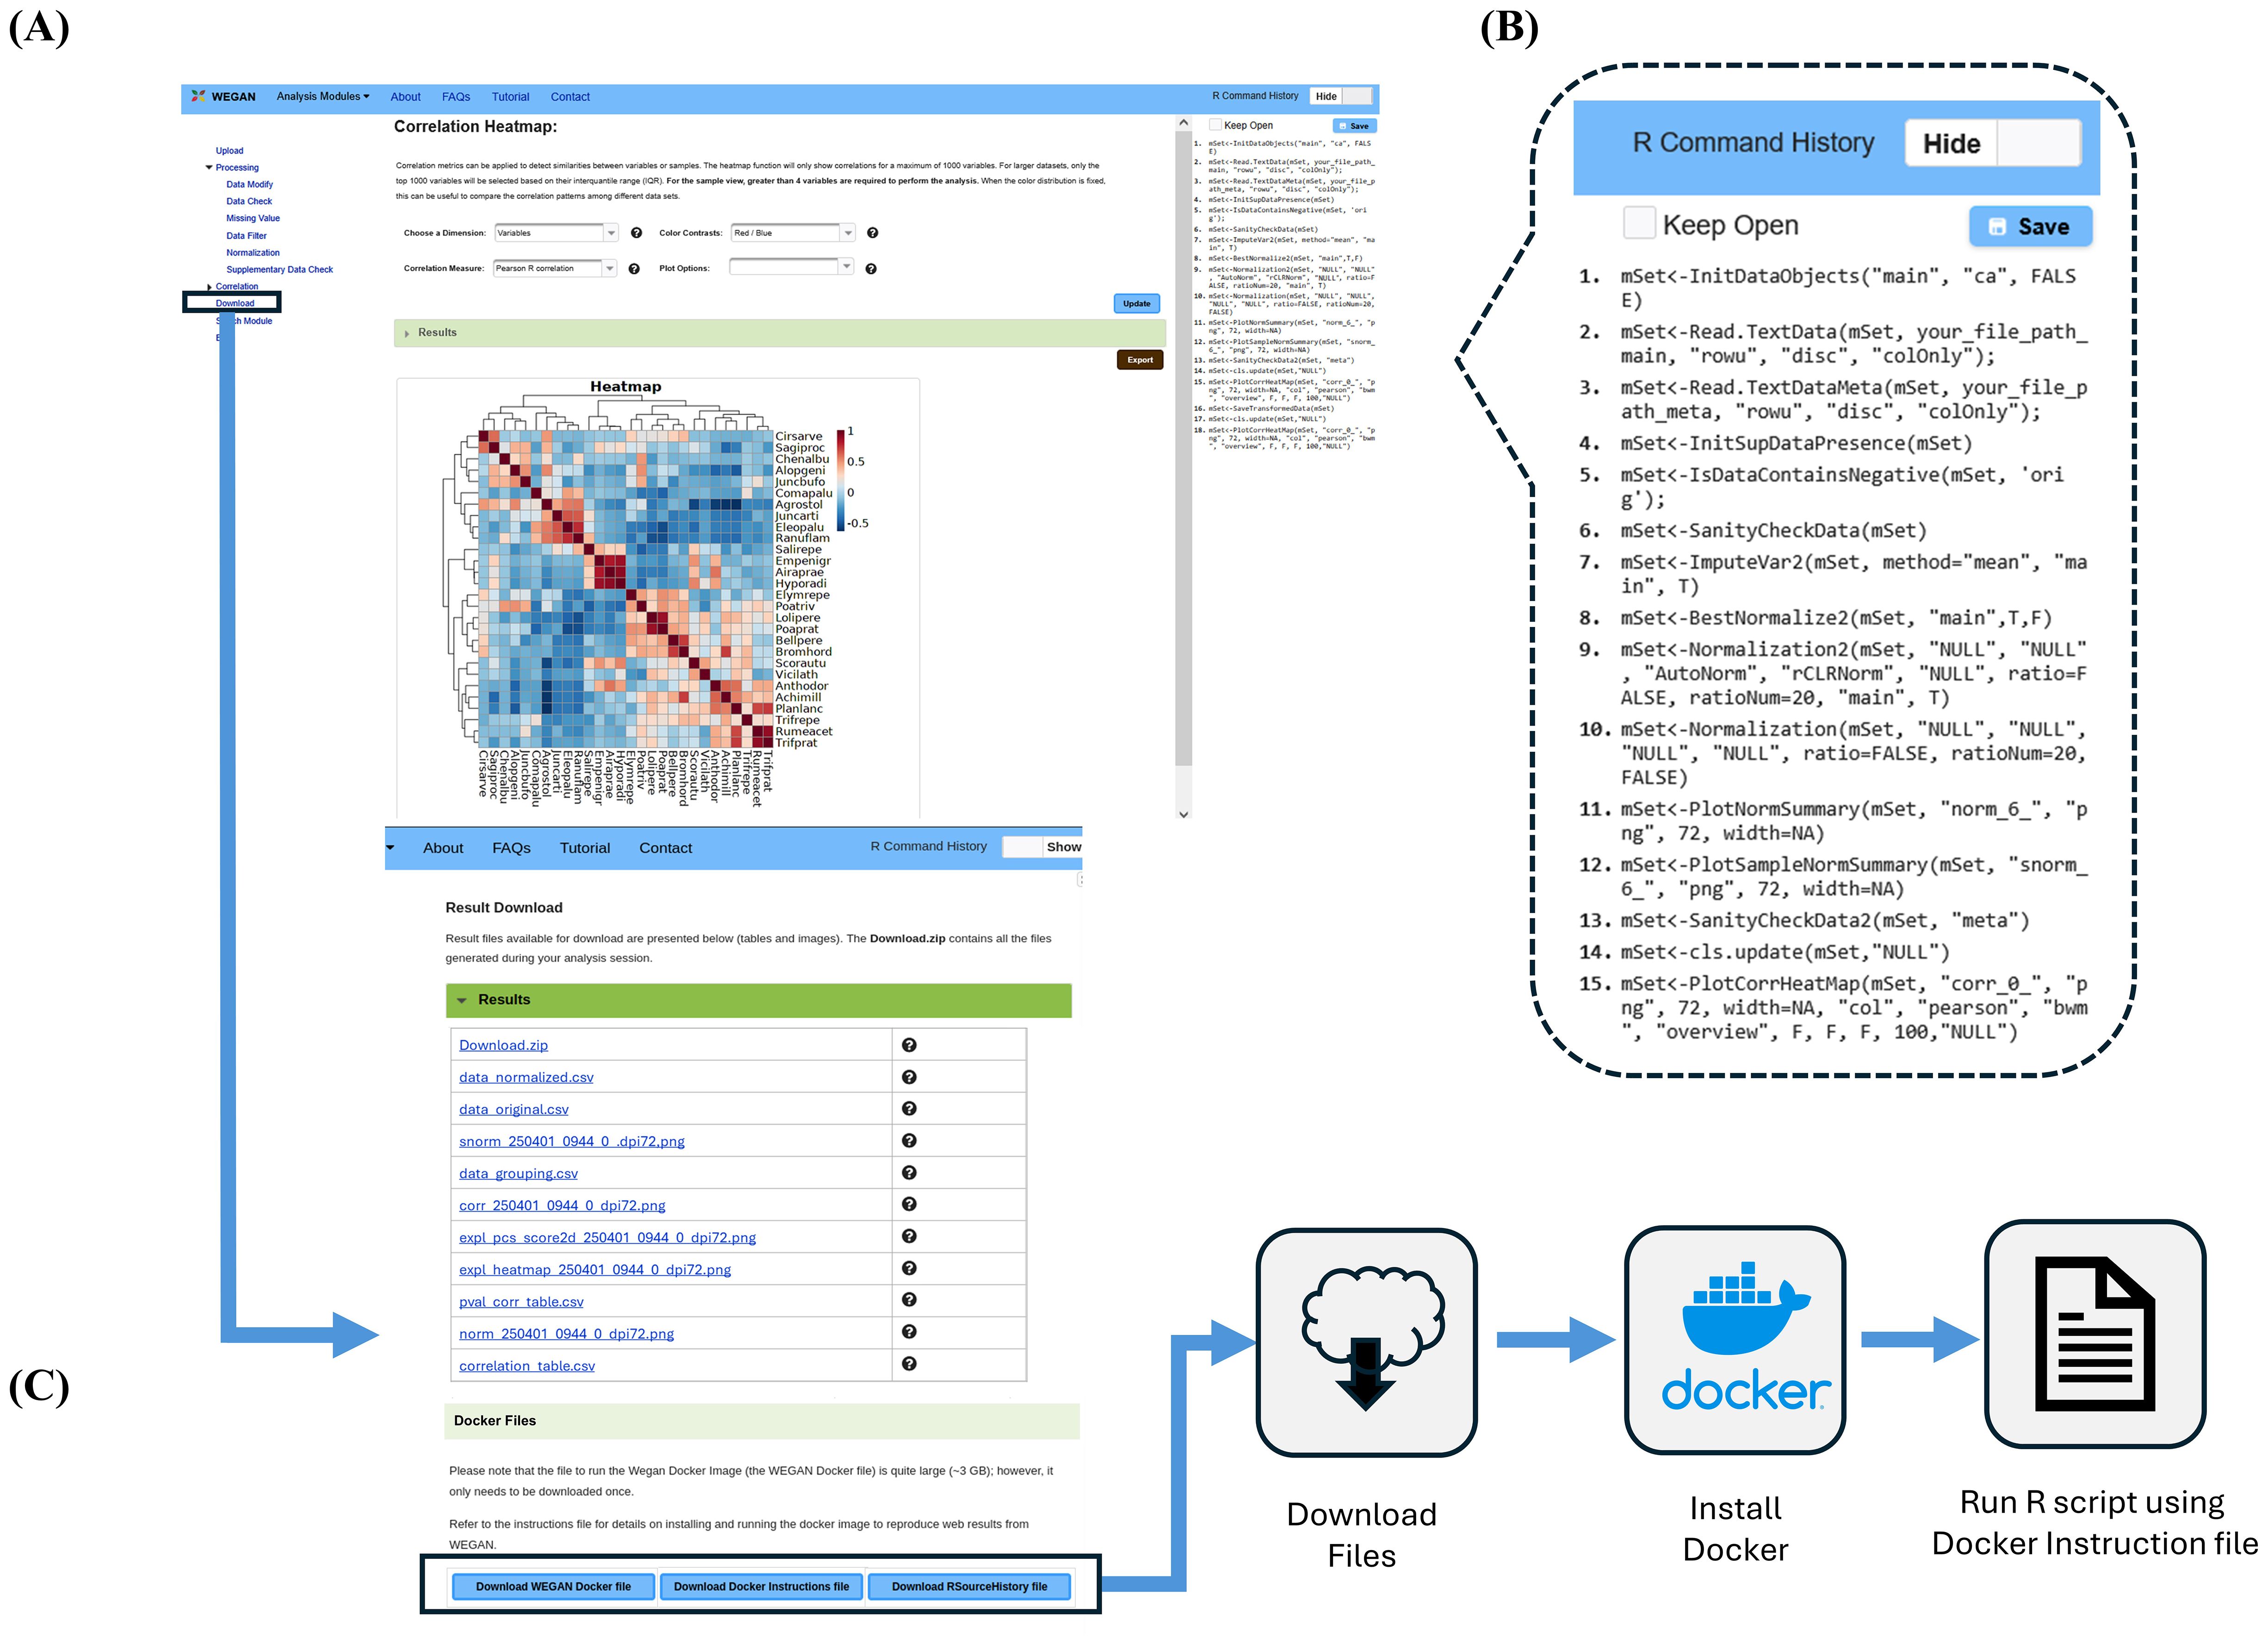
Figure 3. Reproducing the WEGAN Correlation heatmap web analysis locally with Docker. (A) Analysis page for the Correlation module Heatmap showing the location of “Download” in the Navigation pane. (B) Callout showing the R Command History displayed for users corresponding to commands executed to generate analysis results. (C) Result Download page showing the Results table with clickable links to download individual analysis files and buttons to download files for replicating results locally using Docker. Users download the provided WEGAN Docker files, including the Docker image, the R file containing their R Command History, and an instructions file. By following the instructions in the Docker instructions file, users are able to run the provided R file and reproduce their web analysis session locally.
2.4 Example data
Included in WEGAN are six example datasets. Three datasets are found in the vegan package (Oksanen et al., 2022), one from the ade4 package (Thioulouse et al., 2018), one from the FD package (Laliberté et al., 2014), and one generated using the rpois function in R. The original citation, the type of data associated with each dataset, and a brief description of the data are provided in Table 1. Taxonomic data was retrieved, when not present in indicated sources and to conform to standards used in WEGAN, using the taxize R package (Chamberlain and Szöcs, 2013). Trait data for the “Dune” dataset was sourced from Jamil et al., 2013 and was derived using the Life-history traits of the Northwest European flora (LEDA) database (Kleyer et al., 2008). All data are available for download via the WEGAN webserver or in the codebase.
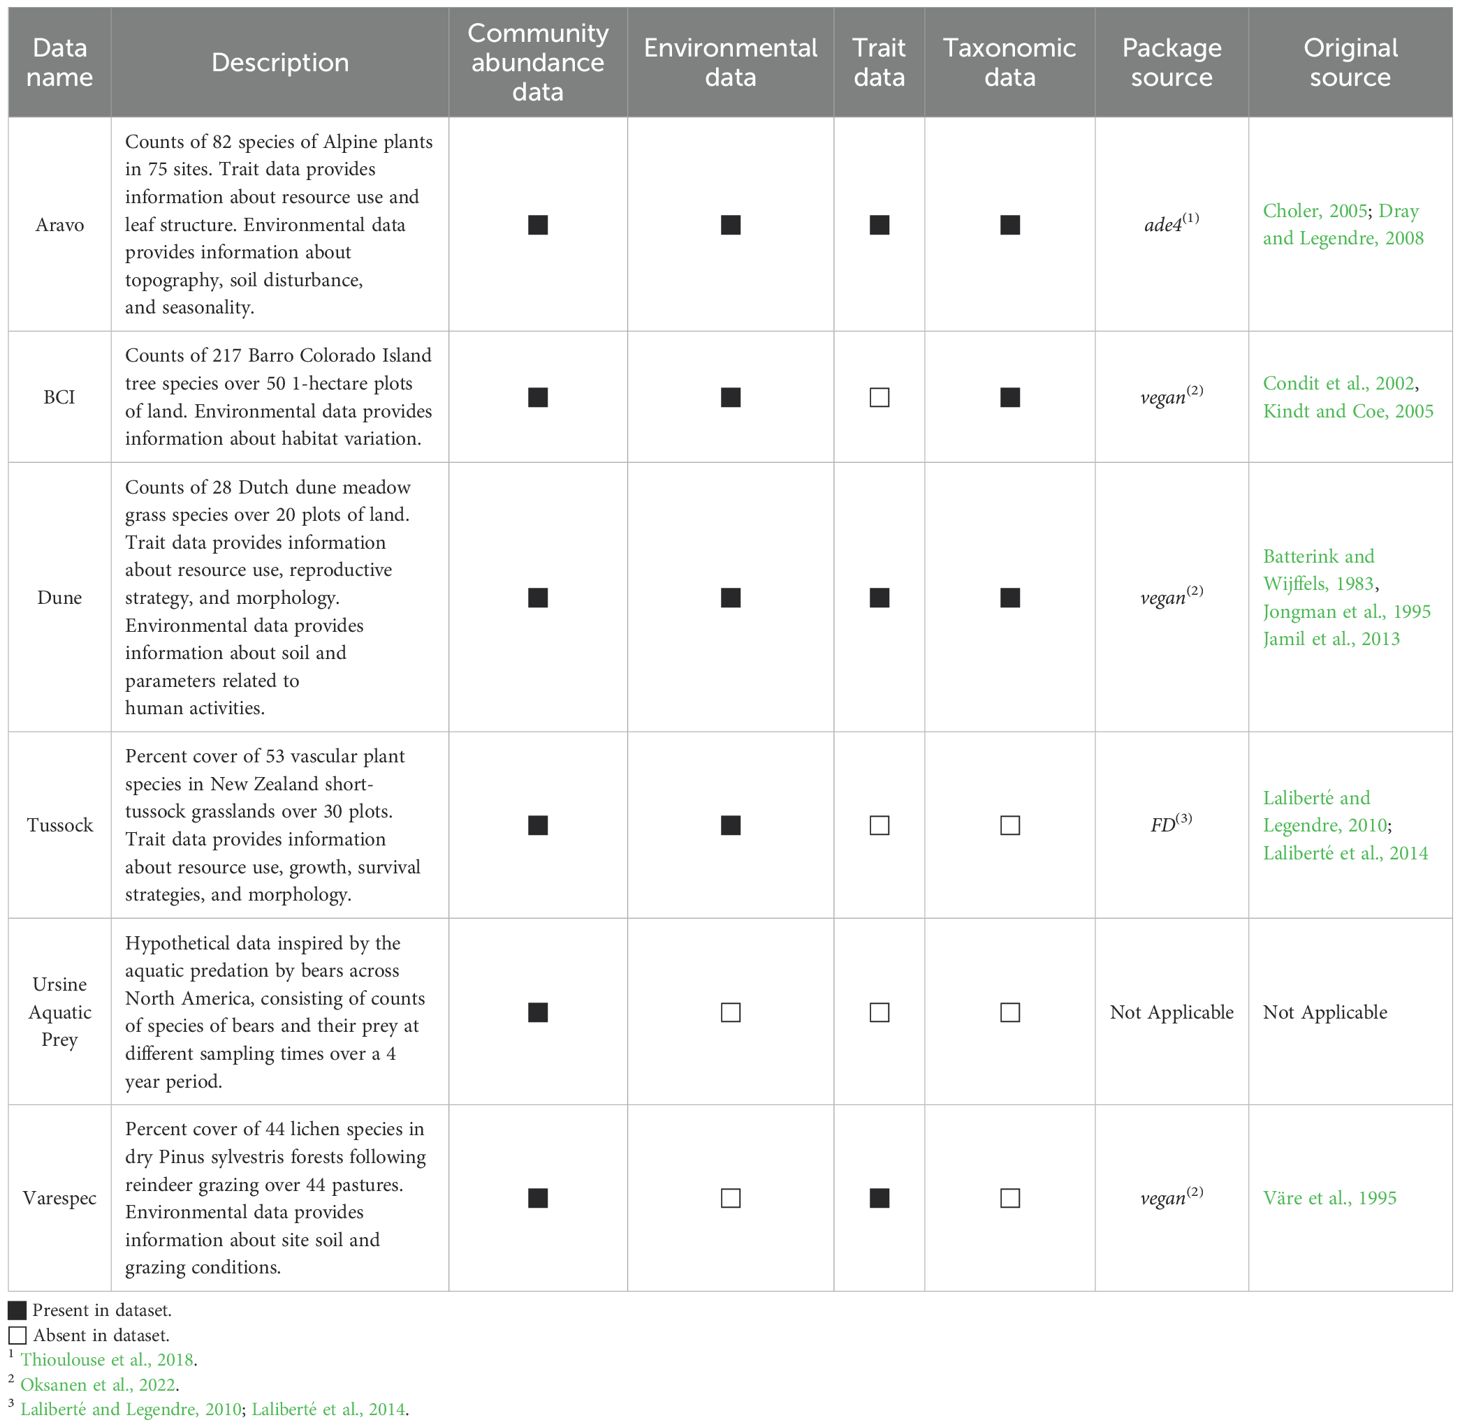
Table 1. Example datasets provided in WEGAN.
2.5 General operation
2.5.1 Data uploading
As a community ecology platform, WEGAN requires community abundance data to be uploaded into each selected analysis module (Figure 1) either in. txt or. csv format. To facilitate data upload, several data manipulation options are provided to reduce user overhead. Users may specify the row/column orientation of their uploaded data or indicate if their data contain sample labels. The abundance data should contain taxa abundance (typically in columns) measured at different sampling sites (listed as ‘samples’ or ‘sites’ - typically in rows). Otherwise, samples are named using their index as ordered in the data. An overview of the way data should be formatted to match each of the data types is given in Figure 4. Some WEGAN analysis modules use additional data types (Figure 1, Table 2). For instance, the Taxonomy module requires taxonomic data containing taxonomic ranks for the taxa present in the community abundance data. Likewise, the Diversity module provides the option to upload trait data, which should contain information about the phenotype(s) of taxa present in the community abundance data. Trait and taxonomic data must have taxa labels matching those found in the corresponding community data.
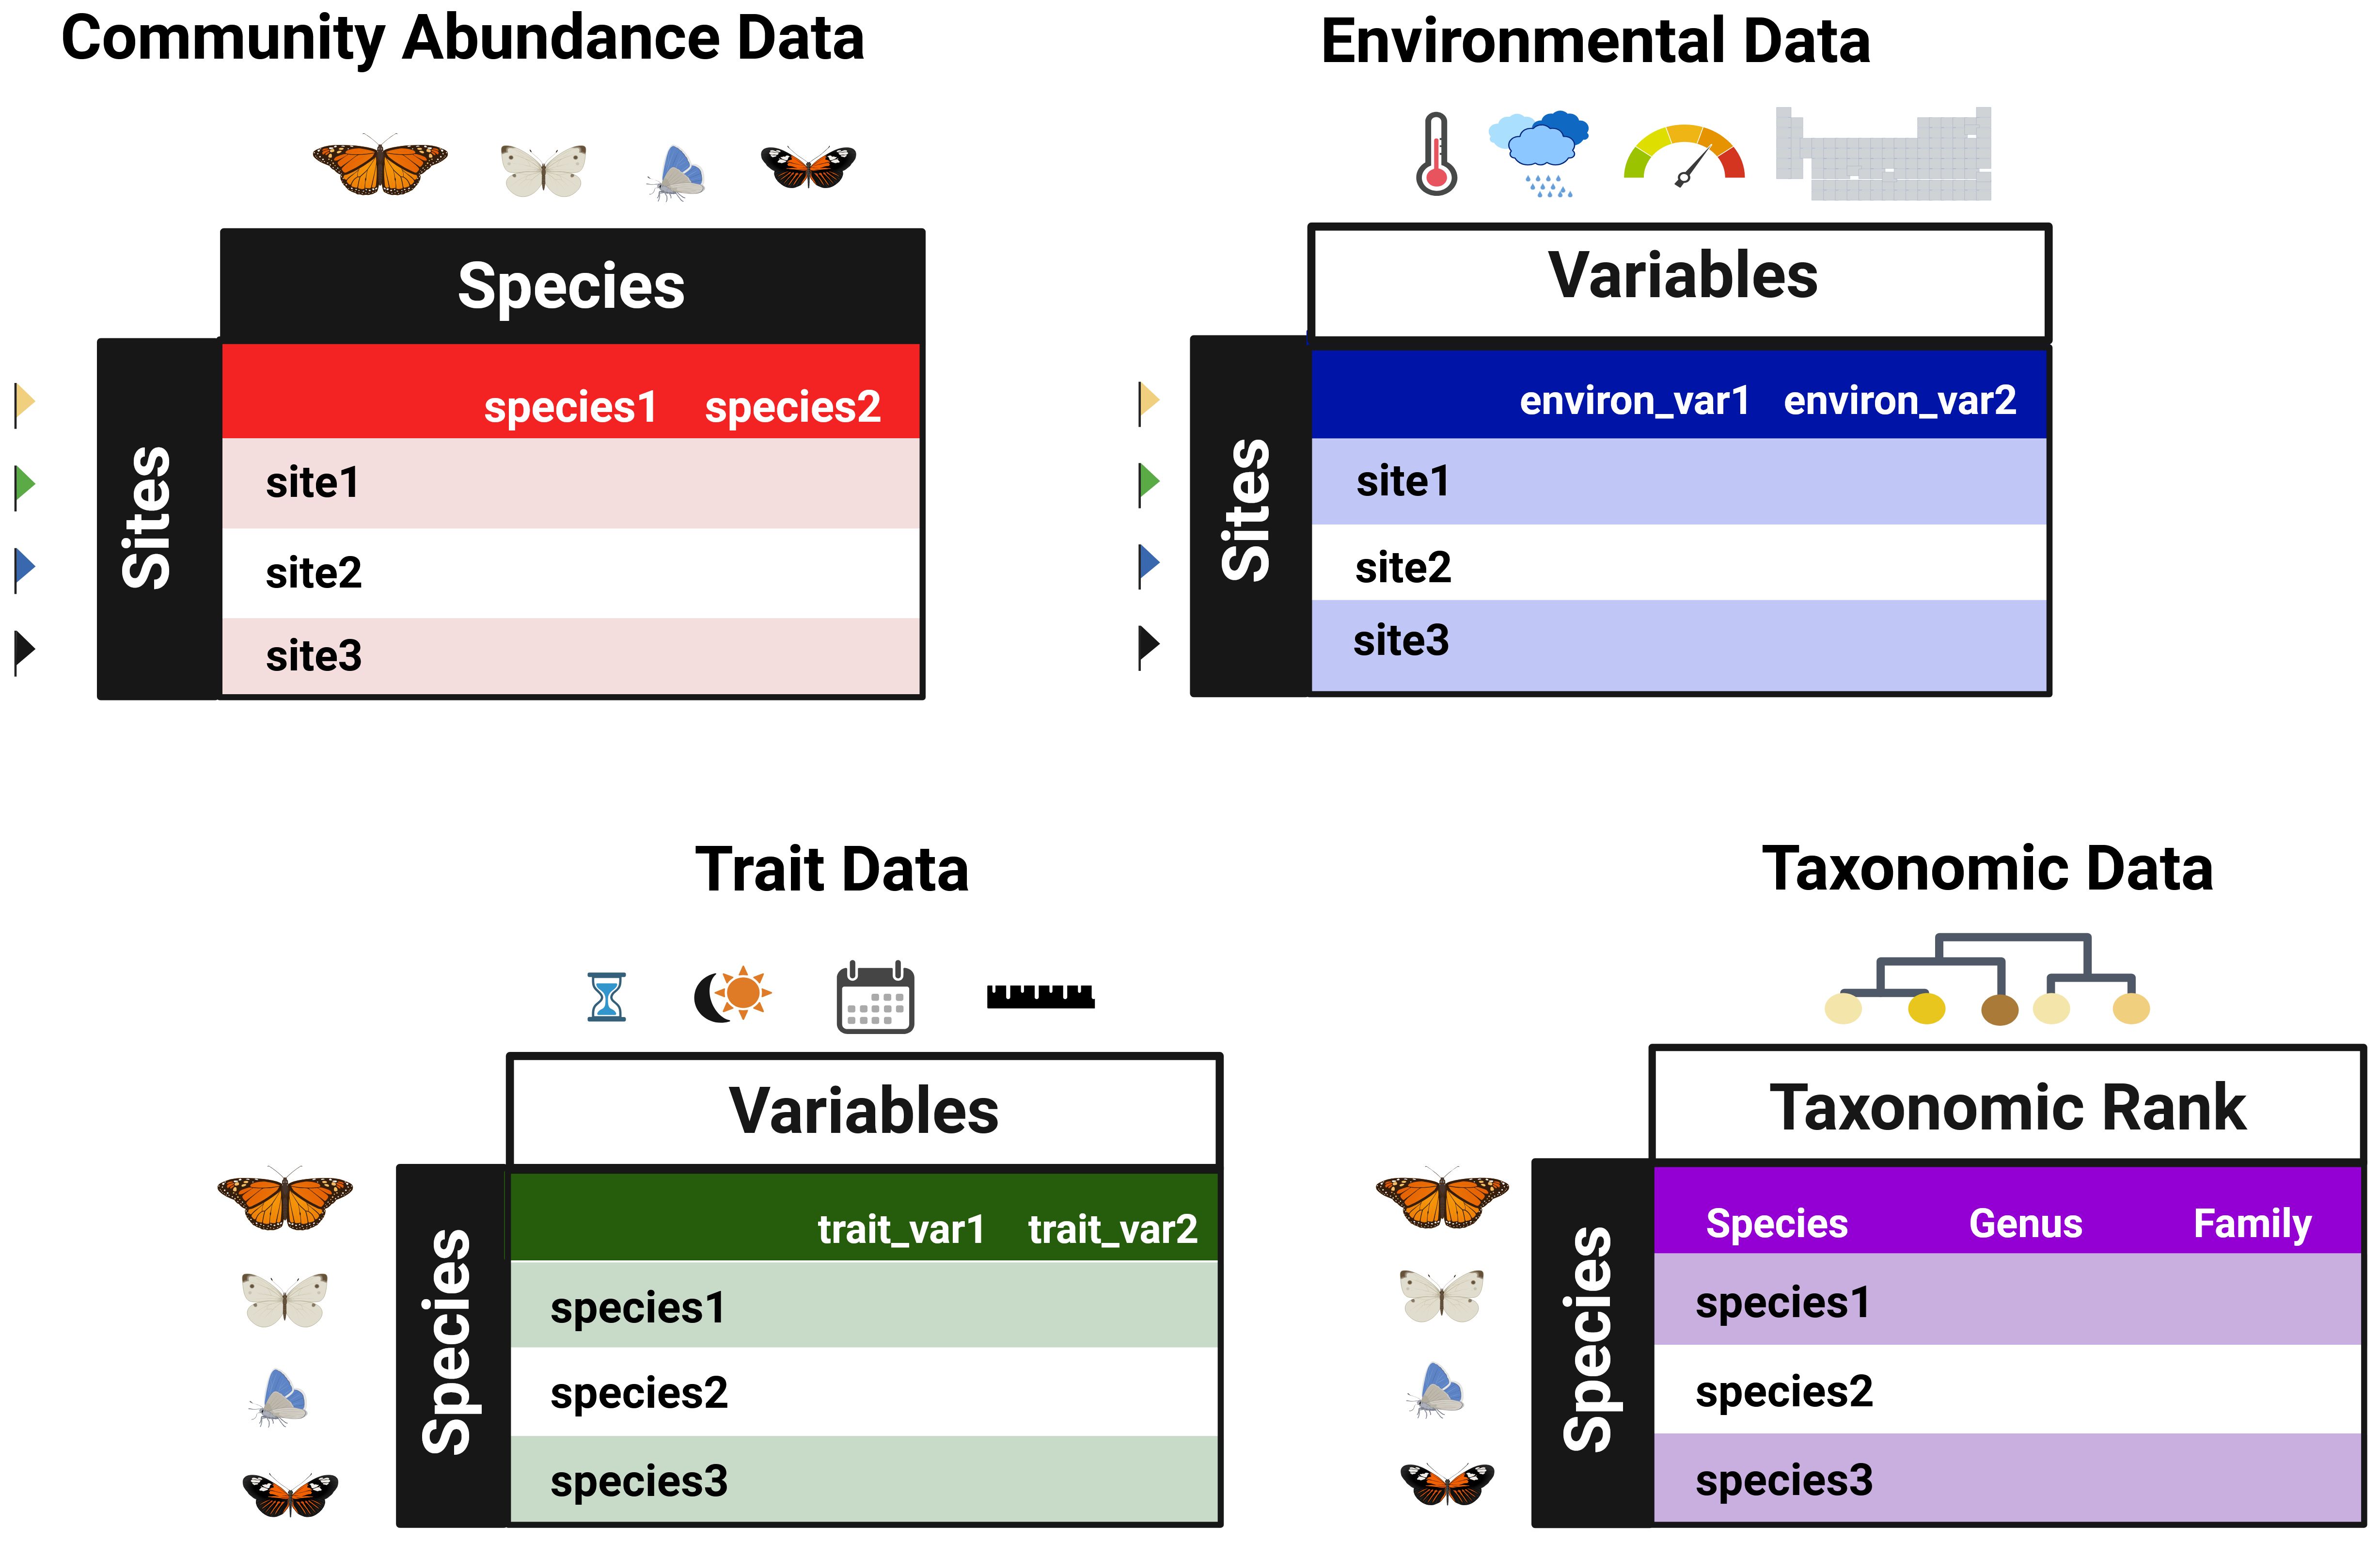
Figure 4. Overview of data types in WEGAN. Community abundance data should list taxa abundances (typically as columns) across different sampling sites (‘samples’ or ‘sites’, typically as rows). They are referred to here as species, but any taxonomic level is acceptable as long as it is consistent among data types. Taxonomic data and Trait data must include taxa labels matching those in the community abundance dataset; Taxonomic data should include these taxa labels as a separate column titled ‘Species_label’ (not shown in figure). Environmental data must include site labels matching those in the community abundance dataset. Created in https://BioRender.com.
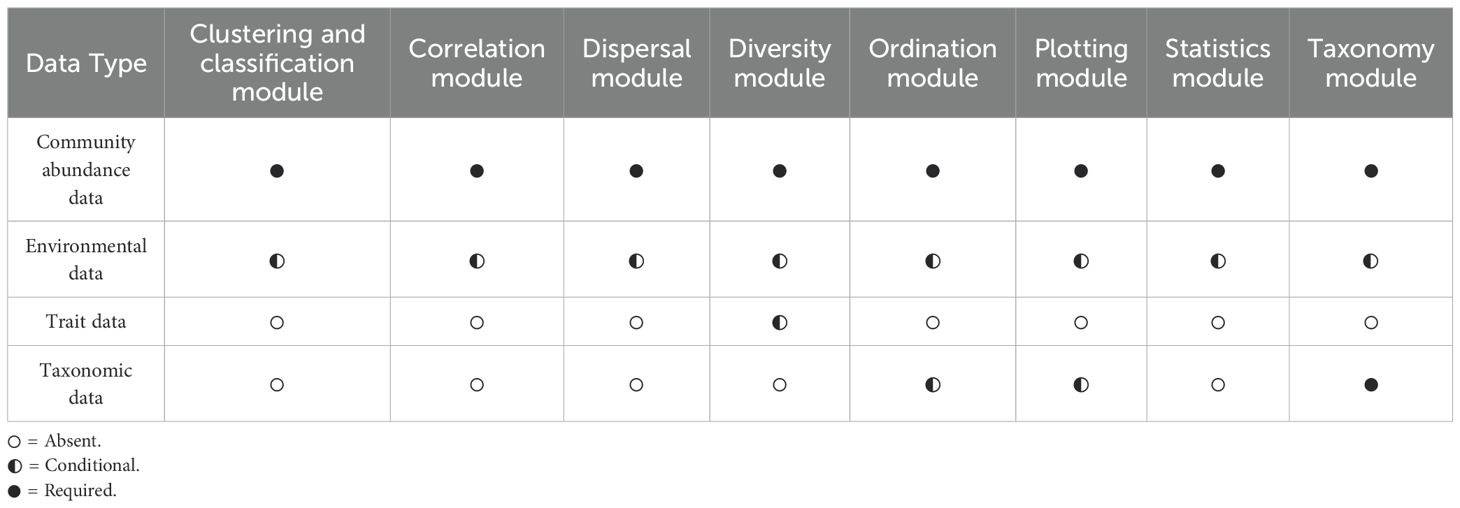
Table 2. Data types as used by WEGAN analysis modules.
2.5.2 Data integrity check, missing value estimation, and rare species filtering
After the data upload, integrity checks are automatically conducted (Figure 1). These checks include identifying and removing species with constant variance across sites or sites without species, as either case can negatively impact downstream statistical analyses (Legendre and Legendre, 2012; Oksanen et al., 2022). Environmental, trait or taxonomic data is also checked for data integrity and then passed on to the chosen analysis module (Figure 1).
If missing data is identified during the integrity check, users will be asked to specify their preferred method for handling those missing values. By default, missing values are replaced by the species-wise minimum value. However, several imputation methods are also available to infer these values, including imputation based on k-means nearest neighbors (KNN) clustering, probabilistic principal component analysis (PCA), Bayesian PCA, and singular value decomposition (SVD). After selecting the imputation method, users are reminded of the potential biases that can be introduced when applying imputation methods to enable more informed downstream analyses (Łopucki et al., 2022).
Another option offered by WEGAN is the filtering of rare taxa, based on a user-defined prevalence cutoff. Lower prevalence taxa may result from limited sampling, and therefore may not represent meaningful ecological patterns, but rather ecological “noise” (Poos and Jackson, 2012). As rare taxa can be of interest for some applications, rare taxa filtering is not applied by default and is left as an option for the user to apply.
2.5.3 Normalization
Data normalization and scaling are essential for most statistical analyses. During normalization, users can select either “automatic” or “manual” modes to standardize data. The automatic mode compares common ecological data normalizations such as Wisconsin double-normalization (Bray and Curtis, 1957), robust centered log ratio [rCLR] (Gloor et al., 2017) along with Hellinger (Legendre and Gallagher, 2001), log, and square root transformation. It then selects the method resulting in the lowest average data skewness (Joanes and Gill, 1998). Alternatively, users can manually specify normalization methods by selecting “manual normalization”. Options for sample-wise normalization (adjusting by sample median and Box-Cox normalization); transformation (base 2 log, square root, and cube root); scaling (mean centering, and max-min, Z-score, and Pareto scaling) along with combined methods (Hellinger, Wisconsin double-normalization, and rCLR) are available. Users are reminded to choose a method that conforms to the assumptions for their research question of interest. To help with the selection process, users can visualize their data distribution before and after normalizing. If satisfactory, the user may proceed to one of WEGAN’s eight analysis modules for further downstream analysis. Depending on the chosen analysis module, any environmental, trait, or taxonomic data uploaded will also undergo a data integrity check before users can proceed. Details of each module’s requirements and operations are provided below in WEGAN’s data analysis modules.
2.5.4 Results and session downloads
All data and/or graphs generated from any of WEGAN’s analysis modules may be exported directly from the module and images may be customized for download by choosing the appropriate format (PNG, TIFF, PDF, SVG, or PostScript), resolution (72 dpi, 150 dpi, 300 dpi or 600 dpi), and size (half page or full page). Users can also access their results by selecting “Download” from the navigation menu of any WEGAN analysis module (Figures 2B and 3). All results generated in a single analysis session are listed on the Download page and are also provided in a consolidated zip file. Individual results files can be downloaded by selecting their respective filename.
3 WEGAN’s data analysis modules
A total of eight data analysis modules are available in WEGAN. These are described briefly, below. Detailed tutorials (consisting of over 200 pages) about each module and how it may be used can be downloaded from the top menu bar marked “Tutorial” on the WEGAN landing page (Figure 2A).
3.1 Clustering and classification
WEGAN’s Clustering and Classification module allows users to detect data patterns by partitioning either objects or their descriptors. WEGAN provides users with several options to perform either classification or partitional and/or hierarchical clustering. WEGAN’s heatmap option can be used to explore abundance patterns and illustrate grouping patterns among clusters. Likewise, its dendrogram option can help identify group structures in the data, enabling patterns to be identified that may be driven by environmental factors. Similarly, WEGAN’s partitional clustering options such as k-means (Hartigan and Wong, 1979) and self-organizing maps (SOM) (Kohonen, 1990) can be used to illustrate relationships in abundance data, particularly when users would like to investigate a predetermined number of groups. While less familiar to many ecologists, partial least squares discriminant analysis (PLS-DA) (Barker and Rayens, 2003), a machine learning (ML) classification technique, has been successfully used in applications dealing with high-dimensional data, such as hyperspectral soil sample classification (Rozenstein et al., 2015), microbiome analysis (Calon et al., 2019), and classifying community abundance data (Kergunteuil et al., 2016). In WEGAN, PLS-DA as well as other powerful classification methods such as sparse PLS-DA (sPLS-DA) and orthogonal PLS-DA (orthoPLS-DA) are also offered. In general, WEGAN’s Clustering and Classification analysis module can help users classify habitats and identify biotic zones of interest for further study.
3.2 Correlation
WEGAN’s Correlation module allows users to evaluate the strength and direction of relationships between two or more variables using several options. Heatmaps can be used to visualize a data correlation matrix using Pearson, Spearman, or Kendall correlation (Legendre and Legendre, 2012). Simple linear, polynomial, and logistic regression models are also available, for which model assumptions can be checked visually (Lüdecke et al., 2021). In addition to their community abundance data, users can upload and assess correlations with environmental data to address questions relating to environmental relationships between the abundance data. WEGAN also offers multivariable versions of linear and logistic regression to allow users to specify more than one independent variable. Further, WEGAN supports several ML methods for regression which have become increasingly popular in ecology (Tuia et al., 2022). For instance, users can select from penalized (or regularized), random forest, support vector machine (SVM), and artificial neural network (ANN) methods. WEGAN allows users to easily navigate to the Correlation module and upload their results from other WEGAN analyses for further exploration via regression analysis. In this way, WEGAN’s Correlation module allows users to formulate hypotheses about potential causal mechanisms for observed ecosystem responses.
3.3 Dispersal
WEGAN’s Dispersal module allows users to explore biogeographic species dispersal (Legendre and Legendre, 1984) by calculating dispersal direction (DD) coefficients and visualizing that data using a heatmap. Species pools, the species capable of colonizing a site in favorable environmental conditions, can be investigated with Beals smoothing (Ewald, 2002) to highlight potential species present based on patterns of co-occurrence across sites. Users can also assess beta diversity between communities by analyzing multivariate homogeneity of group dispersion. WEGAN offers dissimilarity measures based on presence/absence or abundance, the latter of which can be used to inform how the relative abundances of different species contribute to differences between groups (Anderson et al., 2006). WEGAN’s Dispersal module can be a good complement for diversity-based analysis.
3.4 Diversity
WEGAN’s Diversity module provides users with the ability to assess both within-community (alpha) and between-community (beta) diversity. Users can also determine if diversity differences between communities are significant along an environmental gradient using permutational multivariate analysis of variance (PERMANOVA). This allows users to evaluate species richness and how it varies with species abundance, the number of sites or individuals sampled, or estimate the true number of species represented in a community. WEGAN’s species accumulation curves (SAC) demonstrate the relationship of species richness and number of sites sampled (Dengler, 2009). Extrapolated (total) species richness can also be calculated using various indices. These include the Chao (O’Hara, 2005) and the ACE indices (Chiu et al., 2014), as well as the first and second order Jackknife, biased-Chao, and bootstrapped indices for abundance-based and incidence-based indices, respectively. Rarefaction (Heck et al., 1975) can also be performed in WEGAN and visualized via scatter plots that compare the observed and rarefied species counts, as well as via rarefaction curves that plot the number of species against the number of individuals (sample size). Species abundance distribution models are provided in WEGAN for Preston’s log-normal, Fisher’s log-series, and ranked abundance trends (McGill et al., 2007). These can help users illustrate the assemblage of individuals compared to the number of species in a community. Finally, users can link trait data (data about species phenotype) to environmental and abundance data, using WEGAN’s functional diversity methods (Laliberté and Legendre, 2010). Specifically, WEGAN provides methods for visualizing Gower’s distance matrix and several of the distance-based functional diversity indices. Overall, WEGAN offers a wide selection of methods for achieving insights into species diversity and heterogeneity across habitats.
3.5 Ordination
WEGAN’s Ordination module offers a comprehensive suite of tools to examine, investigate and visualize how species distributions relate to environmental conditions. Ordination is key to interpreting multivariate ecological data, facilitating the identification of patterns within communities and helping to understand how these patterns are influenced by environmental factors (Legendre and Legendre, 2012). This module includes both constrained and unconstrained ordination approaches. Constrained ordination, such as canonical correspondence analysis (CCA) and redundancy analysis (RDA) highlights variation in species abundance that can be explained by specific environmental variables (Ter Braak, 1986). These methods assume that species distributions respond predictably to gradients in environmental conditions. The results of WEGAN’s constrained ordination analyses can also be assessed using Monte-Carlo permutation tests based on a pseudo-F statistic (Legendre and Legendre, 2012). Conversely, unconstrained ordination methods – including principal component analysis (PCA), correspondence analysis (CA), principal coordinate analysis (PCoA) or multidimensional scaling, and non-metric multidimensional scaling (NMDS) – are used to uncover broad trends in community composition without explicitly including environmental data in the ordination model (Legendre and Legendre, 2012). These exploratory techniques help reveal relationships and grouping among samples by creating ordinations based purely on species abundance. WEGAN offers the option to overlay environmental variables to assist in interpreting the observed patterns. All ordination analyses can be visualized via 2D ordination plots or scree plots, as well as via Shepard plots (Shepard, 1962) for multidimensional scaling and via pairs plots for PCA. WEGAN’s ordination analyses also provide the results from permutation testing (employed after fitting environmental variables). Likewise, the constrained ordinations provide variance inflation factors to help in model refinement. Overall, WEGAN’s Ordination module provides a comprehensive and effective set of tools to aid users in interpreting the complex structure of ecological communities.
3.6 Plotting
WEGAN’s Plotting module provides users with the ability to create a wide number of general-purpose publication-ready graphs (box plots, histograms, pie-charts, etc.). These can be used to visualize data trends before pursuing further analyses in WEGAN’s other analysis modules. Users have the ability to group data in multiple ways, using categorical variables to either color data or create sub-plots. Error bars can be added to bar plots using standard deviation or standard error values, and confidence intervals added to linear trend lines on scatter plots. Histograms can also be generated to enable data distribution verification prior to any data analysis decisions. A unique feature of WEGAN is its support for PhyloPic icons or silhouettes (Gearty and Jones, 2023). If users supply taxonomic data, they have the option to create scatter plots with the corresponding organism silhouettes. These can be highly effective for communicating the distinction between taxonomic groups. Pie charts are also included in WEGAN for their ability to display a few, easily distinguishable categories in a familiar way (Spence and Lewandowsky, 1991). All plotting functions support customization for color palettes, legends, and text size. Overall, WEGAN’s Plotting module allows users to easily generate customizable plots for publication, and to gain an overview of their data before pursuing further analysis.
3.7 Statistics
WEGAN’s Statistics module provides users with a comprehensive range of tools for performing basic statistical analyses of ecological datasets. Null hypothesis significance testing (NHST) can be performed with parametric and non-parametric univariate methods, such as T-tests, Analyses of Variance (ANOVA), and chi-square tests. The chi-square test can be used to compare categorical variables or to compare species grouped by a categorical variable of interest. The T-test and ANOVA can be used to compare two or more species/groups selected from the environmental data. To assess differential effects, WEGAN also provides fold-change analysis. The volcano plot, widely used in many bioinformatics and other life science applications, can help users simultaneously assess significance and fold-change. All of these tests generate informative, colorful, high quality images that can be easily downloaded. The Statistics module, just like the Plotting module, is considered one of WEGAN’s universal modules, meaning that it can be used for almost any kind of data analysis.
3.8 Taxonomy
WEGAN’s Taxonomy module allows users to integrate taxonomic data with both abundance and relatedness information. This module requires that users provide taxonomic data along with abundance data. Both within and between taxonomic composition can be explored using stacked bar plots and pie charts, with options to group taxa at different phylogenetic levels. WEGAN also has the option to display “heat trees” (Foster et al., 2017) which are taxonomic trees that can depict other data features using differences in tree appendage size and color. In WEGAN, node color gradient and size are used to indicate abundance across all sites. Users can also analyze the taxonomic diversity and distinctness of their data, using the phylogenetic indices employed by Clarke and Warwick (1998). This method generates a scatter plot that displays taxonomic diversity by species richness, as well as a dendrogram depicting the phylogenetic relatedness of various taxa. Overall, the Taxonomy module offers a rich collection of tools for visualizing and analyzing a community’s taxonomic structure.
4 Example analysis by NMDS
To showcase WEGAN’s capabilities, we analyzed the “Dune” community ecology dataset, which is available in WEGAN as an example dataset (Table 1). This data file consists of abundance data for 28 grass species across 20 dune meadow sites on the Dutch island of Terschelling (Jongman et al., 1995). Environmental data in this dataset includes information about soil moisture, soil thickness, land use, land management, and presence of manure. Our goal was to explore patterns in community composition and understand how environmental factors influence these patterns using WEGAN’s non-metric multidimensional scaling (NMDS) ordination.
After uploading and checking the data, we first applied the Wisconsin double standardization method (Bray and Curtis, 1957) to the species abundance data, which balances the influence of common and rare species and accounts for differences in sampling effort among sites. We then selected the Bray-Curtis dissimilarity index for the sparse data to do the NMDS analysis
NMDS arranges sampling sites to minimize the rank-order difference between the distances in the original dataset and the ordination space. To determine the optimal number of dimensions, NMDS was performed in dimensions ranging from one to five and the stress values assessed. A Shepard plot visualizes the degree of mismatch between observed dissimilarities and ordination-based distances, along with the stress values for each dimension. In Figure 5A, the Shepard plot for the first two dimensions shows a tight clustering of the original pairwise dissimilarities around the ordinated dissimilarity distances calculated by NMDS. Figure 5B shows that the steepest reduction in stress occurred from one to two dimensions. Based on the recommendations of Clarke and Warwick (1998), a stress value below 0.2 is generally considered acceptable in ecological studies. Therefore, a two-dimensional solution was chosen for our NMDS analysis.
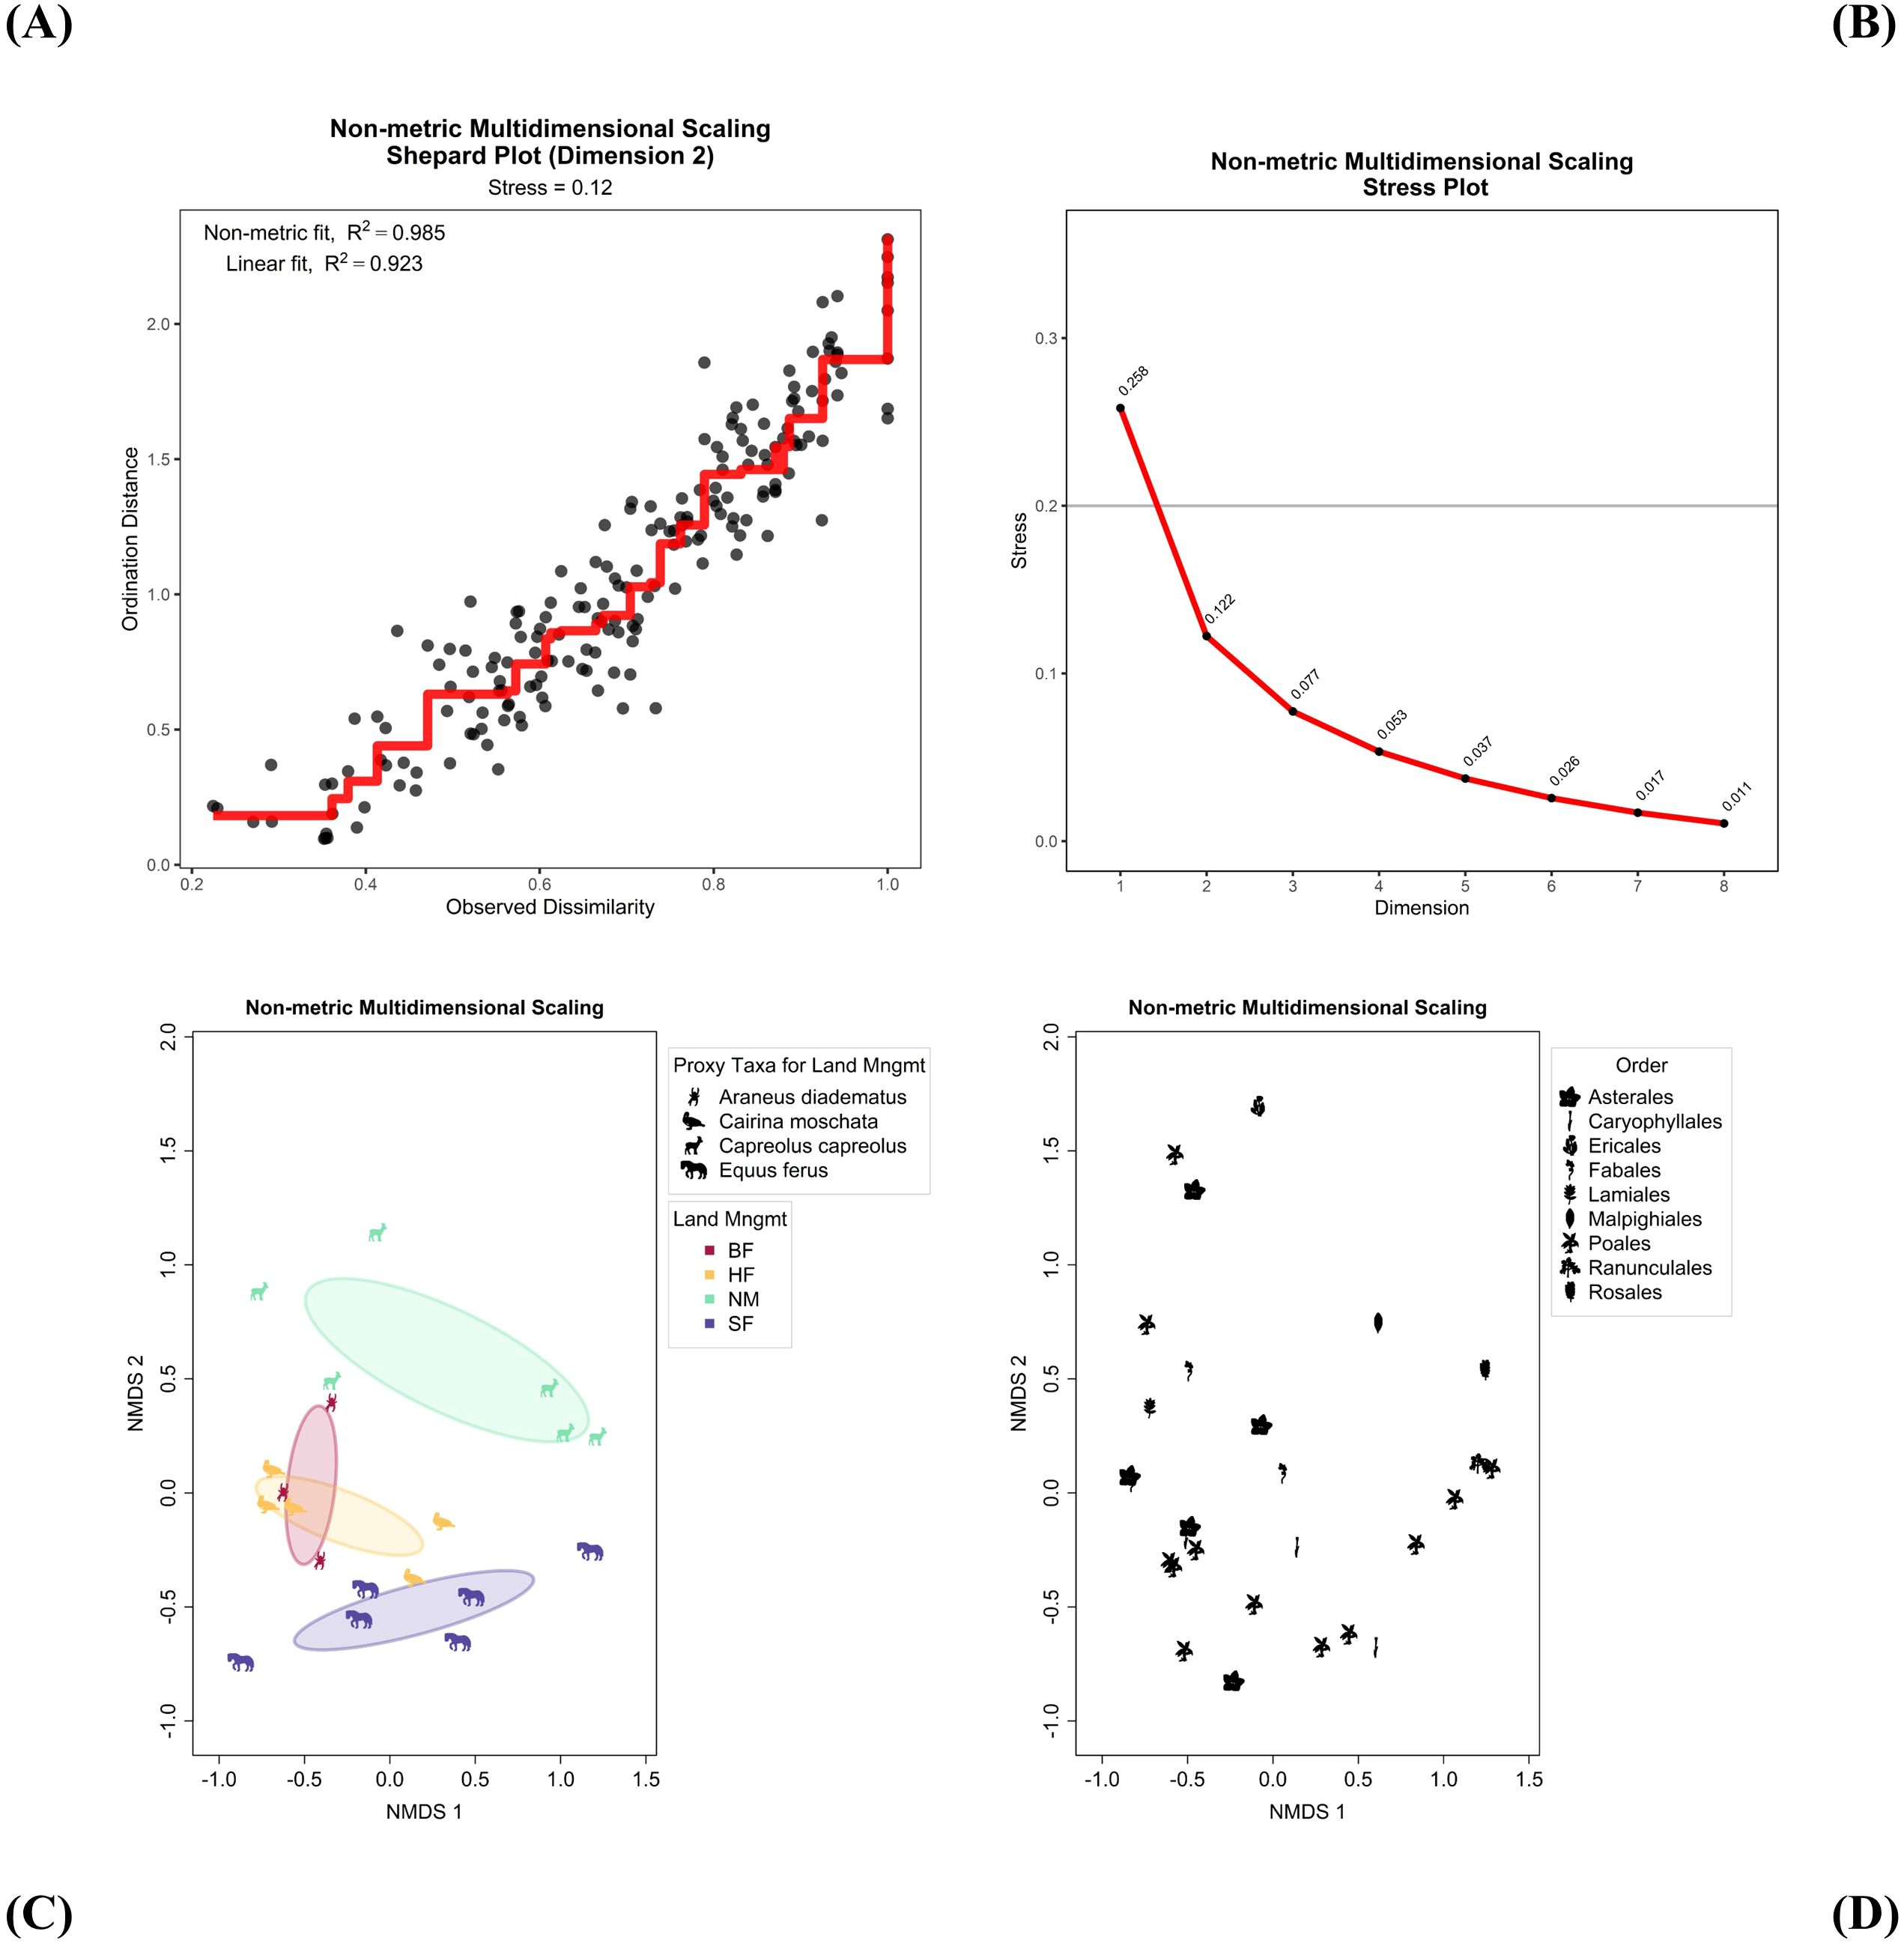
Figure 5. Non-metric multidimensional scaling (NMDS) plots. (A, B) Diagnostic plots. (A) Shepard Plot with monotonic regression fit shown in red. (B) Stress Plot. (C, D) 2D scores plots. (C) Site scores are shown as hypothetical proxy icons for the land management variable, ‘Land Mngmt’ (BF, Biological Farming; HF, Hobby Farming; NM, Nature Management; SF, Standard Farming) with covariance ellipses. (D) Species scores are shown as PhyloPic icons using taxonomic order.
The NMDS ordination plots (Figures 5C, D) produced by WEGAN present a clear representation of the relationships among dune sampling sites based on their grass species composition. This also highlights a unique feature of WEGAN for portraying data with PhyloPic icons. Figure 5C shows the sampling sites icons, positioned in the 2D ordination space according to their species composition. Sites are grouped according to the land management environmental variable. To further illustrate this relationship, Figure 5C assigned hypothetical fauna to represent each of the categories in land management as a PhyloPic icon. The ordination plot reveals distinct groupings of sites, indicating variations in community composition. Sites with similar management practices tend to cluster together, suggesting shared characteristics in community structure (Figure 5C). Figure 5D shows the grass species variables as PhyloPic icons (by taxonomic order), illustrating a separation of the Asterales taxa to the left side of the ordination space, and another way to use icons in ordination. Additionally, environmental variables were fit to the ordination to better understand their influence on community composition. From the environmental fit results download, soil moisture was the most significant (r² = 0.553, p = 0.001), though land management (r² = 0.408, p = 0.008) and manure presence (r² = 0.453, p = 0.02) were also important. This suggests distinct community responses to varying environmental factors. This entire analysis was performed in a few minutes without any coding.
5 Discussion and conclusion
WEGAN offers a free, intuitive, and comprehensive web-based platform for analysis of data from community ecology studies. It improves accessibility of advanced community ecology methods to researchers regardless of their prior familiarity with R. To objectively assess WEGAN against other well-regarded tools, we compared the WEGAN webserver to vegan (Oksanen et al., 2022) and BiodiversityR (Kindt and Coe, 2005). To perform the comparison, each software was evaluated for the presence/absence of 22 specific analytical sub-categories under seven broad analytical categories related to ordination, diversity, dispersal, taxonomy, dissimilarity/clustering, community data handling, and permutation/statistical testing (Table 3). Sub-category presence in each software package was represented with a 1 (present) or 0 (absent). The percent coverage of the sub-categories listed for each software package was calculated by dividing the number of sub-categories present in vegan, WEGAN, or BiodiversityR by the total number of sub-categories present in all software packages (total = 22). Across these seven analytical categories, vegan contains 18 functions and of these, 17/18 are present in WEGAN while 15/18 are in BiodiversityR (Table 3). A category called “WEGAN functions” representing functions absent in vegan and BiodiversityR but present in WEGAN (plotting with icons, PLS-DA-based classification, and fold change/volcano plots) was also included. Thus, of a grand total of 22 sub-categories offered across all three programs, WEGAN has the most (95.5%). This functional comparison demonstrates that WEGAN is comparable to and, in some areas, superior to vegan and BiodiversityR.
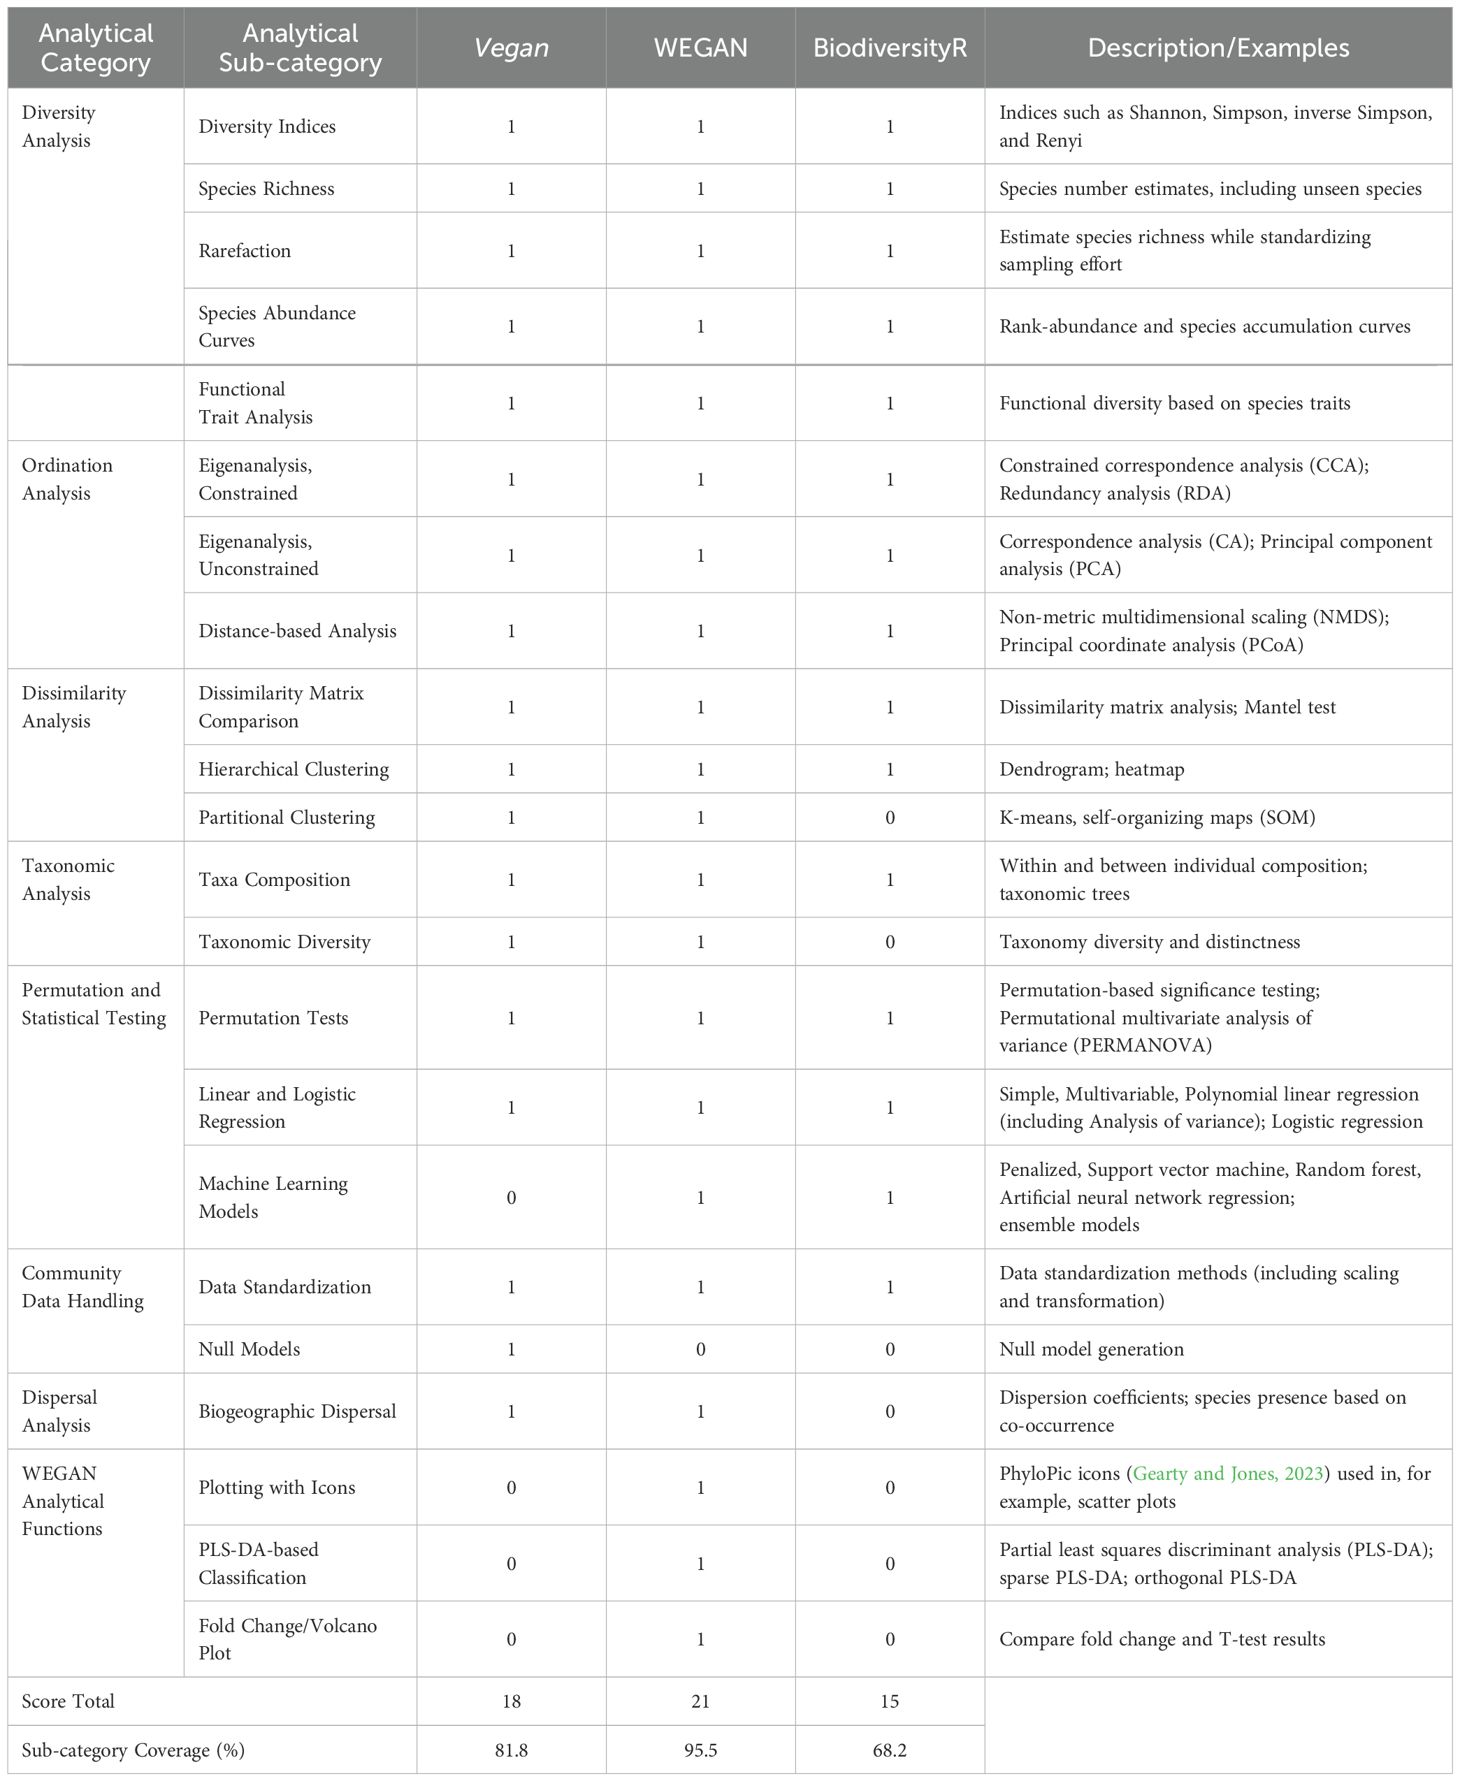
Table 3. Categories for software comparison.
By providing a comprehensive, universally accessible, web-based platform for analyzing community structures and relationships, we hope that WEGAN will be an inclusive avenue to reproducible data analysis, not only in the field of community ecology but in related fields such as metagenomics and microbiomics. Given that many other fields of life-science informatics (i.e., bioinformatics, cheminformatics, microbiomics, pharmacoinformatics, etc.) now use web-based tools (Kern et al., 2020), WEGAN will help bring community ecology and the design of community ecology software into the same informatics realm. Indeed, the web-based nature of WEGAN means that users will not be limited by hardware constraints, programming knowledge, or software installation skills. This should greatly increase the accessibility of community ecology and ecological statistics to many who are new to the field or otherwise less inclined to use these powerful tools. As a potential teaching aid, WEGAN offers an easy to use, point-and-click interface that will help students familiarize themselves with established practices in community ecology, without the need for prior programming knowledge. Likewise, WEGAN’s extensive use of colorful graphics and advanced graphing tools (such as the PhyloPic icons) should enable a more visually appealing and compelling approach to communicate results. Overall, WEGAN enhances the accessibility of community ecology analysis by providing a versatile, intuitive, web-enabled tool that can be used by researchers, educators, and students everywhere.
It is important to remember that this is only the first release of WEGAN. Given that community ecology is focused on assessing the distribution, abundance, and interactions of different species over time and space, it will be important to add other modules to support temporal/spatial analysis. As such, future development efforts in WEGAN will focus on integrating techniques such as time-series analysis and spatial-temporal modeling, with particular emphasis on adding generalized linear models and generalized linear mixed models given their robust capability to handle ecological data and their ever-growing popularity. Additionally, the authors caution users to be aware of the need for scientific analysis best practices when employing WEGAN in their research. We are keen to work with the community ecology “community” and to use their feedback to continually improve WEGAN.
Data availability statement
The raw data supporting the conclusions of this article will be made available by the authors, without undue reservation.
Author contributions
GS: Formal Analysis, Project administration, Software, Visualization, Writing – original draft, Writing – review & editing. LN: Project administration, Software, Writing – review & editing. JP: Software, Writing – review & editing. SZ: Software, Writing – review & editing. DA: Software, Writing – review & editing. SS: Software, Writing – review & editing. EO: Software, Writing – review & editing. KJ: Software, Writing – review & editing. VG: Project administration, Writing – review & editing. XZ: Software, Writing – review & editing. JX: Software, Writing – review & editing. GJ: Supervision, Writing – review & editing. DW: Conceptualization, Funding acquisition, Resources, Supervision, Writing – review & editing.
Funding
The author(s) declare that financial support was received for the research and/or publication of this article. The research was funded by the National Sciences and Engineering Research Council, NSERC (RGPIN-2019-05538), Genome Canada (TMIC MC4), and the Canada Foundation for Innovation, CFI (MSIF 35456).
Acknowledgments
The authors wish to thank Dr. Marcia LeVatte for her help with the manuscript.
Conflict of interest
The authors declare that the research was conducted in the absence of any commercial or financial relationships that could be construed as a potential conflict of interest.
The author(s) declared that they were an editorial board member of Frontiers, at the time of submission. This had no impact on the peer review process and the final decision.
Generative AI statement
The author(s) declare that no Generative AI was used in the creation of this manuscript.
Publisher’s note
All claims expressed in this article are solely those of the authors and do not necessarily represent those of their affiliated organizations, or those of the publisher, the editors and the reviewers. Any product that may be evaluated in this article, or claim that may be made by its manufacturer, is not guaranteed or endorsed by the publisher.
References
Anderson M. J., Ellingsen K. E., and McArdle B. H. (2006). Multivariate dispersion as a measure of beta diversity. Ecol. Lett. 9, 683–693. doi: 10.1111/j.1461-0248.2006.00926.x
Barker M. and Rayens W. (2003). Partial least squares for discrimination. J. Chemom. 17, 166–173. doi: 10.1002/cem.785
Batterink M. and Wijffels G. (1983). Een vergelijkend vegetatiekundig onderzoek naar de typologie en invloeden van het beheer van 1973 tot 1982 in de duinweilanden op Terschelling (Wageningen, Netherlands: Agricultural University Department of Vegetation Science Plant Ecology and Seed Science).
Bray J. R. and Curtis J. T. (1957). An ordination of the upland forest communities of southern Wisconsin. Ecol. Monogr. 27, 325–349. doi: 10.2307/1942268
Calon T. G. A., Trobos M., Johansson M. L., Van Tongeren J., van der Lugt-Degen M., Janssen A. M. L., et al. (2019). Microbiome on the bone-anchored hearing system: A prospective study. Front. Microbiol. 10. doi: 10.3389/fmicb.2019.00799
Chamberlain S. A. and Szöcs E. (2013). taxize: taxonomic search and retrieval in R. F1000Res 2, 191. doi: 10.12688/f1000research.2-191.v2
Chiu C., Wang Y., Walther B. A., and Chao A. (2014). An improved nonparametric lower bound of species richness via a modified good–turing frequency formula. Biometrics 70, 671–682. doi: 10.1111/biom.12200
Choler P. (2005). Consistent shifts in alpine plant traits along a mesotopographical gradient. Arctic Antarctic Alpine Res. 37, 444–453. doi: 10.1657/1523-0430(2005)037[0444:CSIAPT]2.0.CO;2
Clarke K. R. and Warwick R. M. (1998). A taxonomic distinctness index and its statistical properties. J. Appl. Ecol. 35, 523–531. doi: 10.1046/j.1365-2664.1998.3540523.x
Condit R., Pitman N., Leigh E. G., Chave J., Terborgh J., Foster R. B., et al. (2002). Beta-diversity in tropical forest trees. Science 295, 666–669. doi: 10.1126/science.1066854
Dengler J. (2009). Which function describes the species–area relationship best? A review and empirical evaluation. J. Biogeogr. 36, 728–744. doi: 10.1111/j.1365-2699.2008.02038.x
Dray S. and Legendre P. (2008). Testing the species traits-environment relationships: the fourth-corner problem revisited. Ecology 89, 3400–3412. doi: 10.1890/08-0349.1
Ewald J. (2002). A probabilistic approach to estimating species pools from large compositional matrices. J. Veget. Sci. 13, 191–198. doi: 10.1111/j.1654-1103.2002.tb02039.x
Ewald J. D., Zhou G., Lu Y., Kolic J., Ellis C., Johnson J. D., et al. (2024). Web-based multi-omics integration using the Analyst software suite. Nat. Protoc. 19, 1467–1497. doi: 10.1038/s41596-023-00950-4
Foster Z. S. L., Sharpton T. J., and Grünwald N. J. (2017). Metacoder: An R package for visualization and manipulation of community taxonomic diversity data. PloS Comput. Biol. 13, e1005404. doi: 10.1371/journal.pcbi.1005404
Gearty W. and Jones L. A. (2023). rphylopic: An R package for fetching, transforming, and visualising PhyloPic silhouettes. Methods Ecol. Evol. 14, 2700–2708. doi: 10.1111/2041-210X.14221
Gloor G. B., Macklaim J. M., Pawlowsky-Glahn V., and Egozcue J. J. (2017). Microbiome datasets are compositional: and this is not optional. Front. Microbiol. 8. doi: 10.3389/fmicb.2017.02224
Hartigan J. A. and Wong M. A. (1979). Algorithm AS 136: A K-means clustering algorithm. Appl. Stat 28, 100. doi: 10.2307/2346830
Heck K. L., Van Belle G., and Simberloff D. (1975). Explicit calculation of the rarefaction diversity measurement and the determination of sufficient sample size. Ecology 56, 1459–1461. doi: 10.2307/1934716
Henderson P. A. (2019). Applying Multivariate Methods (Lymington and Pennington, Hampshire, UK: Pisces Conservation Ltd).
Jamil T., Ozinga W. A., Kleyer M., and Ter Braak C. J. F. (2013). Selecting traits that explain species–environment relationships: a generalized linear mixed model approach. J. Veget. Sci. 24, 988–1000. doi: 10.1111/j.1654-1103.2012.12036.x
Joanes D. N. and Gill C. A. (1998). Comparing measures of sample skewness and kurtosis. J. R. Stat. Soc.: Ser. D (The Statistician) 47, 183–189. doi: 10.1111/1467-9884.00122
Jongman R. H., Braak C. J. F. t., and Van Tongeren O. F. R. (Eds.) (1995). Data analysis in community and landscape ecology, New ed., with corr. ed (New York: Cambridge University Press, Cambridge).
Kergunteuil A., Campos-Herrera R., Sánchez-Moreno S., Vittoz P., and Rasmann S. (2016). The abundance, diversity, and metabolic footprint of soil nematodes Is highest in high elevation alpine grasslands. Front. Ecol. Evol. 4. doi: 10.3389/fevo.2016.00084
Kern F., Fehlmann T., and Keller A. (2020). On the lifetime of bioinformatics web services. Nucleic Acids Res. 48, 12523–12533. doi: 10.1093/nar/gkaa1125
Kindt R. and Coe R. (2005). Tree diversity analysis: a manual and software for common statistical methods for ecological and biodiversity studies (Nairobi, Kenya: World Agrofirestry Centre).
Kleyer M., Bekker R. M., Knevel I. C., Bakker J. P., Thompson K., Sonnenschein M., et al. (2008). The LEDA Traitbase: a database of life-history traits of the Northwest European flora. J. Ecol. 96, 1266–1274. doi: 10.1111/j.1365-2745.2008.01430.x
Laliberté E. and Legendre P. (2010). A distance-based framework for measuring functional diversity from multiple traits. Ecology 91, 299–305. doi: 10.1890/08-2244.1
Laliberté E., Legendre P., and Shipley B. (2014). FD: measuring functional diversity from multiple traits and other tools for functional ecology. Available at https://CRAN.R-project.org/package=FD (Accessed December 12, 2024)
Legendre P. and Gallagher E. D. (2001). Ecologically meaningful transformations for ordination of species data. Oecologia 129, 271–280. doi: 10.1007/s004420100716
Legendre P. and Legendre V. (1984). Postglacial dispersal of freshwater fishes in the Québec Peninsula. Can. J. Fisheries Aquat. Sci. 41, 1781–1802. doi: 10.1139/f84-220
Legendre P. and Legendre L. (2012). Numerical ecology, 3rd ed. ed, Developments in environmental modelling (Oxford: Elsevier).
Łopucki R., Kiersztyn A., Pitucha G., and Kitowski I. (2022). Handling missing data in ecological studies: Ignoring gaps in the dataset can distort the inference. Ecol. Modelling 468, 109964. doi: 10.1016/j.ecolmodel.2022.109964
Lu Y., Zhou G., Ewald J., Pang Z., Shiri T., and Xia J. (2023). MicrobiomeAnalyst 2.0: comprehensive statistical, functional and integrative analysis of microbiome data. Nucleic Acids Res. 51, W310–W318. doi: 10.1093/nar/gkad407
Lüdecke D., Ben-Shachar M., Patil I., Waggoner P., and Makowski D. (2021). performance: an R package for assessment, comparison and testing of statistical models. JOSS 6, 3139. doi: 10.21105/joss.03139
McCune B. (1986). Pc-Ord: An integrated system for multivariate analysis of ecological data. Abstracta Botanica 10, 221–225.
McCune B., Grace J. B., and Urban D. L. (2002). Analysis of ecological communities, 2nd printing. ed (Gleneden Beach, Or: MjM Software Design). Available online at: https://www.jstor.or/stable/43519133 (Accessed December 12, 2024).
McGill B. J., Etienne R. S., Gray J. S., Alonso D., Anderson M. J., Benecha H. K., et al. (2007). Species abundance distributions: moving beyond single prediction theories to integration within an ecological framework. Ecol. Lett. 10, 995–1015. doi: 10.1111/j.1461-0248.2007.01094.x
Merkel D. (2014). Lightweight Linux containers for consistent development and deployment. Linux J. 2014, 2. Available online at: https://dl.acm.org/toc/linux/2014/239 (Accessed December 12, 2024).
O’Hara R. B. (2005). Species richness estimators: how many species can dance on the head of a pin? J. Anim. Ecol. 74, 375–386. doi: 10.1111/j.1365-2656.2005.00940.x
Oksanen J., Simpson G. L., Blanchet F. G., Kindt R., Legendre P., Minchin P. R., et al. (2022). vegan: Community Ecology Package. R package version 2.6–4 [WWW Document]. vegan: Community Ecology Package. Available online at: https://CRAN.R-project.org/package=vegan (Accessed December 12, 2024).
Pang Z., Lu Y., Zhou G., Hui F., Xu L., Viau C., et al. (2024). MetaboAnalyst 6.0: towards a unified platform for metabolomics data processing, analysis and interpretation. Nucleic Acids Res. 52, W398–W406. doi: 10.1093/nar/gkae253
Poos M. S. and Jackson D. A. (2012). Addressing the removal of rare species in multivariate bioassessments: The impact of methodological choices. Ecol. Indic. 18, 82–90. doi: 10.1016/j.ecolind.2011.10.008
Rozenstein O., Paz-Kagan T., Salbach C., and Karnieli A. (2015). Comparing the effect of preprocessing transformations on M\methods of land-use classification derived from spectral soil measurements. IEEE J. Selected Topics Appl. Earth Observ. Remote Sens. 8, 2393–2404. doi: 10.1109/JSTARS.2014.2371920
Shepard R. N. (1962). The analysis of proximities: multidimensional scaling with an unknown distance function. II. Psychometrika 27, 219–246. doi: 10.1007/BF02289621
Šmilauer P. and Lepš J. (2014). Multivariate Analysis of Ecological Data using CANOCO 5, 2nd ed (Cambridge, UK: Cambridge University Press). doi: 10.1017/CBO9781139627061
Spence I. and Lewandowsky S. (1991). Displaying proportions and percentages. Appl. Cogn. Psychol. 5, 61–77. doi: 10.1002/acp.2350050106
Stephens C. R., Sierra-Alcocer R., González-Salazar C., Barrios J. M., Salazar Carrillo J. C., Robredo Ezquivelzeta E., et al. (2019). SPECIES: A platform for the exploration of ecological data. Ecol. Evol. 9, 1638–1653. doi: 10.1002/ece3.4800
Ter Braak C. J. F. (1986). Canonical Correspondence Analysis: A new eigenvector technique for multivariate direct gradient analysis. Ecology 67, 1167–1179. doi: 10.2307/1938672
Thioulouse J., Dray S., Dufour A.-B., Siberchicot A., Jombart T., and Pavoine S. (2018). Multivariate Analysis of Ecological Data with ade4 (New York, NY: Springer New York). doi: 10.1007/978-1-4939-8850-1
Tuia D., Kellenberger B., Beery S., Costelloe B. R., Zuffi S., Risse B., et al. (2022). Perspectives in machine learning for wildlife conservation. Nat. Commun. 13, 792. doi: 10.1038/s41467-022-27980-y
Keywords: community ecology, data analysis, R language, software, statistical analysis, web application, webserver, WEGAN
Citation: Sykes GP, Normington L, Poelzer J, Zhao S, Allen D, Stuart S, Oler E, Jot K, Gautam V, Zhao X, Xia J, Jickling GC and Wishart DS (2025) WEGAN: a web-based community ecology platform. Front. Ecol. Evol. 13:1604480. doi: 10.3389/fevo.2025.1604480
Received: 01 April 2025; Accepted: 02 May 2025;
Published: 27 May 2025.
Edited by:
Manel Leira, University of Santiago de Compostela, SpainReviewed by:
Bruno Garcia Luize, State University of Campinas, BrazilCitlalli Castillo Guevara, Universidad Autónoma de Tlaxcala, Mexico
Copyright © 2025 Sykes, Normington, Poelzer, Zhao, Allen, Stuart, Oler, Jot, Gautam, Zhao, Xia, Jickling and Wishart. This is an open-access article distributed under the terms of the Creative Commons Attribution License (CC BY). The use, distribution or reproduction in other forums is permitted, provided the original author(s) and the copyright owner(s) are credited and that the original publication in this journal is cited, in accordance with accepted academic practice. No use, distribution or reproduction is permitted which does not comply with these terms.
*Correspondence: David S. Wishart, ZHdpc2hhcnRAdWFsYmVydGEuY2E=