 Rileigh E. Hudock
 Brendan Campbell
 Noah Motz
 Aaron Carlisle
 Edward Hale
- 1School of Marine Science and Policy, College of Earth, Ocean, and Environment, University of Delaware, Lewes, DE, United States
- 2Delaware Sea Grant Program, College of Earth, Ocean and Environment, University of Delaware, Lewes, DE, United States
Oyster-based restoration projects, particularly living shorelines, are being installed to protect coastal ecosystems and infrastructure. While these installations often successfully create aquatic habitats, further refinement in optimizing the growth potential of shellfish on shoreline installations will increase the success rate and efficiency of restoration projects. This study evaluated the growth and mortality of two farmed strains of oyster, NEH® (high salinity tolerant) and DBX (medium and low salinity tolerant), in the lower Delaware Bay. From July to October 2023, we monitored the growth and mortality of each strain cultured in rack-and-bag oyster aquaculture gear positioned at intertidal and subtidal environments. The effect of tidal position, temperature, salinity, and dissolved oxygen on oyster performance (average oyster length and weekly oyster mortality) was examined using Generalized Additive Models (GAMs) to determine covariate importance towards the growth and survival of both oyster strains. Our findings indicate that NEH® oysters exhibited better meat condition than DBX oysters, and significantly different average weekly shell length. Oyster weekly average shell length was influenced by average temperature and the previous week’s minimum dissolved oxygen, while weekly mortality was influenced by minimum and average salinity and minimum dissolved oxygen. Subtidal oysters exhibited greater growth and survival than intertidal oysters, suggesting the addition of subtidal design features can enhance the likelihood of success for oyster restoration projects. These results emphasize the need to select an appropriate strain based on local environmental conditions and suggest that pre-seeding selectively bred oysters into living shoreline materials is a viable option to enhance restoration efficiency. Our results aid in our understanding of identifying important physical and environmental factors that determine oyster performance and provide insights via statistical models that can be applied to inform restoration and shellfish-based living shoreline planning.
1 Introduction
With the growing impact of climate change and sea level rise, there is an urgent need for resilient and adaptive solutions to protect vulnerable shorelines that support growing coastal communities. Traditional hardened structures, such as riprap and seawalls, while effective in the short term, are not adaptive in dynamic environments (Pilkey, 1988; Nunn et al., 2021). As such, there has been increased interest in living shoreline approaches that are adaptable and provide ecological benefits. Among these approaches, oysters and other reef building shellfish species are gaining attention for their ability to reduce erosion by accreting sediment and dispersing wave energy (Piazza et al., 2005; Stricklin et al., 2010; Walles et al., 2015), while providing essential ecosystem services (Shumway et al., 2003).
Eastern oysters (Crassostrea virginica) are a keystone species in marine environments that contribute to habitat provisioning services (Coen et al., 1999; Erbland and Ozbay, 2008; Marenghi et al., 2009; Shinn et al., 2021), nutrient assimilation (Newell et al., 2005; Hoellein et al., 2014; Ray et al., 2015), and water filtration (Newell and Langdon, 1996; Kreeger et al., 2018; Barr et al., 2023). Sustainable oyster reefs also provide structural integrity that modifies water flow patterns and circulation (Morris et al., 2021; Tso et al., 2023; Stanley et al., 2024; Campbell et al., 2025). However, eastern oyster populations have experienced a drastic depletion as a result of overharvesting (Canzonier, 2004; Sarinsky et al., 2005; Clyde, 2007), habitat degradation (Carlsson et al., 2006; Beseres Pollack et al., 2012), and disease (Canzonier, 2004; Friedman et al., 2020), requiring large-scale restoration efforts to aid in their recovery. Oysters are valuable not only ecologically but also economically. Oyster aquaculture is an important and rapidly expanding industry (Botta et al., 2020), valued at $285 million in 2018 in the United States (USDA NASS, 2018). Oyster aquaculture provides not just economic benefits (Grabowski et al., 2012; Kumar et al., 2024) but also environmental services akin to natural reefs, including habitat provisioning (Martínez-Baena et al., 2022) and coastal resilience enhancement (Hossain et al., 2013).
Oysters and other shellfish are increasingly being used in restoration projects aimed at rebuilding reefs (Bersoza Hernández et al., 2018) and protecting shorelines (La Peyre et al., 2013). These restoration efforts can employ a range of techniques to capture wild spat by deploying alternate substrates to encourage recruitment where reef habitats have been lost (van den Brink et al., 2020; Rusydi et al., 2023) or through remote setting where juvenile oysters are seeded onto structures and then are released on existing reefs to increase their survival (Sunila et al., 2016). In Chesapeake Bay, where oyster populations have been severely reduced, these methods are being explored to accelerate the repopulation of native oyster reefs (USACE, 2012). Additionally, as of 2023, the cost of oyster restoration efforts in Maryland was approximately $87.36 million, signaling the need to refine restoration efforts to reduce expenses (NOAA Fisheries, 2024). Although individual seed oysters have not been widely used in restoration projects, remote, ‘spat-on-shell’ approaches seem to be effective for large-scale applications (Maryland Oyster Restoration Interagency Workgroup, 2024). Such gaps in understanding highlight the need for further research to improve the effectiveness of installing pre-seeded structures for restoration purposes across different environments, particularly in areas with low natural recruitment.
The growth and survival of oysters depend on a suite of environmental parameters, including temperature, salinity, and dissolved oxygen, making oyster-based restoration efforts closely linked with local water quality (NOAA Fisheries EOBRT, 2007). Since these environmental parameters vary spatially and temporally, understanding how the range of environmental conditions influence oyster performance is critical for developing effective restoration strategies. Oysters have specific thermal tolerances (Calabrese and Davis, 1970; Hofstetter, 1977; Stanley and Sellers, 1986), and extreme changes in temperature have been shown to disrupt their physiological functioning (Shumway, 1996). Similarly, salinity levels influence osmoregulation and can impact oyster health (Casas et al., 2024), while low dissolved oxygen can create additional physiological stress (Patterson et al., 2014). Understanding these interactions is key to making sure restoration sites are selected and managed to enable persistent oyster populations. Previous studies focused on the impact of genetic diversity and the comparison between different oyster strains as an approach to increasing survival and resilience to environmental stressors, where disease-resistant strains showed better survival than wild and susceptible lines (Rawson and Feindel, 2012; Frank-Lawale et al., 2014; Proestou et al., 2016; McCarty et al., 2021). Growth patterns were found to differ between oyster strains and across tidal positions (Bartol et al., 1999; Bishop and Peterson, 2005). These aspects highlight the importance of targeted oyster strain selection and tidal placement to optimize restoration success, as well as additional studies on factors driving oyster growth and survival.
DBX and NEH® are two selectively bred oyster strains developed by Rutgers University’s Haskin Shellfish Research Laboratory. NEH®, derived from Long Island Sound stocks, has undergone decades of selection for improved growth and survival in high-salinity environments and exhibits strong resistance to two major oyster pathogens, MSX (Haplosporidium nelsoni) and Dermo (Perkinsus marinus). DBX, bred primarily from Delaware Bay oyster lines, was developed to perform well in mesohaline and oligohaline environments and also carries resistance to both MSX and Dermo, though it is generally deployed in lower-salinity areas. Both strains are used in aquaculture and restoration due to their enhanced growth rates compared to wild oysters and adaptability to a range of estuarine conditions (Rutgers University, n.d).
Our study examined how environmental variables (temperature, salinity, and dissolved oxygen), family strain, and tidal position impact oyster growth and survival using rack-and-bag oyster aquaculture gear as a proxy for living shoreline coastal restoration projects. We evaluated the performance of DBX and NEH® oyster strains in intertidal and subtidal environments within the Delaware Bay (Lewes) by modeling oyster growth and mortality as a function of the environment. We hypothesized that oyster performance will differ by strain and tidal position, dependent on environmental water quality parameters (temperature, salinity, and dissolved oxygen) experienced at the study site. Evaluating these factors provides recommendations for optimal oyster strain selection and tidal placement to inform the design of shellfish-based living shorelines, contributing to more resilient and adaptive strategies for coastal restoration.
2 Methods
2.1 Study area
The field study was conducted at the University of Delaware Hugh R. Sharp Campus boat basin (38.788081°N, 75.162194°W), located in Lewes, Delaware, on the southwest portion of Delaware Bay. Delaware Bay is connected to the Atlantic Ocean to the southeast and the Delaware River to the north. This system is considered a well-mixed estuary with an average depth of 8 m, an average tidal range of ~1.5 m (Aristizábal and Chant, 2013, 2015; Hall et al., 2013), and an average residence time of 40 to 90 days depending on discharge, categorizing it as a moderately flushed system (Joesoef et al., 2015). The bay follows a strong salinity gradient, ranging from 0.1 to 31.5 psu (NOAA DBOFS, n.d) and provides habitat for many aquatic species (Mathews et al., 2022; Oleynik et al., 2024).
2.2 Experimental design
We deployed triploid, disease-resistant, high-salinity tolerant (NEH®), and low-salinity tolerant (DBX) oysters produced by the New Jersey Aquaculture Innovation Center at Rutgers University (Cape May, NJ), using rack-and-bag culture systems throughout mid-summer (July 2023) to the fall (October 2023). Treatment groups consisted of six rack-and-bag installations within the boat basin, three placed in the intertidal zone and three in the subtidal zone. Each pair of intertidal and subtidal racks ran parallel to the shoreline (with spacing adjusted for tidal range) and were at equal depths per respective tidal position. The racks were randomly allocated to their corresponding tidal positions, with 50-meter intervals between each pair of racks (Figure 1). Each rack was approximately 8 inches above the sediment. Oysters were graded at the start of the experiment and had an average shell length of 8.42 ± 1.88 mm for NEH® and 7.69 ± 1.69 mm for DBX. Although this difference was minor, and size grading was conducted to reduce variation, the initial size discrepancy is acknowledged as a potential source of bias in growth comparisons. Four rectangular Vexar bags containing 50 oysters each were attached to each rack and two bags of ~200 cultch were added as space-holders. The stocking density of these bags was low compared to commercial standards, which is typically around 800 oysters at that stocked size. The four bags were grouped by genetic strain, NEH® and DBX, with two bags per strain. The mesh size of the Vexar bag was originally 4 mm, based on the oysters’ initial shell length, and then enlarged to 9 mm when the minimum shell length reached about 1.5 times that of the mesh size. To control biofouling, sea squirts (Molgula manhattensis) were removed, and bags were flipped weekly. Bags were replaced once at the 4 mm stage to control for extreme biofouling. Oysters within each pair of bags per strain were pooled per rack, and each rack served as replicate for that strain and tidal position. These data were then aggregated across all three racks per tidal position and strain (e.g., all NEH intertidal racks) to calculate final strain and tidal position level averages and metrics for statistical analysis.
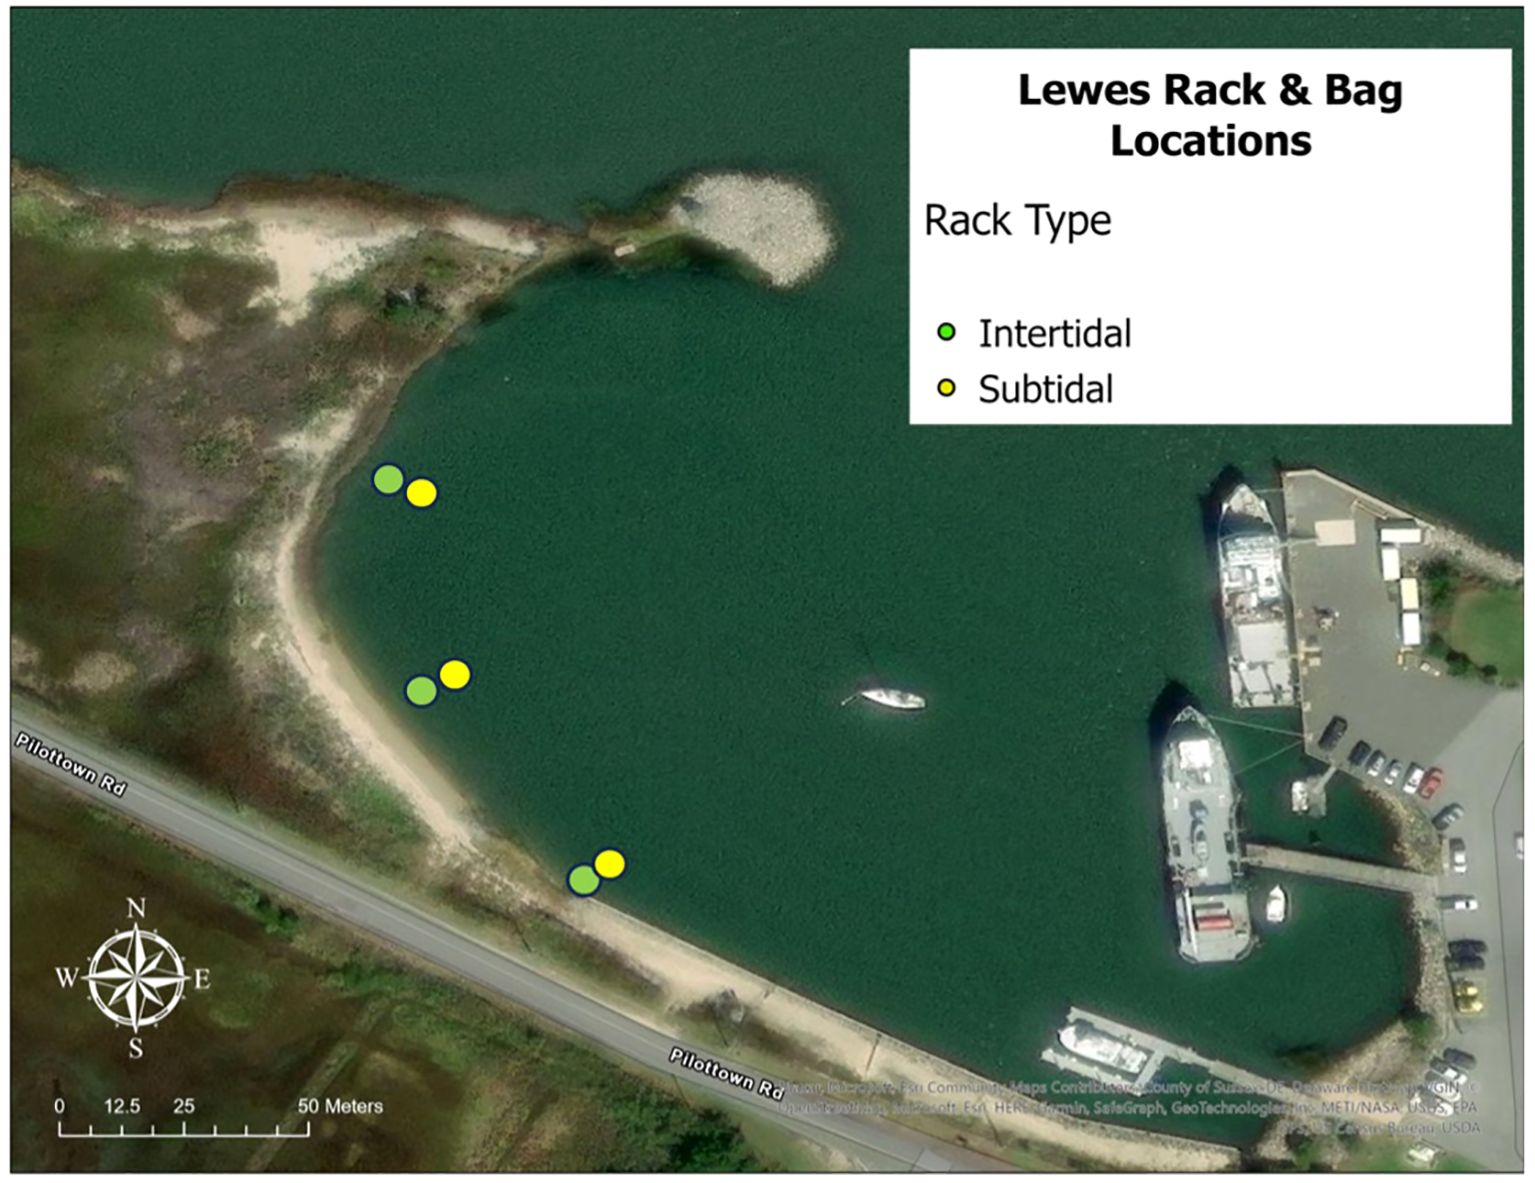
Figure 1. Map of study design set up at Lewes boat basin (38.788081°N, 75.162194°W). Green points represent intertidal racks, while yellow points represent subtidal racks.
2.3 Environmental monitoring
Continuous monitoring of temperature (°C), salinity (psu), and dissolved oxygen (mg/L) were conducted at subtidal rack locations, utilizing Onset® HOBO® loggers (HOBO U24-002-C for temperature and salinity and HOBO U26–001 equipped with a U26-GUARD-2 anti-fouling guard for dissolved oxygen, Onset Computer Corporation, Bourne, MA U.S.A). Water quality loggers sampled at a 30-minute frequency, determined from the guidance provided by the HOBOware® Pro software. Environmental time series data were aggregated to examine temporal patterns in water quality variables throughout the study period. To assess the stationarity of the data, we tested both daily (24 hours prior to the sampling event) and weekly intervals (the week prior to the sampling event), evaluating the maximum, minimum, and average values for each variable. Stationary variables included daily averages, minimums, and maximums for dissolved oxygen, temperature, and salinity, as well as weekly average temperature and weekly minimum dissolved oxygen. For stationary time series, no differencing was required, while non-stationary time series required first- or second-order differencing to achieve stationarity. Time series that were unable to achieve stationarity were removed from the analysis.
2.4 Oyster performance
Oyster growth and survival were assessed weekly. For each bag, shell length, width, and depth of 20 individuals were measured at random. Mortality was assessed weekly by counting the number of dead oysters in each bag. A dead oyster was identified by the open separation of its valves, emitting a hollow sound when knocked against a live oyster, or by the absence of resistance when attempting to close its valves together. Dead oysters were removed from each bag weekly to prevent recounting, and no live oysters were added or replaced throughout the experiment. Following the completion of the field experiment, 10 individuals were randomly selected per rack and per strain across replicate bags to measure wet mass and estimate their condition index (Equation 1) using methods from Lawrence and Scott (1982). The ratio of dry tissue weight to dry shell provides an indication of the oyster meat quality and a proxy for tissue growth and performance. At the end of the experiment, final measurements of shell length and mortality were used to determine weekly average oyster length, instantaneous growth rate (IGR), and survivorship by strain and tidal position. IGR was calculated using Equation 2, where L2 and L1 correspond to the final and initial lengths, and t2-t1 is the duration of the experiment expressed in weeks. Since the duration of the experiment was less than one year, this formula was applied.
2.5 Statistical analysis
Univariate statistical analyses were conducted to understand the effects of oyster strain and tidal position on oyster performance metrics, including growth (average length, instantaneous growth rate, and condition index) and survivorship, and to provide context to aid in covariate selection for the preceding descriptive model. Normality was checked using Shapiro-Wilk tests to determine the use of standard or non-parametric equivalents to derive differences in performance. Condition index followed a normal distribution while growth and mortality did not. For each of the growth metrics and survivorship, Scheirer-Ray-Hare tests were implemented to compare significant differences between oyster strains and tidal positions. For the statistically significant relationships, a post-hoc Wilcoxon rank sum test was used to define significantly different groups. For condition index data, a two-way ANOVA was used to find significant differences between oyster strains and tidal position, followed by Tukey’s HSD test for significant relationships. Significance will be determined using an alpha of 0.05 for normality checks and univariate statistical analyses.
We used Generalized Additive Models (GAMs) to analyze the effect of environmental variables on oyster growth and mortality. The goal was to understand how environmental covariates (temperature, salinity, and dissolved oxygen) influenced oyster performance across different strains and tidal positions. The response variables for the models included average oyster length and weekly mortality. Each weekly observation in the GAMs represented an average across both bags per strain, per rack, further aggregated by tidal position, resulting in one observation per strain and tidal position combination per week. Therefore, each GAM used repeated, temporally spaced observations from these four groups (NEH-intertidal, NEH-subtidal, DBX-intertidal, DBX-subtidal), but did not include a hierarchical or random-effects structure due to the data being pooled at the strain and tidal position level. Only stationary environmental time series, previously found to be correlated with the response variables through cross-correlation functions, were included as covariates in the models.
Collinearity tests among covariates were performed by using Variance Inflation Factor (VIF) analysis using the “vif” function from the car package in R version 4.2.1 (R Core Team, 2022). We removed variables with a VIF score greater than 5 to reduce multicollinearity. Models were fit using the “gam” function in the mgcv package in R version 4.2.1 (R Core Team, 2022). The best family distribution was chosen based on scoring using Akaike’s Information Criterion (AICc) for small sample size (Burnham and Anderson, 2022). After selecting the best family distribution based on global models, we applied the “dredge” function in the MuMIn package of R version 4.2.1 (R Core Team, 2022) for automatic model selection. This function selects the most relevant environmental covariates and identifies the tightest model construction. Predictive ability and k-fold cross-validation were assessed on models within 5 AICc points of the top model using the “predict” function in the car package in R version 4.2.1 (R Core Team, 2022). This method divides the data into k folds, with each fold serving as one validation set at a time, while the remaining folds were used for training data. The predictive accuracy for the models was determined by calculating the average root mean square error (RMSE) across all k folds. The model with the lowest average RMSE value was selected as the final model.
The GAM for oyster growth was fit using the Gaussian family with the identity link function, using weekly average oyster length as the response variable (Equation 3). The model included smooth terms for average temperature and the previous week’s minimum dissolved oxygen, as well as categorical terms for tidal position and strain. The formula for the final growth model was:
The GAM for oyster mortality was fitted using the Negative Binomial family with the log link function and weekly mortality as the response variable (Equation 4). The model included smooth terms for minimum salinity, average salinity, and minimum dissolved oxygen, as well as a categorical term for tidal position. The formula for the final mortality model was:
3 Results
3.1 Environmental monitoring
The water temperature ranged from 15.8 to 29.12 °C (average 23.3±2.8 °C SD), with the highest temperatures observed in July and August. Temperature was fairly stable through the summer months, with a gradual drop in temperature starting in mid-September. Salinity ranged from 18.34 to 30.94 psu (28.3±1.4 psu) and remained steady throughout the study, aside from the normal daily fluctuations associated with tidal changes. Dissolved oxygen levels ranged from 0.40 to 13.53 mg/L (5±1.9 mg/L), with the lowest concentrations observed in late summer and early fall. Dissolved oxygen values declined steadily through September and early October, tracking seasonal trends expected between summer and fall.
Environmental time series data for temperature, salinity, and dissolved oxygen were checked for stationarity at both daily (24 hours prior to the sampling event) and weekly intervals (week prior to the sampling event). The stationarity tests revealed that all daily intervals (averages, minimums, and maximums) for all variables were stationary, in addition to the weekly average temperature and weekly minimum dissolved oxygen. Variables that required no differencing consisted of average dissolved oxygen, minimum dissolved oxygen, minimum salinity, and weekly minimum dissolved oxygen. First-order differencing was required for maximum dissolved oxygen, average temperature, maximum temperature, average salinity, and maximum salinity, while second-order differencing was necessary for minimum temperature and weekly average temperature. Variables that were unable to achieve stationarity include weekly average dissolved oxygen, maximum dissolved oxygen, maximum temperature, minimum temperature, average salinity, maximum salinity, and minimum salinity. Cross-correlation functions (CCFs) were used to examine the relationships between the daily and weekly environmental variables and oyster performance response variables (i.e. weekly average length and weekly mortality). Significant correlations (values that exceed the 95% confidence interval) were observed for the following variables for weekly average oyster length: daily average dissolved oxygen, daily minimum dissolved oxygen, daily average temperature, daily minimum salinity, and weekly minimum dissolved oxygen. Significant correlations were observed for the following variables for weekly mortality: daily minimum temperature, daily average temperature, daily minimum dissolved oxygen, daily average dissolved oxygen, daily maximum dissolved oxygen, weekly minimum dissolved oxygen, daily minimum salinity, and daily average salinity.
3.2 Oyster performance
Mean oyster shell length was calculated weekly for each tidal position and farmed strain combination (Figure 2). NEH® subtidal oysters had the greatest final mean shell length (39.4 mm ± 5.6 SD, 95% CI: 38.1-40.8), followed by DBX subtidal oysters (38.8 mm ± 6.5 SD, 95% CI: 37.1-40.5). NEH® intertidal was similar, with a final value of 37.4 mm ± 6.2 SD (95% CI: 35.6-39.2). DBX intertidal showed the smallest final mean length with a value of 30.1 mm ± 6.3 SD (95% CI: 27.5-32.7). Mean shell length of oysters from different strains cultured in subtidal and intertidal positions did not differ according to the Scheirer-Ray-Hare test (p > 0.05).
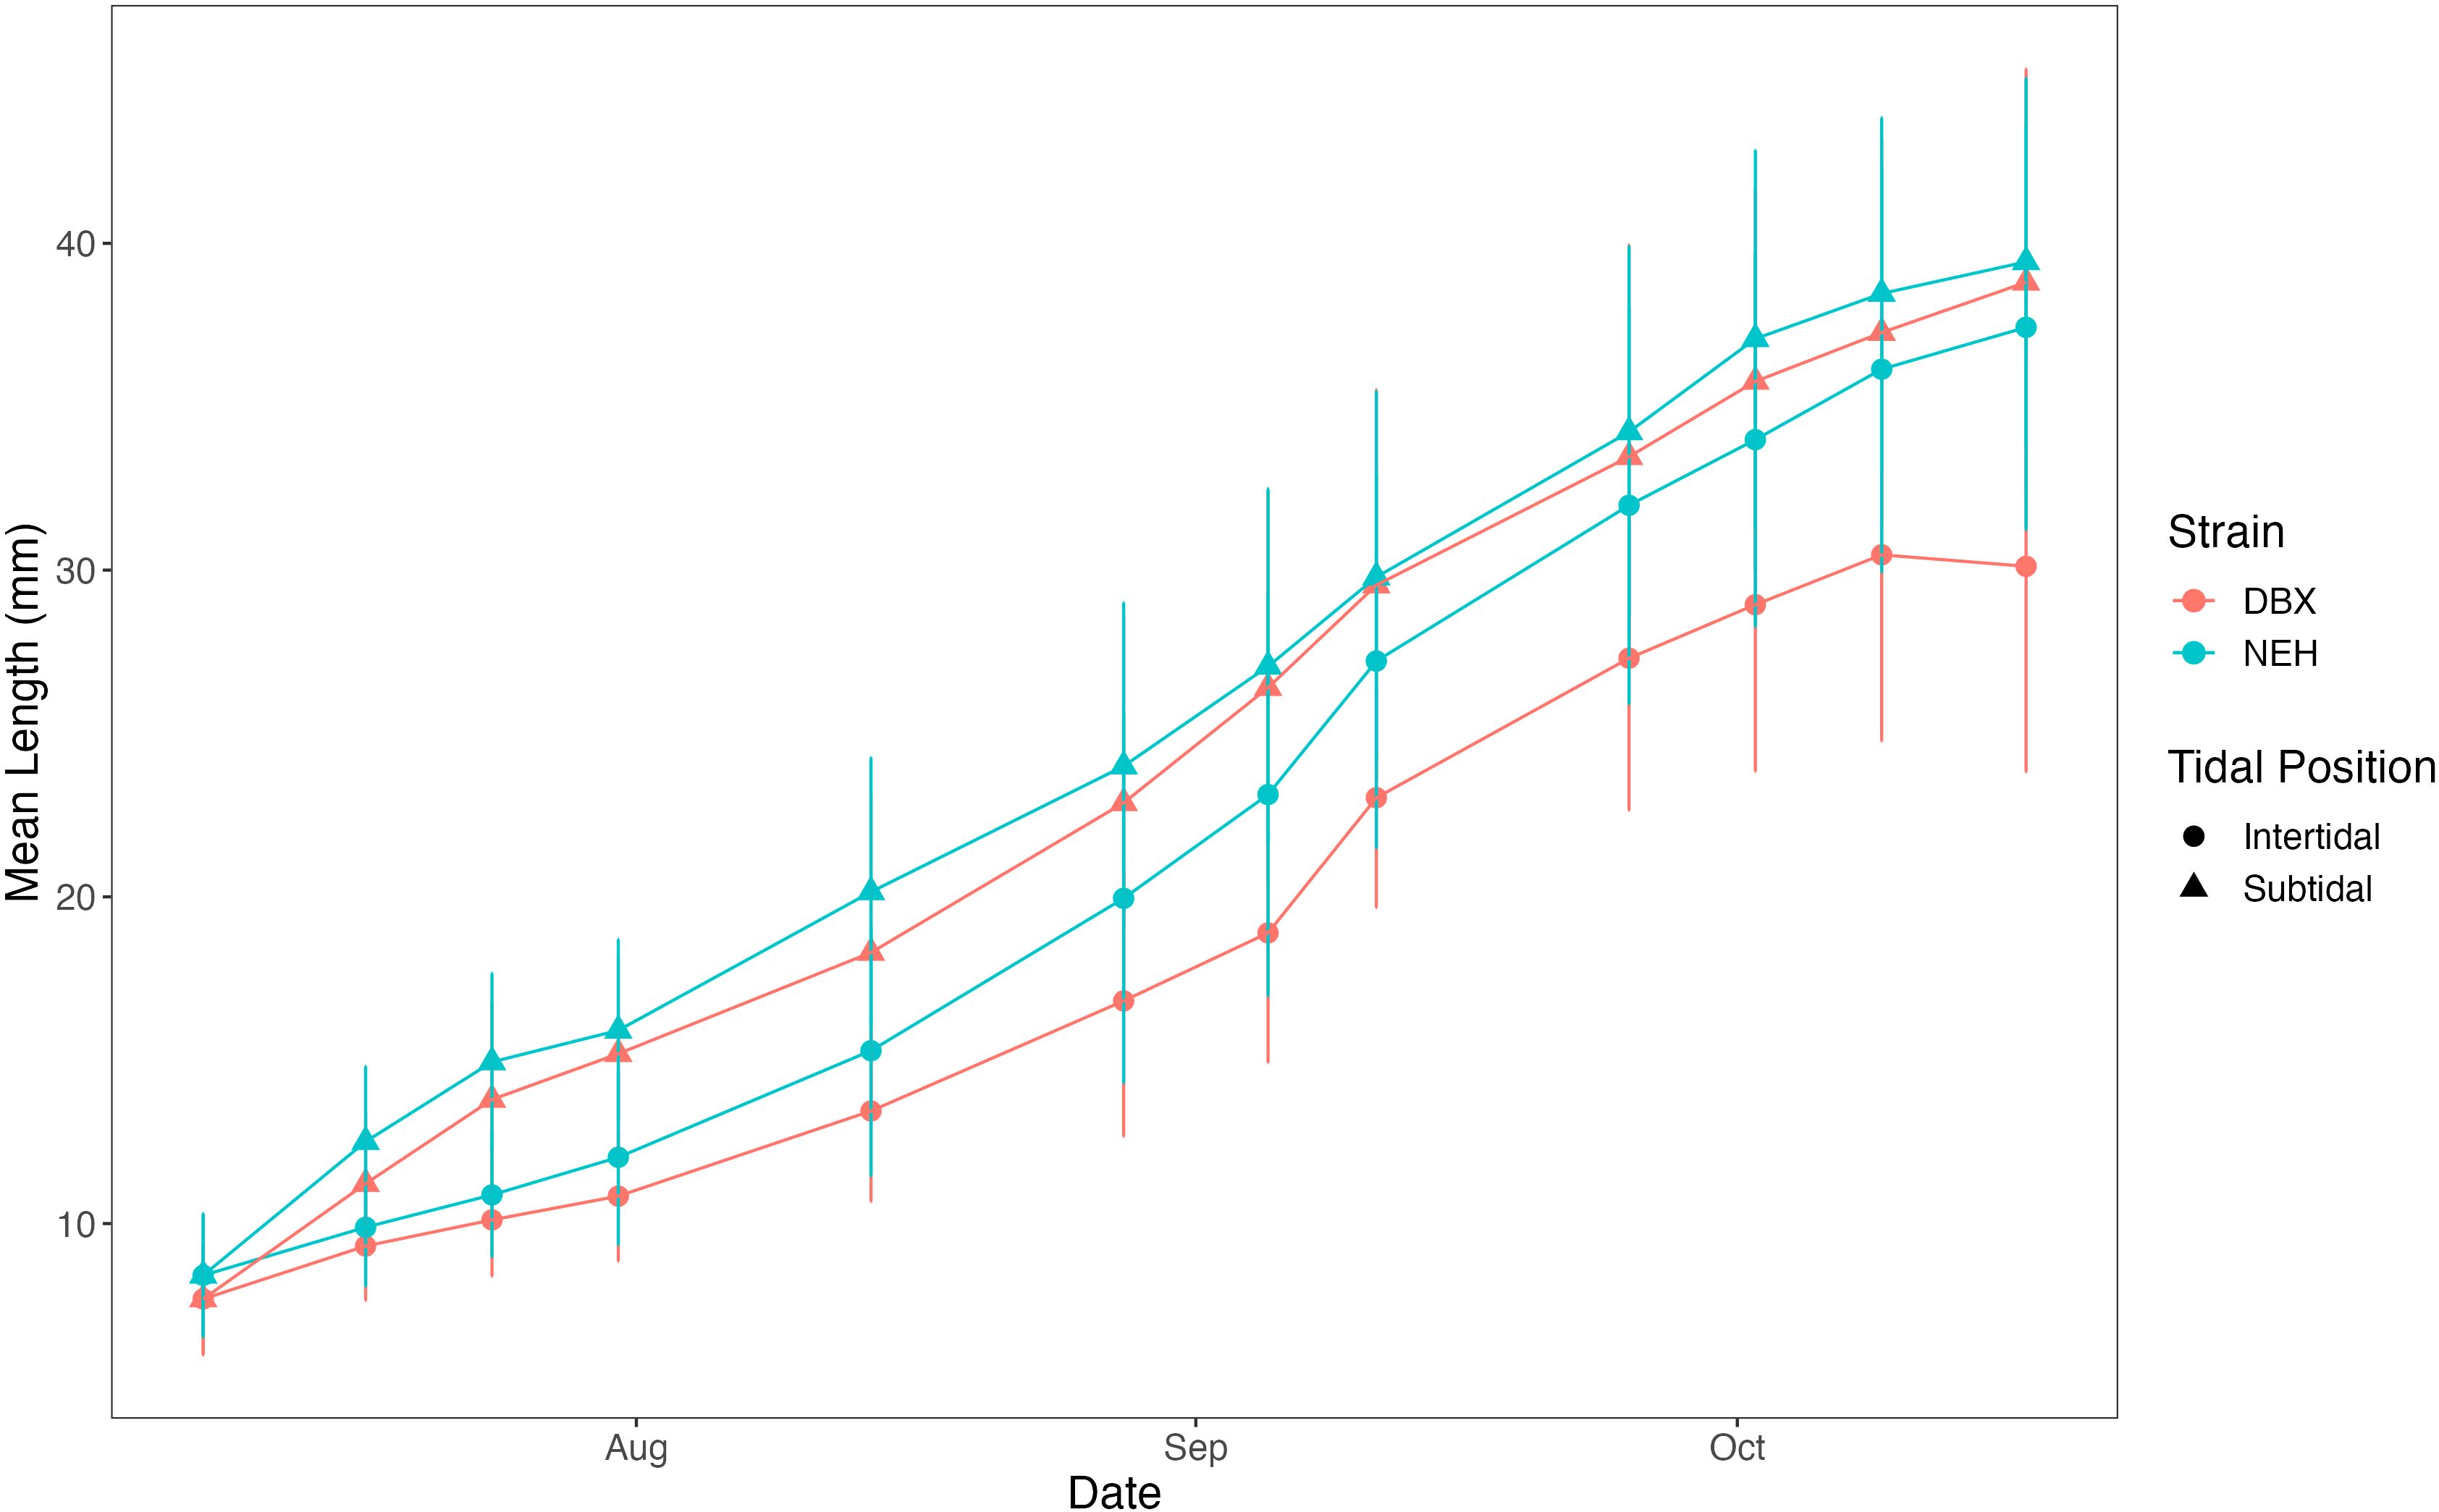
Figure 2. Mean oyster length between oyster strain and rack tidal position over time. Blue indicates NEH® oysters, while pink represents DBX oysters. Intertidal positioning is noted with circle symbols and subtidal positioning with triangle symbols. Error bars are ± one standard deviation.
IGR was calculated weekly for each oyster group combination (Figure 3, Equation 2). Growth rates varied between groups. The NEH® subtidal oysters exhibited a mean growth rate of 0.38 mm/week, ± 0.12 SD (95% CI: 0.3-0.5), followed closely by DBX subtidal oysters (0.37 mm/week, ± 0.13 SD, 95% CI; 0.3-0.4). Mean growth rate for NEH® intertidal oysters was 0.36 mm/week ± 0.13 SD (95% CI: 0.3-0.4), while DBX intertidal oysters had a mean growth rate of 0.35 mm/week, ± 0.12 SD (95% CI: 0.3-0.4). However, the Scheirer-Ray-Hare test showed no significant effects of tidal position (p = 0.36) or strain (p = 0.66) on IGR. Additionally, linear models were fit to evaluate the trend in growth rate over time for each strain and tidal position combination. Growth rates over time showed no statistical difference when analyzed using linear models. The DBX intertidal oysters had an R-squared value of 0.3 (p = 0.08), DBX subtidal oysters had an R-squared of 0.25 (p = 0.11), NEH® intertidal oysters had an R-squared value of 0.32 (p = 0.07), and NEH® subtidal oysters had an R-squared of 0.24 (p = 0.12) (Figure 4).
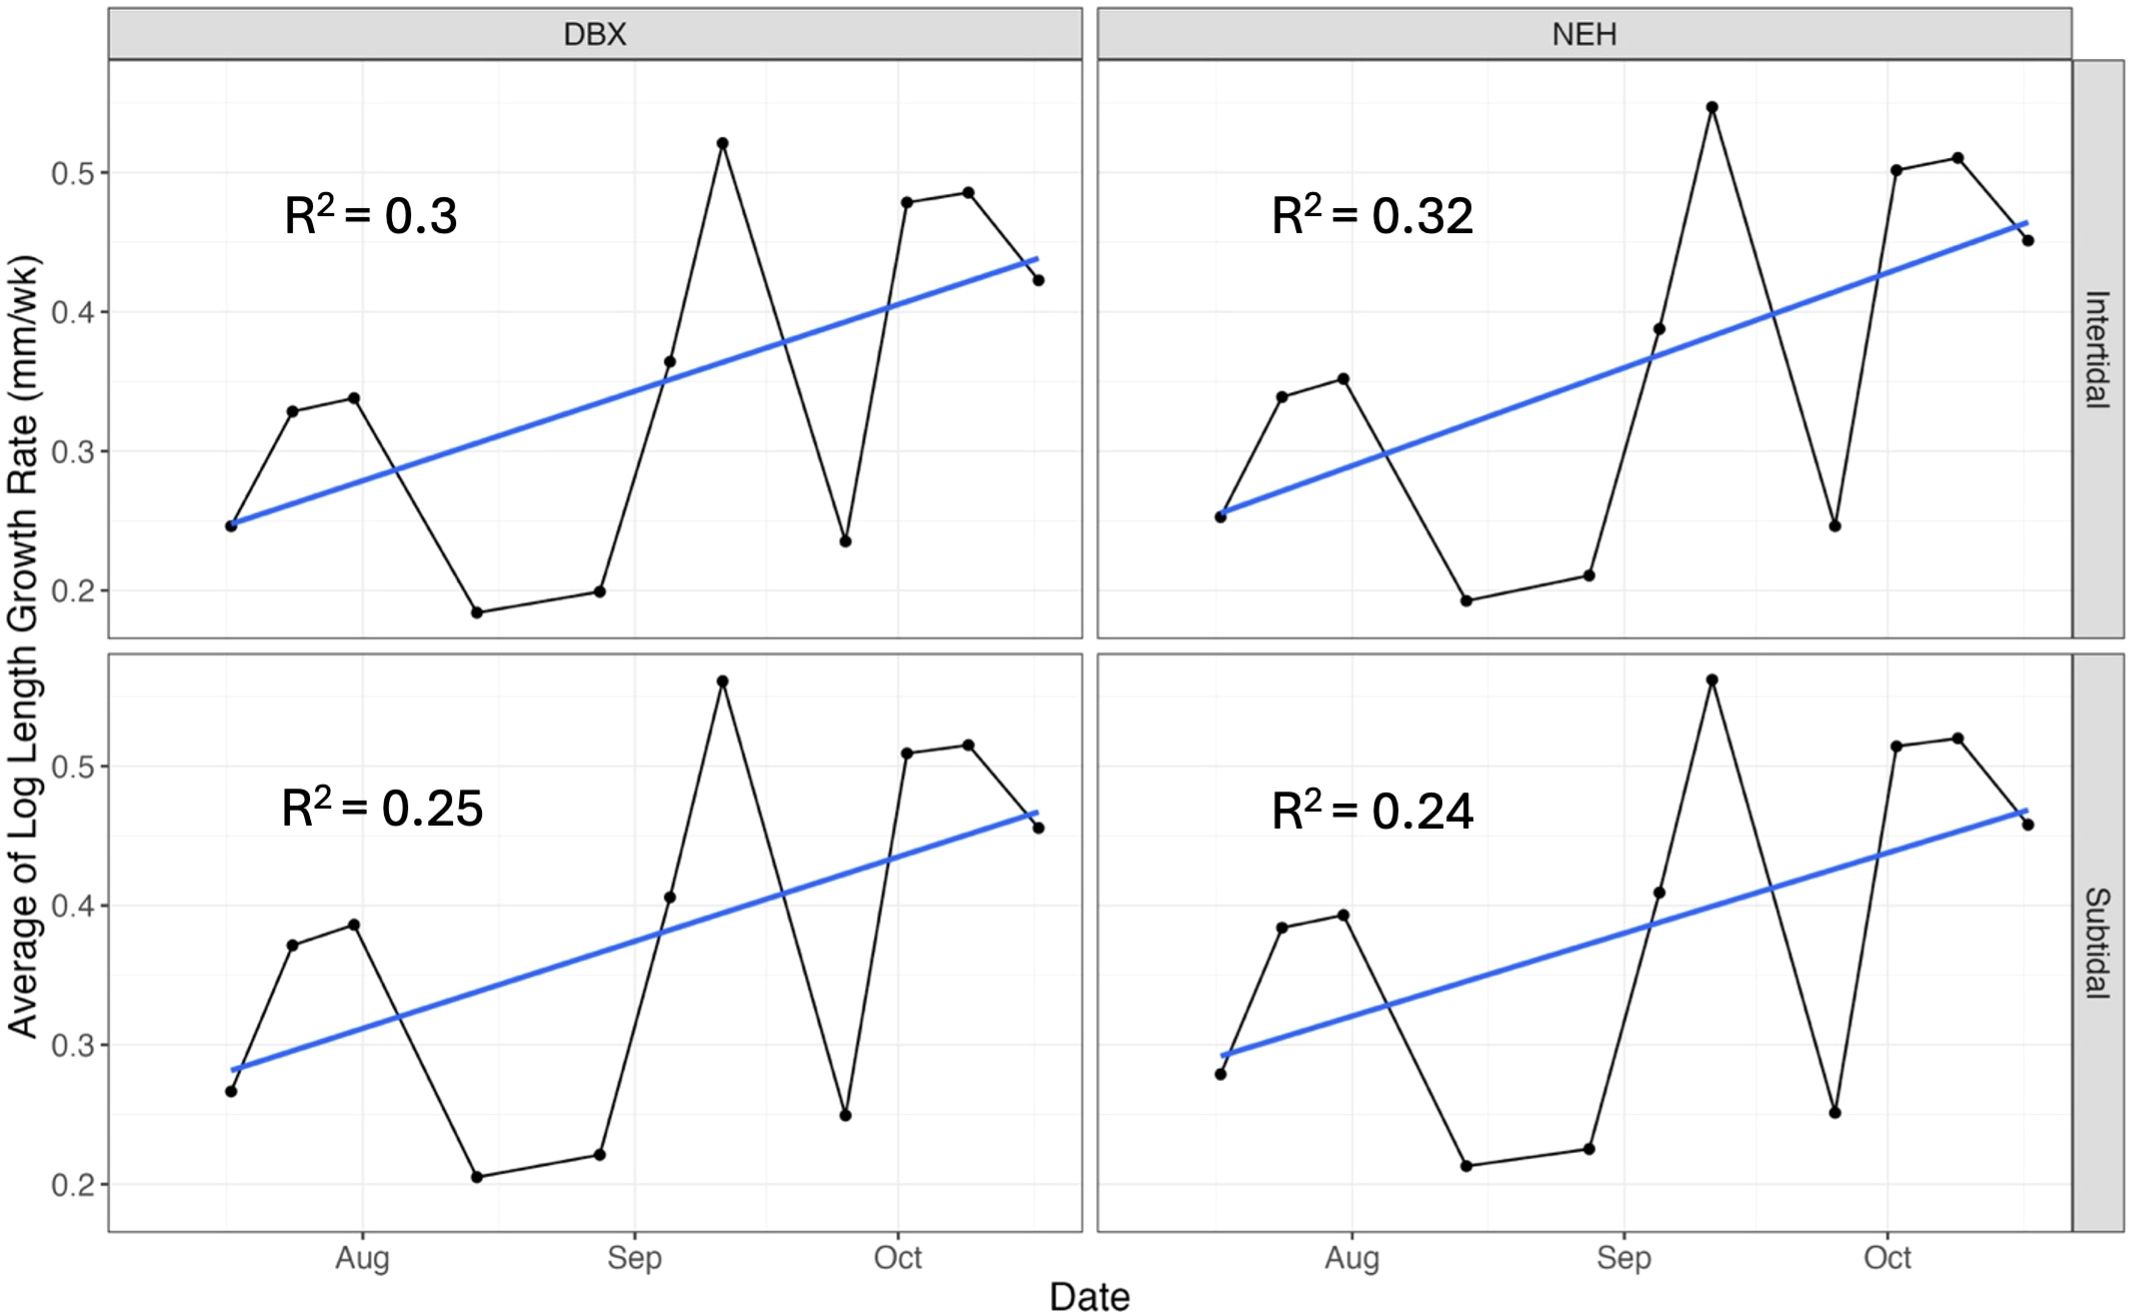
Figure 3. Instantaneous growth rate over time (mm/week) for each oyster strain and tidal position with a linear regression trendline found in blue. DBX intertidal oysters had an R-squared value of 0.3, while DBX subtidal oysters had an R-squared value of 0.25. NEH® intertidal oysters had an R-squared value of 0.32, while NEH® subtidal oysters had an R-squared value of 0.24.
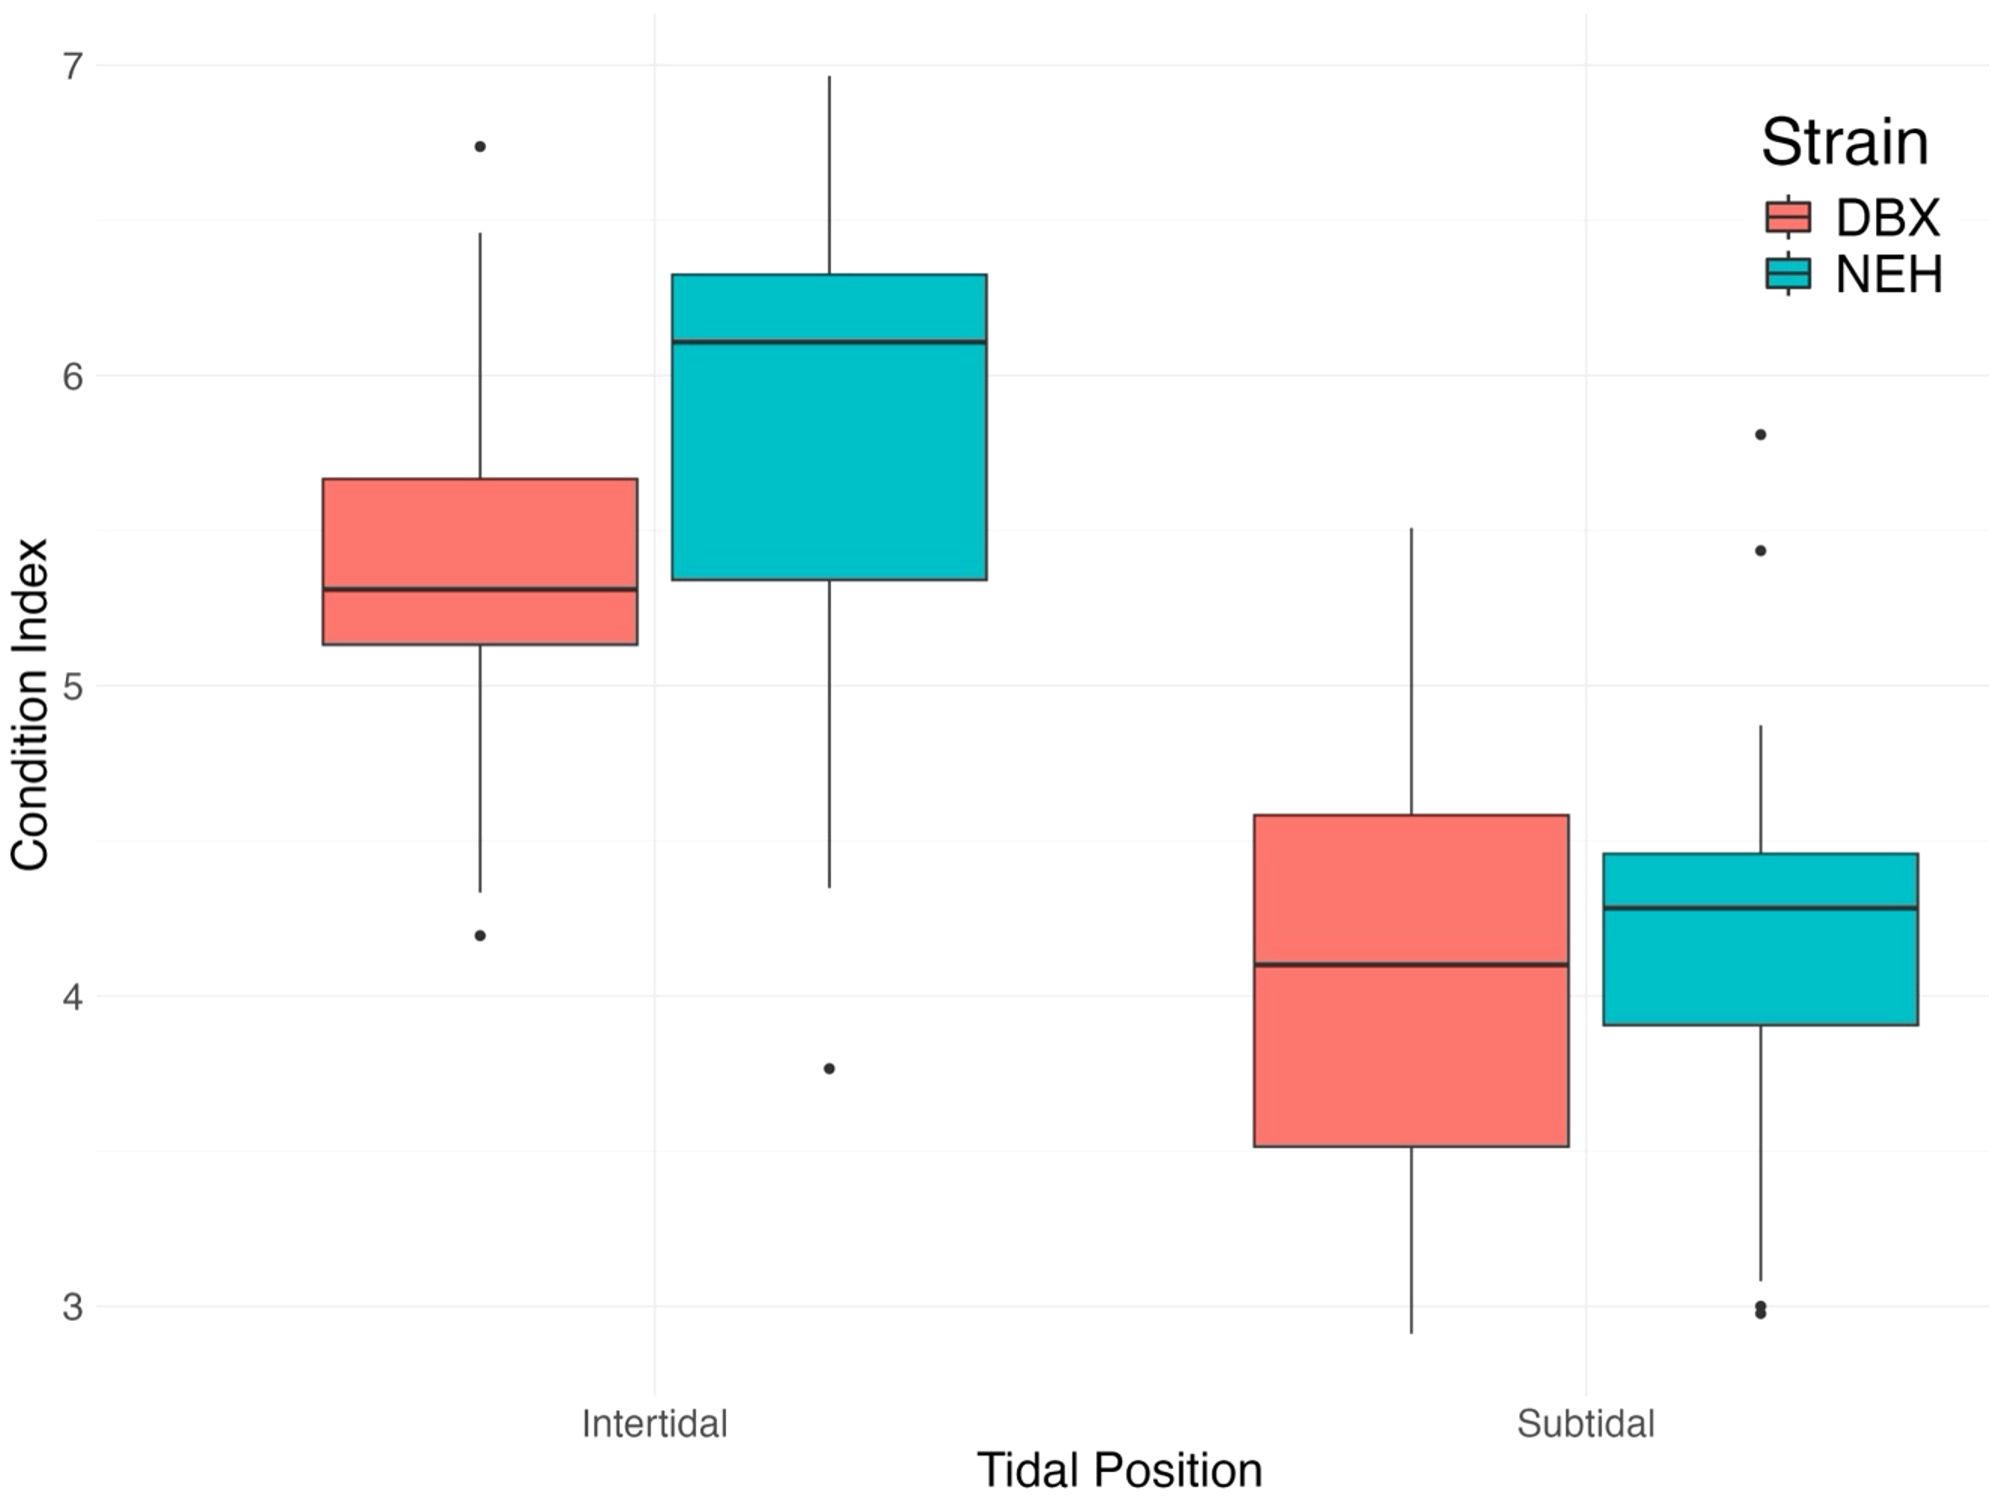
Figure 4. Final oyster condition index by tidal position and strain. Intertidal oysters appear to show an overall greater condition index than subtidal oysters.
Condition index was calculated through Equation 1 (Figure 4). The average condition index value for intertidal DBX was 5.4 ± 0.61 SD (95% CI: 5.2-5.6), while intertidal NEH® showed a condition index of 5.88 ± 0.8 SD (95% CI: 5.5-6.2). Mean condition index within the subtidal zone for DBX oysters was 4.09 ± 0.71 SD (95% CI: 3.8-4.4), and NEH® oysters had a mean condition index of 4.22 ± 0.63 SD (95% CI: 3.99-4.5). A two-way ANOVA was conducted to examine the effects of tidal position and strain on the condition index. Analysis indicated a significant effect of tidal position (p< 0.001), suggesting that the condition index of oysters in the intertidal zone is significantly different from those in the subtidal zone. Strain also had a significant effect (p = 0.03), with NEH® oysters showing a significantly different condition index than DBX oysters. However, the interaction between tidal position and strain was not significant (p = 0.18), indicating that the effect of tidal position on the condition index did not significantly vary between strains. Results of subsequent pairwise comparisons using Tukey’s HSD test indicated that subtidal oysters had a significantly lower condition index than intertidal oysters (p< 0.001), and NEH® oysters exhibited a significantly higher condition index than DBX oysters (p = 0.03). When comparing oysters of the same strain, subtidal DBX oysters had a significantly lower condition index than intertidal DBX oysters (p< 0.001). Condition index of intertidal NEH® oysters was greater than subtidal DBX oysters (p< 0.001) and subtidal NEH® oysters (p< 0.001). The difference in condition index between intertidal NEH® oysters and intertidal DBX oysters was not statistically significant (p = 0.06), meaning that the condition index of these two groups was similar. These results indicate that oysters in the intertidal zone generally have better condition, as well as NEH® oysters compared to DBX oysters, emphasizing that both tidal position and strain significantly influence the condition index.
The number of survivors was measured across the oyster group combinations (Figure 5), with mean survivors as follows: intertidal DBX had 174 survivors (± 55.9 SD, 95% CI: 160-188), intertidal NEH® had 177 survivors (± 56 SD, 95% CI: 163-191), subtidal DBX had 221 survivors (± 42.2 SD, 95% CI: 211-231), and subtidal NEH® had 227 survivors (± 40.1 SD, 95% CI: 217-236). A Scheirer-Ray-Hare test was conducted to examine the effects of tidal position, strain, and their interaction on survivorship. The results showed a strong effect of tidal position on survivorship (p< 0.001), with the mean number of survivors for subtidal oyster groups being significantly different than intertidal oyster groups. Neither strain (p = 0.28) nor the interaction between tidal position and strain (p = 0.83) significantly affected survivorship, suggesting that the difference in survivorship between intertidal and subtidal oysters was independent of strain. A subsequent Wilcoxon rank-sum test verified that survivorship differed between intertidal and subtidal oysters (p< 0.001, adjusted with Bonferroni), with significantly higher survivorship observed in subtidal oysters compared to intertidal oysters (Figure 5). No significant differences were detected between strains within each tidal position.
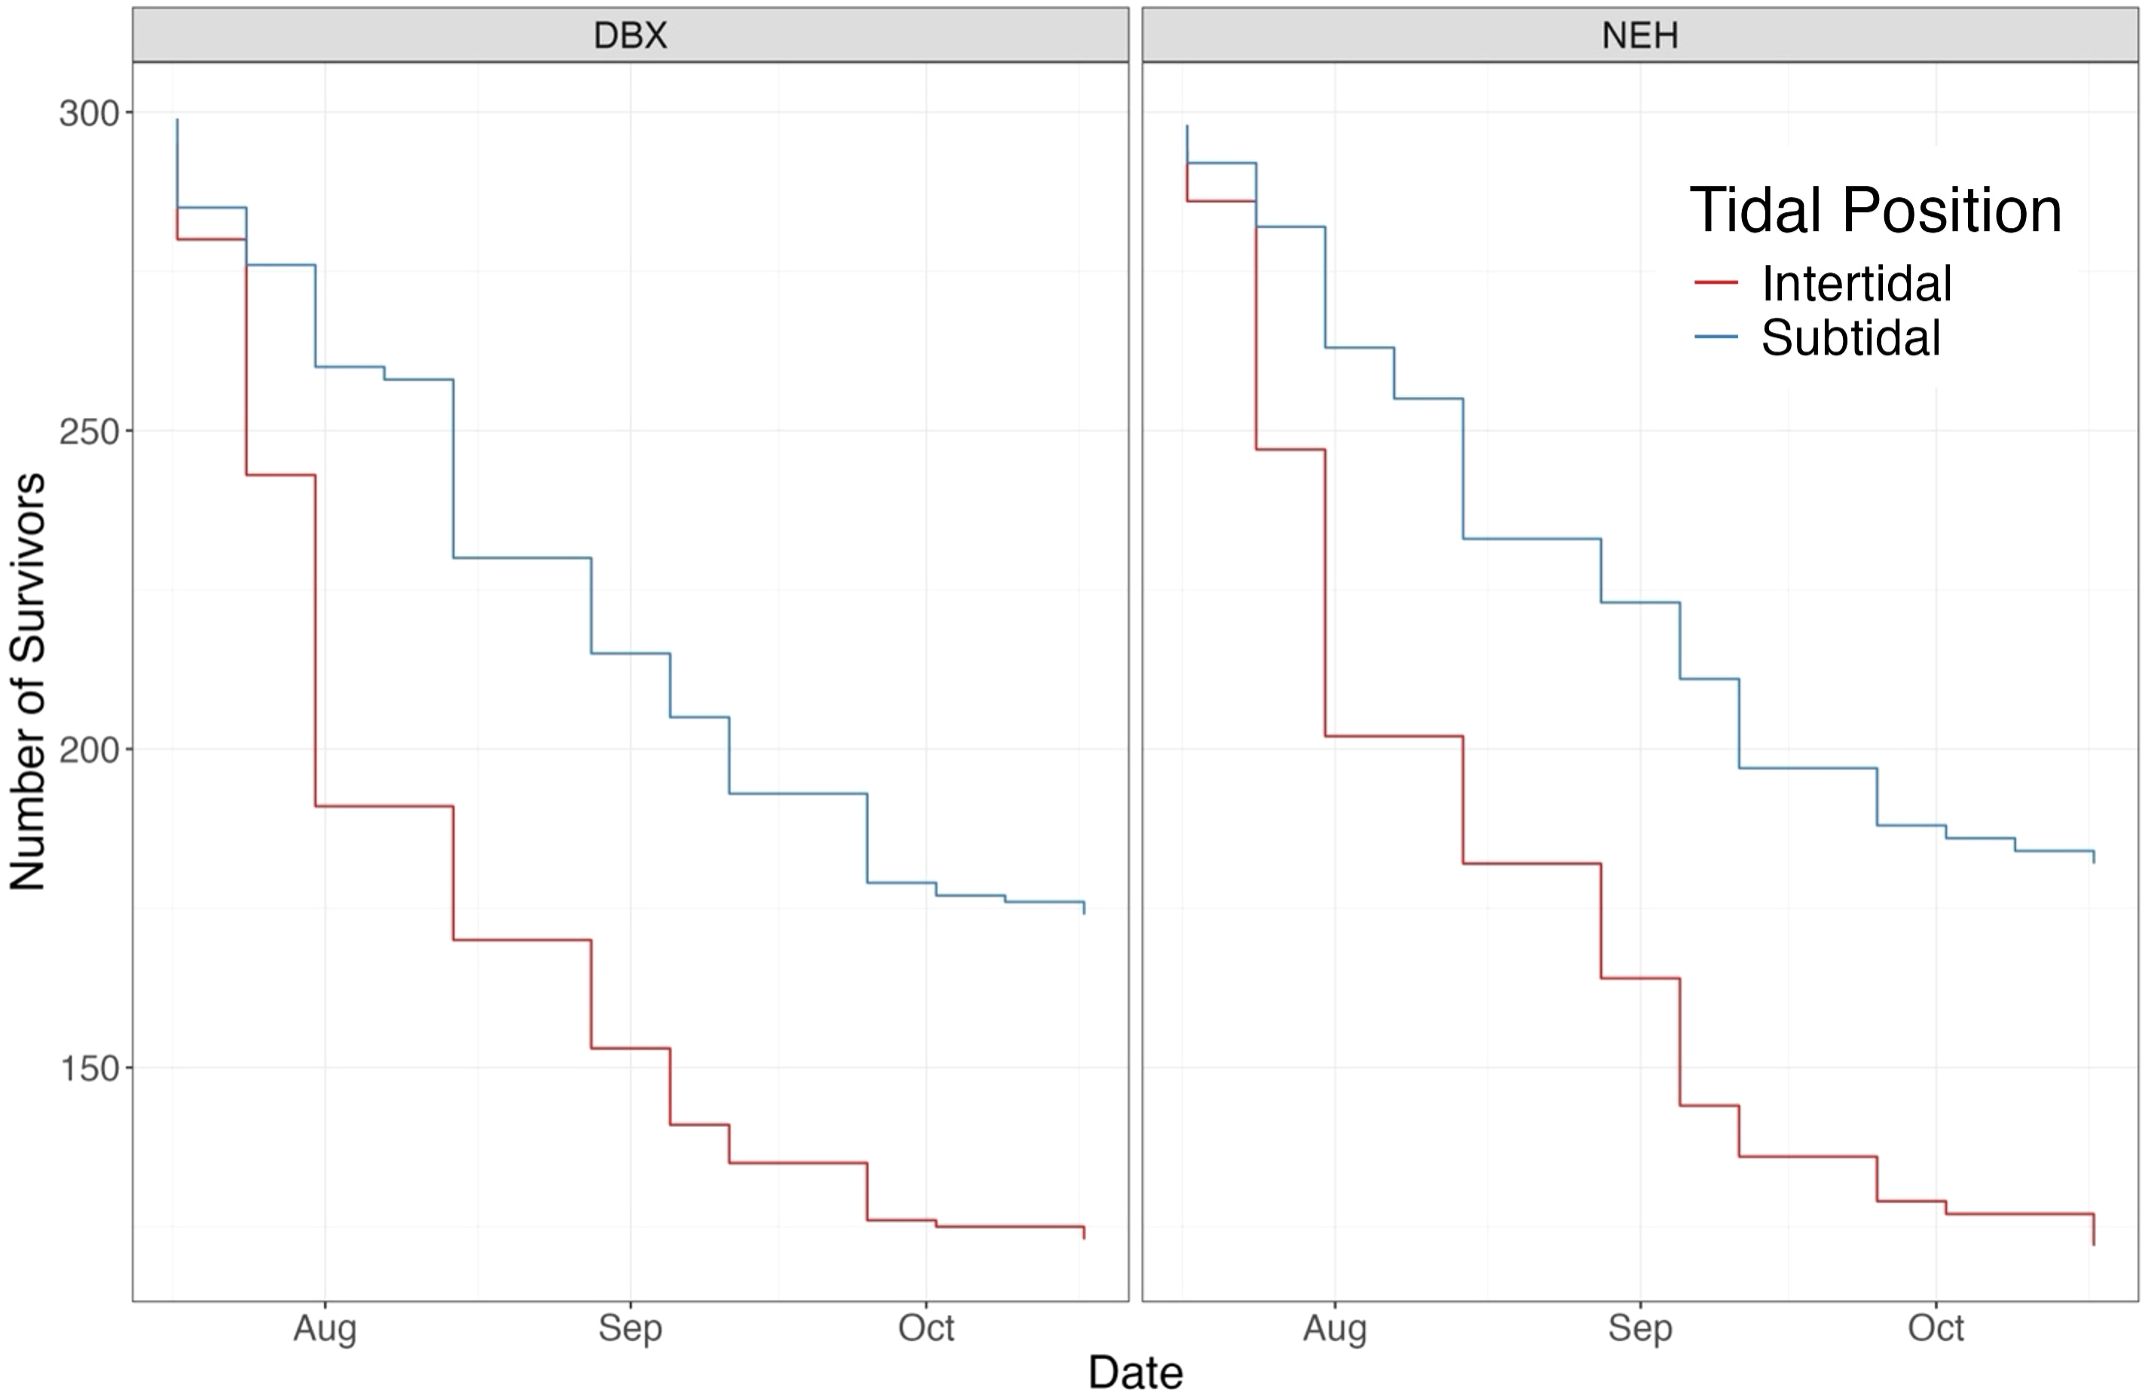
Figure 5. Oyster survivorship curve across strain and tidal position. Trends in survivorship suggest that subtidal oysters had more survivors than intertidal oysters.
3.3 Generalized additive models for oyster growth and mortality
Generalized Additive Models (GAMs) for weekly average oyster length were used to assess the effects of environmental covariates, including average temperature, previous week’s minimum dissolved oxygen, tidal position, and strain. Multicollinearity was checked using VIF analysis prior to model fitting, and covariates with a VIF above five were excluded. The best fit was the Gaussian family distribution according to AICc scoring (AICc = 311.18). Further model selection was finalized through automated model selection (Table 1) and k-fold cross-validation, which identified the model with the lowest mean RMSE. The best GAM for weekly average oyster length accounted for 89.4% of the deviance in oyster length (adjusted R-squared = 0.87). We found significant smooth terms for average temperature (effective degrees of freedom (edf) = 2.67, p< 0.001) and previous week’s minimum dissolved oxygen (edf = 3.52, p< 0.001), both of which had a non-linear, positive association with oyster length (Figure 6). The temperature smoothing plot shows that higher temperatures result in decreased oyster length (>~20 °C), indicating optimal growth within a specific temperature range (~10-20 °C). The model showed significant effects of tidal position (p< 0.001), with subtidal oyster’s having significantly different mean length than intertidal oysters. Strain had a small, yet significant effect on average shell length growth (p = 0.02), with NEH® oysters exhibiting significantly greater average length than DBX oysters. The GAM diagnostics revealed a well-fitting model, with full convergence after 10 iterations and a positive definite Hessian. The k-index was verified for the smoothing terms, indicating adequate basis dimensions for both temperature and dissolved oxygen (p< 0.001).
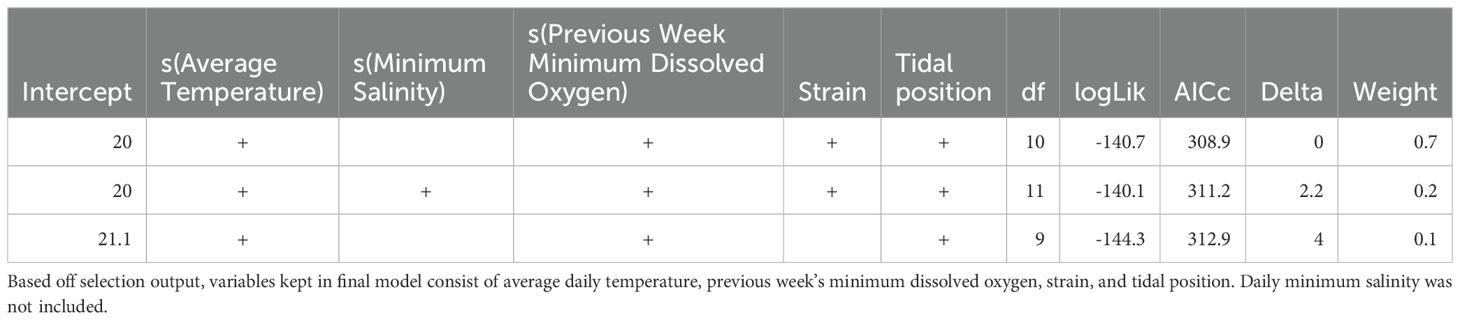
Table 1. Generalized additive model selection table for average oyster length response variable.
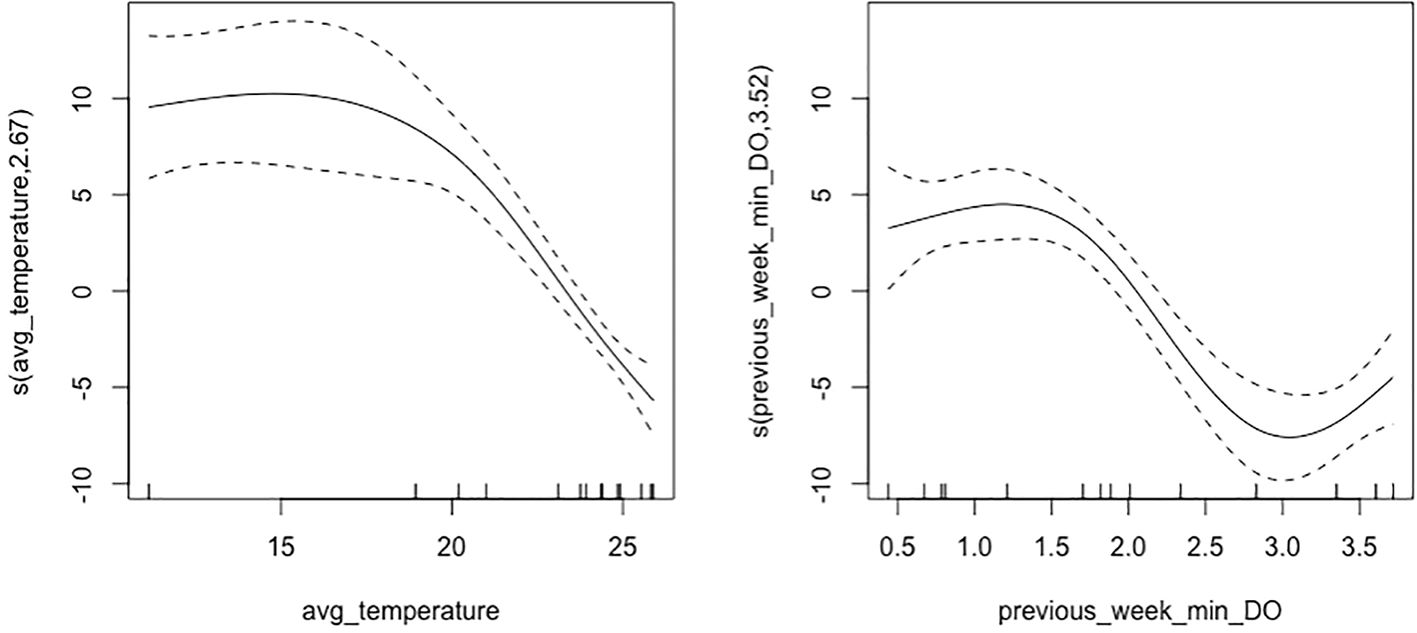
Figure 6. Plots of model smoothing terms for average temperature and minimum dissolved oxygen average oyster length. The temperature smooth term indicates the partial effect of daily average temperature on average oyster length, while the previous weekly minimum dissolved oxygen smooth term demonstrates the partial effect on average oyster length. The temperature smoothing plot shows that higher temperatures have a decreasing effect on oyster length, indicating optimal growth within a specific temperature range less than 20°C, while optimal growth of oysters occurred at periods when the weekly minimum dissolved oxygen was less than 2.0 mg/L.
The GAM for weekly oyster mortality was applied to investigate the effects of minimum salinity, average salinity, minimum dissolved oxygen, and tidal position on oyster mortality. Multicollinearity was checked with VIF analysis prior to model fitting, and covariates with a VIF above five were excluded. The best fitting model used the negative binomial family with a log link function, accounting for the over-dispersed nature of the count data (though AICc comparison favored Poisson distribution). In this model, we applied the same automated model selection (Table 2) and cross-validation strategies. The best GAM accounted for 81.7% of deviance in weekly oyster mortality (adjusted R-squared = 0.72). Minimum salinity (edf = 2.9, p< 0.001) and minimum dissolved oxygen (edf = 2.77, p< 0.001) had significant smooth terms. This indicated lower salinity and dissolved oxygen levels were coupled with higher mortality counts, and the relationship between these environmental factors and mortality was non-linear. The minimum salinity (Figure 7) plot displays that mortality increased with decreasing salinities, while the minimum dissolved oxygen plot shows that lower mortality was observed as dissolved oxygen increased. Average salinity (edf = 1, p = 0.32) was incorporated in the final model but was not statistically significant. The relationship between average salinity and mortality was somewhat flat, implying that changes in mean salinity had less impact on weekly mortality relative to minimum salinity. Tidal position was significant (p = 0.01), with subtidal oysters exhibiting significantly lower weekly mortality than intertidal oysters. K-index values for smooth terms were within reasonable bounds (min salinity: p = 0.03, average salinity: p = 0.01, minimum dissolved oxygen: p = 0.09), suggesting that the basis functions were correctly specified. The GAM diagnostics revealed full convergence after 10 iterations and a positive definite Hessian, signifying a stable solution.
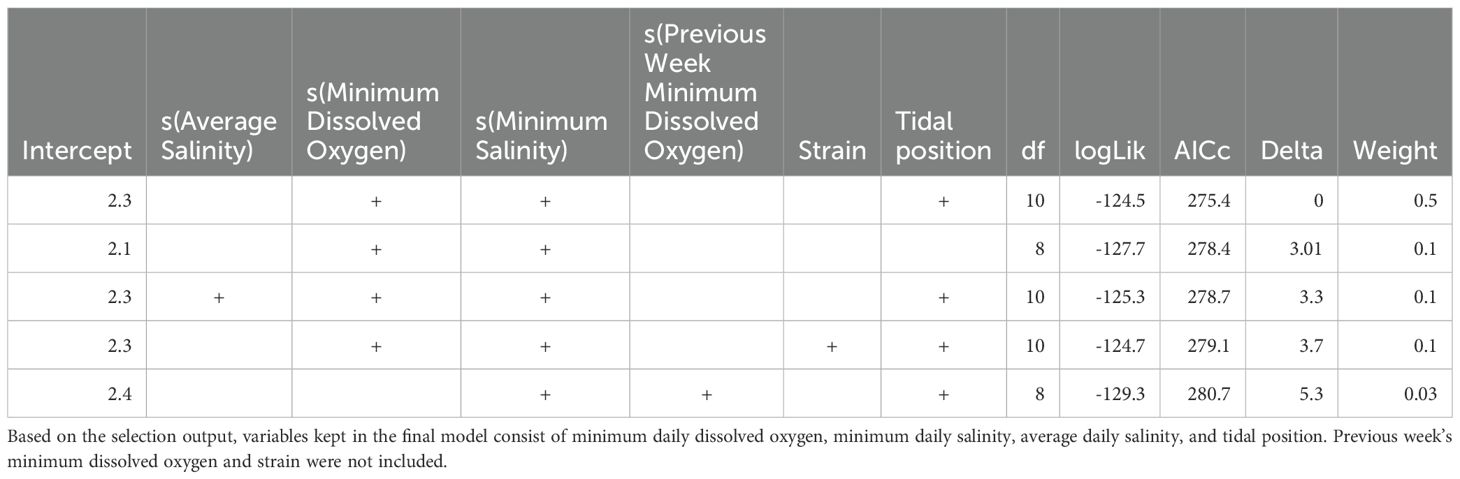
Table 2. Generalized additive model selection table for weekly oyster mortality response variable.
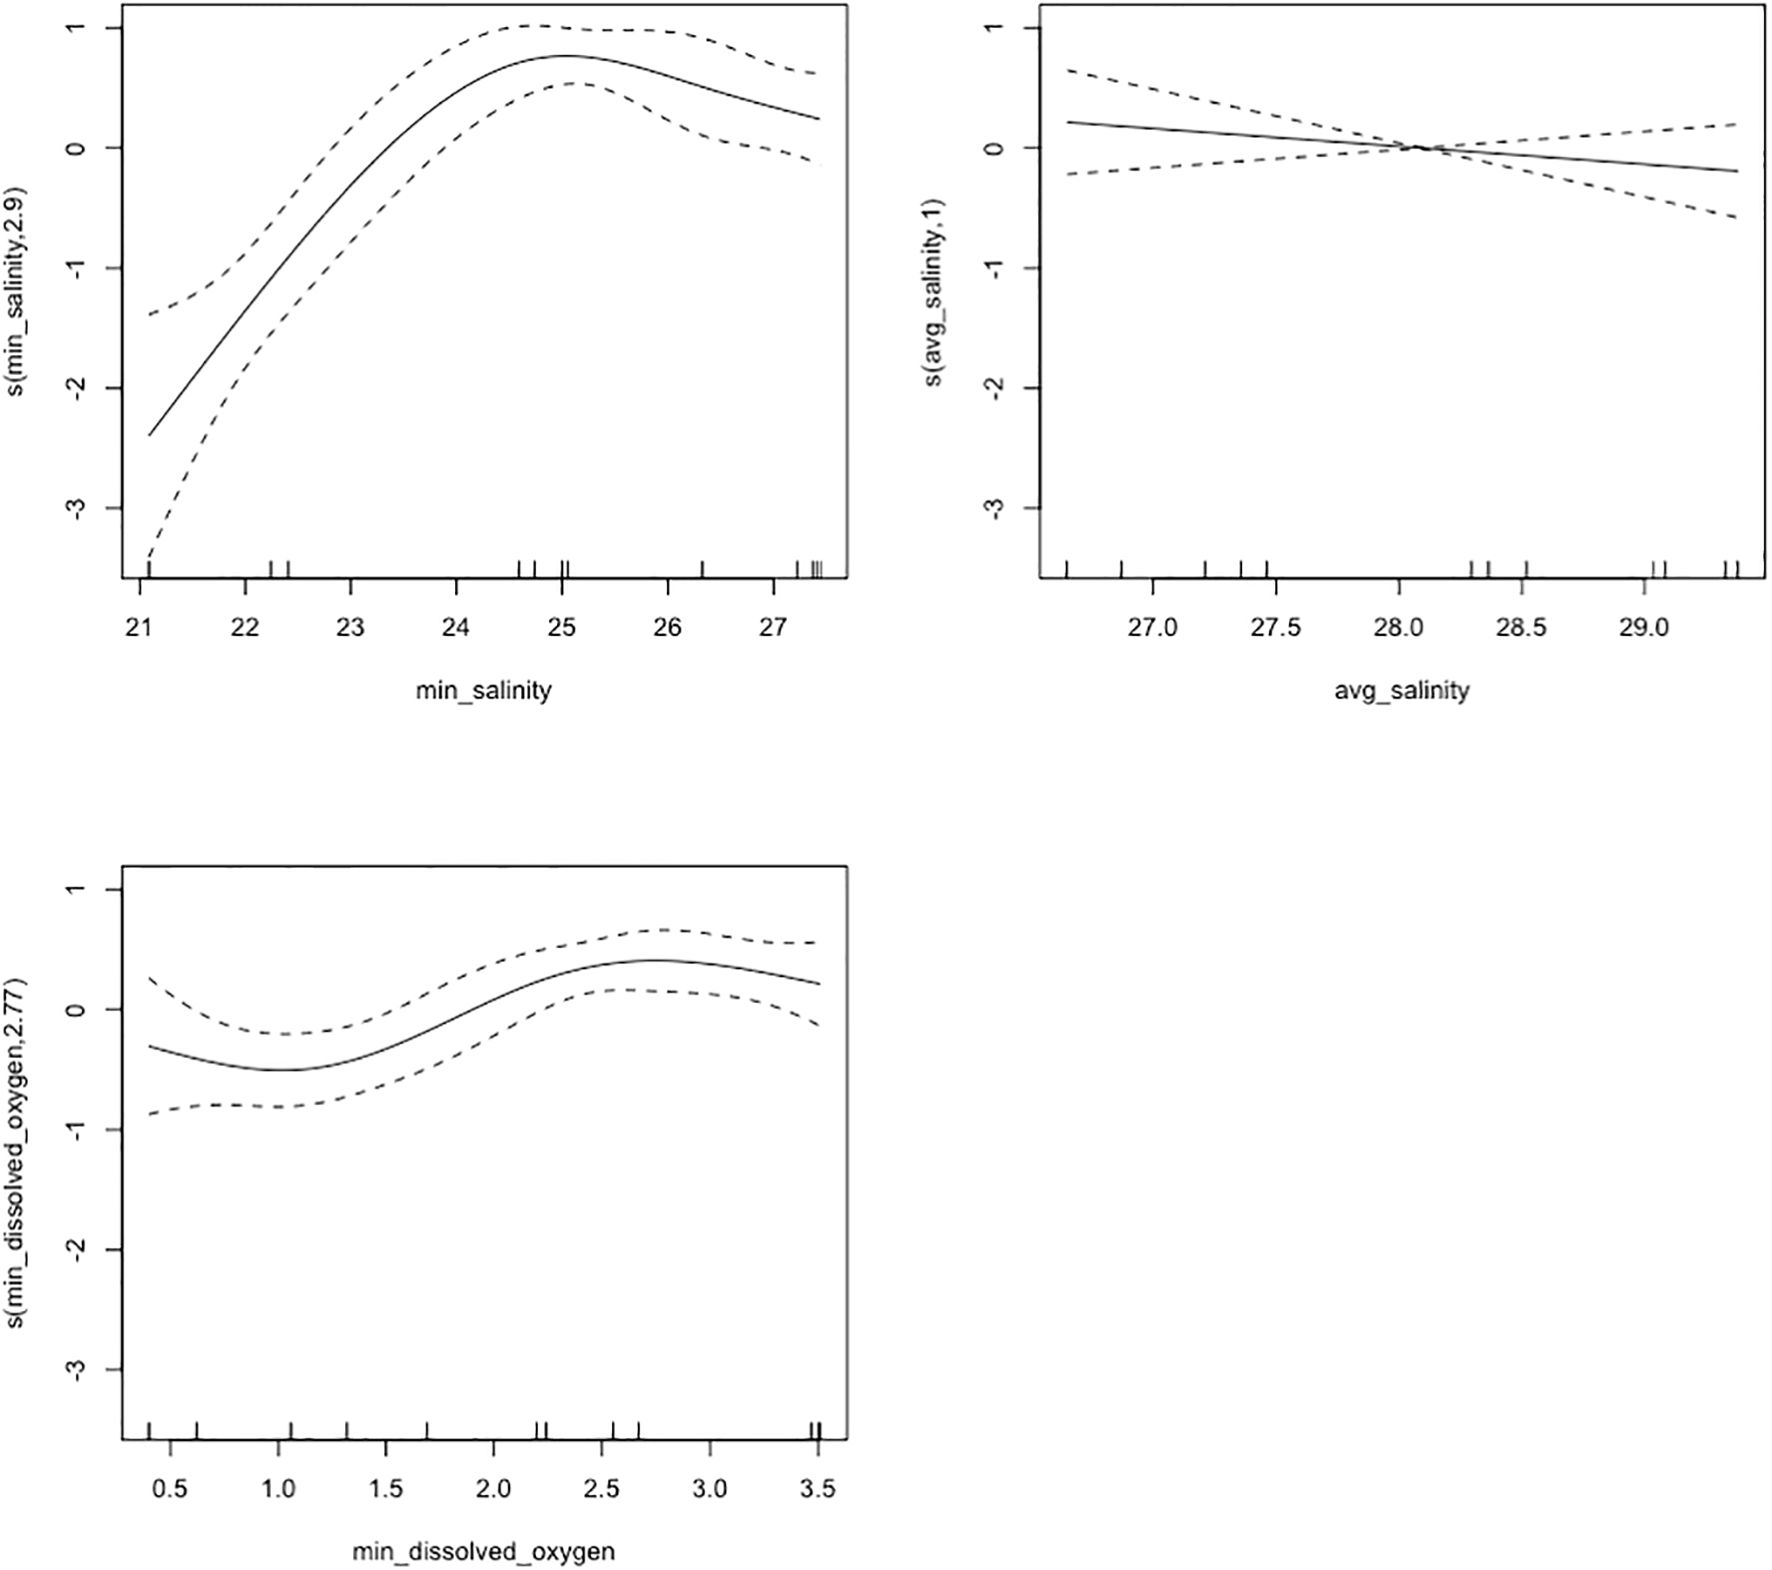
Figure 7. Plots of model smoothing terms for minimum salinity, average salinity, and minimum dissolved oxygen on average oyster mortality. The salinity smooth terms indicate the partial effect of daily minimum salinity and daily average salinity, respectively, on weekly oyster mortality. The dissolved oxygen smooth term shows the partial effect of daily minimum dissolved oxygen on weekly oyster mortality. The daily minimum salinity plot displays that mortality increased with decreasing salinities, while the daily minimum dissolved oxygen plot shows that lower mortality was observed as dissolved oxygen increased. Daily average salinity (edf = 1, p = 0.32) was incorporated in the final model but was not statistically significant.
4 Discussion
This study evaluated the growth, condition index, and mortality of DBX and NEH® farmed oyster strains across different tidal positions (intertidal vs. subtidal) within the lower Delaware Bay. NEH® and DBX exhibit both MSX and Dermo disease resistance, as well as enhanced growth and shell characteristics compared to wild eastern oysters. NEH® strain, derived from Long Island Sound oysters, thrives in high salinity (20–34 ppt) environments, while DBX, derived from Delaware Bay oysters, is suited to medium and low salinity (18–23 ppt) environments (Rutgers University, n.d.). NEH® oysters exhibited significantly higher condition index values than DBX oysters, with a modest trend of greater growth in NEH® oysters (Figure 2), although this difference was not statistically significant in univariate tests. NEH® oysters also demonstrated increased performance, particularly in subtidal environments where covariate values were within the optimal range for this strain. Tidal position was also an important driver in our study, where subtidal oysters performed better than intertidal oysters, especially in survivability. The higher performance of subtidal oysters may be due to a more stable environment, where the oysters are less exposed to environmental extremes compared to the intertidal treatment group that experiences wider temperature and dissolved oxygen fluctuations associated with episodic tidal desiccation (Heo et al., 2023; Masanja et al., 2023). Oyster growth and survival were significantly affected by environmental covariates, specifically temperature, dissolved oxygen, and salinity. Our results are consistent with other studies that found salinity and dissolved oxygen to be key determinants of oyster survival (Galtsoff, 1964; Shumway, 1996; Jeppesen et al., 2016; Lowe et al., 2017; Sehlinger, 2018; Davis et al., 2024). Additionally, our finding that temperature impacts growth also confirms previous findings which demonstrate that although growth increases with higher temperatures, extreme heat can adversely affect oyster survival (Galtsoff, 1964; Shumway, 1996; Lowe et al., 2017; Sehlinger, 2018). Our results underscore the importance of strain selection, tidal location, and environmental conditions in ensuring optimal oyster performance in living shoreline and habitat restoration projects. Further research would be useful to provide more definitive recommendations for the use of specific oyster strains across salinity regimes and other environmental gradients.
Contrary to other studies (Manzi et al., 1977; Bartol et al., 1999; Moroney and Walker, 1999; Bishop and Peterson, 2005), we found that subtidal oysters consistently performed better than intertidal oysters, likely due to the protection from daily air exposure and atmospheric temperature extremes experienced in the summer months (Clements et al., 2018; Heo et al., 2023), as well as high sensitivity of juvenile oysters within the intertidal zone (Overton et al., 2023). Research has demonstrated that subtidal habitats generally offer better conditions for oysters, being less likely to experience air exposure and experiencing more stable temperature and salinity regimes (Lowe et al., 2017; Sehlinger, 2018), which may translate to increased survival and growth of subtidal oysters. Minimum salinity and dissolved oxygen were key environmental factors associated with mortality in our study, consistent with prior work in estuarine systems (Jeppesen et al., 2016; Rybovich et al., 2016). The differences observed in our study in the growth of DBX and NEH® oysters are largely underexplored in other literature. However, previous studies have looked at other selectively bred oyster lines (Leggett, 1999). Our results suggest that NEH® oysters, which are adapted for high-salinity environments, could be appropriate candidates for restoration in similar conditions, though further testing across broader spatial and temporal scales would be beneficial. Our study also adds new information with respect to the impact of tidal position on oyster performance. Although the impact of tidal position has been described in the literature (Manzi et al., 1977; Bartol et al., 1999; Moroney and Walker, 1999; Bishop and Peterson, 2005), our study provides a better understanding of how strain and tidal position interact to impact oyster growth and mortality. The performance of DBX and NEH® oysters in different tidal positions provides insight into how restoration strategies may be optimized based on such factors. Additional research across seasons would be valuable in determining if such interactions occur over longer time frames than a single growing season. Unfortunately, overwintering can limit studies that extend into the winter months, as interannual overwintering mortality can be high (>35%) in farmed oysters depending upon region and year (Mayrand et al., 2017).
These findings can be used to inform strategies for oyster-based ecological restoration, aquaculture, and living shoreline development in estuarine habitats. NEH® oysters exhibited increased condition indices and may be suitable for candidates for restoration in higher salinity environments. While their disease resistance and growth patterns suggest potential advantages, broader validation across multiple sites and seasons would be needed to confirm long-term performance. Incorporating selectively bred strains into living shoreline efforts could enhance establishment success, particularly in areas subject to disease pressure. Our study emphasizes the need to match oyster strains to the environmental conditions of the restoration site, specifically salinity. By selecting the right strain to match salinity preferences, restoration practitioners can increase oyster survival and growth, thereby ensuring long-term success in sustainable oyster reefs. In addition, our findings suggest that the subtidal zone appears to provide unique benefits to oyster performance. In this study subtidal oysters exhibited consistently higher survival than intertidal oysters, which may reflect greater protection from thermal and dissolved oxygen extremes during submersion. These submerged environments may offer oysters the stability needed to grow. Further, by establishing a subtidal oyster reef, there is a likelihood that subtidal reefs will continue to develop into intertidal regions as the reef expands and recruitment occurs. Since oyster reefs are dynamic structures, this allows them to provide a variety of ecosystem services that aren’t exclusive to the subtidal zone. Therefore, as the installation changes over time, these structures can contribute ecosystem services to the intertidal zone, such as sediment accretion (Salvador de Paiva et al., 2018) and wave attenuation (Wiberg et al., 2018), while simultaneously providing subtidal habitats. Overall, these results offer important new insights into the various physical and environmental factors that can shape oyster performance, along with support for the development of tailored restoration strategies that take these factors into account. It is also important to consider the oyster size range that was tested, as it represents a very sensitive portion of the oyster life cycle (≤ 25 mm). Therefore, identifying the strains and conditions that favor the survival of these individuals up to 25 mm, represents the critical point in reef development (Powell et al., 1994). If it is possible to efficiently transition oysters out of that size range, where they are more protected against predation, disease, and environmental changes, the restoration process will have a greater chance of success. A promising area of growth in living shoreline restoration is the idea of pre-seeding these installations with the appropriate strain of oyster to match the environmental conditions of the installation site. Instead of relying on natural oyster recruitment to populate the site, pre-seeding the installation with selectively bred strains (i.e., NEH®) would potentially allow for oyster establishment within a shellfish-based living shoreline in a shorter period (USACE Baltimore and Norfolk Districts, 2012). By introducing more oysters to the restoration area from the start, this approach may enhance habitat provisioning and coastal protection benefits. The benefits of this strategy are particularly applicable to sites where natural recruitment is limited or sporadic. Further exploration of water quality variables, tidal position, and strain selection will help improve the restoration process and maximize the effectiveness of shellfish-based living shorelines.
Although the data and models presented here yield insights into the complex relationships between environmental factors, oyster strain, and tidal position, a number of assumptions and limitations should be noted. Oyster growth and mortality data were collected at weekly intervals, so measurements were weekly averages and totals. This sampling frequency could have missed finer timescales of variations in oyster performance that may be significant. One important design limitation is that tidal position was spatially confounded with rack identity. Racks were installed in fixed locations at the start of the study, which means we could not statistically distinguish the effect of tidal exposure from potential site-level variation among individual rack locations. However, all racks were placed at consistent depths for their respective tidal positions, spaced approximately 50 meters within a semi-enclosed basin, minimizing expected environmental heterogeneity across replicates. Comparable spatial designs have been used in other estuarine oyster studies with limited microhabitat variation exhibited between gear sites (Campbell et al., 2025). The environmental data were recorded every 30 minutes across the whole study period, but these data have been post-processed and filtered into two different time scales: daily values and weekly values. For daily values, the data were filtered to include only the 24-hour period prior to each oyster sampling event. For weekly values, data were all the environmental observations for the week before the oyster sampling event of the current week. We made this choice based on the assumption that environmental conditions in the days preceding the sampling event would be the most influential to oyster growth and mortality. This filtering approach is fairly reasonable but does not account for any integrated effects of longer-term environmental exposure. Additionally, the use of three replicate racks per tidal treatment limits the degree of statistical inference that can be drawn, particularly when exploring environmental interactions using GAMs. While model performance was cross-validated and overfitting was addressed through covariate screening and AICc-based selection, we acknowledge that the small number of spatial replicates may constrain the generalizability of some findings. However, this replication strategy aligns with recent experimental designs employed in comparable field-based oyster studies (e.g., Campbell and Gray, 2024), particularly when logistical and spatial constraints exist in estuarine settings. The duration of this study was relatively short in the context of oyster performance metrics (4 months), thus only allowing us to observe oyster performance across a limited seasonal range of environmental conditions. The environmental variables included can vary greatly during the winter months, potentially influencing oyster metabolism, growth, and mortality (Mayrand et al., 2017). A longer-term study would provide more insight into how seasonal changes impact oyster performance, particularly concerning temperature extremes and variability in salinity. However, oyster farmers frequently adjust oyster gear before the late fall and winter months to avoid extreme weather events and increased oyster mortality (Morse, 2006). The study site reflects a distinct environment within Delaware Bay. Additional sites with different environmental conditions would help assess the generalizability of these findings. The Generalized Additive Models (GAMs) applied in this analysis assume that the relationships between environmental drivers (salinity, temperature, dissolved oxygen) and oyster performance (weekly average length and weekly mortality) are smooth and non-linear; and that the data are independent and identically distributed. Though the GAMs provide useful information on how environmental factors affect oyster performance, there may be other limiting factors not considered in the models, including predation, oyster behavior, or habitat interactions. Furthermore, although the GAMs incorporated repeated weekly averages as independent observations to improve temporal resolution, this approach may introduce some degree of pseudoreplication and potentially inflate significance levels in the GAM outputs. The resulting strain effect detected in the growth GAM, not seen in the univariate test, may reflect the influence of environmental covariates and increased statistical power, but should be interpreted cautiously. Despite these limitations, we were able to demonstrate the potential for future research utilizing GAMs to investigate the interactions among environmental variables influencing oyster performance, aiding in a series of recommendations to improve living shoreline designs and restoration efforts in estuarine environments.
Though this study provides insight into selectively bred oyster performance across different tidal positions and environmental conditions, several areas of future investigation would be useful for further consideration. First, the seasonal variability in environmental conditions, particularly temperature, salinity, and dissolved oxygen, has been identified as a potential factor influencing oyster performance (NOAA Fisheries EOBRT, 2007). Future studies should extend monitoring to include more seasons (i.e., winter and spring months). Including a full annual cycle would help researchers understand how oysters respond to seasonal changes in their environmental conditions, particularly in growth and mortality. However, issues of overwintering mortality, particularly for intertidal installations, would need to be considered (Mayrand et al., 2017). Studies in additional estuaries or coastal systems could elucidate more generalized effects of salinity and temperature on strain performance and tidal position within estuaries. This information would be particularly applicable for restoration, aquaculture, or living shorelines, as their success is often dictated by site-specific characteristics. Other future research directions should attempt to integrate additional environmental covariates that can affect oyster health (e.g., sediment type, turbidity, and pH). For example, oysters in areas with high sediment loads or elevated turbidity may face feeding and survival challenges (Barillé et al., 1997; La Peyre et al., 2020). Another potential avenue for future research would be to compare other selectively bred strains of oyster like the Virginia Institute of Marine Science (VIMS) DEBYs, LOLAs, or HNRYs, as these strains are characterized by genetic differences that allow them to thrive in different salinity regimes (Proestou et al., 2016). Despite these associated limitations, our study provides essential information regarding the importance of strain and tidal placement on oyster performance. A coupled approach to living shoreline designs featuring subtidal and intertidal oyster reef components, though underexplored, could be used as a prescriptive measure to enhance living shoreline resilience. Some shellfish-based living shoreline designs allude to the fact that subtidal installations can result in the mitigation of shoreline retreat (Scyphers et al., 2011). However, intertidal reefs have been found to reduce wave height buffering shoreline erosion during storm events (Morris et al., 2021). The discrepancy between the functional differences of the two zones emphasizes the tradeoff between greater survival and suitable habitat of the subtidal zone compared to increased wave attenuation of the intertidal zone (Salatin et al., 2022). However, these elements should be considered synergistically to maximize the likelihood of shoreline resilience.
5 Conclusion
Selectively bred oysters can help increase the success of oyster-based restoration and living shorelines. Our results suggest that NEH® oysters, selected for disease resistance and improved growth, perform better in the conditions of the lower Delaware Bay than DBX oysters, emphasizing the importance of strain selection based on associated environmental conditions. Furthermore, subtidal areas appeared to provide more optimal conditions for oyster growth and survival, suggesting their potential value for initiating reef formation in restoration efforts. However, these findings should be interpreted in the context of the study’s limitations, including a short duration, single-site design, limited spatial replication, and potential lack of independence in weekly measurements. Despite these limitations, our results highlight the importance of tailoring oyster restoration strategies that consider environmental factors and genetic strain. More studies are needed to further optimize these approaches and explore interactions between oyster strains, tidal position, and environmental variables to increase the success and resilience of living shorelines in a changing climate.
Data availability statement
The raw data supporting the conclusions of this article will be made available by the authors, without undue reservation.
Ethics statement
The manuscript presents research on animals that do not require ethical approval for their study.
Author contributions
RH: Data curation, Formal Analysis, Investigation, Visualization, Writing – original draft, Writing – review & editing. BC: Investigation, Methodology, Supervision, Writing – review & editing. NM: Investigation, Writing – review & editing. AC: Writing – review & editing. EH: Conceptualization, Funding acquisition, Investigation, Methodology, Project administration, Resources, Supervision, Writing – review & editing.
Funding
The author(s) declare that financial support was received for the research and/or publication of this article. The project was supported by funding through the Department of Defense, ‘DEEDS’ project (#W912HZ-22-2-0015). Any opinions, findings, conclusions, or recommendations expressed in this material are those of the author(s) and do not necessarily reflect the views of the US Army Corps of Engineers, ERDC Contracting Office.
Acknowledgments
We would like to acknowledge the Department of Defense for supporting this project. We would also like to acknowledge the members of our laboratory and folks who volunteered their time and expertise in the field, including Jasper McCutcheon, Rachel Roday, Alyssa Campbell, Dan Millea, Trinity Clifford, Anthony O’Toole, and Randy Feris.
Conflict of interest
The authors declare that the research was conducted in the absence of any commercial or financial relationships that could be construed as a potential conflict of interest.
Generative AI statement
The author(s) declare that no Generative AI was used in the creation of this manuscript.
Publisher’s note
All claims expressed in this article are solely those of the authors and do not necessarily represent those of their affiliated organizations, or those of the publisher, the editors and the reviewers. Any product that may be evaluated in this article, or claim that may be made by its manufacturer, is not guaranteed or endorsed by the publisher.
References
Aristizábal M. and Chant R. (2013). A numerical study of salt fluxes in Delaware Bay Estuary. J. Phys. Oceanography 43, 1572–1588. doi: 10.1175/jpo-d-12-0124.1
Aristizábal M. F. and Chant R. J. (2015). An observational study of salt fluxes in Delaware Bay. J. Geophysical Research: Oceans 120, 2751–2768. doi: 10.1002/2014jc010680
Barr J. M., Munroe D., Rose J. M., Calvo L., Cheng K. M., Bayer S., et al. (2023). Seasonal feeding behavior of aquaculture eastern oysters (Crassostrea virginica) in the mid-Atlantic. Estuaries Coasts. 47, 789–804. doi: 10.1007/s12237-023-01293-9
Barillé L., Prou J., Héral M., and Razet D. (1997). Effects of high natural Seston concentrations on the feeding, selection, and absorption of the oyster crassostrea gigas (Thunberg). J. Exp. Mar. Biol. Ecol. 212 (2), 149–172. doi: 10.1016/s0022-0981(96)02756-6
Bartol I. K., Mann R., and Luckenbach M. (1999). Growth and mortality of oysters (Crassostrea virginica) on constructed intertidal reefs: Effects of tidal height and substrate level. J. Exp. Mar. Biol. Ecol. 237, 157–184. doi: 10.1016/s0022-0981(98)00175-0
Bersoza Hernández A., Brumbaugh R. D., Frederick P., Grizzle R., Luckenbach M. W., Peterson C. H., et al. (2018). Restoring the eastern oyster: How much progress has been made in 53 years? Front. Ecol. Environ. 16, 463–471. doi: 10.1002/fee.1935
Beseres Pollack J., Cleveland A., Palmer T. A., Reisinger A. S., and Montagna P. A. (2012). A restoration suitability index model for the Eastern Oyster (crassostrea virginica) in the mission-aransas estuary, TX, USA. PloS One 7. doi: 10.1371/journal.pone.0040839
Bishop M. J. and Peterson C. H. (2005). Direct effects of physical stress can be counteracted by indirect benefits: Oyster Growth on a tidal elevation gradient. Oecologia 147, 426–433. doi: 10.1007/s00442-005-0273-3
Botta R., Asche F., Borsum J. S., and Camp E. V. (2020). A review of global oyster aquaculture production and consumption. Mar. Policy 117, 103952. doi: 10.1016/j.marpol.2020.103952
Burnham K. P. and Anderson D. R. (2002). Model selection and multimodel inference: a practical information-theoretic approach. 2nd Edition. (New York: Springer-Verlag). doi: 10.1007/b97636
Calabrese A. and Davis H. C. (1970). Tolerances and requirements of embryos and larvae of bivalve molluscs. Helgo. Wissen. Meersunters. 20, 553–564. doi: 10.1007/BF01609928
Campbell B. and Gray M. W. (2024). Evaluating the influence of cage motion on the growth and shell characteristics of oysters (Crassostrea virginica) among several gear types. Aquaculture 579, 740223. doi: 10.1016/j.aquaculture.2023.740223
Campbell B., Gurbisz C., Testa J. M., Hale E., and Gray M. W. (2025). Assessing the spatial variability of cage movement and velocity attenuation of an off-bottom oyster farm and its influence on eastern oyster (crassostrea virginica) growth performance. Aquaculture 595, 741701. doi: 10.1016/j.aquaculture.2024.741701
Canzonier W. J. (2004). Delaware Bay Oyster Culture – past, present and potential future - state (NJ Aquaculture Association). Available online at: https://www.state.nj.us/seafood/DelawareBayOysters.pdf (Accessed November 2024).
Carlsson J., Morrison C. L., and Reece K. S. (2006). Wild and aquaculture populations of the eastern oyster compared using microsatellites. J. Heredity 97, 595–598. doi: 10.1093/jhered/esl034
Casas S. M., Comba D., La Peyre M. K., Rikard S., and La Peyre J. F. (2024). Rates of osmoconformation in triploid eastern oysters, and comparison to their diploid half-siblings. Aquaculture 580, 740326. doi: 10.1016/j.aquaculture.2023.740326
Clements J. C., Davidson J. D. P., McQuillan J. G., and Comeau L. A. (2018). Increased mortality of harvested eastern oysters (Crassostrea virginica) is associated with air exposure and temperature during a spring fishery in Atlantic Canada. Fisheries Res. 206, 27–34. doi: 10.1016/j.fishres.2018.04.022
Clyde L. M. Jr. (2007). Causes underlying the historical decline in eastern oyster (Crassostrea virginica Gmelin 1791) landings. J. Shellfish Res. 26, 927–938. doi: 10.2983/0730-8000(2007)26[927:CUTHDI]2.0.CO;2
Coen L. D., Luckenbach M. W., and Breitburg D. L. (1999). The role of oyster reefs as essential fish habitat: a review of current knowledge and some new perspectives. Amer. Fish. Soc Sym. 22, 438–454.
Davis A. M., McFarland K., Plough L. V., and Paynter K. T. (2024). Predicting the effects of hypoxia on Oyster (Crassostrea virginica) growth and reproduction through the Dynamic Energy Budget Model. Ecol. Model. 495, 110799. doi: 10.1016/j.ecolmodel.2024.110799
Erbland P. J. and Ozbay G. (2008). A comparison of the macrofaunal communities inhabiting a Crassostrea virginica oyster reef and oyster aquaculture gear in Indian River Bay, Delaware. J. Shellfish Res. 27, 757–768. doi: 10.2983/0730-8000(2008)27[757:ACOTMC]2.0.CO;2
Frank-Lawale A., Allen S. K., and Dégremont L. (2014). Breeding and domestication of eastern oyster (crassostrea virginica) lines for culture in the Mid-Atlantic, USA: Line development and mass selection for disease resistance. J. Shellfish Res. 33, 153–165. doi: 10.2983/035.033.0115
Friedman C. S., Reece K. S., Wippel B. J. T., Agnew M. V., Dégremont L., Dhar A. K., et al. (2020). Unraveling concordant and varying responses of oyster species to Ostreid herpesvirus 1 variants. Sci. Total Environ. 739, 139752. doi: 10.1016/j.scitotenv.2020.139752
Grabowski J. H., Brumbaugh R. D., Conrad R. F., Keeler A. G., Opaluch J. J., Peterson C. H., et al. (2012). Economic valuation of ecosystem services provided by Oyster Reefs. BioScience 62, 900–909. doi: 10.1525/bio.2012.62.10.10
Hall G. F., Hill D. F., Horton B. P., Engelhart S. E., and Peltier W. R. (2013). A high-resolution study of Tides in the Delaware Bay: Past conditions and future scenarios. Geophysical Res. Lett. 40, 338–342. doi: 10.1029/2012gl054675
Heo J.-M., Kim S.-S., Kim D.-Y., Lee S. W., Lee J. S., Kang M. H., et al. (2023). Impact of exposure temperature rise on mass mortality of tidal flat Pacific Oysters. Front. Mar. Sci. 10. doi: 10.3389/fmars.2023.1275521
Hoellein T. J., Zarnoch C. B., and Grizzle R. E. (2014). Eastern Oyster (Crassostrea virginica) filtration, biodeposition, and sediment nitrogen cycling at two oyster reefs with contrasting water quality in Great Bay Estuary (New Hampshire, USA). Biogeochemistry 122, 113–129. doi: 10.1007/s10533-014-0034-7
Hofstetter R. P. (1977). “Trends in population levels of the American oyster, Crassostrea virginica Gmelin on public reefs in Galveston Bay, Texas,” in Technical Series Number 10 (Texas Parks and Wildlife Department, Coastal Fisheries Branch, Austin, TX), 90.
Hossain M. S., Rothuis A., Chowdhury S. R., Smaal A., Ysebaert T., Sharifuzzaman S. M., et al. (2013). Oyster aquaculture for coastal defense with food production in Bangladesh. Aquaculture Asia. 18, 15–24.
Jeppesen R., Rodriguez M., Rinde J., Haskins J., Hughes B., Mehner L., et al. (2016). Effects of hypoxia on fish survival and oyster growth in a highly eutrophic estuary. Estuaries Coasts 41, 89–98. doi: 10.1007/s12237-016-0169-y
Joesoef A., Huang W.-J., Gao Y., and Cai W.-J. (2015). Air–water fluxes and sources of carbon dioxide in the Delaware estuary: Spatial and seasonal variability. Biogeosciences 12, 6085–6101. doi: 10.5194/bg-12-6085-2015
Kreeger D. A., Gatenby C. M., and Bergstrom P. W. (2018). Restoration Potential of Several Native Species of Bivalve Molluscs for Water Quality Improvement in Mid-Atlantic Watersheds (University of Connecticut, Department of Marine Sciences, 1080 Shennecossett Road, Groton, CT 06340: BioOne Complete). doi: 10.2983/035.037.0524
Kumar G., Hegde S., van Senten J., Engle C., Boldt N., Parker M., et al. (2024). Economic contribution of U.S. Aquaculture farms. J. World Aquaculture Soc. 55. doi: 10.1111/jwas.13091
La Peyre M. K., Bernasconi S. K., Lavaud R., Casas S. M., and La Peyre J. F. (2020). Eastern oyster clearance and respiration rates in response to acute and chronic exposure to suspended sediment loads. J. Sea Res. 157, 101831. doi: 10.1016/j.seares.2019.101831
La Peyre M., Schwarting L., and Miller S. (2013). Preliminary assessment of bioengineered fringing shoreline reefs in Grand Isle and breton sound, Louisiana. Open-File Rep. doi: 10.3133/ofr20131040
Lawrence D. R. and Scott G. I. (1982). The determination and use of condition index of oysters. Estuaries 5, 23–27. doi: 10.2307/1352213
Leggett T. (1999). “Comparative growth rates of four strains of the American oyster using two grow-out methods,” in Fishery Resource Grant FRG 1999 - 23 (Virginia Institute of Marine Science, William & Mary). Available at: https://scholarworks.wm.edu/reports/2212 (Accessed January 2025).
Lowe M. R., Sehlinger T., Soniat T. M., and Peyre M. K. (2017). Interactive effects of water temperature and salinity on growth and mortality of eastern oysters, Crassostrea virginica: A meta-analysis using 40 years of Monitoring Data. J. Shellfish Res. 36, 683–697. doi: 10.2983/035.036.0318
Manzi J. J., Burrell V. G., and Carson W. Z. (1977). A comparison of growth and survival of subtidal crassostrea virginica (Gmelin) in South Carolina Salt Marsh Impoundments. Aquaculture 12, 293–310. doi: 10.1016/0044-8486(77)90208-3
Marenghi F., Ozbay G., Erbland P., and Rossi-Snook K. (2009). A comparison of the habitat value of sub-tidal and floating oyster (Crassostrea virginica) aquaculture gear with a created reef in Delaware’s inland bays, USA. Aquaculture Int. 18, 69–81. doi: 10.1007/s10499-009-9273-3
Martínez-Baena F., Lanham B. S., McLeod I., Taylor M. D., McOrrie S., and Bishop M. J. (2022). De novo reefs: Fish habitat provision by oyster aquaculture varies with farming method. Aquaculture Environ. Interact. 14, 71–84. doi: 10.3354/aei00431
Maryland Oyster Restoration Interagency Workgroup under the Chesapeake Bay Program’s Sustainable Fisheries Goal Implementation Team (2024). (2022) and, (2023) oyster reef monitoring report: analysis of data from the ‘Ten tributaries’ Sanctuary oyster restoration initiative in Maryland.
Masanja F., Yang K., Xu Y., He G., Liu X., Xu X., et al. (2023). Impacts of marine heat extremes on bivalves. Front. Mar. Sci. 10. doi: 10.3389/fmars.2023.1159261
Mathews J. A., Hale E. A., Oleynik H. A., Clark J. H., Park I. A., Greco M. J., et al. (2022). Exploring trends in abundance of young-of-the-year and age-1 Atlantic croaker, black drum, spot, and weakfish in relation to salinity, temperature, and large-scale climatic signals in a mid-Atlantic estuary. Trans. Am. Fisheries Soc. 151, 150–171. doi: 10.1002/tafs.10332
Mayrand E., Comeau L. A., and Mallet A. (2017). Physiological changes during overwintering of the eastern oyster crassostrea virginica (Gmelin 1791). J. Molluscan Stud. 83, 333–339. doi: 10.1093/mollus/eyx017
McCarty A. J., Allen S. K., and Plough L. V. (2021). Genome-wide analysis of acute low salinity tolerance in the eastern oystercrassostrea virginicaand potential of genomic selection for Trait Improvement. G3 Genes|Genomes|Genetics 12. doi: 10.1093/g3journal/jkab368
Moroney D. A. and Walker R. L. (1999). The effects of tidal and bottom placement on the growth, survival and fouling of the eastern oyster crassostrea virginica. J. World Aquaculture Soc. 30, 433–442. doi: 10.1111/j.1749-7345.1999.tb00991.x
Morris R. L., La Peyre M. K., Webb B. M., Marshall D. A., Bilkovic D. M., Cebrian J., et al. (2021). Large-scale variation in wave attenuation of oyster reef living shorelines and the influence of inundation duration. Ecol. Appl. 31. doi: 10.1002/eap.2382
Morse D. (2006). Overwintering Eastern Oysters: Guidance for Small-scale Growers Vol. 7 (Maine Sea Grant Publications). Available online at: https://digitalcommons.library.umaine.edu/seagrant_pub/7 (Accessed January 2025).
Newell R. I., Fisher T. R., Holyoke R. R., and Cornwell J. C. (2005). Influence of eastern oysters on nitrogen and phosphorus regeneration in Chesapeake Bay, USA. NATO Sci. Ser. IV: Earth Environ. Ser. 47, 93–120. doi: 10.1007/1-4020-3030-4_6
Newell R. I. E. and Langdon C. J. (1996). “Mechanisms and physiology of larval and adult feeding,” in The Eastern Oyster Crassostrea virginica. Eds. Kennedy V. S., Newell R. I. E., and Eble A. F. (Maryland Sea Grant College, University of Maryland, College Park, Maryland), 185–229.
NOAA Fisheries (2024). Oyster reef restoration in the Chesapeake Bay: We’re making significant progress (NOAA). Available online at: https://www.fisheries.noaa.gov/chesapeake-bay/oyster-reef-restoration-chesapeake-bay-were-making-significant-progress (Accessed November 2024).
NOAA Fisheries Eastern Oyster Biological Review Team (2007). Status review of the eastern oyster (Crassostera virginica) (NOAA Institutional Repository). Available online at: https://repository.library.noaa.gov/view/noaa/3972 (Accessed November 2024).
Nunn P. D., Klöck C., and Duvat V. (2021). Seawalls as maladaptations along island coasts. Ocean Coast. Manage. 205, 105554. doi: 10.1016/j.ocecoaman.2021.105554
Oleynik H. A., Bizzarro J. J., Hale E. A., and Carlisle A. B. (2024). Environmental drivers of biogeography and community structure in a Mid-Atlantic estuary. Oecologia 204, 543–557. doi: 10.1007/s00442-023-05500-z
Overton K., Dempster T., Swearer S. E., Morris R. L., and Barrett L. T. (2023). Aerial exposure tolerance of juvenile flat oysters (Ostrea angasi) depends on shell length and air temperature. Restor. Ecol. 32. doi: 10.1111/rec.14047
Patterson H. K., Boettcher A., and Carmichael R. H. (2014). Biomarkers of dissolved oxygen stress in oysters: A tool for restoration and management efforts. PloS One 9. doi: 10.1371/journal.pone.0104440
Piazza B. P., Banks P. D., and La Peyre M. K. (2005). The potential for created oyster shell reefs as a sustainable shoreline protection strategy in Louisiana. Restor. Ecol. 13, 499–506. doi: 10.1111/j.1526-100x.2005.00062.x
Powell E. N., Klinck J. M., Hofmann E. E., and Ray S. M. (1994). Modeling oyster populations IV. Rates of mortality, population crashes, and management. Fishery Bull. 92, 347–373.
Proestou D. A., Vinyard B. T., Corbett R. J., Piesz J., Allen S. K., Small J. M., et al. (2016). Performance of selectively-bred lines of eastern oyster, Crassostrea virginica, across eastern US estuaries. Aquaculture 464, 17–27. doi: 10.1016/j.aquaculture.2016.06.012
Rawson P. and Feindel S. (2012). Growth and survival for genetically improved lines of eastern oysters (Crassostrea virginica) and interline hybrids in Maine, USA. Aquaculture 326–329, 61–67. doi: 10.1016/j.aquaculture.2011.11.030
Ray N. E., Li J., Kangas P. C., and Terlizzi D. E. (2015). Water quality upstream and downstream of a commercial oyster aquaculture facility in Chesapeake Bay, USA. Aquacultural Eng. 68, 35–42. doi: 10.1016/j.aquaeng.2015.08.001
R Core Team (2022). R: A language and environment for statistical computing (Vienna, Austria: R Foundation for Statistical Computing). Available online at: https://www.R-project.org/ (Accessed November 2024).
Rusydi I., Meldayani, Rahimi S. A., Wulantari, Aprilia, Rianjuanda D., et al. (2023). The effect of different spat collectors on attachment and growth of oyster spat (crassostrea gigas) in Alue Naga. IOP Conf. Series: Earth Environ. Sci. 1221, 12069. doi: 10.1088/1755-1315/1221/1/012069
Rutgers University. Rutgers Disease Resistant Oysters (Rutgers University Office of Research). Available online at: https://research.rutgers.edu/agricultural-products/oysters/disease-resistant-oysterstab=panel-2 (Accessed January 2025).
Rybovich M., Peyre M. K., Hall S. G., and Peyre J. F. (2016). Increased temperatures combined with lowered salinities differentially impact oyster size class growth and mortality. J. Shellfish Res. 35, 101–113. doi: 10.2983/035.035.0112
Salatin R., Wang H., Chen Q., and Zhu L. (2022). Assessing wave attenuation with rising sea levels for sustainable oyster reef-based living shorelines. Front. Built Environ. 8. doi: 10.3389/fbuil.2022.884849
Salvador de Paiva J. N., Walles B., Ysebaert T., and Bouma T. J. (2018). Understanding the conditionality of ecosystem services: The effect of tidal flat morphology and oyster reef characteristics on sediment stabilization by oyster reefs. Ecol. Eng. 112, 89–95. doi: 10.1016/j.ecoleng.2017.12.020
Sarinsky G., Carroll M. A., Nduka E., and Catapane E. J. (2005). Growth and survival of the American oyster Crassostrea virginica in Jamaica Bay, New York. In Vivo 27, 15–26.
Scyphers S. B., Powers S. P., Heck K. L., and Byron D. (2011). Oyster reefs as natural breakwaters mitigate shoreline loss and facilitate fisheries. PloS One 6. doi: 10.1371/journal.pone.0022396
Sehlinger T. (2018). Analysis of temperature and salinity effects on growth and mortality of oysters (Crassostrea virginica) in Louisiana (University of New Orleans Theses and Dissertations), 2515. Available online at: https://scholarworks.uno.edu/td/2515 (Accessed January 2025).
Shinn J. P., Munroe D. M., and Rose J. M. (2021). A fish’s-eye-view: Accessible tools to document shellfish farms as marine habitat in New Jersey, USA. Aquaculture Environ. Interact. 13, 295–300. doi: 10.3354/aei00407
Shumway S. E. (1996). “Natural environmental factors,” in The Eastern Oyster Crassostrea virginica. Eds. Kennedy V. S., Newell R. I. E., and Eble A. F. (Maryland Sea Grant College, University of Maryland, College Park, Maryland), 467–513.
Shumway S. E., Davis C., Downey R., Karney R., Kraeuter J., Parsons J., et al. (2003). Shell-fish aquaculture — in praise of sustainable economies and environments. World Aquac 34, 15–17.
Stanley R. E., Bilskie M. V., Woodson C. B., and Byers J. E. (2024). A model for understanding the effects of flow conditions on oyster reef development and impacts to wave attenuation. Ecol. Model. 489, 110627. doi: 10.1016/j.ecolmodel.2024.110627
Stanley J. G. and Sellers M. A. (1986). Species profiles: Life histories and environmental requirements of coastal fishes and invertebrates (Gulf of Mexico) – American oyster. U.S. Fish Wildl. Serv. Biol. Rep. 82(11.64). U.S. Army Corps Engineers TR EL-82- 4, 25.
Stricklin A., Peterson M. S., Lopez J. D., May C. A., Mohrman C. F., and Woodrey M. S. (2010). Do small, patchy, constructed intertidal oyster reefs reduce salt marsh erosion as well as natural reefs? Gulf Caribbean Res. 21-27, 21-27.
Sunila I., Kenyon H., Rivara K., Blacker K., and Getchis T. (2016). Restocking natural beds with remote-set disease-resistant oysters in Connecticut: A field trial. J. Shellfish Res. 35, 115–125. doi: 10.2983/035.035.0113
Tso G. L., Narayan S., and Gittman R. K. (2023). Wave attenuation performance of emergent reef-type breakwaters and oyster shell bags. ASCE Inspire 2023, 564–573. doi: 10.1061/9780784485163.066
USACE (2012). United States Army Corps of Engineers: Chesapeake Bay oyster recovery: native oyster restoration master plan Vol. 290 (Baltimore and Norfolk District: U.S. Army Corps of Engineers). Available online at: https://www.nab.usace.army.mil/Portals/63/docs/Environmental/Oysters/MasterPlan_ExecutiveSummary.pdf (Accessed November 2024).
U.S. Army Corps of Engineers Baltimore and Norfolk Districts (2012). Chesapeake Bay Oyster Recovery: Native Oyster Restoration Master Plan (U.S. Army Corps of Engineers Baltimore District). Available online at: https://www.nab.usace.army.mil/Portals/63/docs/Environmental/Oysters/CB_OysterMasterPlan_Oct2012_FINAL.pdf (Accessed November 2024).
USDA National Agricultural Statistics Service (2018). Census of aquaculture. Available online at: https://www.nass.usda.gov/Publications/AgCensus/2017/Online_Resources/Aquaculture/index.php (Accessed November 2024).
van den Brink A. M., Maathuis M. A. M., and Kamermans P. (2020). Optimization of off-bottom spat collectors for restoration and production of the European Flat Oyster (ostrea edulis) in Dutch Coastal Waters. Aquat. Conservation: Mar. Freshw. Ecosyst. 30, 2087–2100. doi: 10.1002/aqc.3427
Walles B., Mann R., Ysebaert T., Troost K., Herman P. M. J., and Smaal A. C. (2015). Demography of the ecosystem engineer Crassostrea gigas, related to vertical reef accretion and Reef Persistence. Estuarine Coast. Shelf Sci. 154, 224–233. doi: 10.1016/j.ecss.2015.01.006
Keywords: eastern oyster, living shoreline, growth, restoration, mortality, aquaculture
Citation: Hudock RE, Campbell B, Motz N, Carlisle A and Hale E (2025) Performance of two selectively bred strains of eastern oyster, Crassostrea virginica, in Delaware Bay, USA with implications for living shoreline features. Front. Ecol. Evol. 13:1608236. doi: 10.3389/fevo.2025.1608236
Received: 08 April 2025; Accepted: 13 June 2025;
Published: 02 July 2025.
Edited by:
Amanda Tritinger, Coastal and Hydraulics Laboratory, Engineer Research and Development Center (ERDC), United StatesReviewed by:
Iván Fernando Calixto-Botía, University of Los Andes, ColombiaClaudio De Melo, Federal University of Santa Catarina, Brazil
Copyright © 2025 Hudock, Campbell, Motz, Carlisle and Hale. This is an open-access article distributed under the terms of the Creative Commons Attribution License (CC BY). The use, distribution or reproduction in other forums is permitted, provided the original author(s) and the copyright owner(s) are credited and that the original publication in this journal is cited, in accordance with accepted academic practice. No use, distribution or reproduction is permitted which does not comply with these terms.
*Correspondence: Edward Hale, ZWhhbGVAdWRlbC5lZHU=