 Mojtaba Tahmasebi1*
 Julie Bruck1
 Michael Volk1
 Emre Tepe2
 Abhinav Alakshendra2
 Afsheen Sadaf1
 Jack A. Puleo3
- 1Department of Landscape Architecture, College of Design, Construction & Planning, University of Florida, Gainesville, FL, United States
- 2Department of Urban and Regional Planning, College of Design, Construction & Planning, University of Florida, Gainesville, FL, United States
- 3Department of Civil, Construction, and Environmental Engineering, Center for Applied Coastal Research, University of Delaware, Newark, DE, United States
Introduction: Coastal land cover (LC) is in constant flux and shaped by human activity and natural forces. These shifts have profound implications for climate resilience, as LC change can either enhance or diminish the landscape’s capacity to store and sequester carbon.
Methods: This study investigates the impact of sea-level rise (SLR) on carbon storage and sequestration within the coastal Superfund and industrially contaminated areas of Aberdeen Proving Ground (APG) and its adjacent environment, located in the northern Chesapeake Bay, Maryland. Leveraging the MOLUSCE plugin in QGIS and the InVEST model, this study integrates historical LC data with predictive modeling techniques, including artificial neural networks, multi-layer perceptron, and Cellular Automata.
Results: Projections for 2061 reveal that, under a no-SLR scenario and non-submerged aquatic vegetation (SAV) scenario, APG retains 4,059,312 Mg C in storage, losing -54,087 Mg C sequestration and -$42.06 million net present value (NPV). The NPV is changed to -$40.57 million for the Low SAV scenario and -$38.86 million for the High SAV scenario for 2061 under the no-SLR scenario. However, with SLR, storage declines to 3,894,892 Mg C, and sequestration losses escalate to -218,505.75 Mg C, representing -$169.93 million NPV for the non-SAV scenario. The amount of NPV is changed to -168.44 million and -$166.73 million for the Low and High SAV scenarios.
Discussion: These findings underscore the accelerating carbon debt imposed by SLR and the urgent need for adaptive strategies. Coastal preservation techniques, such as living shorelines and thin-layer placement, have emerged as critical strategies for mitigating carbon losses and enhancing resilience. By quantifying the ecological and economic consequences of SLR-driven LC change, this study advances the understanding of carbon dynamics in vulnerable coastal landscapes and reinforces the necessity of proactive management to sustain their climate-regulating functions.
1 Introduction
It is well known that urbanization in coastal areas alters land covers (LCs) that provide valuable ecosystem service benefits that humans derive from natural systems (Alberti et al., 2003; Freire et al., 2009). In coastal edge environments, natural LCs such as wetlands are dynamic and constantly shifting in response to episodic events, such as storms, and long-term processes like sea-level rise (SLR) (Michener et al., 1997). These changes can create conditions that may no longer be favorable for specific LCs, leading to opportunities for ecosystem shifts (Ruhl, 2010). As natural coastal ecosystems undergo transitions, where one LC converts or diminishes, the associated ecosystem services, such as carbon storage and sequestration (CSS), habitat provisioning, and coastal protection, are also affected (Scullion et al., 2014; Hill et al., 2014; Radwan et al., 2021).
The transformation of coastal edge environments highlights the interconnectedness of LC changes and the complex dynamics of ecosystem services (Xin et al., 2023). One important ecosystem service provided by coastal edge ecosystems is CSS (Estrada et al., 2015) which has a quantifiable value in carbon markets, making it possible to assess and discuss the impacts of changes in these ecosystems to mitigate the effect of climate change (Bacani et al., 2024). A significant amount of research has been conducted to quantify CSS in coastal ecosystems. Studies have employed various methodologies, including remote sensing (Jia, 2014; Pham et al., 2019; Maurya et al., 2021), InVEST (Moritsch et al., 2021; González-García et al., 2022), field measurements (Kauffman and Donato, 2012; SChile et al., 2017; Charles et al., 2020), and modeling (Luisetti et al., 2019), to estimate carbon stocks in coastal blue carbon ecosystems such as mangrove forests, tidal marshes, and seagrass meadows (Macreadie et al., 2021). These efforts have underscored the role of coastal ecosystems in mitigating climate change by capturing and sequestering carbon dioxide from the atmosphere.
Research indicates that SLR, driven by changes in ocean circulation and climate dynamics (Piecuch, 2020), poses significant threats to coastal ecosystems, with heightened concern in locations affected by contamination or designated as Superfund sites. Nationally, nearly 950 Superfund sites are at risk from climate change impacts (U.S. Environmental Protection Agency, 2025), including SLR, with hundreds facing increased flood risk. The erosion of coastal brownfields and Superfund sites is especially concerning, as it increases the risk of hazardous contaminants entering nearby waterways. As rising seas encroach on these areas, the mobilization of pollutants exacerbates environmental and public health risks.
This threat is particularly acute along the U.S. East Coast, where a high concentration of coastal contaminated sites coincides with accelerating SLR and land subsidence, driving rapid ecosystem loss. In the Mid-Atlantic region, SLR is projected to exceed the global average by 30%, further threatening degraded sites and placing critical ecosystems, such as those in the Chesapeake Bay estuary at heightened risk of degradation (Caponigro, 2017; Ezer and Atkinson, 2014). The Atlantic and Gulf coasts face similar vulnerabilities due to their dense clusters of contaminated sites and exposure to rising seas.
Addressing the risks posed by coastal Superfund sites is critical to mitigating environmental hazards and informing adaptive management strategies. Nature-based solutions (NBS) may offer an effective adaptation approach, helping to safeguard against environmental challenges while preserving ecological balance. NBS are targeted actions to protect, manage, and restore ecosystems, addressing societal challenges such as climate change, food security, and natural disasters while promoting human well-being and biodiversity (Cohen-Shacham et al., 2016). These solutions provide a range of benefits, including carbon sequestration, flood and water quality regulation, soil protection, biodiversity support, and enhanced ecosystem resilience (Keesstra et al., 2018), though quantifying the full value of these co-benefits remains challenging.
While there is substantial research on ecosystem service benefits, including the benefits of CSS, there is limited research quantifying the economic value of carbon sequestration losses when directly comparing it to the cost of an NBS, such as thin-layer placement (TLP), as a mitigation strategy. TLP is a coastal restoration technique that strategically adds a thin layer of sediment to wetlands or other low-lying areas (Raposa et al., 2023), to combat erosion, enhance elevation, and improve ecosystem resilience against SLR.
This research focuses on understanding LC dynamics under SLR scenarios and analyzing their impacts on the value of CSS services. To achieve this, the study models LC changes over 40 years at Aberdeen Proving Ground, MD (APG), estimating net losses or gains across various LC categories. It quantifies long-term CSS trends using the InVEST model and evaluates the market value of projected CSS changes. Additionally, it explores the conceptual application of NBS for APG’s edge environments, integrating TLP and hybrid shoreline solutions. Although a full cost-benefit analysis is beyond the scope, the research provides a framework for examining the feasibility, ecological benefits, and economic viability of NBS in addressing SLR-related risks to contaminated coastal sites, focused on APG, a coastal military installation located adjacent to the Chesapeake Bay. The site was used for extensive munitions testing, and at least one area of APG, the Edgewood Area Site, has been designated as an Environmental Protection Agency (EPA) Superfund site. Unlike many coastal military bases, coastal proving grounds are sparsely populated and, in many ways, resemble conservation areas. This characteristic influenced the decision to study this site and its surrounding neighborhoods, as the social dynamics of land use transformation modeling are inherently complex. By minimizing the influence of social factors in this sparsely populated area, we were able to more reliably examine natural LC changes, assuming smaller impacts from human-driven activities.
While the average elevation of APG is around 30 m above Mean Sea Level (MSL), referenced to NAVD88, the coastal area is generally flat, with most of the land area adjacent to the nearly 103 miles of shoreline along the Upper Chesapeake Bay, Gunpowder River, and Bush River lying close to MSL. The coastal areas experience flooding, erosion, and wetland migration into higher elevations in response to storm impacts and SLR. The past military testing on the site has led to soil, sediment, and groundwater contamination, raising concerns about pollutant release if the areas become inundated (Fonnum et al., 2012; Miller and Foran, 2012; Department of Defense, 2019; Lee 2021; Hill et al., 2023). The Edgewood Area has been listed on the EPA Superfund program’s National Priorities List (NPL) since 1990 (U.S. Environmental Protection Agency, 2025).
2 Materials and methods
Given the accelerating loss of LC due to SLR and urban expansion, researchers have developed advanced methodologies to predict LC changes, aiding in mitigation and adaptation planning. These methodologies generally fall into four broad categories: simulation-based methods, statistical-based methods, machine learning-based methods, and mixed-method approaches that combine simulation with either statistical or machine learning techniques. Simulation-based methods, such as Cellular Automata (CA) and Agent-Based Modeling (ABM), are typically deterministic, producing consistent outputs under identical conditions and input data. In contrast, statistical-based methods, including Markov Chain and Artificial Neural Network (ANN), incorporate stochastic techniques that introduce probabilistic elements, resulting in variations even under the same input conditions. Mixed-method approaches combine elements from both categories to enhance predictive accuracy and adaptability. One widely used example is the Cellular Automata of Artificial Neural Network (CA-ANN) model, which integrates CA with ANN for improved spatiotemporal prediction. A notable application of this mixed-method approach is the Modules for Land Use Change Evaluation (MOLUSCE) plugin in Quantum GIS (QGIS). This model uses ANN, which has demonstrated effectiveness in land use and land cover (LULC) prediction (Chowdhury, 2024), and applies Multi-Layer Perceptron-Artificial Neural Network (MLP-ANN) algorithms to model LC change and transition potential. Its hybridization with CA further improves spatiotemporal prediction accuracy (Kamaraj and Rangarajan, 2022). Moreover, the implementation of MOLUSCE within QGIS, an open-source GIS platform, offers flexibility and customization, allowing researchers to tailor the model to specific study areas and environmental conditions.
Modeling existing LCs and forecasting changes driven by long-term environmental shifts, such as SLR, allows researchers to evaluate ecosystem trade-offs and better understand their implications. This study integrates the MOLUSCE plugin in QGIS, employing the MLP-ANN method for modeling transition potential and the CA-ANN method for LC forecasting, in conjunction with the InVEST model to predict potential gains or losses in CSS resulting from LC changes. Building on prior research that used InVEST to assess future CSS trends (Fernandes et al., 2020; Saha et al., 2022; Avtar et al., 2022; Mallick et al., 2022; Sharma et al., 2024), this analysis extends these approaches by incorporating the nuanced relationships between diverse ecosystems such as forests, mid-layer vegetation, and various wetland types and accounting for the influence of SLR on ecosystem transitions.
To contextualize the model applications, this study systematically summarizes the studies that applied MOLUSCE and InVEST (Table 1), offering insights into carbon dynamics across different LULC scenarios and temporal scales. While most studies forecast a decline in future CSS, often resulting in substantial reductions in net present value (NPV) and reflecting a negative value for carbon sequestration, they frequently classify waterbodies as negligible or exclude them due to assessment challenges. This study addresses that gap by incorporating Submerged Aquatic Vegetation (SAV) as a critical carbon sink within waterbody LC types, highlighting SAV role in carbon dynamics and coastal resilience.
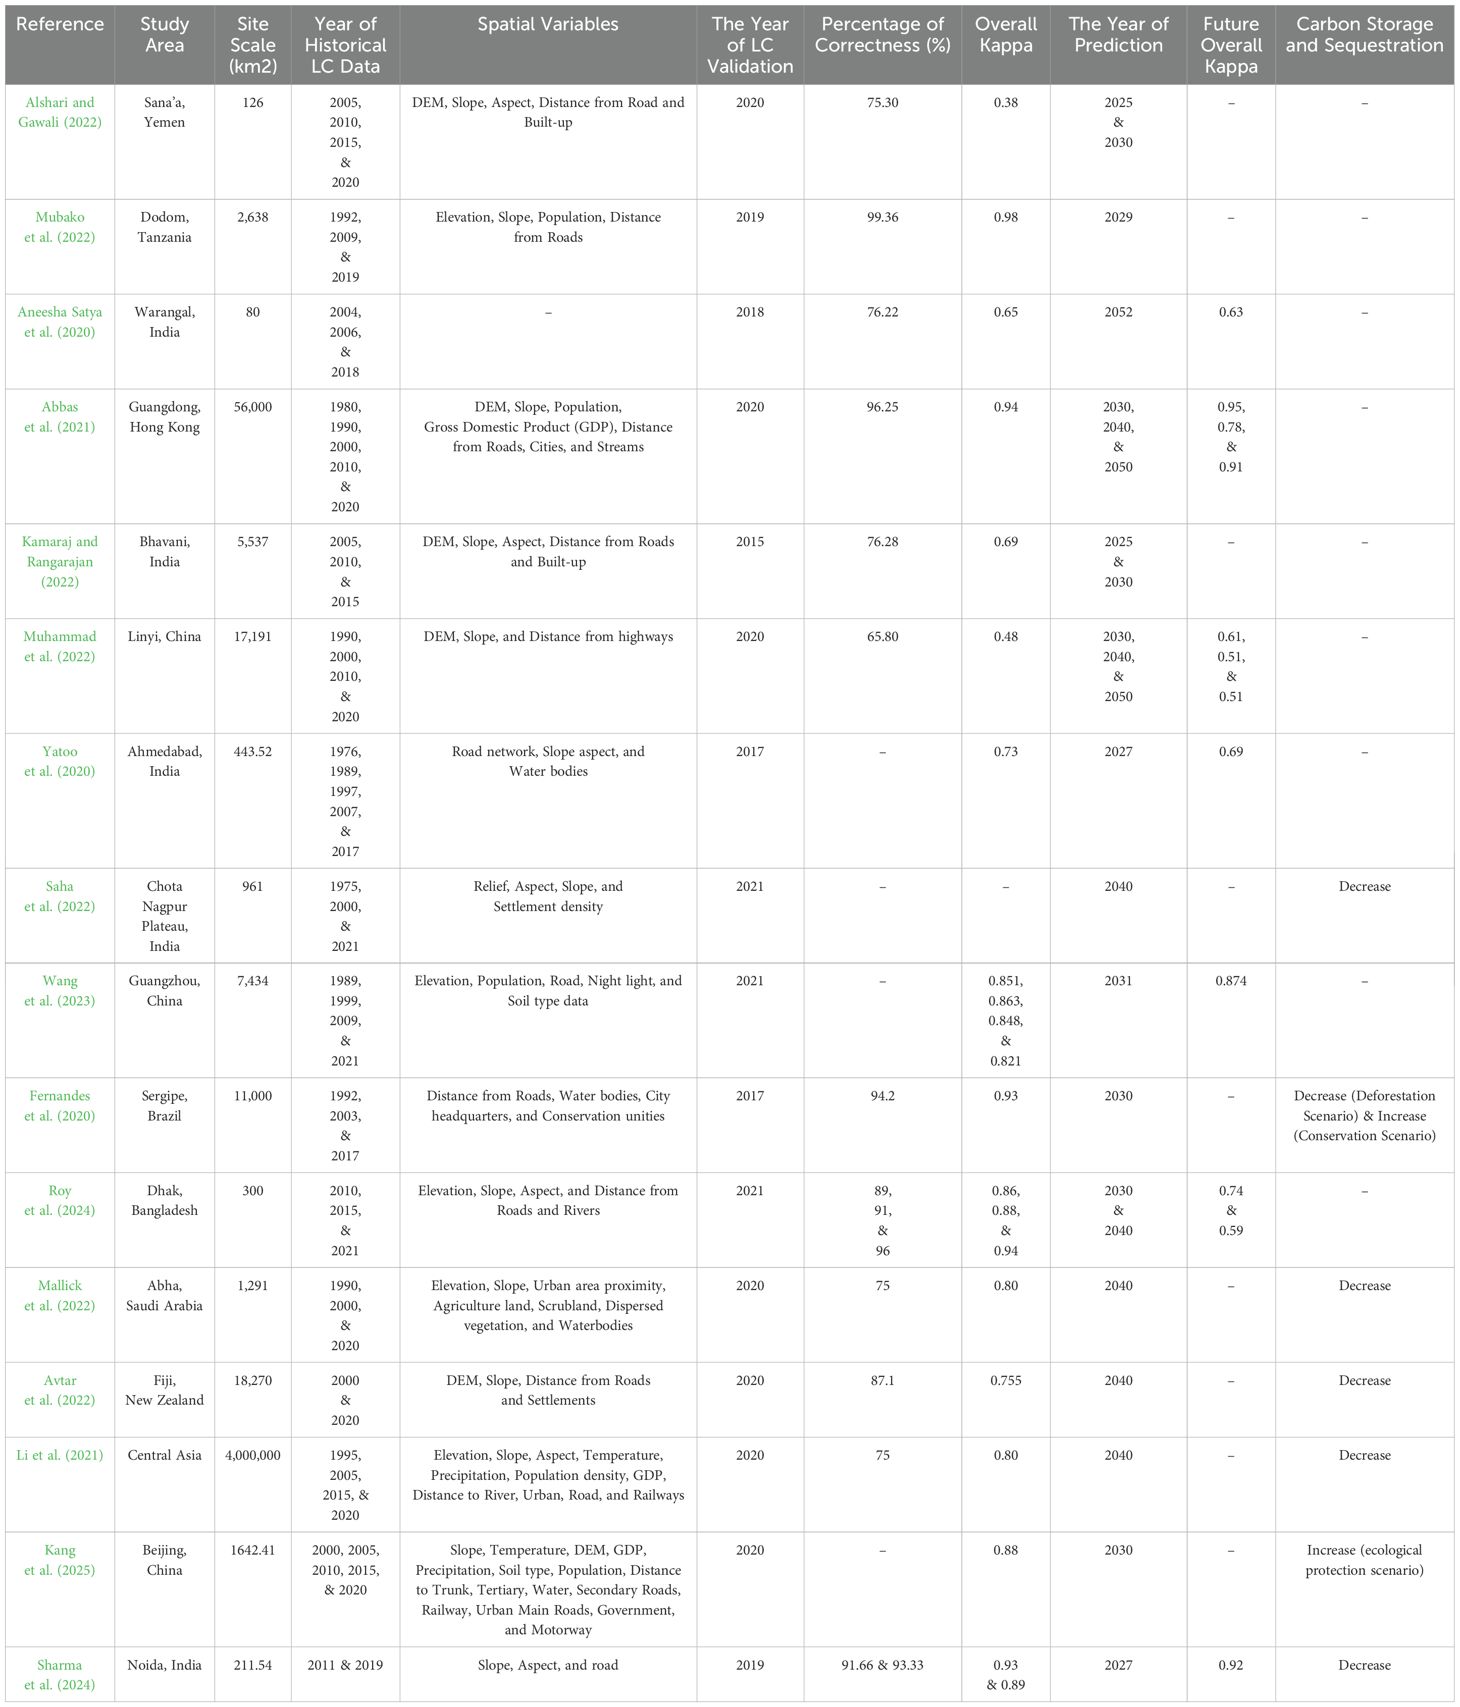
Table 1. Summary of Studies Using MOLUSCE and InVEST for Land Cover Change Analysis and Carbon Dynamics.
2.1 Study area
APG and adjacent areas, including Edgewood and Perryman, are located within Harford County, Maryland, in the Northern Chesapeake Bay region at a latitude of 39°28′24″N and a longitude of 76°08′27″W (Figure 1). The study site comprised 54,120 ha, including 29,239 ha of land and 24,881 ha of water, based on the National Land Cover Database (NLCD) (Yang et al., 2018; Fry et al., 2011). The study area extended past APG property and includes Joppatowne, Havre De Grace, and U.S. Route 40. This extension was designed to understand how LC change would impact the base itself and some of the surrounding communities. Although the base and these communities are administratively distinct, their proximity suggests that environmental trends and decisions in one area could significantly influence the quality of ecosystem services in the other.
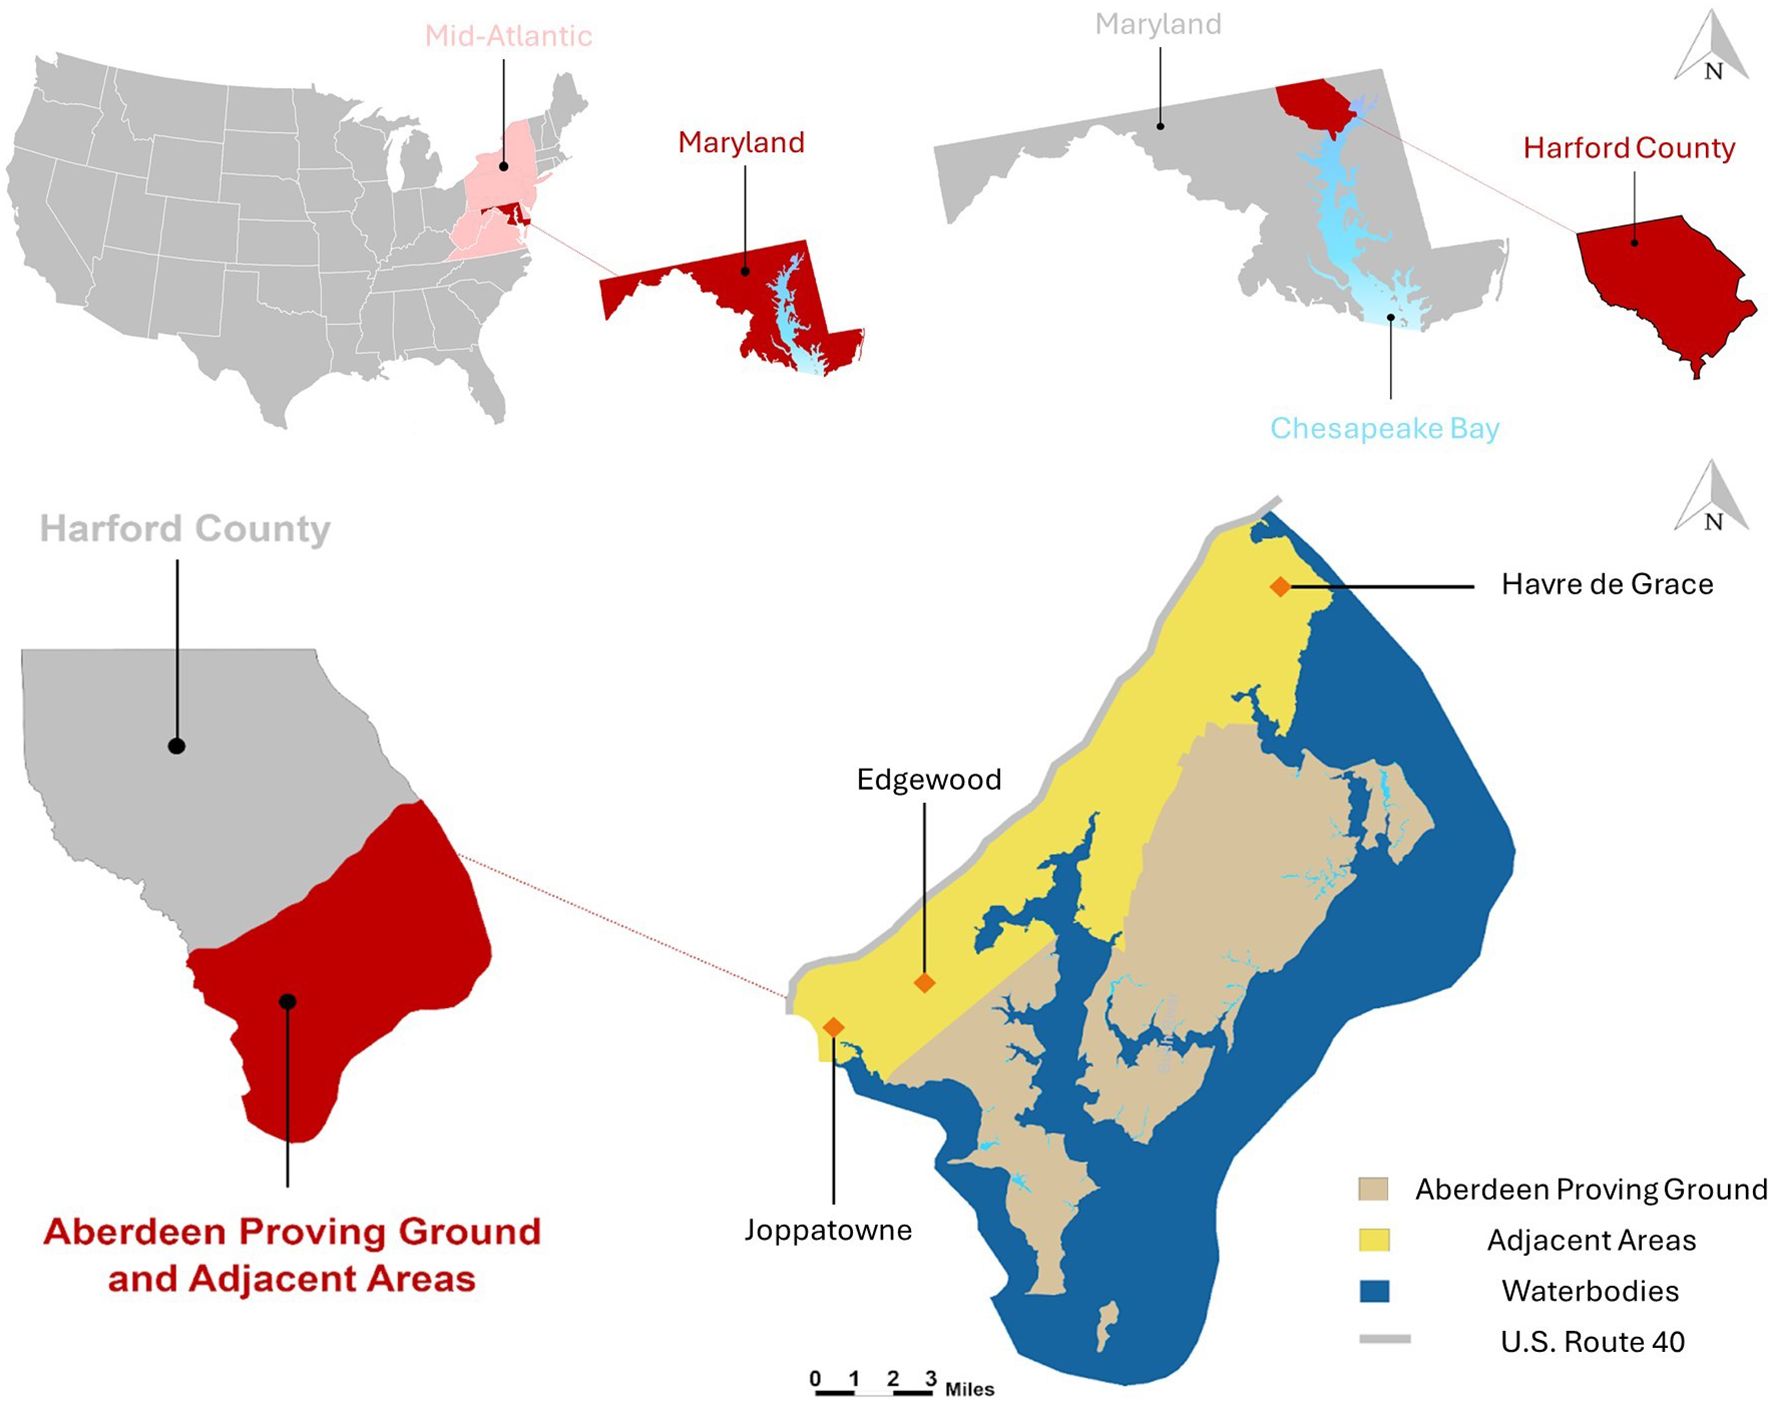
Figure 1. Map of Aberdeen Proving Ground and adjacent areas within Harford County, Chesapeake Bay watershed, and the Mid-Atlantic region, United States.
2.2 Data sources
Selecting historical data at consistent intervals is essential to ensure robust validation (Wang et al., 2023; Fernandes et al., 2020; Roy et al., 2024; Avtar et al., 2022; Mallick et al., 2022; Li et al., 2021). Using NLCD products, which provide LC data across nine epochs from 2001 to 2021 (2001, 2004, 2006, 2008, 2011, 2013, 2016, 2019, and 2021), this study selects the 2001 LC dataset as the initial layer and the 2011 dataset as the final layer to establish a 10-year interval for predicting LC in 2021, thereby enabling validation against the most recent 2021 NLCD data (Figure 2). Many studies that used the MOLUSCE plugin for LULC forecasting relied on Kappa validation to evaluate prediction accuracy despite its inherent limitation; the absence of actual future data for validation (Table 1). While Kappa is widely used to measure agreement between observed and predicted maps within the same historical period, its effectiveness in LULC prediction in LULC forecasting is constrained. Pontius and Millones (2011) suggest replacing Kappa with more straightforward and informative metrics, such as quantity and allocation disagreement, which are particularly relevant for LULC predictions. Kappa’s tendency to emphasize dominant LC classes while overlooking discrepancies in less prevalent categories further limits its effectiveness, especially in uneven class distribution. To address these concerns, this study adopts the F1-score as the primary validation metric, providing a more balanced assessment of predictive accuracy across multiple LC classes.
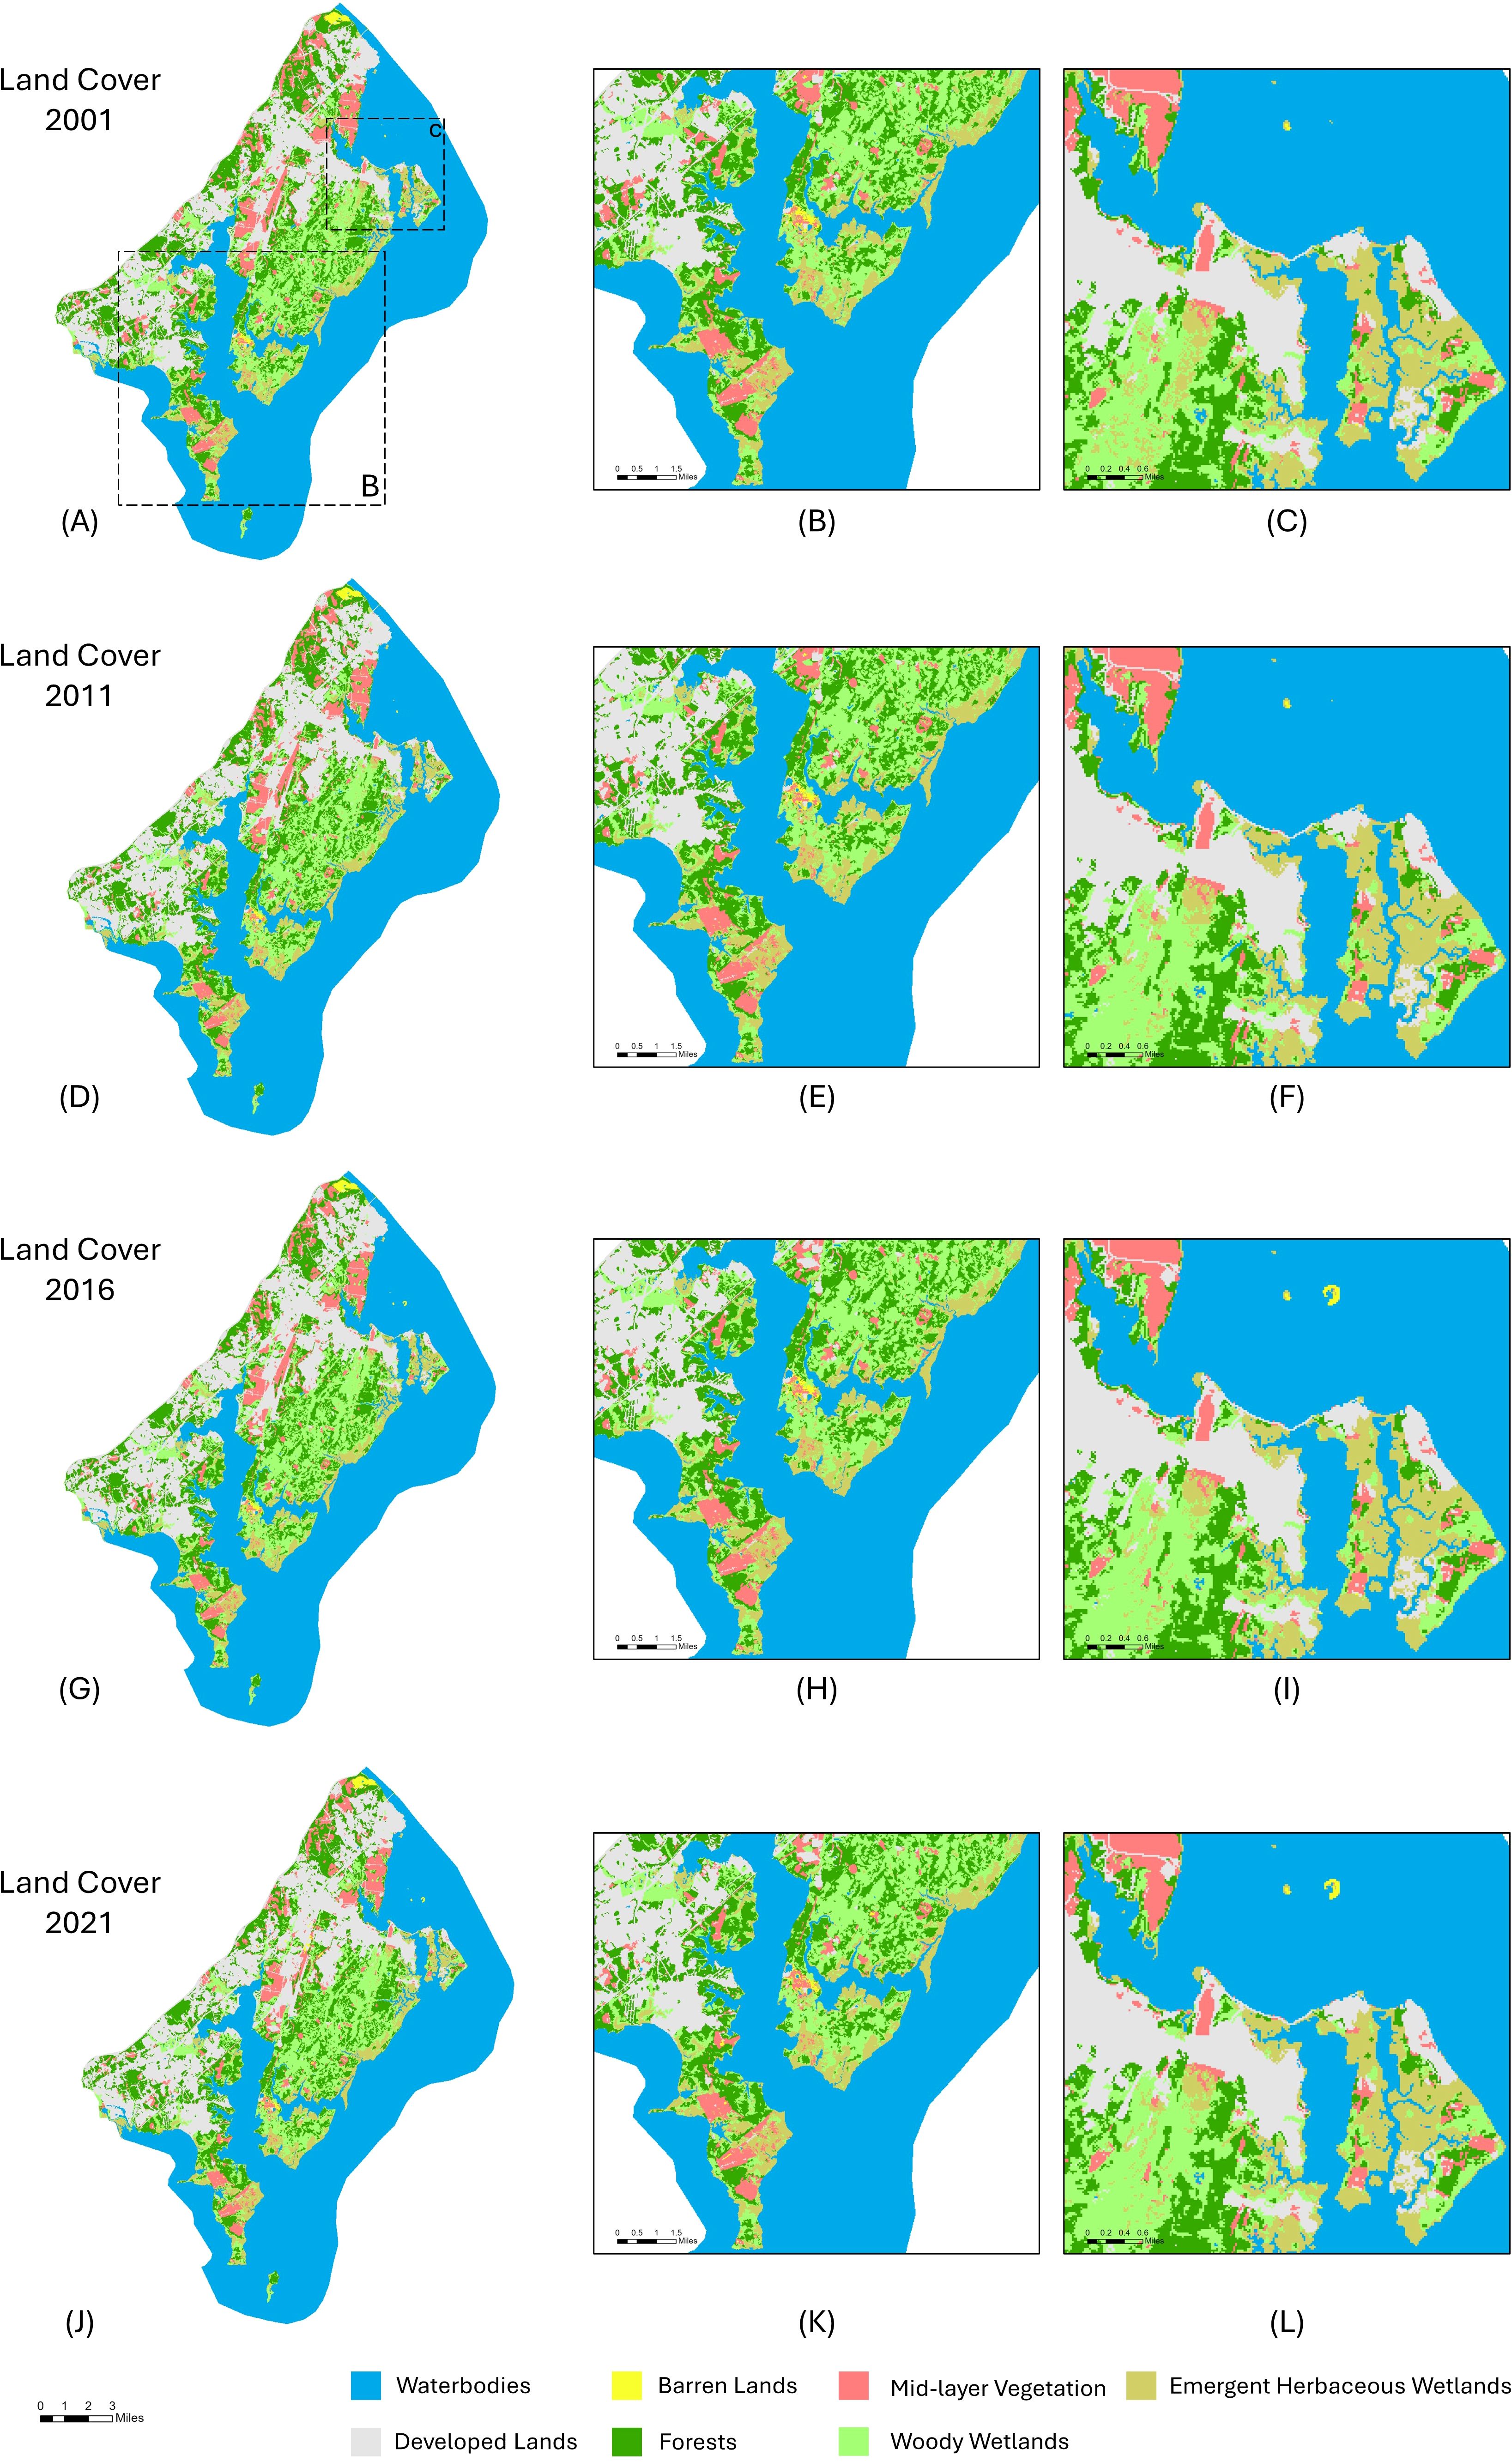
Figure 2. Historical and projected land cover (LC) data for modeling and validation were sourced from the National Land Cover Database. (A, D) show LC in 2001 and 2011, serving as the initial and final inputs for the MOLUSCE plugin, respectively. (G) represents the 2016 baseline used in the InVEST model, while (J) displays the 2021 LC map predicted and validated with an average F1-score of 0.93. (B, E, H, K) show the LC for the Edgewood area, and (C, F, I, L) depict Spesutie Island for the years 2001, 2011, 2016, and 2021, respectively.
The NLCD maps were reclassified into seven primary LC types, consolidating previous classifications as follows: Waterbodies (formerly categorized as Open Water), Developed Lands (previously encompassing Developed, Open Space; Developed, Low Intensity; Developed, Medium Intensity; and Developed, High Intensity), Barren Lands (formerly classified as Barren Land), Forests (previously including Deciduous Forest, Evergreen Forest, and Mixed Forest), Mid-Layer Vegetation (MLV) (previously comprising Shrub/Scrub, Herbaceous, Hay/Pasture, and Cultivated Crops), Woody Wetlands (WWs) (retaining its original classification), and Emergent Herbaceous Wetlands (EHWs) (also maintaining its original classification) in 30 m resolution.
The spatial variables were selected based on a review of prior studies relevant to the study area context and testing using Pearson correlation, minimizing redundancy between variables. Prior studies (Table 1) incorporated the digital elevation model (DEM) or elevation, slope, and road proximity as primary spatial variables. In the coastal regions, studies frequently included the distance to rivers, lakes, or waterbodies (Fernandes et al., 2020; Li et al., 2021; Yatoo et al., 2020; Mallick et al., 2022; Roy et al., 2024). This study incorporates the DEM, slope, distance from roads, distance from railways, distance from water lines, and distance from shorelines, all processed at a 30-m resolution. The DEM was converted into slope data while maintaining the same resolution and spatial extent as the LC maps in ArcGIS Pro (ESRI). Proximity tools in ArcGIS Pro were employed to derive distance from roads, railways, water lines, and shorelines.
Two key parameters were processed to prepare the carbon data. First, the base year for carbon prediction was set to 2016 (Figure 2), using the LC map from the NLCD as the current LC, selected for its alignment with the availability of high-quality carbon datasets from NASA for that year. Second, this study inputs data for the carbon pools, including aboveground biomass, belowground biomass, soil organic carbon, and litter (Li et al., 2022; Sun et al., 2024). The aboveground biomass data (Dubayah et al., 2018), which was derived from a dataset that includes 848 field-sampled sites across Maryland, Pennsylvania, and Delaware, making it a suitable source for APG. The aboveground biomass data and the 2016 LC map share a native resolution of 30 m, ensuring spatial consistency (Table 2). For the remaining carbon pools, data were sourced from the 2016 Carbon Pools across CONUS, (Yu et al., 2021), modeled using MaxEnt and adjusted as recommended by the user guide to maintain compatibility with the 30 m resolution of LC data (Table 2). Due to limited access to site-specific field data at APG, a secured military installation, regional remote-sensed data were used.
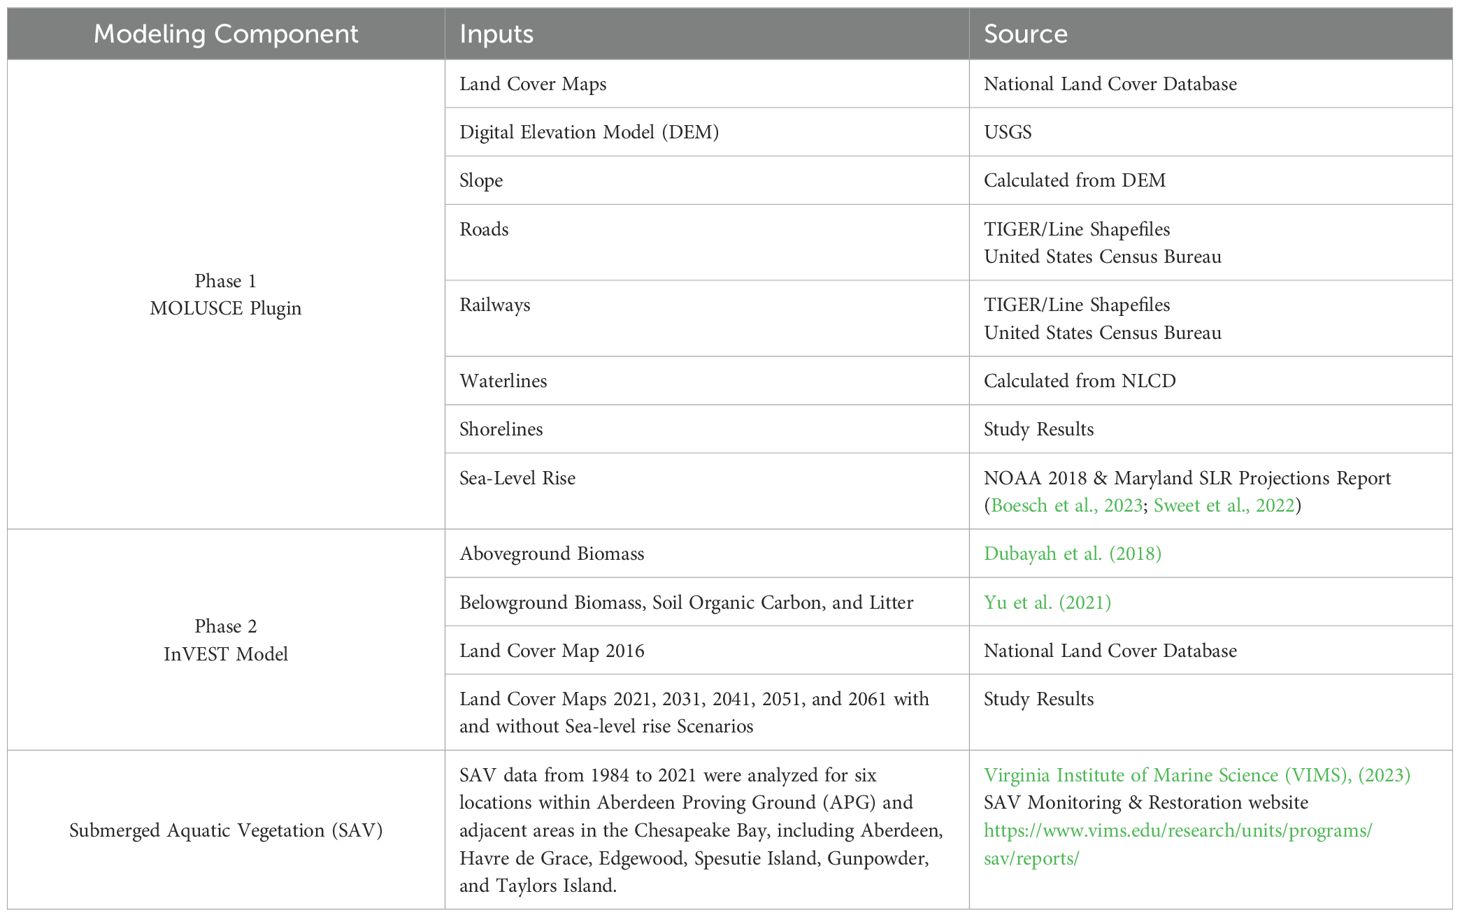
Table 2. Input data sources were used in Phase 1 (MOLUSCE plugin), Phase 2 (InVEST model), and the Submerged Aquatic Vegetation (SAV) prediction.
2.3 Methodological framework
The methodological framework used is organized into two main phases, supported by supplementary analyses (Table 3). Phase I employs the MOLUSCE plugin of QGIS (v2.18) to predict future LC changes. SLR scenarios are considered as one of the future climate change scenarios in predictions. Model performance in this phase was evaluated using class-specific F1-scores, calculated in RStudio (v2023.12.0, Build 369), to assess predictive accuracy for different LC types. Phase II uses the InVEST model (v3.13.0) to estimate CSS as well as potential gains or losses of carbon to future LC changes and predicts NPV with and without SLR. In addition, a supplementary analysis was conducted to calculate the annual rate of change (ARC) for each LC type, providing insights into long-term change dynamics. Finally, an additional component used linear regression to forecast SAV trends based on historical data, capturing potential ecological responses over time.
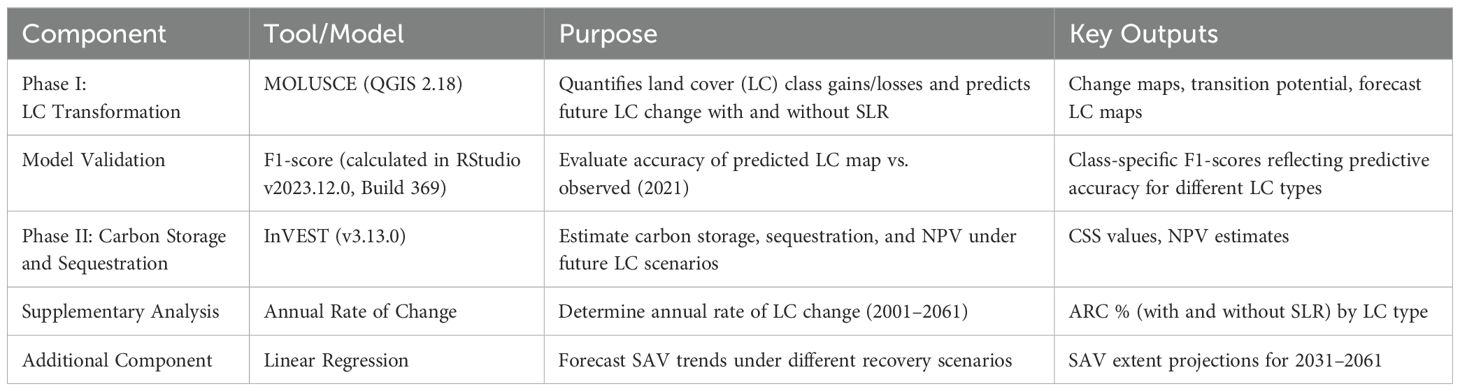
Table 3. Summary of Methodological Framework.
2.3.1 MOLUSCE plugin
2.3.1.1 Area changes
Area changes were calculated to produce the change map representing how LC shifts over time (Kamaraj and Rangarajan, 2022) while also generating class statistics and transition matrices. The class statistics evaluated the changes in LC over time, providing insights into how much each class has increased or decreased. The transition matrix, on the other hand, shows the likelihood of pixels transitioning from one LC type to another, offering a detailed view of how LC changed between different classes (Muhammad et al., 2022).
2.3.1.2 Transition potential modeling
Transition potential modeling was employed to accurately predict LC changes between initial and final states that were input using one of the four methods (MLP-ANN, weights of evidence, multicriteria evaluation, and logistic regression) to compute the translational potential map in the MOLUSCE plugin. The MLP-ANN method was selected due to its efficacy in studying and analyzing LC changes in a spatially explicit manner (Nasiri et al., 2019). MLP-ANN is a sophisticated neural network architecture composed of multiple layers of interconnected nodes, including input, hidden, and output layers (Mishra and Rai, 2016; Pourvahab et al., 2025). The ANN must be trained on the characteristics of the dataset using the backpropagation algorithm (Maithani, 2015) to generalize the transition potential model.
According to GIS-Lab (2014), the data used in the MOLUSCE plugin consists of initial and final state rasters, which are categorical one-band rasters forming the basis for a change map that is also a categorical one-band raster. For models such as ANN, the factor rasters are treated as ordinal or continuous, which can be either one-band or multiband, but not categorical. Models like ANN require input data that can be scaled or measured along a gradient to perform calculations. Continuous and ordinal data can be numerically quantified and manipulated, fitting well into mathematical models that underpin these techniques. To transform categorical data into a format suitable for ANN models that handle ordinal or continuous data, MOLUSCE employs two main methods in the black box, which are dummy coding and scaling and normalization. In dummy coding, each category of the raster data is transformed into a new binary (0 or 1) raster. Here, because there are seven categories, MOLUSCE creates seven binary raster files. After dummy coding, further processing like scaling and normalization may be applied to adjust the data ranges, ensuring they are suitable for integration with other model inputs and improving model stability.
Key parameters were defined to optimize the performance of the MLP-ANN model, including maximum iterations, number of hidden layers, momentum value, and learning rate. These parameters were selected based on the literature for robust model performance. Specifically, the optimal configuration identified includes a maximum of 1,000 iterations, with 10 hidden layers, a momentum factor of 0.05, a learning rate set at 0.001, and a consideration of 5 iterations within the CA framework (Abbas et al., 2021; Kamaraj and Rangarajan, 2022; Muhammad et al., 2022). The output of MLP-ANN is a set of data points that represent the probability of LC transitioning from one category to another. The output includes probabilities or classifications for each pixel in the study area. The output from the MLP-ANN model serves as the input to the CA-ANN model. In the context of MOLUSCE, CA uses these probabilities or classifications to forecast the spatial patterns of LC changes over time.
2.3.1.3 Cellular automata of artificial neural network model
The MOLUSCE plugin employs a CA-ANN. CA predicts future LC maps by simulating LC changes, linking each cell’s future state to its current state and neighbors (Gidey et al., 2017), while the ANN uses historical data to forecast how cells evolve through iterative steps.
2.3.1.4 F1-score validation
The F1-score was calculated by integrating precision (Equation 1) and recall (Equation 2) (Haseeb et al., 2024) to validate the accuracy of each LC class. By comparing the 2021 NLCD map with the predicted LC map for the same year, the F1-score evaluates the model’s performance for each specific LC type. F1-score (Equation 3) was calculated as follows:
where TP represents the number of true positive observations, FP is false positive observations, and FN indicates false negative observations (Ulmas and Liiv, 2020; Amini et al., 2022; Witjes et al., 2022). After validating the 2021 LC map with F1-score, the model was deployed to forecast LC maps for the years 2031, 2041, 2051, and 2061, providing insights into long-term LC dynamics with 10-year intervals.
2.3.1.5 Forecasting land cover with sea-level rise integration
Integrating the SLR scenarios required refining the predictive modeling by incorporating distance from shoreline variables considering SLR scenarios. Two technical reports informed SLR projections (Sweet et al., 2022; Boesch et al., 2023). NOAA estimates (Sweet et al., 2022) a rise of 0.49 m (1.61 ft) by 2050 along the northeast coastal region under the intermediate-high scenario. The Maryland report (Boesch et al., 2023) projects between 0.3 m (1 ft) and 0.5 m (1.6 ft) by 2050 and up to 0.8 m (2.7 ft) by 2100 (These projections do not include the effects of high tides and storm surges). This study integrated a 0.30-m (1-ft) SLR variable to forecast LC changes for the 2031 and 2041 scenarios, creating the 2031 SLR LC and 2041 SLR LC maps. For the 2051 and 2061 scenarios, a 0.61-m (2 ft) SLR was considered, producing the corresponding 2051 SLR LC and 2061 SLR LC maps. This projection was selected to support cautious and resilience-oriented planning.
2.3.2 InVEST model
Future LC maps were used in the InVEST model to estimate future CSS and NPV under different SLR scenarios.
2.3.2.1 Carbon storage and sequestration for future scenarios
CSS was calculated across eight future scenarios spanning from 2031 to 2061, with and without considerations of SLR. The 2016 LC map was consistently used as the baseline scenario, while the eight future LC scenarios were input individually to assess CSS for each case. Another requirement was the selection of key parameters necessary for running the valuation model. These essential parameters included the price of carbon, the annual market discount rate, and the annual price change (Natural Capital Project, 2025, accessed on 24 January 2024).
The price of carbon represents the monetary value assigned to a ton of carbon dioxide (CO2), which can vary widely depending on the policy environment, market conditions, and geographic region (Bacani et al., 2024). A common reference is the social cost of carbon (SCC) used by governmental bodies (Nordhaus, 2017). The Annual Market Discount Rate is used to discount future carbon sequestration values back to present value, reflecting the societal preference for immediate benefits compared with future benefits (Natural Capital Project, 2025, accessed on 24 January 2024; Pache et al., 2020). The Annual Price Change parameter reflects the increase in carbon price (Natural Capital Project, 2025, accessed on 24 January 2024).
2.3.2.2 Calculating the net present value
NPV is widely used in environmental studies to assess the economic viability of ecosystem service benefits and management strategies (Knoke et al., 2020). By aggregating annual net benefits over the full rotation period and discounting them to their present value (Ravindranath and Somashekhar, 1995), NPV provides a comprehensive measure of long-term economic returns. The NPV method estimates the carbon sequestration value (Equation 4) over time for a specific parcel using the following formula:
where is the price (currency units) of carbon per metric ton, which is equal to megagrams of carbon, is the amount of carbon sequestered on a parcel , is the future year, is the current year, or is the annual market discount rate for the carbon price, is the annual price change of carbon, and is the period (Natural Capital Project, 2025, accessed on 24 January 2024; Bacani et al., 2024).
The price of carbon was set at $48 per ton of CO2. Although most of the studies in the US follow a high percentage of the discount rate (between 7% to 12%), this study follows a more conservative approach (3%) reflecting a moderate time preference for future values and a lower discount rate encouraging greater greenhouse gases emission mitigation (Natural Capital Project, 2025, accessed on 24 January 2024). The annual price change parameter was set at 3%, reflecting an assumed growth rate over the analysis period.
2.3.3 Annual rate of change analysis for each land cover type
The ARC (Equation 5) was calculated for each LC category to determine the percentage change in area over a specific period. This metric provides insights into how many hectares have increased or decreased per unit of time. ARC is defined as:
where represents the area in ha at the beginning of the period, represents the area in ha at the end of the period, and is the time interval (Muhammad et al., 2022). The intervals from 2001 to 2061 were analyzed to calculate the percentages. These percentages represent the average annual change in area over the 60 years under two scenarios: without SLR (ARC%) and with SLR (ARC SLR%). To compute these rates, 2001 was used as the baseline, and the years 2061 and 2061 with SLR adjustments were used as the endpoints for the non-SLR and SLR scenarios, respectively.
2.3.4 Linear regression analysis
A linear regression model was employed to predict SAV dynamics based on historical trends from 1984 to 2021 (Virginia Institute of Marine Science (VIMS), 2023). This analysis identified significant temporal variations, notably the substantial decline in SAV between 2010 and 2012, attributed to the impact of Tropical Storm Lee. Subsequently, from 2012 to 2017, the implementation of a comprehensive water quality improvement plan facilitated optimal conditions for SAV recovery. However, between 2018 and 2019, persistent rainfall led to a decline in the extent of SAV. Two scenarios were developed to forecast future SAV coverage: a high-SAV scenario, projecting SAV hectares for 2031, 2041, 2051, and 2061 based on trends from 2012 to 2017 (captures a period of rapid recovery), and a low-SAV scenario (long-term gradual change) informed by patterns from 1984 to 2021, which accounted for the adverse effects of natural hazards, including storm surges and persistent rainfall events.
2.3.5 Design concepts
Building on prior research, this study developed design concepts for areas that would receive TLP to mitigate the most challenged areas of APG from the impacts of SLR. A previous site suitability analysis identified areas most conducive to these interventions based on environmental conditions (Sadaf et al., 2025), while an earlier stakeholder study highlighted key areas of concern for local decision-makers (EA Engineering, Science, and Technology, Inc., PBC, 2022). Using these findings as a foundation, this phase of the study explored conceptual design strategies that integrate TLP, vegetative stabilization, and structural enhancements to enhance coastal resilience. The case study by Thorne et al. (2019) demonstrated that TLP can effectively raise marsh elevation and maintain endangered species habitat, even under challenging conditions such as coastal storms, making it a promising short-term adaptation strategy. Several studies are working to develop more detailed models that compare the value of ecosystem services with the cost of TLP (Sea Grant, 2025), however, it is difficult to find information about cost as there are many factors to consider including the location of available sediment, transportation costs, and cost to reestablish. Based on the available case studies (Tyrrell, 2020), the average cost of TLP is estimated at $7,900 per acre, $19,521.31 per ha, though further studies are needed to refine this figure and assess regional variations.
3 Results
3.1 Land cover transformation
The LC prediction for 2021 showed a high level of accuracy, with a correctness rate of 98.25% and an overall Kappa coefficient of 0.97, indicating robust agreement with the observed data. The F1-scores, which reflect the predictive accuracy for different LC types, were as follows: Waterbodies (0.99), Developed Lands (0.98), Forests (0.98), MLV (0.92), WWs (0.96), and EHWs (0.90). Barren Lands, the smallest LC class in our study area, had limited data, but the model still performed above moderate thresholds.
For the historic period from 2001 to 2021 (Figures 2–4), the model predicted a 1.77% increase in Urbanization, equivalent to 958 ha. In contrast, there was a 0.98% decline in Forests (-532.5 ha), a 0.78% decrease in MLV (-423.6 ha), a 0.13% increase in WWs (71 ha), and a 0.10% decline in EHWs (-51 ha). For the first forecasted period, 2021 to 2041 (Figures 3–5), Urbanization continued to rise by 0.26% (143 ha) before stabilizing for the second forecasted period, 2041 to 2061. Under SLR scenarios (Figures 6), Urbanization increased at a slower rate of 0.08% (42 ha) in the first forecast period, before decreasing 0.07% (-11ha) in the second period. Forest and MLV exhibited a decline in both forecast periods, reflecting the same trend observed during the historical period. Under SLR scenarios, Forest saw a marginal decline of 0.22% (-120 ha) in the first period and a further decline of 0.05% (-30.7 ha) in the second forecast period. MLV decreased by 0.07% (-35 ha) in the first period and by 0.003% (-1.62 ha) in the second period.
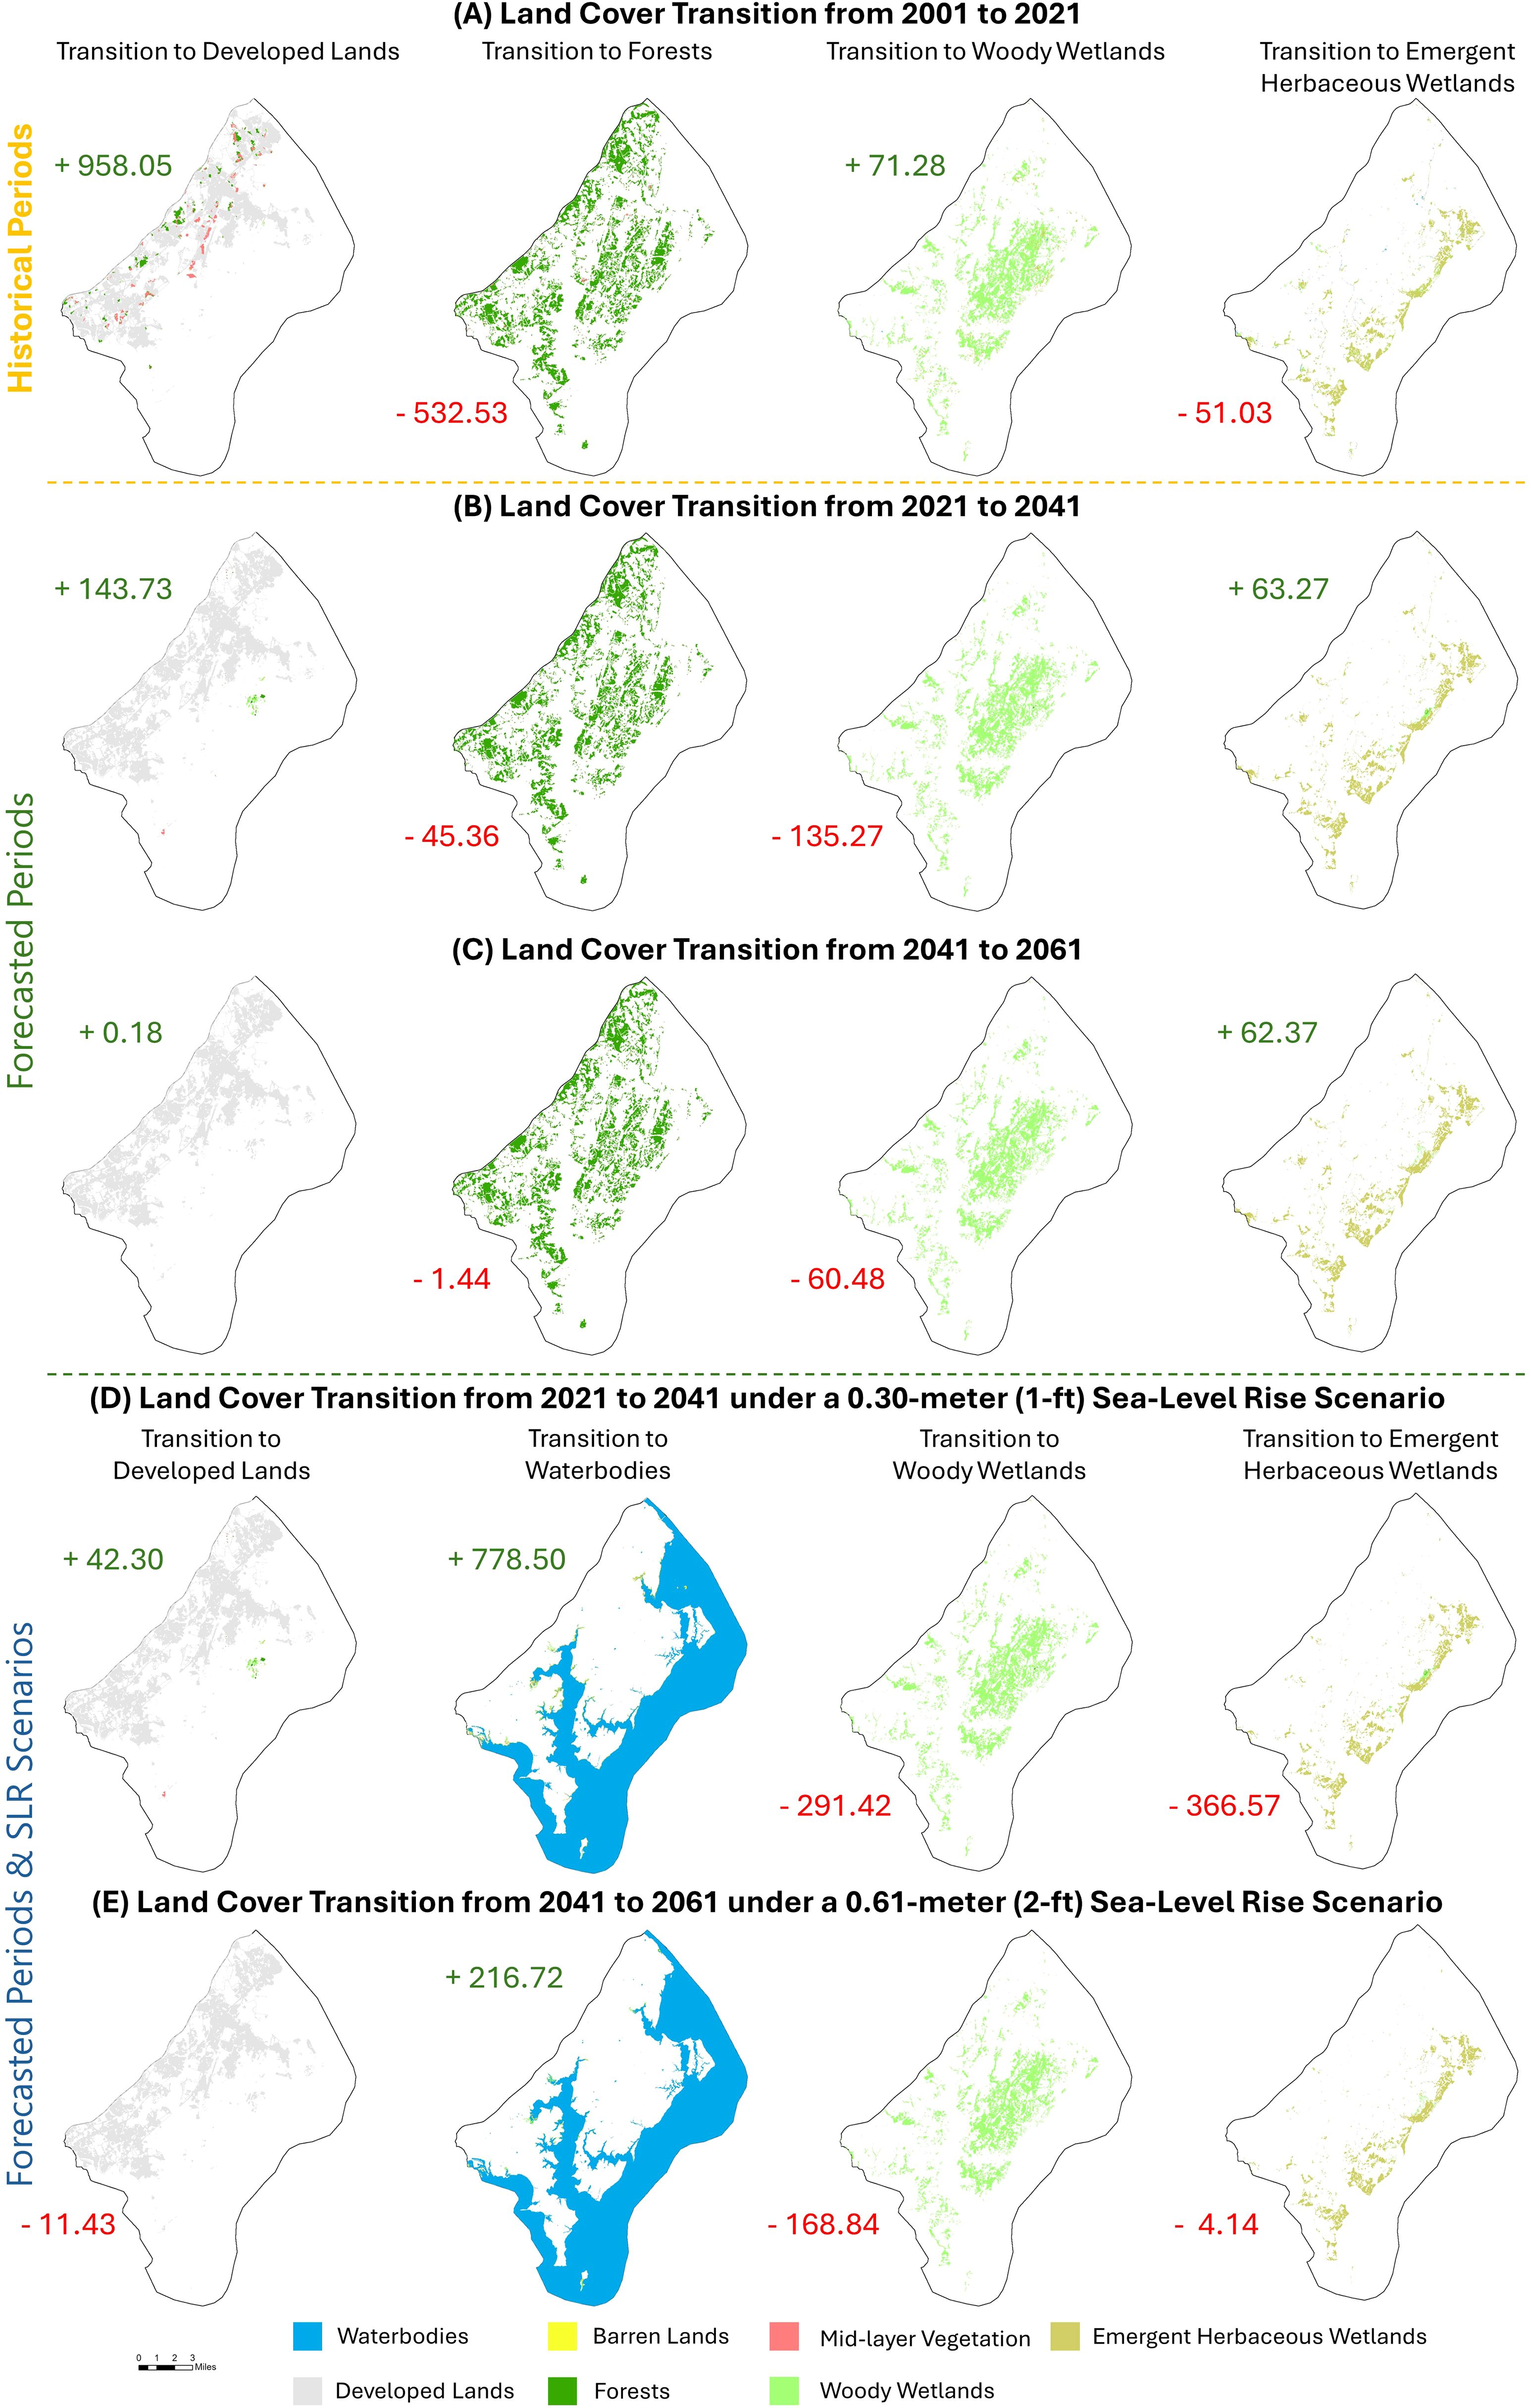
Figure 3. Land cover (LC) transitions under baseline and sea-level rise (SLR) scenarios. (A–C) illustrate LC transitions for the periods 2001–2021, 2021–2041, and 2041–2061, respectively. (D) shows projected transitions from 2021 to 2041 under a 0.30-m (1-ft) SLR scenario, while pane (E) depicts transitions from 2041 to 2061 under a 0.61-m (2-ft) SLR scenario.
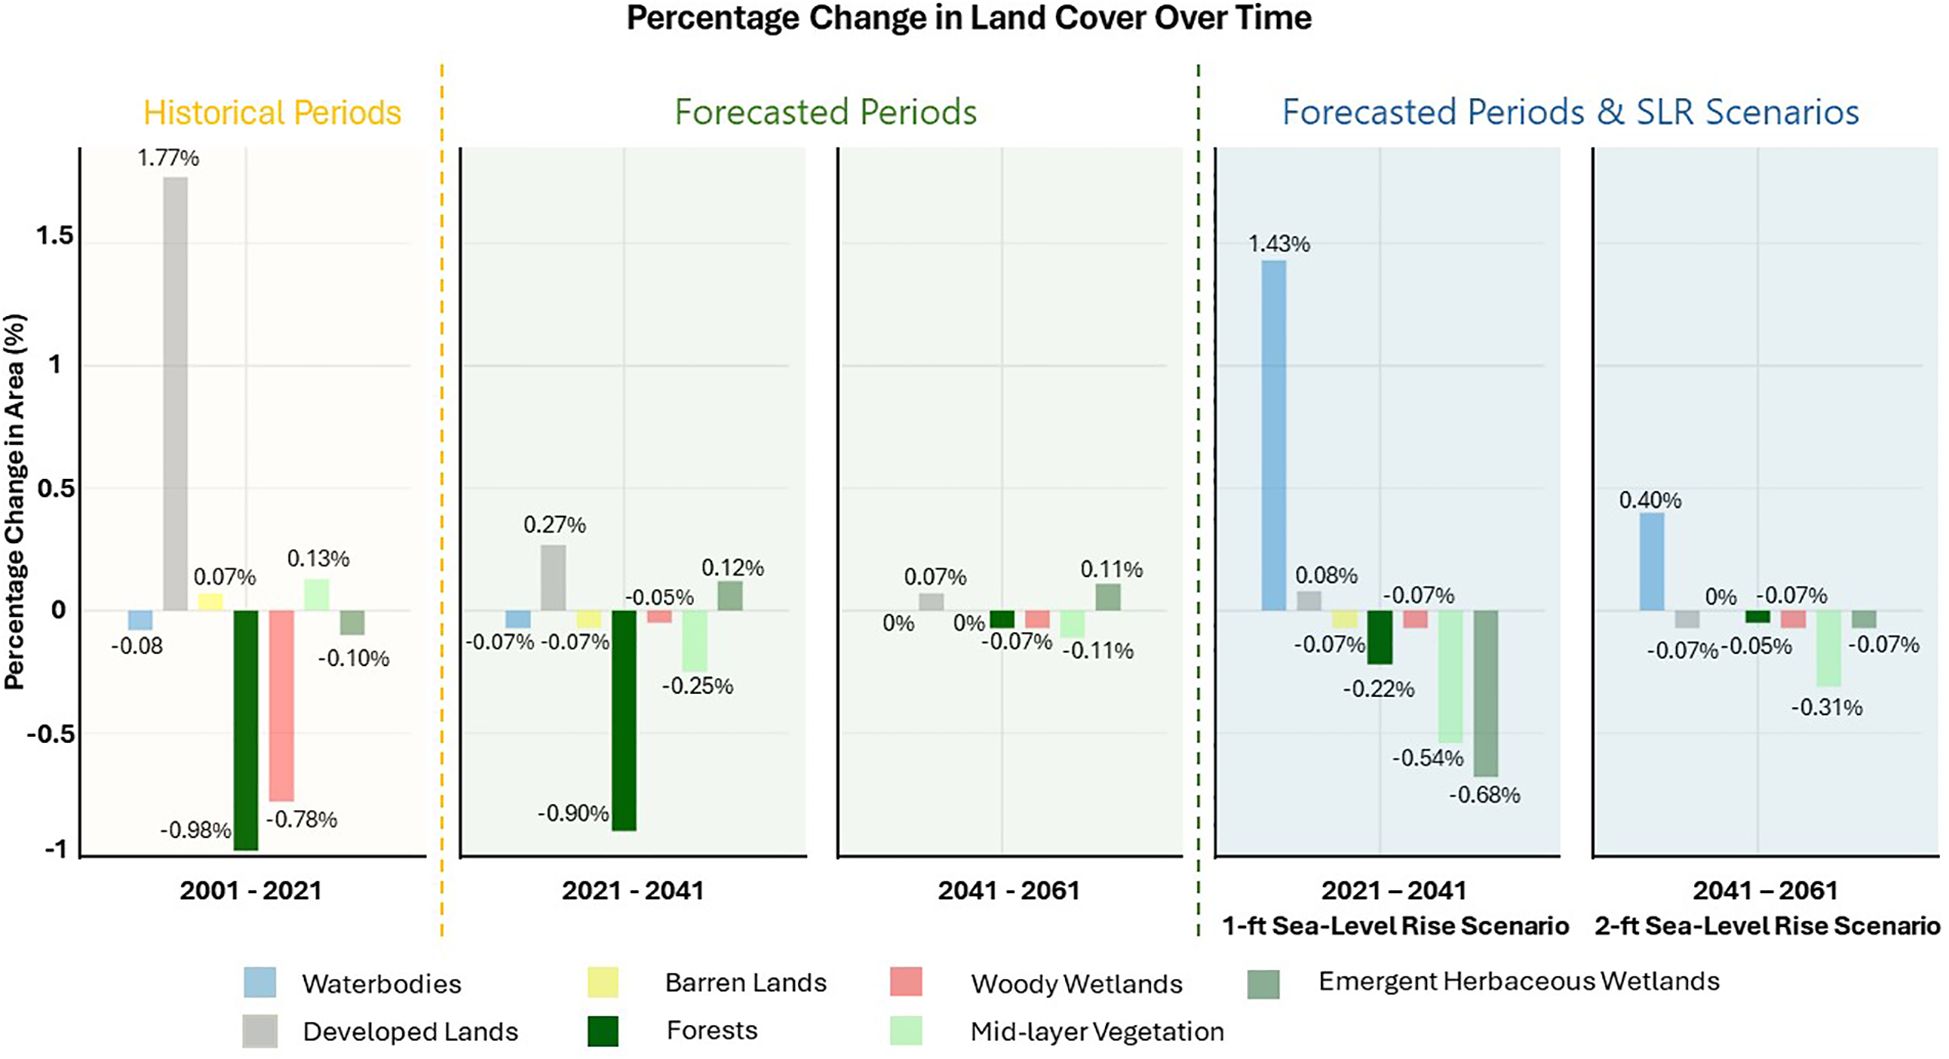
Figure 4. Percentage change in land cover showing the historic periods (2001–2021) followed by two forecasted periods (2021–2041 and 2041–2061) under two scenarios (without SLR and with SLR).

Figure 5. Forecast land cover (LC) maps were forecasted using the MOLUSCE plugin. (A, D, G, J) display projected LC maps for 2031, 2041, 2051, and 2061, respectively. (B, E, H, K) show forecasting LC in the Edgewood areas, while (C, F, I, L) depict forecasted LC in Spesutie Island for the same period.
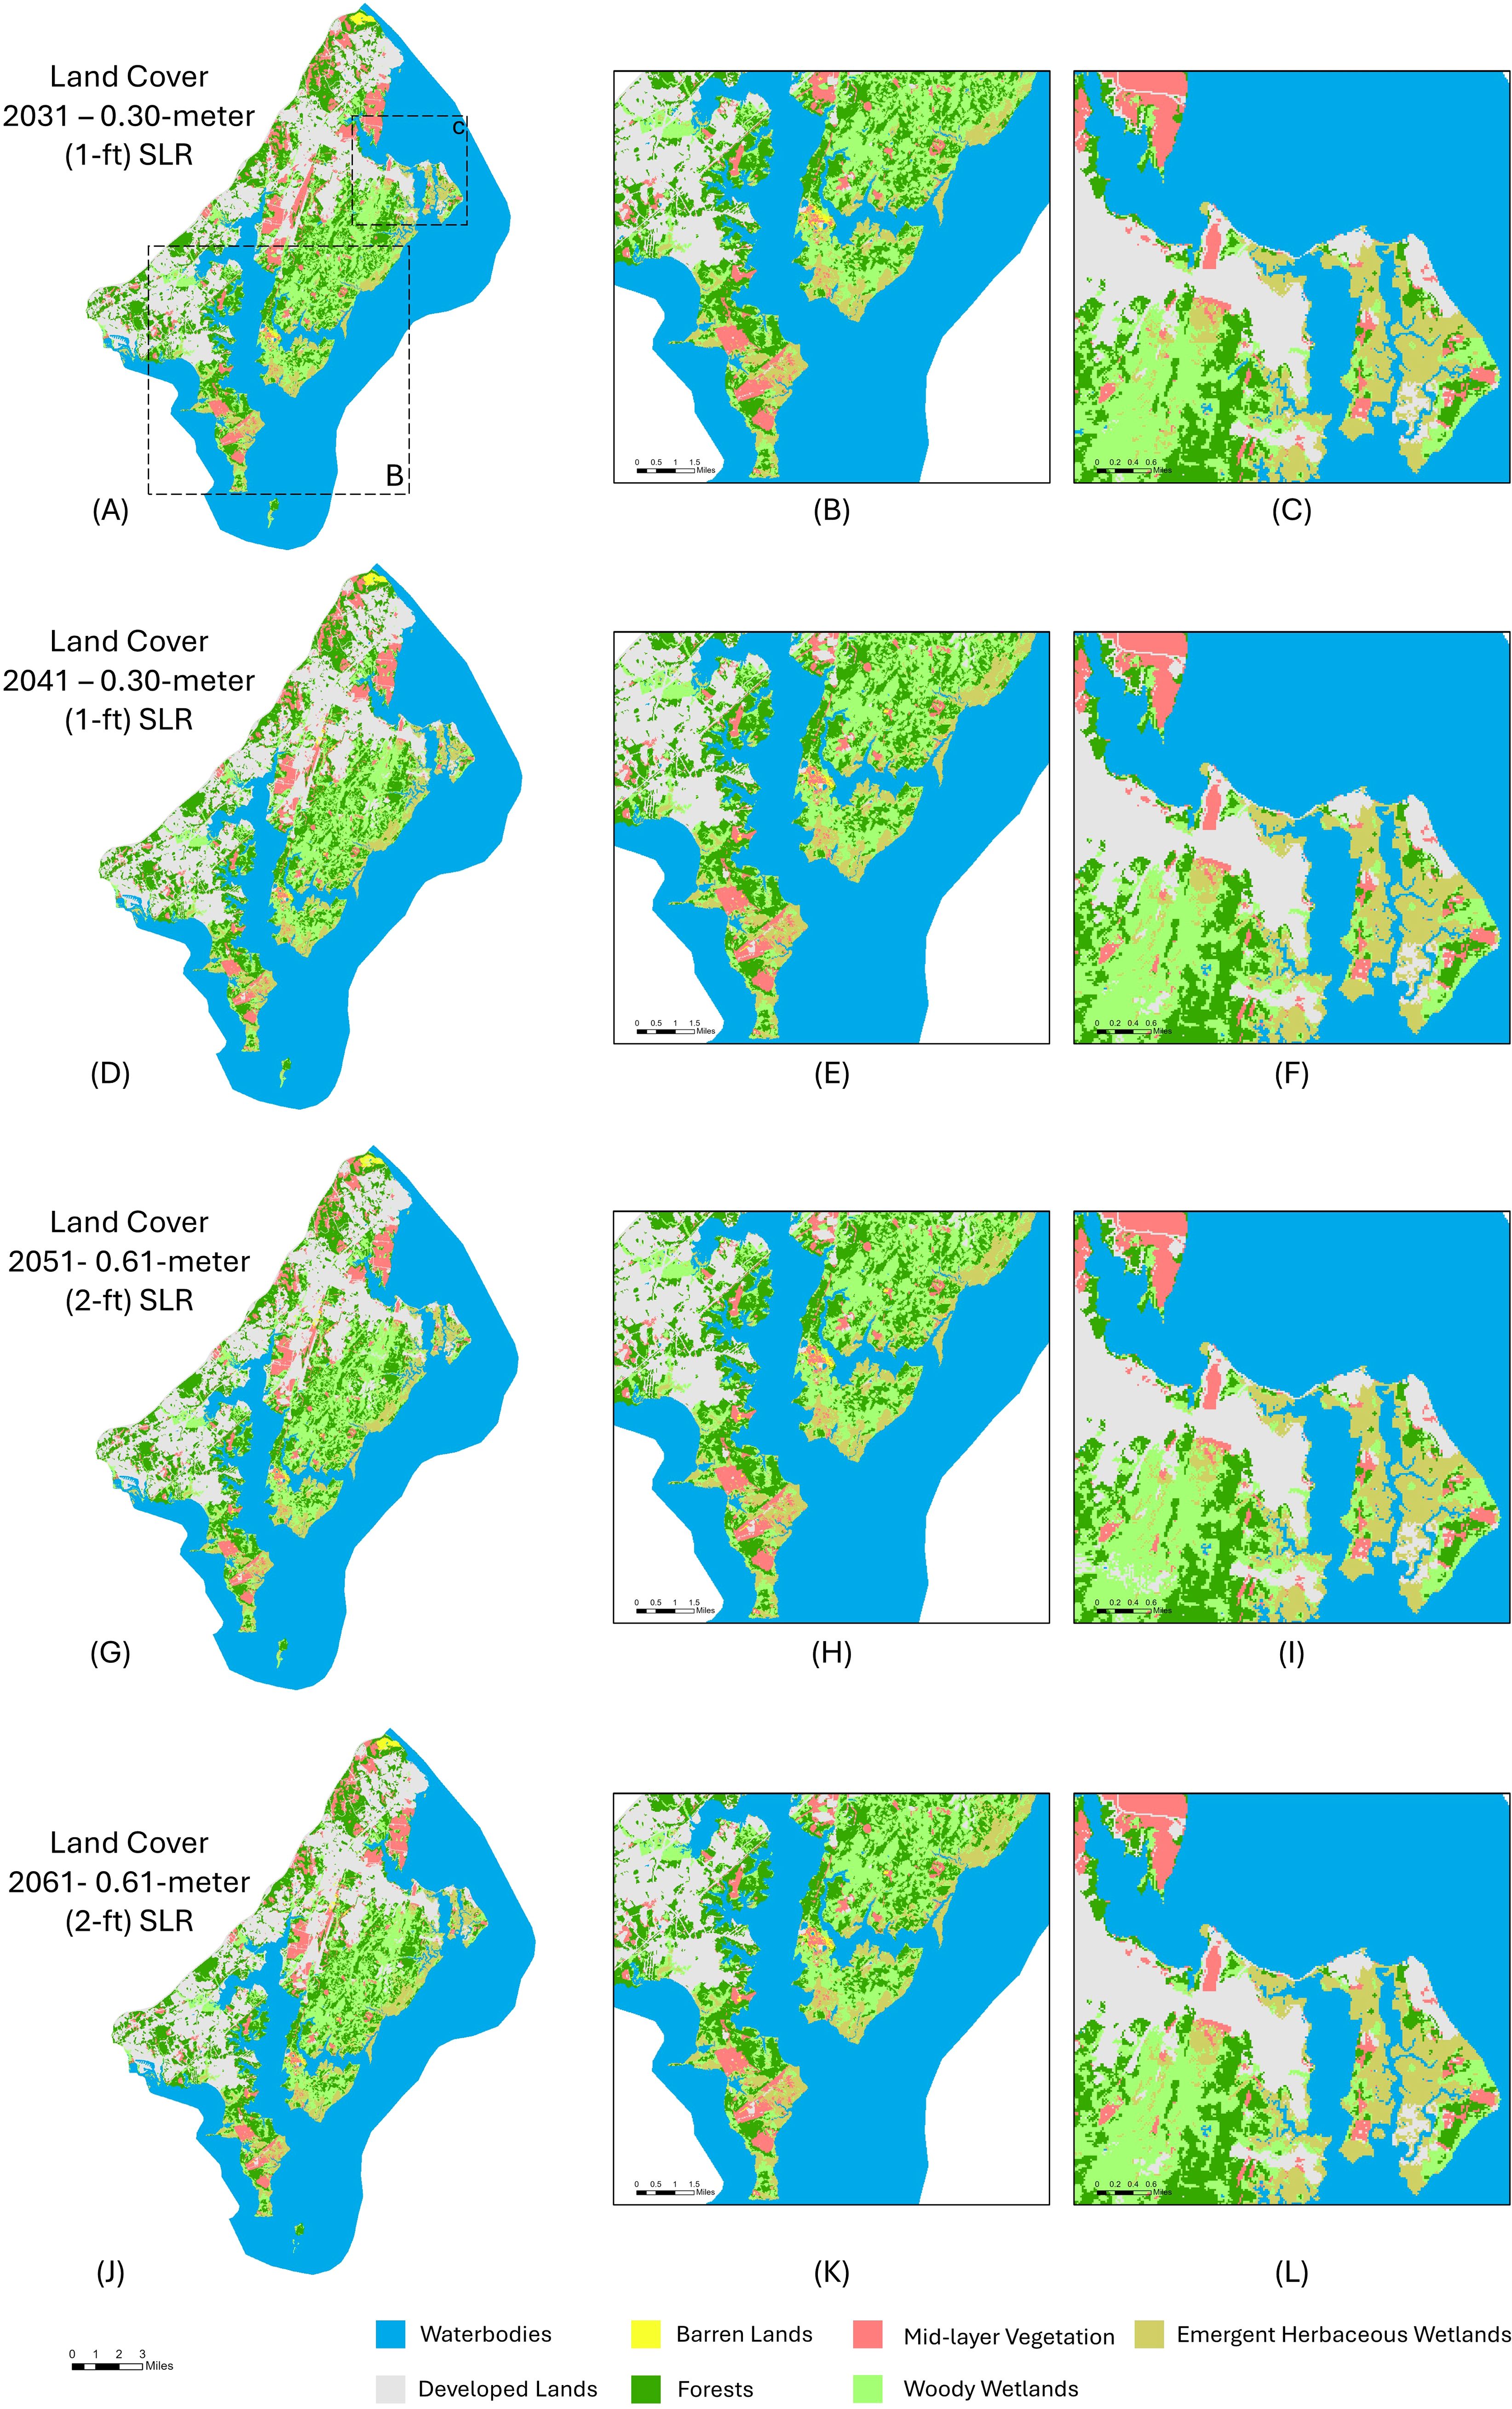
Figure 6. Forecasted land cover (LC) maps were generated using the MOLUSCE plugin under specified sea-level rise (SLR) scenarios. (A, D) illustrate the projected LC for 2031 and 2041 under a 0.30-m (1-ft) SLR scenario, while (G, J) depict the predicted LC for 2051 and 2061 under a 0.61-m (2-ft) SLR scenario. (B, E, H, K) show projected land cover in the Edgewood areas, while (C, F, I, L) show projected LC in Spesutie Island corresponding to the same periods and SLR scenarios.
Over the entire forecasted period (2021–2061), without considering SLR, WWs decreased 0.36% (-195 ha), while EHWs increased by 0.23% (125 ha), reversing the earlier trend. When SLR was considered, EHWs exhibited vulnerability, losing 0.68% (-366 ha) in the first forecast period. WWs declined by 0.25% (-135 ha) without SLR and by 0.54% (-291 ha) with SLR. In the second forecast period, EHWs showed a contrasting trend, increasing by 0.11% (62 ha) without SLR but decreasing 0.07% (-4 ha) with SLR. WWs followed a similar pattern, decreasing by 0.25% (-60 ha) without SLR and by 0.31% (-168 ha) with SLR. These modeled transitions do not account for dynamic processes related to SLR, such as sediment accretion, vegetation adaptation, or marsh migration. As a result, the model may overestimate loss in areas where wetlands could naturally adapt and underestimate loss in low-lying areas that are more susceptible to erosion or open-water expansion. Nonetheless, the findings provide a valuable baseline for understanding potential trends and identifying areas of heightened vulnerability.
Over the total study period (2001–2061), in the absence of SLR, MLV (-0.24%) and Forests (-0.11%) were the most vulnerable LC types (Table 4). Under SLR scenarios, EHWs and WWs exhibited the highest vulnerability, reflecting the intensified impact of rising water levels on wetland ecosystems. SLR led to an increase in Waterbodies and MLV, while all other LC types declined. Notably, EHWs decreased by 0.29% of ARC, and WWs decreased by 0.07% of ARC. Waterbodies showed a slight increase to 0.06% ARC under SLR. Developed Lands experienced a slight reduction in ARC, from 0.2% to 0.18% (-0.02%) under SLR, and Barren Lands also showed a similar trend, decreasing from 0.27% to 0.18% (-0.09%). In contrast, MLV remained relatively stable, suggesting that SLR had a minimal impact on its spatial distribution compared to other LC types.
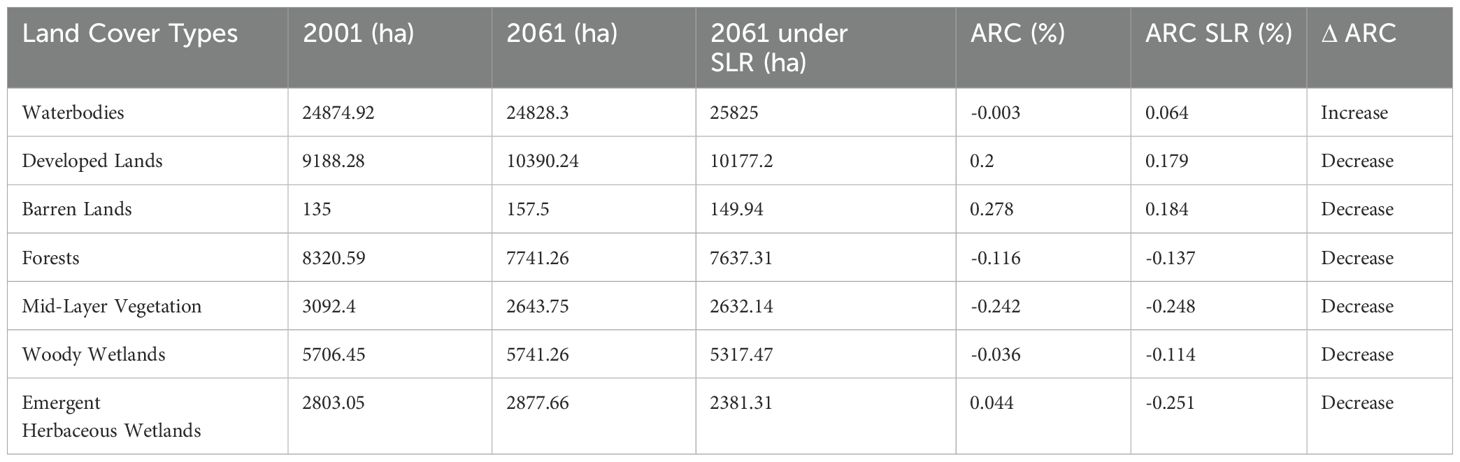
Table 4. Calculating the annual rate of changes between 2001 and 2061 with and without a 0.61-m (2-ft) sea-level rise scenario.
3.2 Carbon storage and sequestration
Carbon storage is impacted by the various types of carbon pools in the system, which include plant biomass (aboveground biomass and belowground biomass), soil organic carbon, and litter (Table 5). Of the different carbon pools, in 2016, the aboveground biomass (C_above) and soil organic carbon (C_soil) pools demonstrated the highest amount of carbon stored compared to the other two pools calculated. Conversely, the standing dead carbon pool (C_dead) contained the least carbon storage.
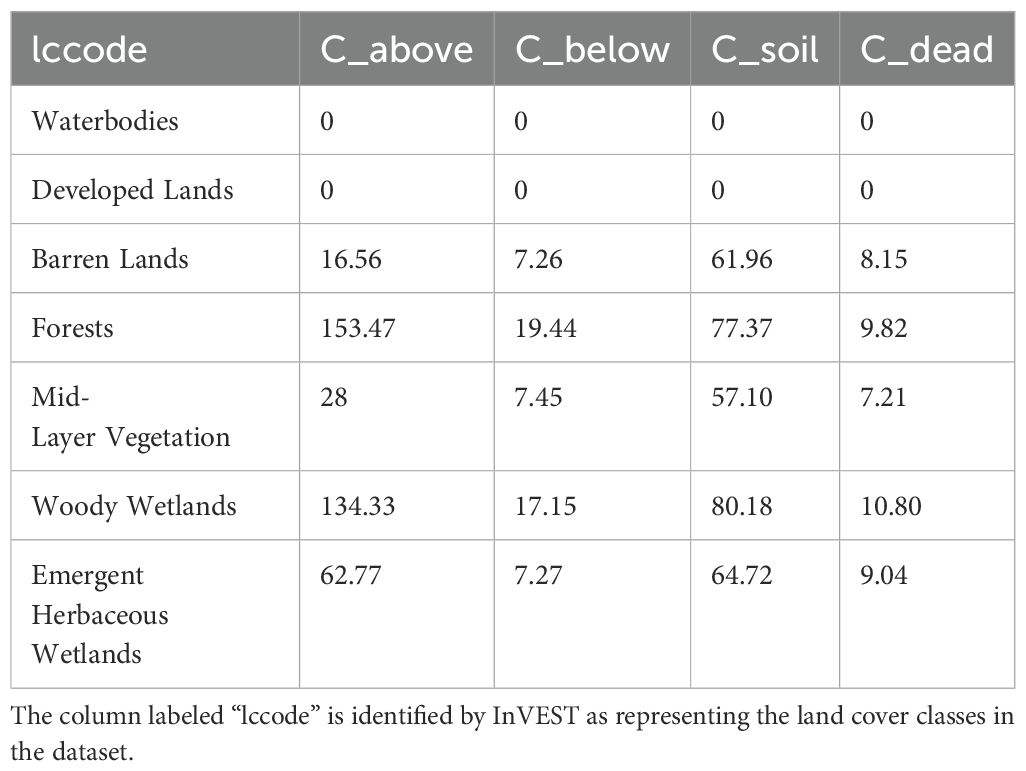
Table 5. The amount of carbon stored in each carbon pool (Mg/ha) in 2016.
Of the LC types, Forests, WWs, and EHWs exhibited higher carbon storage in their respective carbon sinks compared to MLV and Barren lands. Waterbodies and Developed Lands are consistently assigned a carbon storage value of zero across all scenarios. However, aquatic ecosystems do have the potential to sequester carbon, at a minimum through SAV. The extent of SAV within the study area was estimated based on historical trends. Historical data indicate that the SAV coverage was 3,638 ha in 2021. The linear regression analysis revealed that the Low-SAV scenario (1984–2021) showed moderate explanatory power (R² = 0.467) with a statistically significant p-value of 3.14 × 10⁻⁶ for the estimated coefficient. The High-SAV scenario (2012–2017) had higher correlation (R² = 0.975) with a coefficient p-value of 2.4 × 10⁻⁴. Based on these trends, projected SAV coverages under the Low-SAV scenario are 4,224 ha, 4,920 ha, 5,616 ha, and 6,312 ha for the years 2031, 2041, 2051, and 2061, respectively. For the High-SAV scenario, the estimates are 6,203 ha, 8,642 ha, 11,081 ha, and 13,520 ha for the same periods. This study assumes that freshwater-SAV contributes 0.123 Mg C per acre (0.304 Mg C per ha) in the Chesapeake Bay through soil carbon burial (Maryland Department of the Environment and Maryland Department of Natural Resources, 2023). Based on this assumption, the carbon sequestration for the years 2016 and 2021 is estimated to be 755.44 and 1,105.95 Mg C, respectively. Under the Low- SAV scenario, the projected carbon sequestration for 2031, 2041, 2051, and 2061 is estimated to be 1,284.1 Mg C, 1,495.68 Mg C, 1,707.26 Mg C, and 1,918.84 Mg C, respectively. For the High- SAV scenario, the projected carbon sequestration is 1,885.71 Mg C, 2,627.16 Mg C, 3368.62 Mg C, and 4110.08 Mg for the same years.
There isa strong link between LC changes and carbon storage, with Forests, WWs, and EHWs identified as key carbon-storing ecosystems. However, all three are projected to decline, especially under SLR scenarios, leading to reduced CSS. The InVEST model results indicate that total carbon storage at APG rises in 2031 before declining, showing increased CO2 release over time. From 2021 to 2031, carbon storage temporarily increases from 4,103,391 Mg C to 4,142,943 Mg C in scenarios excluding SLR, driven by forest expansion; the primary carbon sink in the APG landscape. By 2061, carbon storage is projected to reach 4,059,312 Mg C in the absence of SLR, accompanied by a sequestration loss of -54,086 Mg C. The NPV of this sequestration loss is estimated at -$42,036,296, -$40,571,004, and -$38,866,865 under the No-SAV, Low-SAV, and High-SAV scenarios, respectively. However, when accounting for SLR, carbon storage declines to 3,894,892 Mg C, with a substantially greater sequestration loss of -218,505 Mg C. This accelerated loss translates into a more pronounced economic impact, with the NPV reductions of -$169,933,082, -$168,440,790, and -$166,736,651 for the No SAV, Low SAV, and High SAV scenarios, respectively (Table 6).
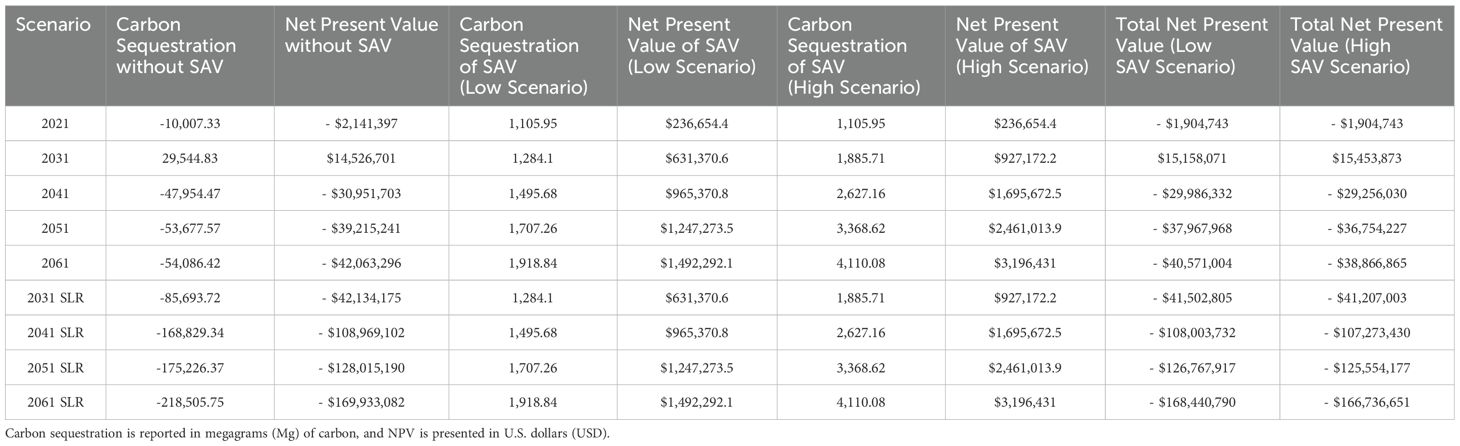
Table 6. Carbon sequestration and net present value (NPV) under varying levels of Submerged Aquatic Vegetation (SAV) inclusion (none, low, and high) across two scenarios: without sea-level rise (SLR) and with SLR.
Overall, results confirm the sensitivity of EHWs under SLR scenarios as well as the expected long-term degradation of WWs, and increased deforestation. In the absence of SLR scenarios, Developed Lands and EHWs expanded. However, the impacts of SLR on existing LC and overall coastal ecosystem trends indicate a decline, highlighting the vulnerability of these landscapes to rising sea levels.
3.3 Design considerations
This study proposes the implementation of 765 ha of TLP as an NBS for shoreline restoration (Figure 7). Given an estimated cost of $19,521.31 per ha, the total projected investment required for this conservation effort amounts to $14,936,502. By integrating nature-based strategies, this approach mitigates coastal erosion, enhances habitat resilience, and contributes to carbon sequestration and the long-term sustainability of coastal ecosystems. This financial assessment highlights the economic viability of strategic land preservation as a cost-effective adaptation measure against climate-induced shoreline and ecosystem changes.
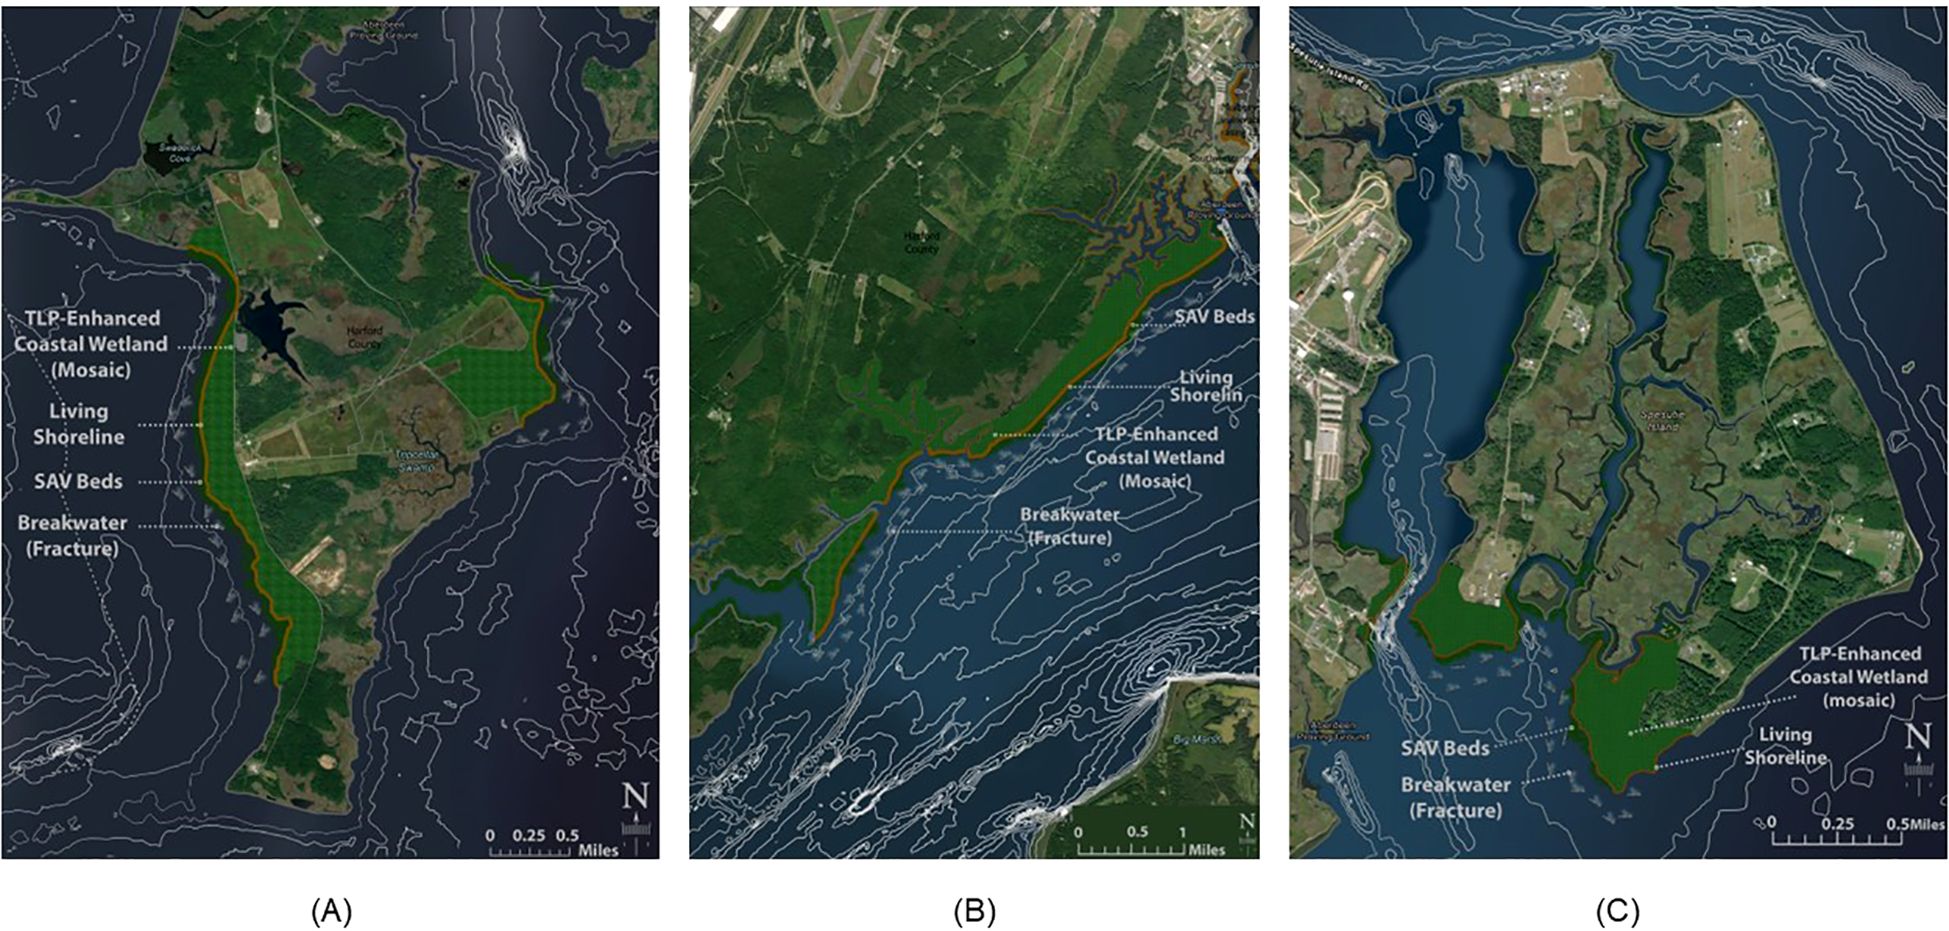
Figure 7. Design Concepts to Mitigate the Most Vulnerable Areas of APG from Sea-Level Rise Impacts: (A) H-I Field, (B) Taylor Island, and (C) Spesutie Island.
4 Discussion
In the context of Chesapeake Bay, SLR emerges as a critical climate change indicator (Ezer et al., 2013) with profound implications for LC transitions, particularly in coastal and wetland ecosystems (Eggleston and Pope, 2013; Molino et al., 2022). SLR exacerbates land degradation and habitat loss while also diminishing ecosystem services, including carbon sequestration, among others (Smith, 2023; Sklar et al., 2021). These compounded effects exacerbate the climate crisis and further diminish the resilience of coastal systems, which is particularly critical when considering the number of contaminated coastal industrial sites. This study underscores the necessity of understanding the synergies between LC changes and climate drivers, such as SLR, to enhance coastal resilience and inform LC strategies to mitigate carbon emissions and preserve existing ecosystems and their associated services in vulnerable coastal regions like the APG.
A significant gap in the literature pertains to the validation methods used for predictive models in LULC forecasting. Many studies (Mubako et al., 2022; Aneesha Satya et al., 2020; Abbas et al., 2021; Kamaraj and Rangarajan, 2022; Muhammad et al., 2022; Yatoo et al., 2020; Saha et al., 2022; Wang et al., 2023; Fernandes et al., 2020; and Roy et al., 2024), predominantly rely on the overall Kappa statistic as a measure of model accuracy when comparing predictions to historical data. However, this approach can oversimplify spatial complexities and overlook important nuances in model performance, which are crucial for making robust future LULC predictions. This study addresses this gap by utilizing more comprehensive validation metrics, such as the F1-score, which accounts for class imbalances and offers a more detailed assessment of model performance. Additionally, some studies (Aneesha Satya et al., 2020; Abbas et al., 2021; Muhammad et al., 2022; Yatoo et al., 2020; Wang et al., 2023; and Roy et al., 2024), extend the Kappa statistic to evaluate future LULC projections. The application of Kappa for validating future projections presents a fundamental limitation, lacking future data validation. Kappa is excluded in scenario 472 predictions to ensure the credibility of future LULC projections and their implications for CSS.
Historical trend analysis between 2001 and 2021 suggests that urbanization may contribute to a decline in upland vegetation. However, other factors, such as salinization, may also play a role in this reduction. Additionally, the decrease in EHWs coverage is likely linked to coastal erosion. Conversely, the increase in WWs may be attributed to changes in the water table, influenced by seasonal precipitation, groundwater fluctuations, or land use practices affecting hydrology.
For future scenarios (2021-2061), urbanization continued to rise without SLR, but showed a decline when SLR was included. Forests and MLV declined under both scenarios, with more pronounced losses under SLR. Wetland dynamics displayed contrasting trends: EHWs expanded in the absence of SLR, but suffered significant losses when SLR was incorporated, while WWs experienced a sharper decline under SLR (Figure 7). A notable finding is the inland migration of EHWs in response to rising water levels, reflecting a natural retreat pattern. As marshes move inland, they adapt to increasing water levels, which in turn impacts adjacent ecosystems by altering salinity, affecting vegetation, and reshaping overall ecosystem composition (Alizad et al., 2018; Crosby et al., 2016; SChile et al., 2014; Morris et al., 2002). The results (Figure 3) align with these ecosystem trends, illustrating the interactions between wetland systems and surrounding landscapes under the influence of SLR.
The projected negative net carbon sequestration under SLR and non-SLR scenarios highlights a potential shift from carbon sequestration to emission, underscoring the need for targeted climate mitigation strategies. The Low and High SAV scenarios at APG do not significantly impact atmospheric carbon regulation despite integrating SAV as a potential carbon sink. This study also emphasizes that the degradation or loss of land directly leads to the decline of coastal ecosystems, reducing their carbon storage capacity (Figure 8); an essential factor in climate change mitigation. As a result, APG continues to experience substantial negative carbon sequestration and NPV, reinforcing the need for strategic intervention. Future studies should explore the economic feasibility of using low-cost NBS to protect contaminated land threatened by SLR. Approaches such as living shorelines (Davenport et al., 2018) and TLP (McCullough et al., 2021; Morris and Staver, 2024) have emerged as viable solutions to enhance coastal resilience in Maryland Chesapeake Bay region.
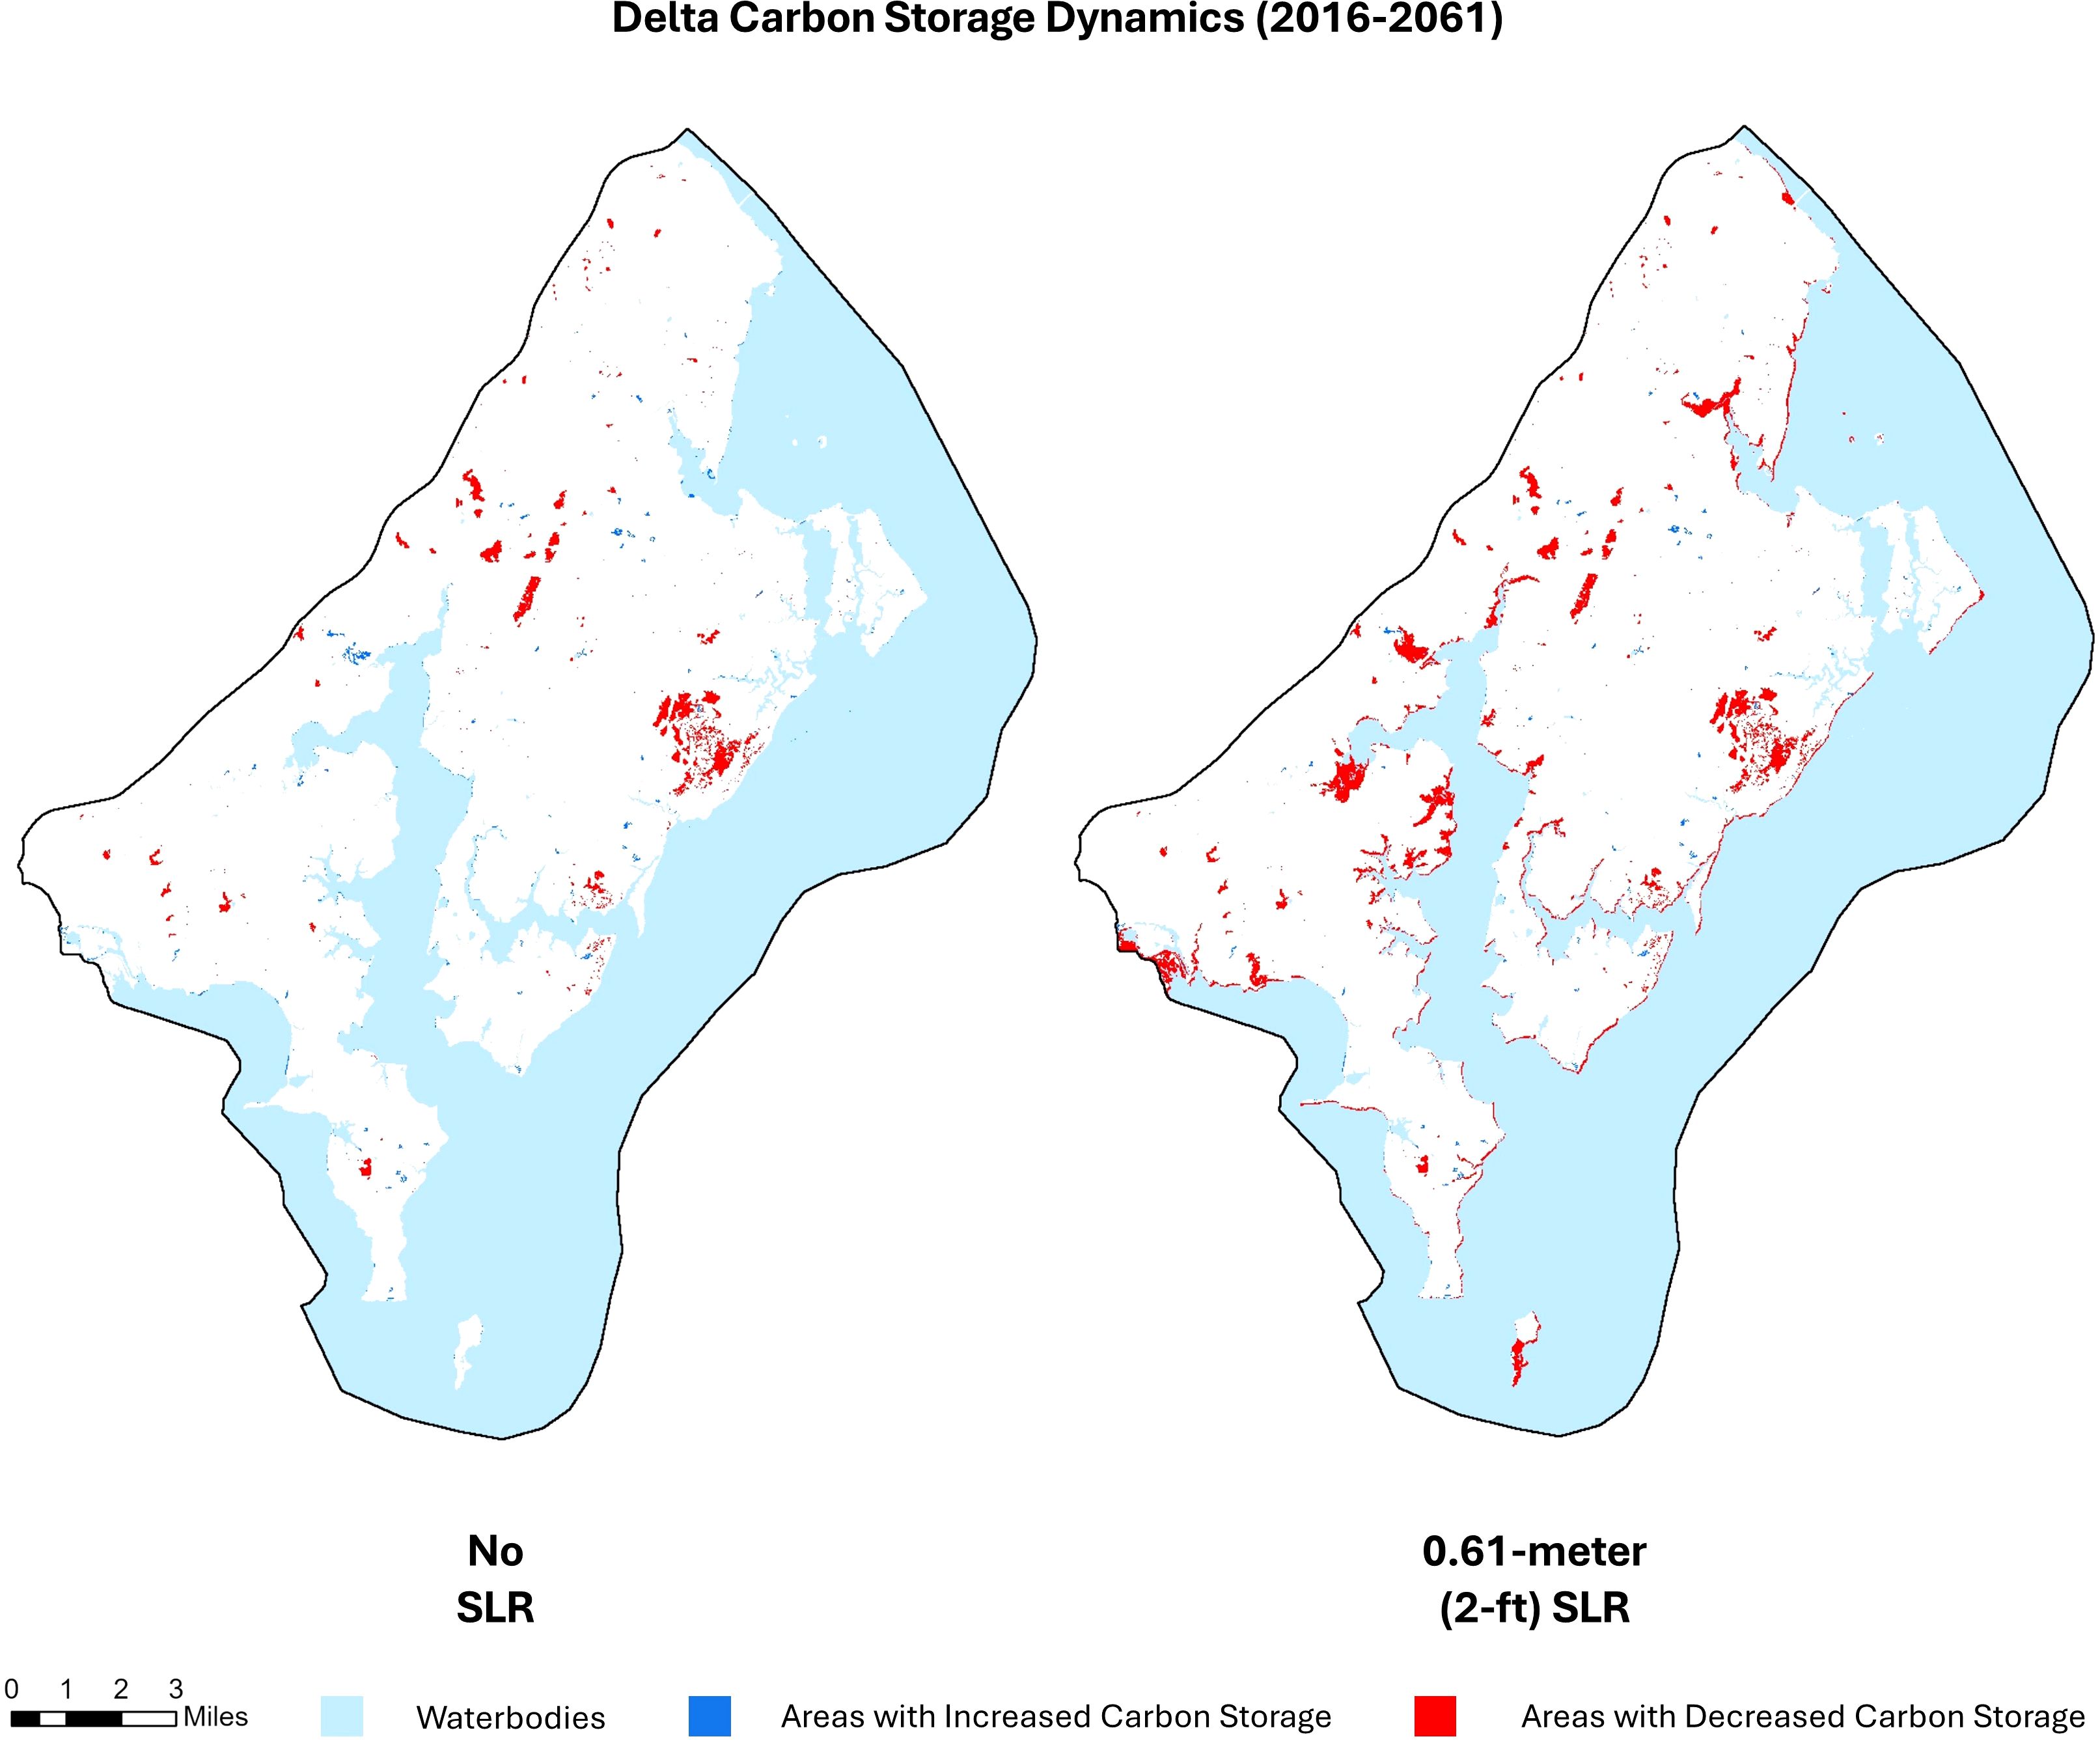
Figure 8. Delta carbon storage dynamics (2016–2061): mapping vulnerable emission hotspots with and without a 0.61-m (2-ft) sea-level rise scenario.
Conceptual design strategies for living and hybrid shorelines were developed to explore ways to mitigate the impacts of SLR at APG and TLP as an option for protecting against coastal erosion. A previous site suitability analysis identified optimal locations for such interventions based on environmental parameters (Sadaf et al., 2025), while an earlier stakeholder study delineated priority areas of concern for local decision-makers (U.S. Environmental Protection Agency, 2025). Leveraging these foundational insights, this phase of the study explored integrated coastal resilience strategies, incorporating TLP, vegetative stabilization, and structural reinforcements to enhance shoreline stability and maintain ecosystem functionality in response to future climate stressors. For instance, TLP offers a promising approach to enhance marsh persistence by supporting vertical elevation gain, thereby helping wetlands maintain their position longer as SLR, while not precluding the potential for upland migration where space allows. TLP plays a crucial role in preserving essential carbon sinks and serves as an effective strategy for enhancing marsh resilience by rebuilding marshes and potentially slowing their rate of disappearance. As highlighted by Morris and Staver (2024), the effectiveness of a TLP strategy is influenced by factors such as the rate of SLR, tidal range, vegetation growth dynamics, ecosystem service valuation, and dredging costs. Their findings indicate that, in the middle of Chesapeake Bay, maximum carbon sequestration in low marshes is achieved when three 15 cm sediment layers are applied at 30-year intervals under an SLR rate of 0.57 cm/year (Morris and Staver, 2024).
Additional case studies and modeling are required to confirm if cost may remain prohibitive. The cost of implementing TLP is approximately $14.93 million, in contrast to the potential loss of over $166 million in NPV. Although our current modeling framework does not explicitly simulate marsh elevation change from TLP interventions, it can be adapted to assess the potential carbon benefits of such strategies. By coupling modeled carbon loss trajectories with plausible TLP implementation scenarios, such as those described by Morris and Staver (2024), the volume of carbon emissions potentially avoided by enhancing marsh longevity can be estimated. These avoided emissions can then be compared to intervention costs using either the social cost of carbon or market-based carbon pricing to conduct a back-of-the-envelope cost-effectiveness analysis. Moreover, framing these trade-offs within the Resist–Accept–Direct (RAD) decision-making framework (Climate Adaptation Science Centers, 2025) offers a structured pathway for resource managers to evaluate TLP as resistance to wetland loss and in relation to broader adaptation strategies. Applying RAD could help align ecological goals, stakeholder values, and economic realities to guide long-term resilience planning under climate change. Krebs et al. (2024) conducted a comprehensive assessment of the carbon storage potential of SAV under existing conditions and various restoration scenarios within Florida’s Caloosahatchee Estuary. Their study effectively integrated observational data, field experiments, and small-scale laboratory simulations, providing a robust framework for evaluating controlled and uncontrolled environmental influences on SAV dynamics. While previous studies in the Chesapeake Bay region have provided essential benchmarks for estimating carbon sequestration potential per ha, access limitations due to the military status of APG necessitated an alternative approach. This study introduces a straightforward methodology, employing regression analysis to estimate future SAV extent in ha and its associated carbon sequestration potential; a pioneering application within the field of landscape architecture. Given the increasing availability of high-resolution remote sensing technologies, future research at APG would benefit from integrating historical datasets with satellite or aerial imagery and using deep learning to refine estimations of SAV distribution over time, enabling more precise assessments of its role in carbon sequestration within coastal military installations.
This study also opens avenues for further research. While MOLUSCE effectively models major LC transitions, it is less suited to capturing dynamic wetland responses of SLR. For instance, wetlands inundated by SLR may not transition directly to open water, but may pass through intermediate stages, such as transitional wetlands. As a result, there is potential for both over- and under-estimation of wetland change, depending on site-specific conditions. Future research could incorporate a process-based model, such as the Sea Level Affecting Marshes Model (SLAMM), to improve the representation of wetland evolution under SLR scenarios, particularly for flood-prone types such as woody wetlands and emergent herbaceous wetlands. Integrating social dimensions into spatial variables is also essential to evaluate the human impact on carbon dynamics and LC changes. Utilizing NASA’s datasets along with field-verified carbon data will further strengthen the credibility and precision of carbon modeling efforts at APG. Lastly, enhancing the InVEST model by integrating ecological processes, such as recovery, succession, and carbon transfers between carbon pools, will allow for more comprehensive and accurate predictions. These improvements will contribute to a more holistic approach to understanding and mitigating climate change impacts on coastal ecosystems.
5 Conclusion
This study aims to enhance the understanding of LC dynamics in climate regulation by investigating projected LC changes at a military coastal site, APG, with and without the influence of SLR. It evaluates the subsequent impacts on CSS services, using future LC projections to assess the net loss or gain of these services. Accurate LC predictions are essential for proactive planning and for guiding efforts to prioritize and implement NBS that enhance resilience. This study contributes to strategic decision-making for safeguarding these vulnerable locations against evolving environmental threats by assessing the economic feasibility of NBS in protecting critical at-risk infrastructure.
The findings are categorized into three primary areas: historical trends (2001–2021), predictive trends without SLR (2021–2061), and predictive trends with SLR (2021–2061). The historical data analysis reveals an increase in developed land from 2001 to 2021, while forested areas and MLV declined. Furthermore, a contradictory interaction and dynamic shift between woody and EHWs were observed over time; WWs expanded, whereas EHWs diminished. The predictive analysis without SLR shows developed land expanding between 2021 and 2041, with minimal growth afterward. Forested areas and MLV declined. An inverse trend is evident, with WWs declining and EHWs expanding, primarily driven by the encroachment of developed lands and competition between these wetland types. Predictive trends with SLR show that EHWs are the most sensitive to SLR, and there is a potential for long-term degradation of WWs, and increased deforestation, highlighting SLR compounding effects on coastal ecosystems. Developed lands experienced a reduction when SLR was considered highlighting the broader impact of rising sea levels on land use.
A positive correlation exists between LC changes in coastal ecosystems and CSS, indicating that shifts in LC significantly influence these ecosystems capacity to capture and store carbon. The 2061 carbon projections under a 0.61-m SLR scenario reveal a substantial carbon loss, underscoring the urgent need for effective mitigation strategies to address environmental impacts at coastal military installations like APG.
While this study extends its projections up to 2061, the implementation of NBS, such as living shorelines and TLP, would necessitate further analysis to assess their long-term effectiveness, beginning from 2031 through 2061. For instance, predictions for 2031 serve as a baseline: without SLR, carbon sequestration is projected at 29,545 Mg C. However, under a 0.30-m SLR scenario, a sequestration loss of 85,694 Mg C is anticipated, resulting in an NPV loss of $42 million in the non-SAV scenario and $41 million in both the High and Low SAV scenarios. Future studies must align these baseline findings with the application of NBS to evaluate their impact beyond 2031, a scope not addressed in this current study.
Data availability statement
The original contributions presented in the study are included in the article/supplementary material. Further inquiries can be directed to the corresponding author.
Author contributions
MT: Conceptualization, Data curation, Formal Analysis, Investigation, Methodology, Software, Validation, Visualization, Writing – original draft, Writing – review & editing, Project administration, Resources. JB: Formal Analysis, Writing – review & editing, Conceptualization, Funding acquisition, Project administration, Supervision, Resources, Visualization. MV: Writing – review & editing, Formal Analysis, Methodology. ET: Writing – review & editing, Validation, Methodology. AA: Formal Analysis, Writing – review & editing. AS: Writing – review & editing, Investigation. JP: Formal Analysis, Funding acquisition, Project administration, Writing – review & editing.
Funding
The author(s) declare that financial support was received for the research and/or publication of this article. This multi-year research project, “DEEDS” (Developing Engineering Practices using Ecosystem Design Solutions) for the Future Army, was funded and supported by the US Department of Defense and the US Army Corps of Engineers, ERDC Contracting Office under Contract No. W912HZ-22-2-0015.
Conflict of interest
The authors declare that the research was conducted in the absence of any commercial or financial relationships that could be construed as a potential conflict of interest.
Generative AI statement
The author(s) declare that Generative AI was used in the creation of this manuscript. During the preparation of this work, the author(s) used Chat GPT in order ‘to restructure some of the already written sentences. After using this tool/service, the author(s) reviewed and edited the content as needed and take(s) full responsibility for the content of the publication.
Publisher’s note
All claims expressed in this article are solely those of the authors and do not necessarily represent those of their affiliated organizations, or those of the publisher, the editors and the reviewers. Any product that may be evaluated in this article, or claim that may be made by its manufacturer, is not guaranteed or endorsed by the publisher.
References
Abbas Z., Yang G., Zhong Y., and Zhao Y. (2021). Spatiotemporal change analysis and future scenario of LULC using the CA-ANN approach: A case study of the greater bay area, China. Land 10, 584. doi: 10.3390/land10060584
Alberti M., Marzluff J. M., Shulenberger E., Bradley G., Ryan C., and Zumbrunnen C. (2003). Integrating humans into ecology: opportunities and challenges for studying urban ecosystems. BioScience 53, 1169–1179. doi: 10.1641/0006-3568(2003)053[1169:IHIEOA]2.0.CO;2
Alizad K., Hagen S. C., Medeiros S. C., Bilskie M. V., Morris J. T., Balthis L., et al. (2018). Dynamic responses and implications to coastal wetlands and the surrounding regions under sea level rise. PloS One 13, e0205176. doi: 10.1371/journal.pone.0205176
Alshari E. A. and Gawali B. W. (2022). Modeling land use change in Sana’a city of Yemen with MOLUSCE. J. Sensors. 2022, 7419031. doi: 10.1155/2022/7419031
Amini S., Saber M., Rabiei-Dastjerdi H., and Homayouni S. (2022). Urban land use and land cover change analysis using random forest classification of landsat time series. Remote Sens. 14, 2654. doi: 10.3390/rs14112654
Aneesha Satya B., Shashi M., and Deva P. (2020). Future land use land cover scenario simulation using open source GIS for the city of Warangal, Telangana, India. Appl. Geomat. 12, 281–290. doi: 10.1007/s12518-020-00298-4
Avtar R., Rinamalo A. V., Umarhadi D. A., Gupta A., Khedher K. M., Yunus A. P., et al. (2022). Land use change and prediction for valuating carbon sequestration in Viti Levu island, Fiji. Land 11, 1274. doi: 10.3390/land11081274
Bacani V. M., da Silva B. H. M., de Souza Amede Sato A. A., Sampaio B. D. S., da Cunha E. R., Vick E. P., et al. (2024). Carbon storage and sequestration in a eucalyptus productive zone in the Brazilian Cerrado, using the Ca-Markov/Random Forest and InVEST models. J. Cleaner. Product. 444, 141291. doi: 10.1016/j.jclepro.2024.141291
Boesch D. F., Baecher G. B., Boicourt W. C., Cullather R. I., Dangendorf S., Henderson G. R., et al. (2023). Sea-level Rise Projections for Maryland 2023. Cambridge, Maryland: University of Maryland Center for Environmental Science.
Caponigro M. S. B. (2017). Climate Change Adaptation Strategies for Coastal Military Installations: Design and Planning Principles for Naval Facilities Engineering Command. (Doctoral dissertation). University of Washington, Seattle, Washington.
Charles S. P., Kominoski J. S., Armitage A. R., Guo H., Weaver C. A., and Pennings S. C. (2020). Quantifying how changing mangrove cover affects ecosystem carbon storage in coastal wetlands. Ecology 101, e02916. doi: 10.1002/ecy.2916
Chowdhury S. (2024). Comparison of accuracy and reliability of random forest, support vector machine, artificial neural network and maximum likelihood method in land use/cover classification of urban setting. Environ. Challenges. 14, 100800. doi: 10.1016/j.envc.2023.100800
Climate Adaptation Science Centers (2025). Resist–Accept–Direct (RAD) Framework. U.S. Geological Survey. Available online at: https://www.usgs.gov/programs/climate-adaptation-science-centers/science/resist-accept-direct-rad-framework (Accessed June 7, 2025).
Cohen-Shacham E., Walters G., Janzen C., and Maginnis S. (2016). Nature-based solutions to address global societal challenges Vol. 97 (Gland, Switzerland: IUCN), 2016–2036.
Crosby S. C., Sax D. F., Palmer M. E., Booth H. S., Deegan L. A., Bertness M. D., et al. (2016). Salt marsh persistence is threatened by predicted sea-level rise. Estuarine. Coast. Shelf. Sci. 181, 93–99. doi: 10.1016/j.ecss.2016.08.018
Davenport T. M., Seitz R. D., Knick K. E., and Jackson N. (2018). Living shorelines support nearshore benthic communities in upper and lower Chesapeake Bay. Estuaries. Coasts. 41, 197–206. doi: 10.1007/s12237-017-0361-8
Department of Defense. (2019). Report on Effects of a Changing Climate to the Department of Defense. Office of the Under Secretary of Defense for Acquisition and Sustainment. Washington, D.C.: U.S. Department of Defense. Available online at: https://media.defense.gov/2019/jan/29/2002084200/-1/-1/1/climate-change-report-2019.pdf (Accessed January 11, 2025).
Dubayah R. O., Swatantran A., Huang W., Duncanson L., Johnson K., Tang H., et al. (2018). LiDAR Derived Biomass, Canopy Height and Cover for Tri-State (MD, PA, DE) Region, V2. Oak Ridge, TN: ORNL DAAC. doi: 10.3334/ORNLDAAC/1538
EA Engineering, Science, and Technology, Inc., PBC (2022). Draft data gathering and synthesis report: Coastal resilience and natural infrastructure research—Aberdeen Proving Ground and adjacent areas (Version: DRAFT, EA Project No. 637430700). Hunt Valley, Maryland: EA Engineering, Science, and Technology, Inc., PBC.
Eggleston J. and Pope J. (2013). Land subsidence and relative sea-level rise in the southern Chesapeake Bay region. No. 1392. Richmond, Virginia: U.S. Geological Survey.
Estrada G. C. D., Soares M. L. G., Fernadez V., and de Almeida P. M. M. (2015). The economic evaluation of carbon storage and sequestration as ecosystem services of mangroves: a case study from southeastern Brazil. Int. J. Biodivers. Sci. Ecosyst. Serv. Manage. 11, 29–35. doi: 10.1080/21513732.2014.963676
Ezer T. and Atkinson L. P. (2014). Accelerated flooding along the U.S. East coast: on the impact of sea level rise, tides, storms, the Gulf Stream, and the North Atlantic Oscillations. Earth’s. Future 2, 362–382. doi: 10.1002/2014EF000252
Ezer T., Atkinson L. P., Corlett W. B., and Blanco J. L. (2013). Gulf Stream's induced sea level rise and variability along the US mid-Atlantic coast. J. Geophysical Research: Oceans 118 (2), 685–697. doi: 10.1002/jgrc.20091
Fernandes M. M., Fernandes M. R. d. M., Garcia J. R., Matricardi E. A. T., de Almeida A. Q., Pinto A. S., et al. (2020). Assessment of land use and land cover changes and valuation of carbon stocks in the Sergipe semiarid region, Brazil: 1992–2030. Land. Use Policy 99, 104795. doi: 10.1016/j.landusepol.2020.104795
Fonnum F., Paukstys B., Zeeb B. A., and Reimer K. J. (2012). Environmental contamination and remediation practices at former and present military bases. (Dordrecht, Netherlands: Springer Science & Business Media), 48
Freire S., Santos T., and Tenedório J. A. (2009). Recent urbanization and land use/land cover change in Portugal—the influence of coastline and coastal urban centers. J. Coast. Res., II (56), 1499–1503. doi: 10.1080/10106049.2014.927535
Fry J. A., Xian G., Jin S., Dewitz J. A., Homer C. G., Yang L., et al. (2011). Completion of the 2006 national land cover database for the conterminous United States. Photogrammetr. Eng. Remote Sens. 77(9).
Gidey E., Dikinya O., Sebego R., Segosebe E., and Zenebe A. (2017). Cellular automata and Markov Chain (CA_Markov) model-based predictions of future land use and land cover scenarios, (2015–2033) in Raya, northern Ethiopia. Modeling. Earth Syst. Environ. 3, 1245–1262. doi: 10.1007/s40808-017-0397-6
GIS-Lab (2014). Landscape Change Analysis with MOLUSCE – Methods and Algorithms. Available online at: https://wiki.gis-lab.info/w/Landscape_change_analysis_with_MOLUSCE_-_methods_and_algorithms (Accessed September 18, 2024).
González-García A., Arias M., García-Tiscar S., Alcorlo P., and Santos-Martín F. (2022). National blue carbon assessment in Spain using InVEST: Current state and future perspectives. Ecosyst. Serv. 53, 101397. doi: 10.1016/j.ecoser.2021.101397
Haseeb M., Tahir Z., Mehmood S. A., Gill S. A., Farooq N., Butt H., et al. (2024). Enhancing carbon sequestration through afforestation: Evaluating the impact of land use and cover changes on carbon storage dynamics. Earth Syst. Environ. 8, 1563–1582. doi: 10.1007/s41748-024-00414-z
Hill K., Hirschfeld D., Lindquist C., Cook F., and Warner S. (2023). Rising coastal groundwater as a result of sea-level rise will influence contaminated coastal sites and underground infrastructure. Earth’s. Future 11, e2023EF003825. doi: 10.1029/2023EF003825
Hill J., Stellmes M., and Wang C. (2014). “Land transformation processes in NE China: tracking trade-offs in ecosystem services across several decades with Landsat-TM/ETM+ time series,” in Land Use and Land Cover Mapping in Europe: Practices & Trends (Springer Netherlands, Dordrecht), 383–409.
Jia M. M. (2014). Remote sensing analysis of China’s mangrove forests dynamics during 1973 to 2013 (Changchun, China: Northeast Institute of Geography and Agroecology, Chinese Academy of Sciences).
Kamaraj M. and Rangarajan S. (2022). Predicting the future land use and land cover changes for Bhavani basin, Tamil Nadu, India, using QGIS MOLUSCE plugin. Environ. Sci. pollut. Res. 29, 86337–86348. doi: 10.1007/s11356-021-17904-6
Kang J., Zhang L., Meng Q., Wu H., Hou J., Pan J., et al. (2025). Land use and carbon storage evolution under multiple scenarios: A spatiotemporal analysis of beijing using the PLUS-inVEST model. Sustainability 17, 1589. doi: 10.3390/su17041589
Kauffman J.B. and Donato D. C. (2012). Protocols for the measurement, monitoring and reporting of structure, biomass and carbon stocks in mangrove forests Vol. 86 (Bogor, Indonesia: Cifor).
Keesstra S., Nunes J., Novara A., Finger D., Avelar D., Kalantari Z., et al. (2018). The superior effect of nature based solutions in land management for enhancing ecosystem services. Sci. Total. Environ. 610, 997–1009. doi: 10.1016/j.scitotenv.2017.08.077
Knoke T., Gosling E., and Paul C. (2020). Use and misuse of the net present value in environmental studies. Ecol. Econ. 174, 106664. doi: 10.1016/j.ecolecon.2020.106664
Krebs B. M., Iadevaia N., Hecker J., and Douglass J. G. (2024). A simple approach to estimating the nutrient and carbon storage benefits of restoring submerged aquatic vegetation, applied to Vallisneria americana in the Caloosahatchee Estuary, Florida, USA. Ecol. Eng. 200, 107167. doi: 10.1016/j.ecoleng.2023.107167
Lee L. (2021). Military Communities and Natural Hazards in the United States. (master's thesis). University of South Carolina, Columbia, South Carolina.
Li J., Chen X., Kurban A., Van de Voorde T., De Maeyer P., and Zhang C. (2021). Coupled SSPs-RCPs scenarios to project the future dynamic variations of water-soil-carbon-biodiversity services in Central Asia. Ecol. Indic. 129, 107936. doi: 10.1016/j.ecolind.2021.107936
Li X., Huang C., Jin H., Han Y., Kang S., Liu J., et al. (2022). Spatio-temporal patterns of carbon storage derived using the InVEST model in Heilongjiang Province, Northeast China. Front. Earth Sci. 10, 846456. doi: 10.3389/feart.2022.846456
Luisetti T., Turner R.K., Andrews J. E., Jickells T. D., Kröger S., Diesing M., et al. (2019). Quantifying and valuing carbon flows and stores in coastal and shelf ecosystems in the UK. Ecosyst. Serv. 35, 67–76. doi: 10.1016/j.ecoser.2018.10.013
Macreadie P. I., Costa M. D. P., Atwood T. B., Friess D. A., Kelleway J. J., Kennedy H., et al. (2021). Blue carbon as a natural climate solution. Nat. Rev. Earth Environ. 2, 826–839. doi: 10.1038/s43017-021-00224-1
Maithani S. (2015). Neural networks-based simulation of land cover scenarios in Doon valley, India. Geocarto. Int. 30, 163–185.
Mallick J., Almesfer M. K., Alsubih M., Ahmed M., and Kahla N. B. (2022). Estimating carbon stocks and sequestration with their valuation under a changing land use scenario: a multi-temporal research in Abha city, Saudi Arabia. Front. Ecol. Evol. 10, 905799. doi: 10.3389/fevo.2022.905799
Maurya K., Mahajan S., and Chaube N. (2021). Remote sensing techniques: Mapping and monitoring of mangrove ecosystem—A review. Complex Intelligent Syst. 7 (6), 2797–2818.
Maryland Department of the Environment and Maryland Department of Natural Resources (2022). Maryland Blue Carbon Flux: Estuarine Wetlands and Submerged Aquatic Vegetation—Data and Methodology Documentation. Prepared for the 2020 Maryland Greenhouse Gas Inventory. Annapolis, Maryland: Maryland Department of the Environment and Maryland Department of Natural Resources (Accessed January 6, 2023).
McCullough F.A., Curson D. R., Meyers E., and Whitbeck M. W. (2021). Tidal marsh restoration at blackwater national wildlife refuge, maryland: A case study in thin-layer placement. Shore. Beach. 89, 13–20. doi: 10.34237/01
Michener W. K., Blood E. R., Bildstein K. L., Brinson M. M., and Gardner L. R. (1997). Climate change, hurricanes and tropical storms, and rising sea level in coastal wetlands. Ecol. Appl. 7, 770–801. doi: 10.1890/1051-0761(1997)007[0770:CCHATS]2.0.CO;2
Miller J. and Foran C. (2012). Development of cleanup technologies for the management of US military installations Vol. 362 (London: The Geological Society of London).
Mishra V. N. and Rai P. K. (2016). A remote sensing aided multi-layer perceptron-Markov chain analysis for land use and land cover change prediction in Patna district (Bihar), India. Arabian. J. Geosci. 9, 1–18. doi: 10.1007/s12517-015-2138-3
Molino G. D., Carr J. A., Ganju N. K., and Kirwan M. L. (2022). Variability in marsh migration potential determined by topographic rather than anthropogenic constraints in the Chesapeake Bay region. Limnol. Oceanogr. Lett. 7, 321–331. doi: 10.1002/lol2.10262
Moritsch M. M., Young M., Carnell P., Macreadie P. I., Lovelock C., Nicholson E., et al. (2021). Estimating blue carbon sequestration under coastal management scenarios. Sci. Total. Environ. 777, 145962. doi: 10.1016/j.scitotenv.2021.145962
Morris J. T., Sundareshwar P. V., Nietch C. T., Kjerfve B., and Cahoon D. R. (2002). Responses of coastal wetlands to rising sea level. Ecology 83, 2869–2877. doi: 10.1890/0012-9658(2002)083[2869:ROCWTR]2.0.CO;2
Morris J. T. and Staver L. W. (2024). Elevation changes in restored marshes at Poplar Island, Chesapeake Bay, MD: II. Modeling the importance of marsh development time. Estuaries Coasts 47 (7), 1799–1813. doi: 10.1007/s12237-024-01226-4
Mubako S., Nnko H. J., Peter K. H., and Msongaleli B. (2022). Evaluating historical and predicted long-term land use/land-cover change in Dodoma Urban District, Tanzania: 1992–2029. Phys. Chem. Earth. Parts. A/B/C. 128, 103205. doi: 10.1016/j.pce.2022.103205
Muhammad R., Zhang W., Abbas Z., Guo F., and Gwiazdzinski L. (2022). Spatiotemporal change analysis and prediction of future land use and land cover changes using QGIS MOLUSCE plugin and remote sensing big data: a case study of Linyi, China. Land 11, 419. doi: 10.3390/land11030419
Natural Capital Project. (2025). InVEST 3.14.2. Stanford University, University of Minnesota, Chinese Academy of Sciences, The Nature Conservancy, World Wildlife Fund, Stockholm Resilience Centre and the Royal Swedish Academy of Sciences. Available online at: https://naturalcapitalproject.stanford.edu/software/invest (Accessed January 24, 2024).
Nasiri V., Darvishsefat A. A., Rafiee R., Shirvany A., and Hemat M. A. (2019). Land use change modeling through an integrated multi-layer perceptron neural network and Markov chain analysis (case study: Arasbaran region, Iran). J. Forest. Res. 30, 943–957. doi: 10.1007/s11676-018-0659-9
Nordhaus W. D. (2017). Revisiting the social cost of carbon. Proc. Natl. Acad. Sci. 114 (7), 1518–1523. doi: 10.1073/pnas.1609244114
Pache R.-G., Abrudan I. V., and Niță M.-D. (2020). Economic valuation of carbon storage and sequestration in Retezat National Park, Romania. Forests 12 (1), 43. doi: 10.3390/f12010043
Pham T. D., Xia J., Ha N. T., Bui D. T., Le N. N., and Takeuchi W. (2019). A review of remote sensing approaches for monitoring blue carbon ecosystems: Mangroves, seagrasses and salt marshes during 2010–2018. Sensors 19, 1933. doi: 10.3390/s19081933
Piecuch C. G. (2020). Likely weakening of the Florida Current during the past century revealed by sea-level observations. Nat. Commun. 11 (1), 3973. doi: 10.1038/s41467-020-17761-w
Pontius R. G. Jr and Millones M. (2011). Death to Kappa: birth of quantity disagreement and allocation disagreement for accuracy assessment. Int. J. Remote Sens. 32, 4407–4429. doi: 10.1080/01431161.2011.552923
Pourvahab M., Mousavirad S. J., Felizardo V., Pombo N., Zacarias H., Mohammadigheymasi H., et al. (2025). A cluster-based opposition differential evolution algorithm boosted by a local search for ECG signal classification. J. Comput. Sci. 86, 102541. doi: 10.1016/j.jocs.2025.102541
Radwan T. M., Blackburn G.A., Duncan Whyatt J., and Atkinson P. M. (2021). Global land cover trajectories and transitions. Sci. Rep. 11, 12814. doi: 10.1038/s41598-021-92256-2
Raposa K. B., Woolfolk A., Endris C. A., Fountain M. C., Moore G., Tyrrell M., et al. (2023). Evaluating thin-layer sediment placement as a tool for enhancing tidal marsh resilience: A coordinated experiment across eight US National estuarine research reserves. Estuaries. Coasts. 46, 595–615. doi: 10.1007/s12237-022-01161-y
Ravindranath N. H. and Somashekhar B. S. (1995). Potential and economics of forestry options for carbon sequestration in India. Biomass Bioenergy 8, 323–336. doi: 10.1016/0961-9534(95)00025-9
Roy S. K., Alam T., Mojumder P., Mondal I., Kafy A.-A., Dutta M., et al. (2024). Dynamic assessment and prediction of land use alterations influence on ecosystem service value: A pathway to environmental sustainability. Environ. Sustainabil. Indic. 21, 100319. doi: 10.1016/j.indic.2023.100319
Ruhl J. B. (2010). Ecosystem services and federal public lands: start-up policy questions and research needs. Duke. Envtl. L. Pol’y. F. 20, 275. doi: 10.2139/ssrn.1543388
Sadaf A., Bruck J., and Tahmasebi M. (2025). A comparative evaluation of GIS spatial analysis tools for prioritizing natural and hybrid shoreline solutions. Ann. GIS. 31 (1), 1–23. doi: 10.1080/19475683.2025.2452264
Saha S., Bera B., Shit P. K., Bhattacharjee S., and Sengupta N. (2022). Estimation of carbon budget through carbon emission-sequestration and valuation of ecosystem services in the extended part of Chota Nagpur Plateau (India). J. Cleaner. Product. 380, 135054. doi: 10.1016/j.jclepro.2022.135054
SChile L. M., Callaway J. C., Morris J. T., Stralberg D., Thomas Parker V., and Kelly M. (2014). Modeling tidal marsh distribution with sea-level rise: evaluating the role of vegetation, sediment, and upland habitat in marsh resiliency. PloS One 9, e88760. doi: 10.1371/journal.pone.0088760
SChile L. M., Kauffman J.B., Crooks S., Fourqurean J. W., Glavan J., and Megonigal J.P. (2017). Limits on carbon sequestration in arid blue carbon ecosystems. Ecol. Appl. 27, 859–874. doi: 10.1002/eap.1489
Scullion J. J., Vogt K. A., Sienkiewicz A., Gmur S. J., and Trujillo C. (2014). Assessing the influence of land-cover change and conflicting land-use authorizations on ecosystem conversion on the forest frontier of Madre de Dios, Peru. Biol. Conserv. 171, 247–258.
Sea Grant. (2025). Thin Layer Placement Assessment Framework: Cost Analysis (South Carolina Sea Grant Consortium). Available online at: https://www.scseagrant.org/thin-layer-placement-assessment-framework/:~:text=Cost%20Analysis,through%20consultations%20with%20dredging%20contractors (Accessed March 22, 2025).
Sharma R., Pradhan L., Kumari M., Bhattacharya P., Mishra V. N., and Kumar D. (2024). Spatio-temporal assessment of urban carbon storage and its dynamics using inVEST model. Land 13, 1387. doi: 10.3390/land13091387
Sklar F. H., Carlson C., Coronado-Molina C., and Maran A. C. (2021). Coastal ecosystem vulnerability and sea level rise (SLR) in South Florida: A mangrove transition projection. Front. Ecol. Evol. 9, 646083. doi: 10.3389/fevo.2021.646083
Smith A. J. (2023). Ecosystem transitions and state changes rapidly alter the coastal carbon landscape: Evidence from the Chesapeake Bay region (The College of William and Mary).
Sun J., Wang Y., Lee T. M., Nie X., Wang T., Liang E., et al. (2024). Nature-based Solutions can help restore degraded grasslands and increase carbon sequestration in the Tibetan Plateau. Commun. Earth Environ. 5, 154. doi: 10.1038/s43247-024-01330-w
Sweet W. V., Hamlington B. D., Kopp R. E., Weaver C. P., Barnard P. L., Bekaert D., et al. (2022). Global and regional sea level rise scenarios for the United States: updated mean projections and extreme weather level probabilities along US coastlines. Silver Spring, MD: U.S. Department of Commerce, NOAA. Available online at: https://digitalcommons.unl.edu/cgi/viewcontent.cgi?article=1008&context=noaatr.
Thorne K. M., Freeman C. M., Rosencranz J. A., Ganju N. K., and Guntenspergen G. R. (2019). Thin-layer sediment addition to an existing salt marsh to combat sea-level rise and improve endangered species habitat in California, USA. Ecol. Eng. 136, 197–208. doi: 10.1016/j.ecoleng.2019.05.011
Tyrrell M. C. (2020). “Sediment Augmentation: Approaches and Outcomes.” PowerPoint slides. Waquoit Bay Reserve. Available online at: https://www.waquoitbayreserve.org/wp-content/uploads/Tyrrell_Sediment-Augmentation.pdf (Accessed March 2, 2025).
Ulmas P. and Liiv I. (2020). Segmentation of satellite imagery using u-net models for land cover classification. arXiv. preprint. arXiv:2003.02899. doi: 10.48550/arXiv.2003.02899
U.S. Environmental Protection Agency (2025). Aberdeen Proving Ground (Michaelsville Landfill). Available online at: https://cumulis.epa.gov/supercpad/cursites/csitinfo.cfm?id=0300421 (Accessed March 16, 2025).
Virginia Institute of Marine Science (VIMS) (2023). SAV Monitoring & Restoration. Available online at: https://www.vims.edu/research/units/programs/sav/reports/ (Accessed March 1, 2025).
Wang A., Zhang M., Kafy A.-A., Tong B., Hao D., and Feng Y. (2023). Predicting the impacts of urban land change on LST and carbon storage using InVEST, CA-ANN and WOA-LSTM models in Guangzhou, China. Earth Sci. Inf. 16, 437–454. doi: 10.1007/s12145-022-00875-8
Witjes M., Parente L., van Diemen C. J., Hengl T., Landa M., Brodský L., et al. (2022). A spatiotemporal ensemble machine learning framework for generating land use/land cover time-series maps for Europe, (2000–2019) based on LUCAS, CORINE and GLAD Landsat. PeerJ 10, e135735. doi: 10.7717/peerj.13573
Xin X., Zhang T., He F., Zhang W., and Chen K. (2023). Assessing and simulating changes in ecosystem service value based on land use/cover change in coastal cities: A case study of Shanghai, China. Ocean. Coast. Manage. 239, 106591. doi: 10.1016/j.ocecoaman.2023.106591
Yang L., Jin S., Danielson P., Homer C., Gass L., Bender S. M., et al. (2018). A new generation of the United States National Land Cover Database: Requirements, research priorities, design, and implementation strategies. ISPRS. J. Photogrammet. Remote Sens. 146, 108–123. doi: 10.1016/j.isprsjprs.2018.09.006
Yatoo S. A., Sahu P., Kalubarme M. H., and Kansara B. B. (2020). Monitoring land use changes and its future prospects using cellular automata simulation and artificial neural network for Ahmedabad city, India. GeoJournal, 1–22. doi: 10.1007/S10708-020-10274-5
Keywords: coastal land cover, ecosystem services, carbon storage and sequestration, MOLUSCE, InVEST
Citation: Tahmasebi M, Bruck J, Volk M, Tepe E, Alakshendra A, Sadaf A and Puleo JA (2025) Coastal carbon at risk: forecasting the impacts of sea-level rise on future land cover. Front. Ecol. Evol. 13:1608422. doi: 10.3389/fevo.2025.1608422
Received: 08 April 2025; Accepted: 11 June 2025;
Published: 14 July 2025.
Edited by:
Amanda Tritinger, Engineer Research and Development Center (ERDC), United StatesReviewed by:
David Walters, United States Department of the Interior, United StatesSydney Crisanti, Engineer Research and Development Center (ERDC), United States
Copyright © 2025 Tahmasebi, Bruck, Volk, Tepe, Alakshendra, Sadaf and Puleo. This is an open-access article distributed under the terms of the Creative Commons Attribution License (CC BY). The use, distribution or reproduction in other forums is permitted, provided the original author(s) and the copyright owner(s) are credited and that the original publication in this journal is cited, in accordance with accepted academic practice. No use, distribution or reproduction is permitted which does not comply with these terms.
*Correspondence: Mojtaba Tahmasebi, bW9qdGFiYXRhaG1hc2ViaUB1ZmwuZWR1