 Guanming Guo
 Helin Zhang
- 1Key Laboratory of Low Altitude Geographic Information and Air Route of Jiangxi Education Institutes, Jiangxi Flight University, Nanchang, Jiangxi, China
- 2Key Laboratory of Poyang Lake Wetland and Watershed Research, School of Geography and Environment, Jiangxi Normal University, Nanchang, Jiangxi, China
Introduction: It is a critical issue in ecology to identify mechanisms of biodiversity maintenance. Many theoretical studies have revealed that intransitive competition among species on shared dispersal networks can promote species coexistence,while little attention is paid to the effect of unshared dispersal networks on ecosystem stability. The classic intransitive competition in an ecological community is the rock-paper-scissors game,where species A excludes B, B outcompetes C, and C can displace A.
Methods: Here, we explore the relationships between dispersal network heterogeneity and rock-paper-scissors dynamics by using a cellular automation model with its underlying species abundances and extinction generation.
Results: Only one species remains in the ecosystem eventually when all species utilize the same dispersal network and the extinction of generations of the first species is the lowest on a scale-free network under the same condition. On the contrary, the fluctuation size of ecological dynamics is negatively correlated with dispersal network heterogeneity on unshared networks. Ecosystem stability is a paradox, namely, between shared and unshared networks. Furthermore, the dispersal rates of species also show the opposite result for ecosystem stability on shared vs. unshared networks.
Discussion: Therefore, we represent a potential maintenance mechanism of biodiversity.
Introduction
Ecologists have long sought to explore ecosystem stability in ecological communities (May, 1972). Evolutionary tournament theory has played an important role in researching the evolution of frequency dependence in community ecology (Parker et al., 1972; Hofbauer and Sigmund, 2003). There are many applications of evolutionary game theory in ecology (Hamilton, 1967; Parker et al., 1972; Maynard Smith and Price, 1973; Axelrod and Hamilton, 1981; Axelrod, 1984). The rock-paper-scissors game (Hofbauer and Sigmund, 1998), in which species A excludes species B, B excludes C, and C excludes A (i.e., the competitive ability of the species cannot be ranked in a hierarchy), is one of the simplest possible games and the most common case of competitive intransitivity (Gilpin, 1975; May and Leonard, 1975; José and Stefano, 2011). Intransitivity has been applied broadly in ecology (Huisman and Weissing, 1999; Huisman et al., 2001; Kerr et al., 2002; Laird and Schamp, 2006; Reichenbach et al., 2007; Laird and Schamp, 2008, Laird and Schamp, 2009; José and Stefano, 2011), as it facilitates species coexistence through rock-paper-scissors dynamics and promotes the coexistence of many more species with limited resources.
In nature, there are many examples of intransitive competition (Kerr et al., 2002; Laird and Schamp, 2006; Reichenbach et al., 2007; Menezes et al., 2022). For instance, there are three species in an ecosystem: lions, cheetahs, and leopards. Each of these predators has its own unique set of capabilities and hunting strategies. Lions can exclude cheetahs by overpowering them during group hunts. Cheetahs, in turn, can exclude leopards due to their unmatched speed, making it difficult for leopards to catch them. However, leopards can exclude lions by utilizing their climbing skills to access tree-dwelling prey that lions cannot easily reach. As a result, an intransitive competitive relationship emerges among these three predator species, where lions dominate cheetahs, cheetahs dominate leopards, and leopards dominate lions in terms of their hunting capabilities in specific situations or environments. This case demonstrates how niche differentiation generates species-specific competitive advantages across distinct ecological axes, establishing stabilized coexistence through intransitive interaction networks that prevent competitive exclusion. Many ecologists, recently, have applied a network approach to ecological issues. Network theory has been used to study persistence in spatial ecology (Cantwell and Forman, 1993; Urban and Keitt, 2001; Dale and Fortin, 2010). In the network, nodes represent available habitat patches, and links connected by these nodes indicate the dispersal pathways of species (Fortuna et al., 2009). Under a network-based spatial framework, the emergent properties of inter-patch connectivity surpass the importance of node-level characteristics in governing ecological processes. There have been many papers that researched coexistence among species by treating space as a network (Bascompte and Solé, 1995; Barthélémy, 2003; Dale and Fortin, 2010). However, due to the lack of a tradeoff between network features and competitiveness, it is still a challenge for theoretical ecologists to explain species coexistence in intransitive ecosystems.
There has been an increasing interest in the ecosystem stability of heterogeneous networks (Schreiber, 2010; Grilli et al., 2015; Gilarranz et al., 2017; Zhang et al., 2020). The majority of existing research studies assume that the dispersal networks are the same for all species (i.e., a shared network; e.g., Holland and Hastings, 2008). They neglect the fact that different species may have different dispersal pathways (Dondina et al., 2018). Furthermore, there are many cases in nature in which various species have distinct dispersal networks, resulting in anisotropic dispersal behaviors and creating different dispersal pathways (Urban and Keitt, 2001; Fortuna et al., 2006; Kininmonth et al., 2010; Bearup et al., 2013; Germain et al., 2019; Zhang et al., 2020). An unshared network means that each species uses a different dispersal network, namely, every species disperses through its own distinct ecological network (Zhang et al., 2020; Li et al., 2021). For instance, there are three separate dispersal networks in an ecosystem with three species. However, only a few articles have focused on the unshared network (Chesson, 2000; Snyder and Chesson, 2003). In a recent article, Calleja-Solanas et al. (2020) showed that stable coexistence can be achieved in a large community when local interaction is considered (Calleja-Solanas et al., 2020). A spatial site can be occupied by only one species and interactions between species are possible only between nodes in a certain ecosystem. The interactions include local and global competition. In that paper, every species has the same network and it only considers regular and random networks. However, unshared networks and more heterogeneous networks, including exponential and scale-free networks, have not been discussed. Moreover, there are various dispersal behaviors between regular, random, exponential, and scale-free networks in nature (Urban and Keitt, 2001; Fortuna et al., 2006; Grilli et al., 2015; Zhang et al., 2020).
In addition, recent research has successfully applied rock-paper-scissors dynamics to metapopulation networks, providing evidence that coexistence outcomes are jointly determined by mutation rates (Kabir and Tanimoto, 2021) and high-order interspecific interaction (Menezes et al., 2022). Furthermore, Huang et al. (2022) comprehensively summarized the research progress in intransitive competition ecosystems, elucidating its impacts on biodiversity and ecosystem processes.
While intransitive competition is recognized as an important mechanism for species maintenance (José and Stefano, 2011; Franz et al., 2024), the role of dispersal network heterogeneity remains underexplored, particularly in networks where species utilize distinct pathways (i.e., unshared networks) (Snyder and Chesson, 2003). Recent studies highlight that the network structure critically modulates species coexistence (Zhang et al., 2020; Franciélli et al., 2023), yet a systematic comparison of shared vs. unshared networks is lacking.
In this paper, we use a simple interaction rule (Calleja-Solanas et al., 2020) to discuss metapopulation dynamics in a dispersal network. Here, we utilize the rule to research how the stability of competitive species is affected in shared and unshared networks by changing network heterogeneity. In particular, we systematically discuss (1) whether and how species can coexist in shared and unshared networks within rock-paper-scissors games; and (2) how species diversity is affected by dispersal rate. Our work indicates that (1) unshared networks stabilize rock-paper-scissors dynamics by reducing species abundance fluctuations, contrasting sharply with shared networks, and (2) provides a possible mechanistic link between network heterogeneity and species extinction risk and (3) a framework to generalize dispersal-competition tradeoffs in rock-paper-scissors ecological systems.
Method
Heterogeneous dispersal networks
In this study, we consider four dispersal network structures. We assume that species can only disperse between linked habitat patches and every individual only inhabits one patch. The habitat patches are designated as network nodes and the dispersal pathways are represented by links within each node (Fortuna et al., 2009).
The network degree distribution is a significant characteristic of a dispersal network. The degree of a node can be represented by the number of other nodes connected to it directly. Here, the mean linking degree of the four typical network structures researched in this paper is equal to make the results comparable.
A. A regular network beginning from a lattice with n nodes and k links per node. Every node has the same degree in the network. This network describes a completely isotropic habitat. In this study, all the patches have four links (k=4). It is equivalent to a coupled map lattice where four nearest-neighbor dispersal links are connected (Bascompte and Solé, 1995; Zhang et al., 2020). In this paper, each patch of a regular network nests a new regular network.
B. A random network that is rewired at random with probability p. This allows us to tune the ring between regularity (p=0) and disorder (p=1), and so the probability is 0≤p ≤ 1 (Watts and Strogatz, 1998). The number of links connected to each node is variable while the mean linking degree per patch is the same (=4). The possibility of each node being connected to links satisfies a Poisson distribution (Erdös and Rényi, 1959). Each patch, in a random network, contains an additional random network in this study.
C. An exponential network based on the algorithm of random attachment, which generates an exponential linking degree distribution (Barabási and Albert, 1999). The network meets long-distance interactions, but the variability in degree is larger than the random network. It is more heterogeneous in the patch degree, although the mean linking degree is the same (Fortuna et al., 2006). Each patch of the exponential network contains a larger exponential network in this paper.
D. A scale-free network that complies with the generic algorithm of preferential attachment by Barabási and Albert (1999), which produces the most heterogeneous network (Kininmonth et al., 2010). In other words, a few nodes have many links while most have few connections. Its degree distribution follows a power-law distribution. In this study, every node in the scale-free network includes a scale-free network.
All the networks, in this research, have the same number of patches and the same number of total links to make the results comparable. Each node has at least one link to another node and all nodes can reach each other through links. Here, all the patches are considered undirected links and one patch can be occupied by only one species. In this case, if patches m1 and m2 are connected, dispersal can occur from m1 to m2 or vice versa.
In this study, a shared network means that all species disperse along the same path and their dispersal processes use the same network. However, unshared networks indicate that each species has its own diffusion network, such that the dispersal pathways of each species are different. For example, three species have three dispersal networks, the heterogeneity of which is the same. In addition, the network size was 16 patches in Figures 1, 2, and 3, with each patch embedding 1024-unit subnetworks. Figure 4, however, used smaller 100-unit subnetworks per patch. Furthermore, we standardized the connectivity by controlling the total number of connections in each network for the four network types with the same network size to ensure comparability. In addition, all the networks (regular, random, exponential, and scale-free) were constructed with identical node counts and mean degree (=4). For regular networks, nodes were connected to the four nearest nodes, random networks utilized Erdös and Rényi (1959) generation, and exponential and scale-free networks used Barabási and Albert (1999) preferential attachment.
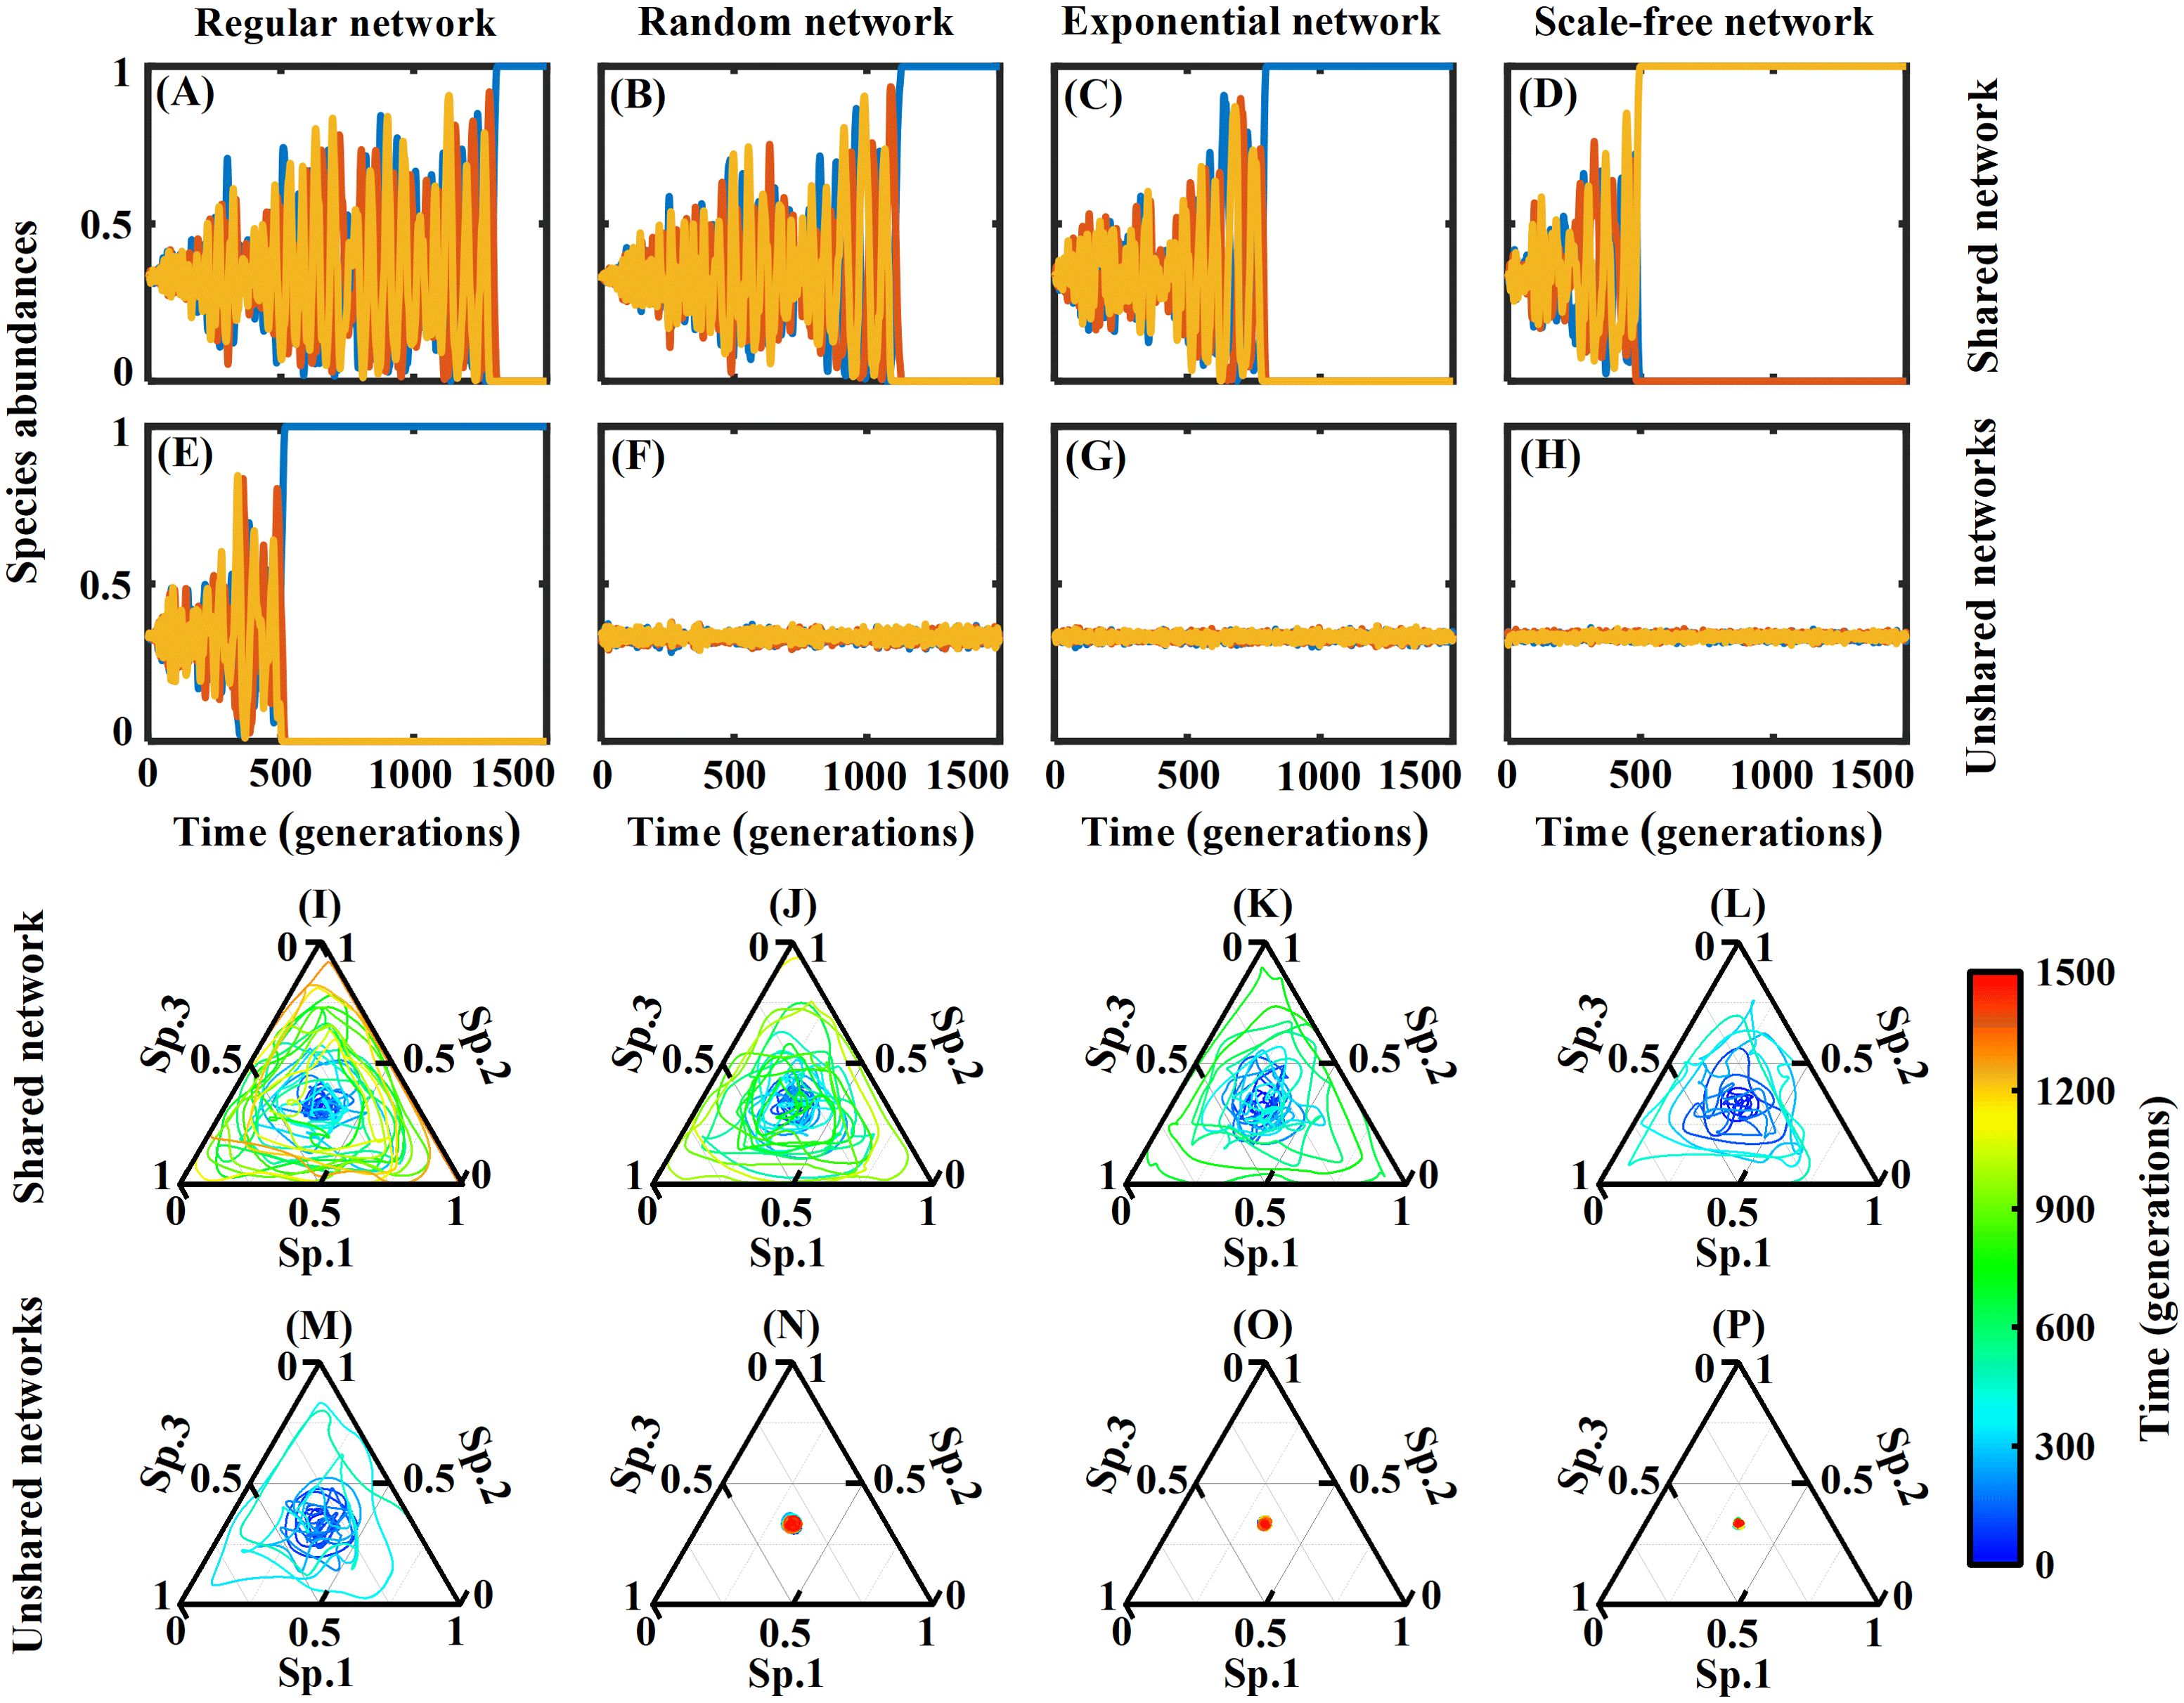
Figure 1. The dynamic curve graph and ternary phase diagram show the variations in species abundance for the three species in both shared and unshared networks. This paper uses four typical networks: regular, random, exponential, and scale-free networks. The diffusion rate is 2-10, with a simulation of 1,500 generations and 1,024 simulations per generation. The panels (A–D, I–L) Species abundances in shared networks; (E–H, M–P) Species abundances in unshared networks.

Figure 2. In the shared network, the generations are those at which the first species goes extinct; in the unshared networks, the fluctuation size is for the second species. Each scenario was simulated in 100 cases, and a violin plot with a box plot was generated with the 100 results. The green area indicates the probability density distribution of the generation when species extinction first occurs in the shared network. In the unshared networks, the green area represents the probability density distribution of the fluctuation size for species 2. (A) Time to extinction in shared networks; (B) Fluctuations size in unshared networks. The parameter settings are the same as in Figure 1.
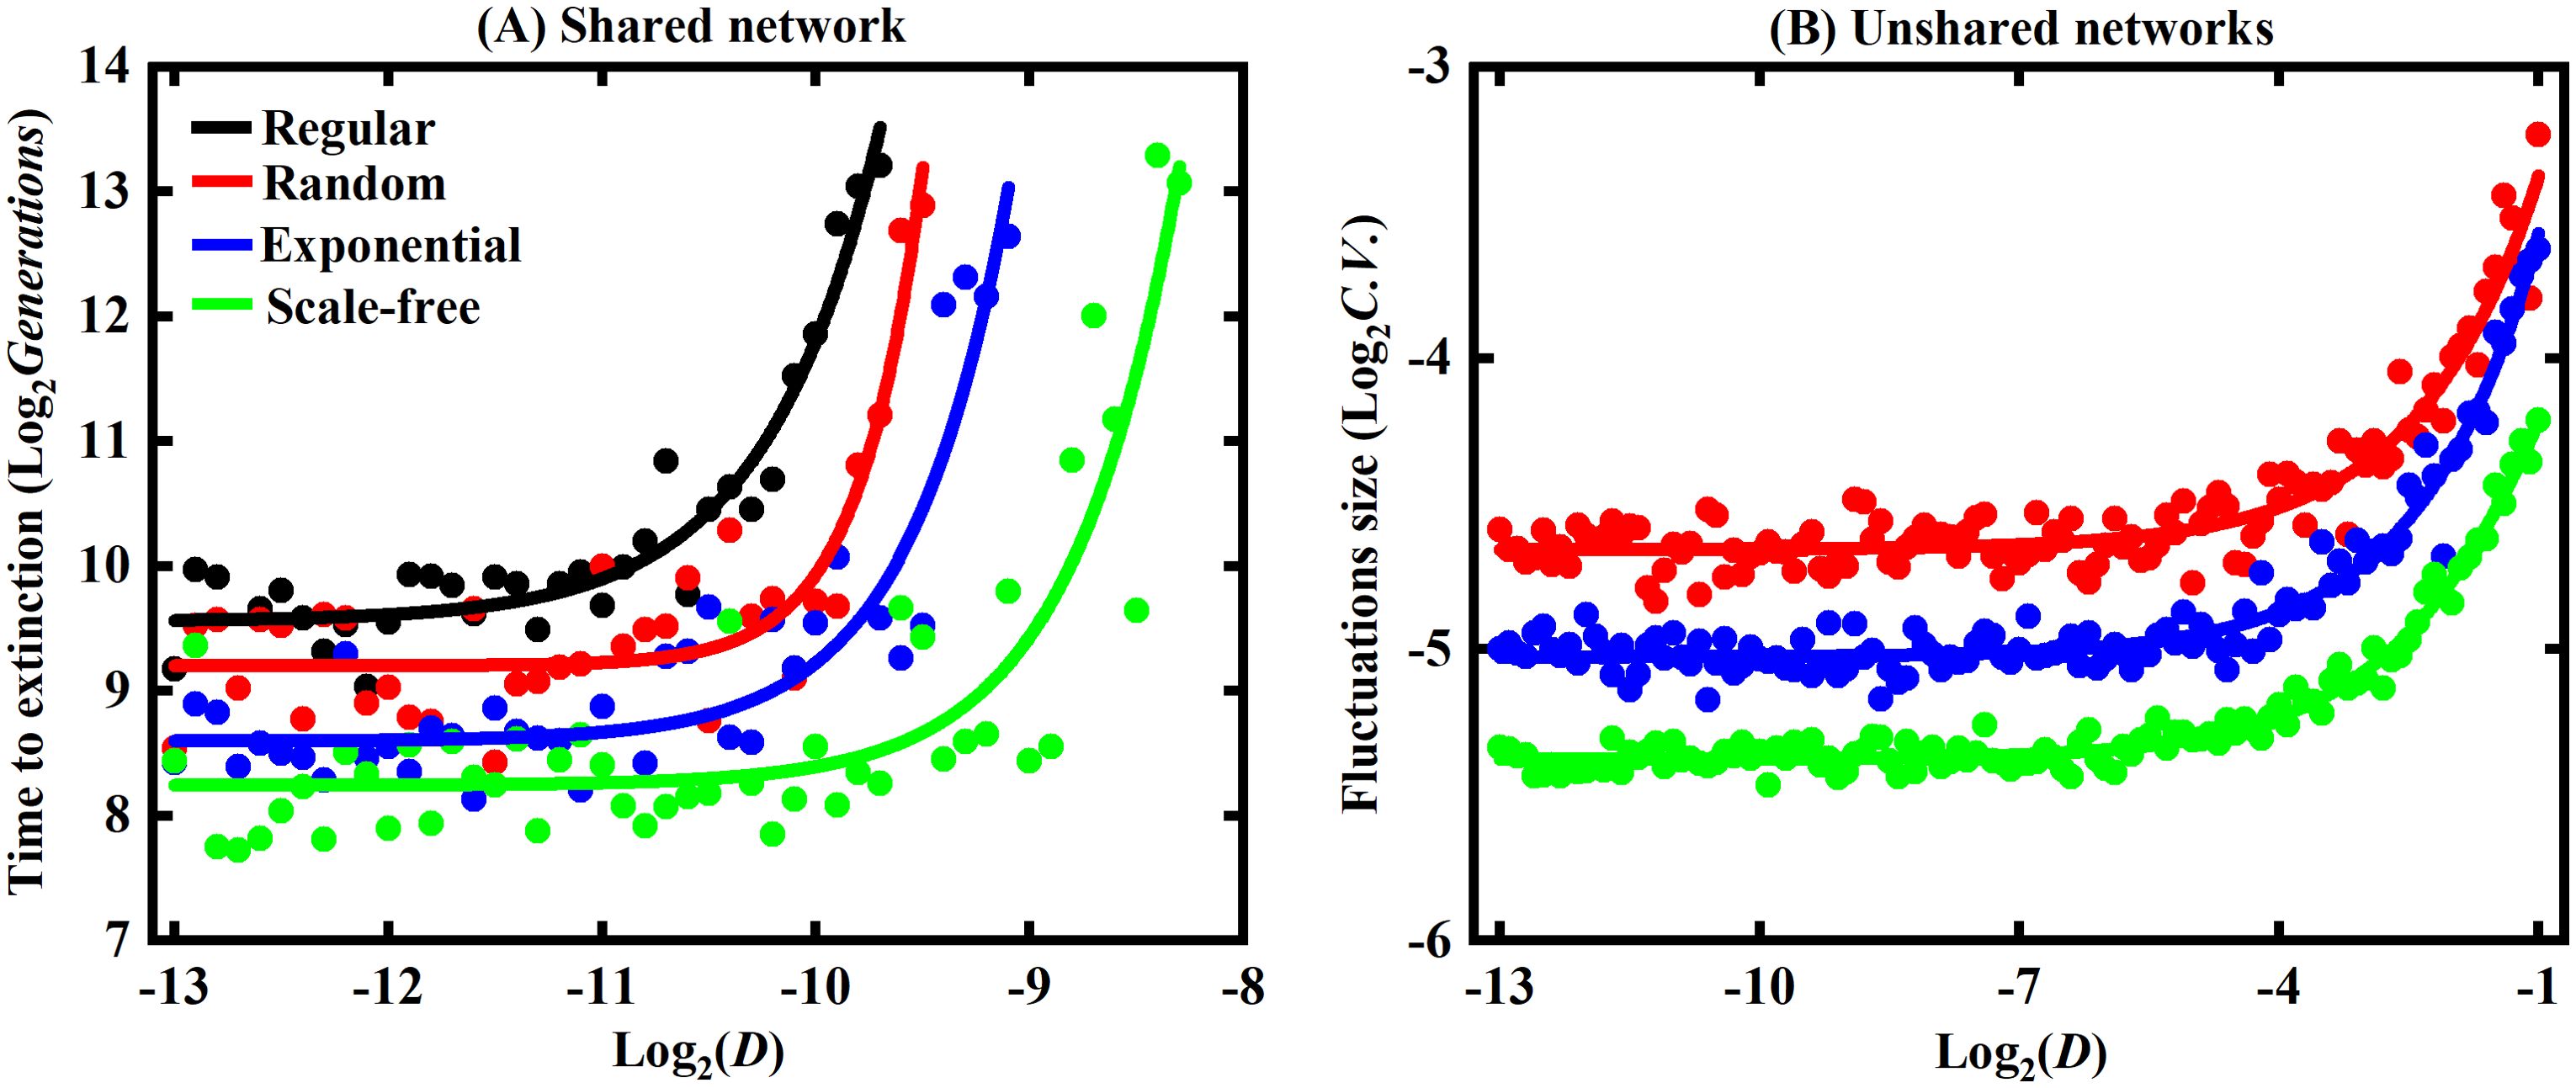
Figure 3. The impact of the dispersal rate on species coexistence. The x-axis represents the dispersal rate, while the y-axis in (A) represents the generations at which the earliest species extinction occurs, and the y-axis in (B) represents the fluctuation size of the second species. Both the x-axis and y-axis are logarithmic with a base of 2. The obtained results were subjected to quadratic fitting to obtain the fitted curves.
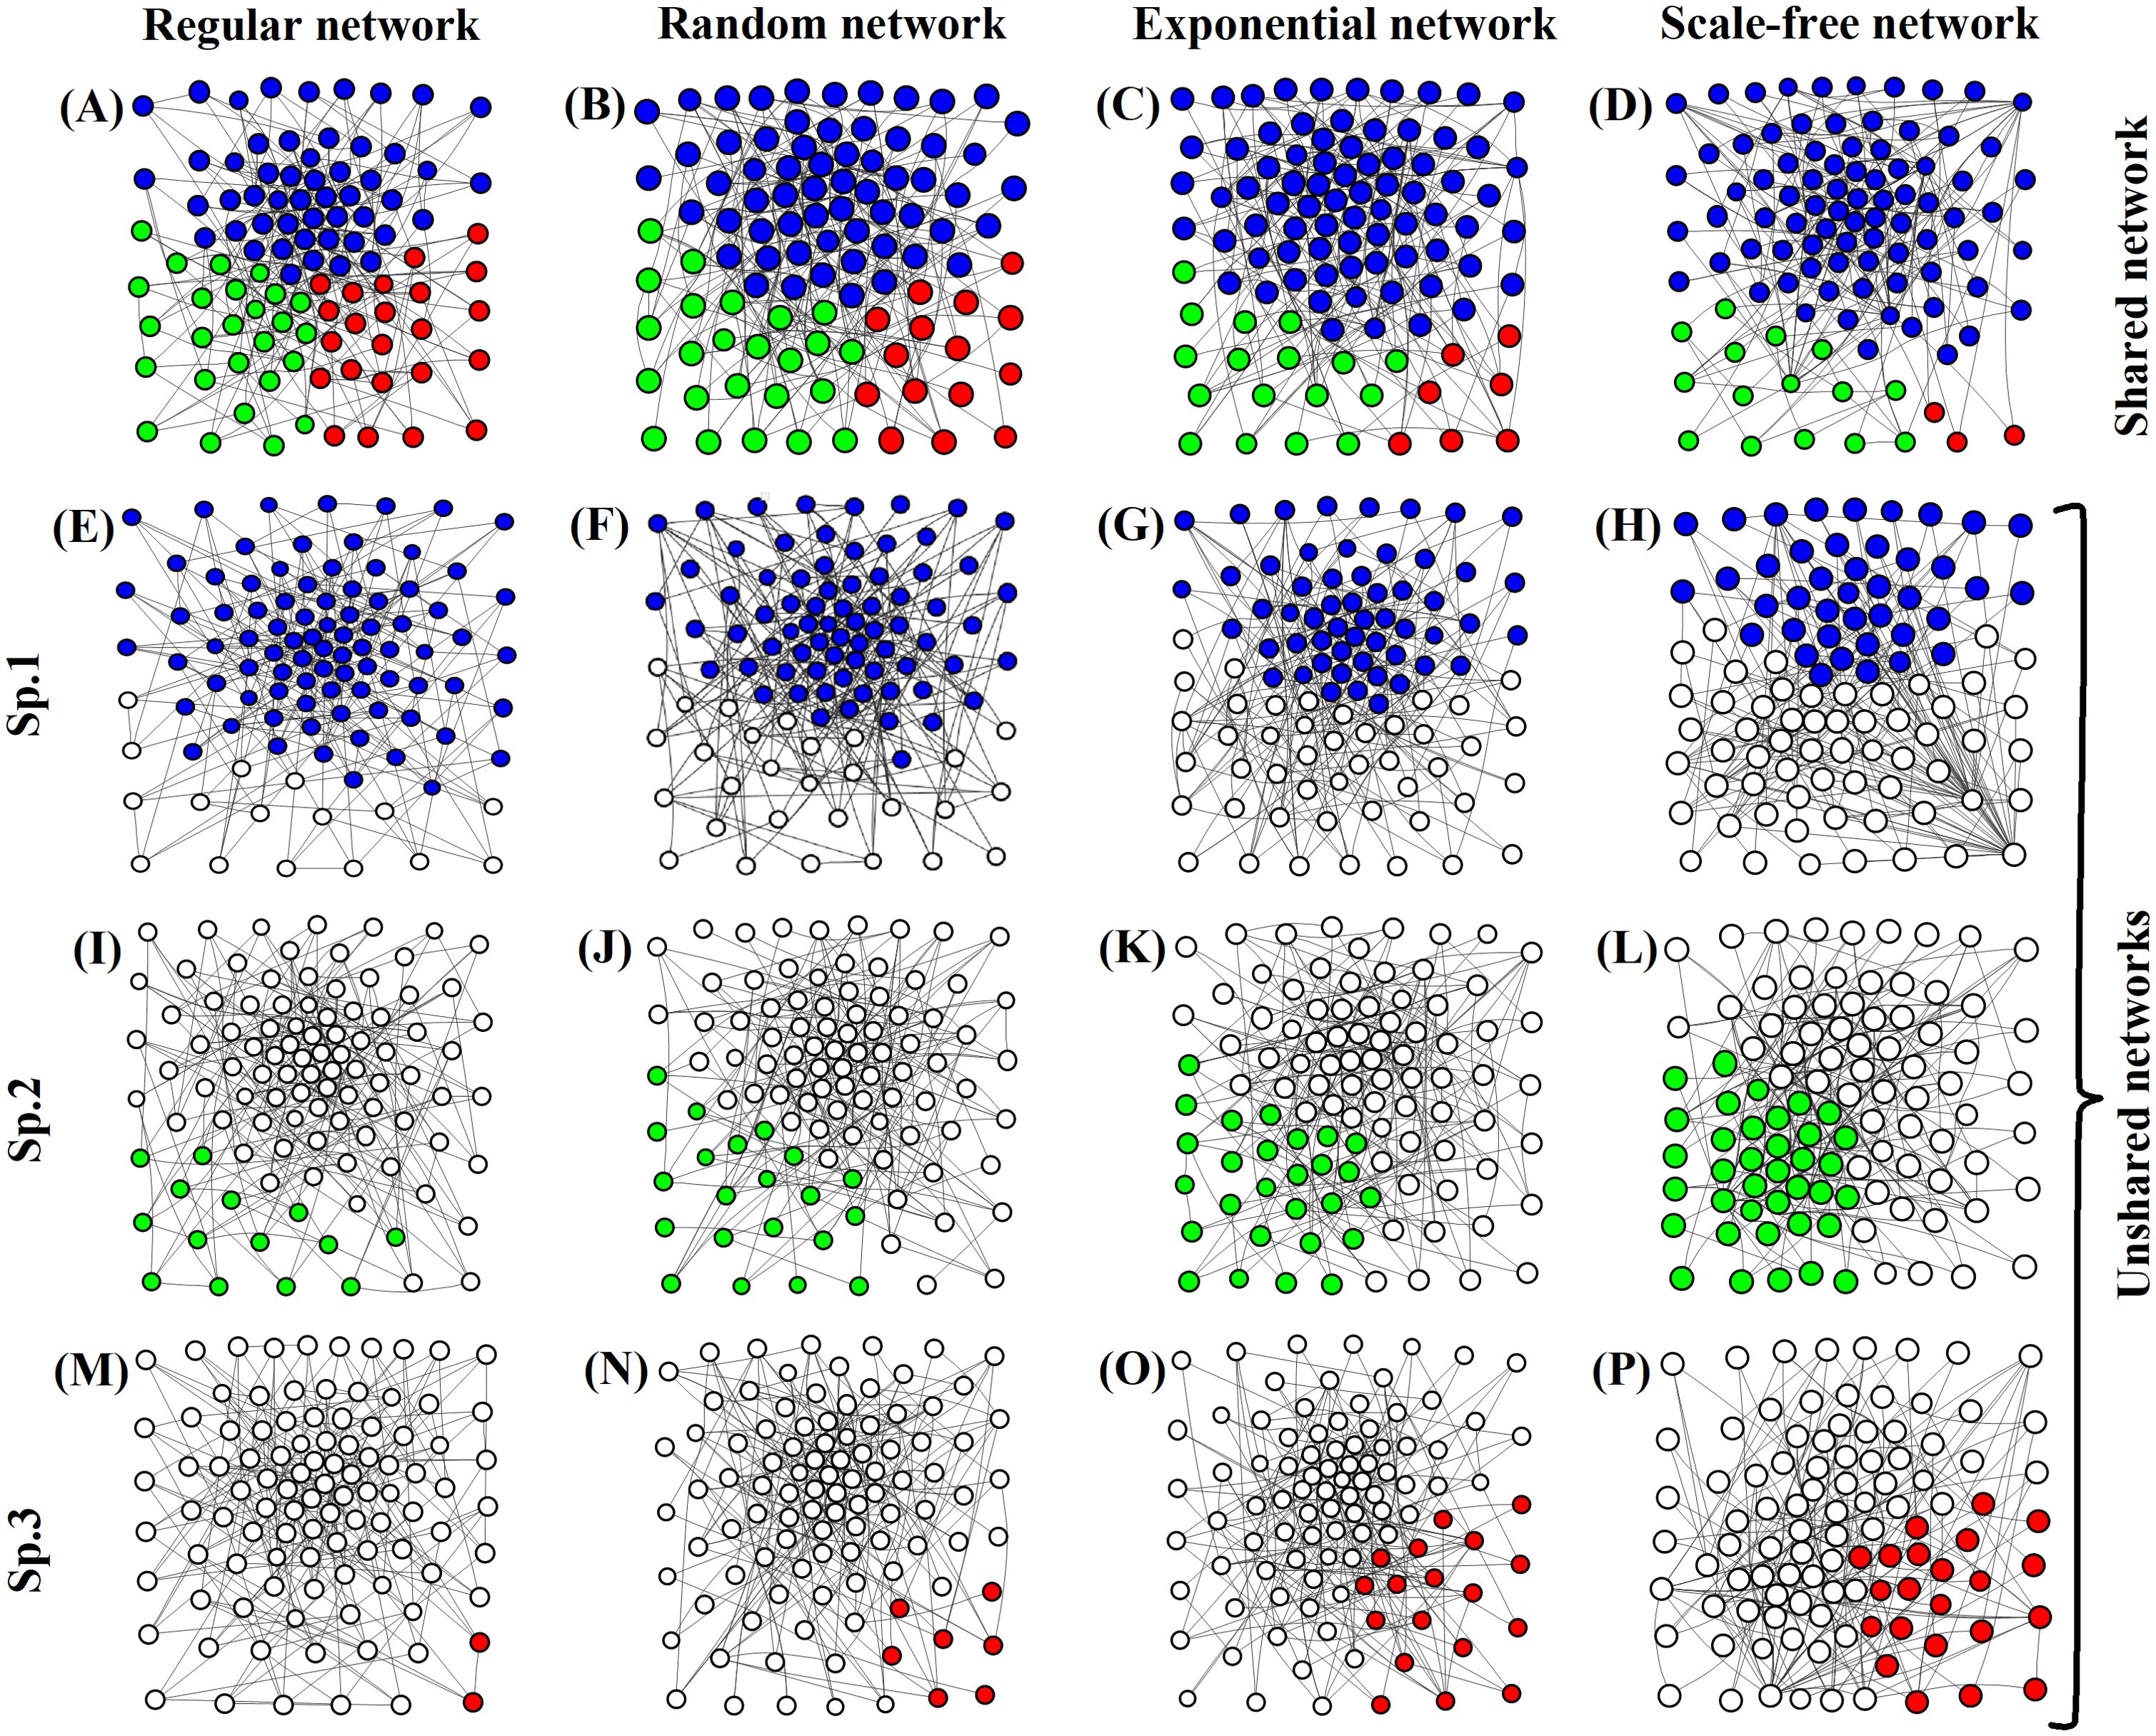
Figure 4. Taking the example of 16 patches, with each patch containing a nested network of 100 patches. Shared and unshared networks were simulated for 30 generations, with 100 simulations per generation. (A–D) represent the distribution of the three species in the shared network, with each species represented by a different color. (E–H) represent the distribution of the first species in the unshared networks; (I–L) represent the distribution of the second species; (M–P) represent the distribution of the third species.
Interaction rule
First, the species are assumed to occupy all patches with equal probability. Each species can colonize only one patch, and each patch can be occupied by at most one species (i.e., strict spatial exclusion). To investigate the interplay between heterogeneous networks and ecosystem stability, we implemented a stochastic simulation framework as follows (Calleja-Solanas et al., 2020).
The dispersal probability D, a definite quantitative value, is defined as the probability that an empty patch is colonized by a species from the external network rather than the internal network. It is used to determine whether the species is drawn from the internal network to occupy the patch or from the external network to occupy the patch. At each time step, a randomly selected patch undergoes extinction, resulting in a vacancy. Subsequently, colonization occurs via one of the following two pathways.
External recruitment
If the empty patch is colonized by a species from the external species pool, all the species inhabiting patches linked to the vacant patch (via network connections) form a candidate pool. Two species are randomly drawn from this pool, and their competitive outcomes are determined by the competition matrix H. The stronger competitor (as defined by matrix H) occupies the vacant patch.
Internal recruitment
If colonization originates from the internal network, two species are randomly selected from all the patches directly linked to the vacant patch. Their competitive strengths are evaluated via matrix H, and the dominant species successfully colonizes the patch.
The competition matrix H represents the relative competitive strengths among the three species (Figure 5C), defining the probability that a colonizer of one species displaces a settler of another species from a patch (Tilman, 1994). To describe interspecific competition, we assume that different species cannot coexist in the same suitable habitat site simultaneously. Thus, competition occurs only through the displacement of inferior competitors by superior ones, a process referred to as replacement competition.
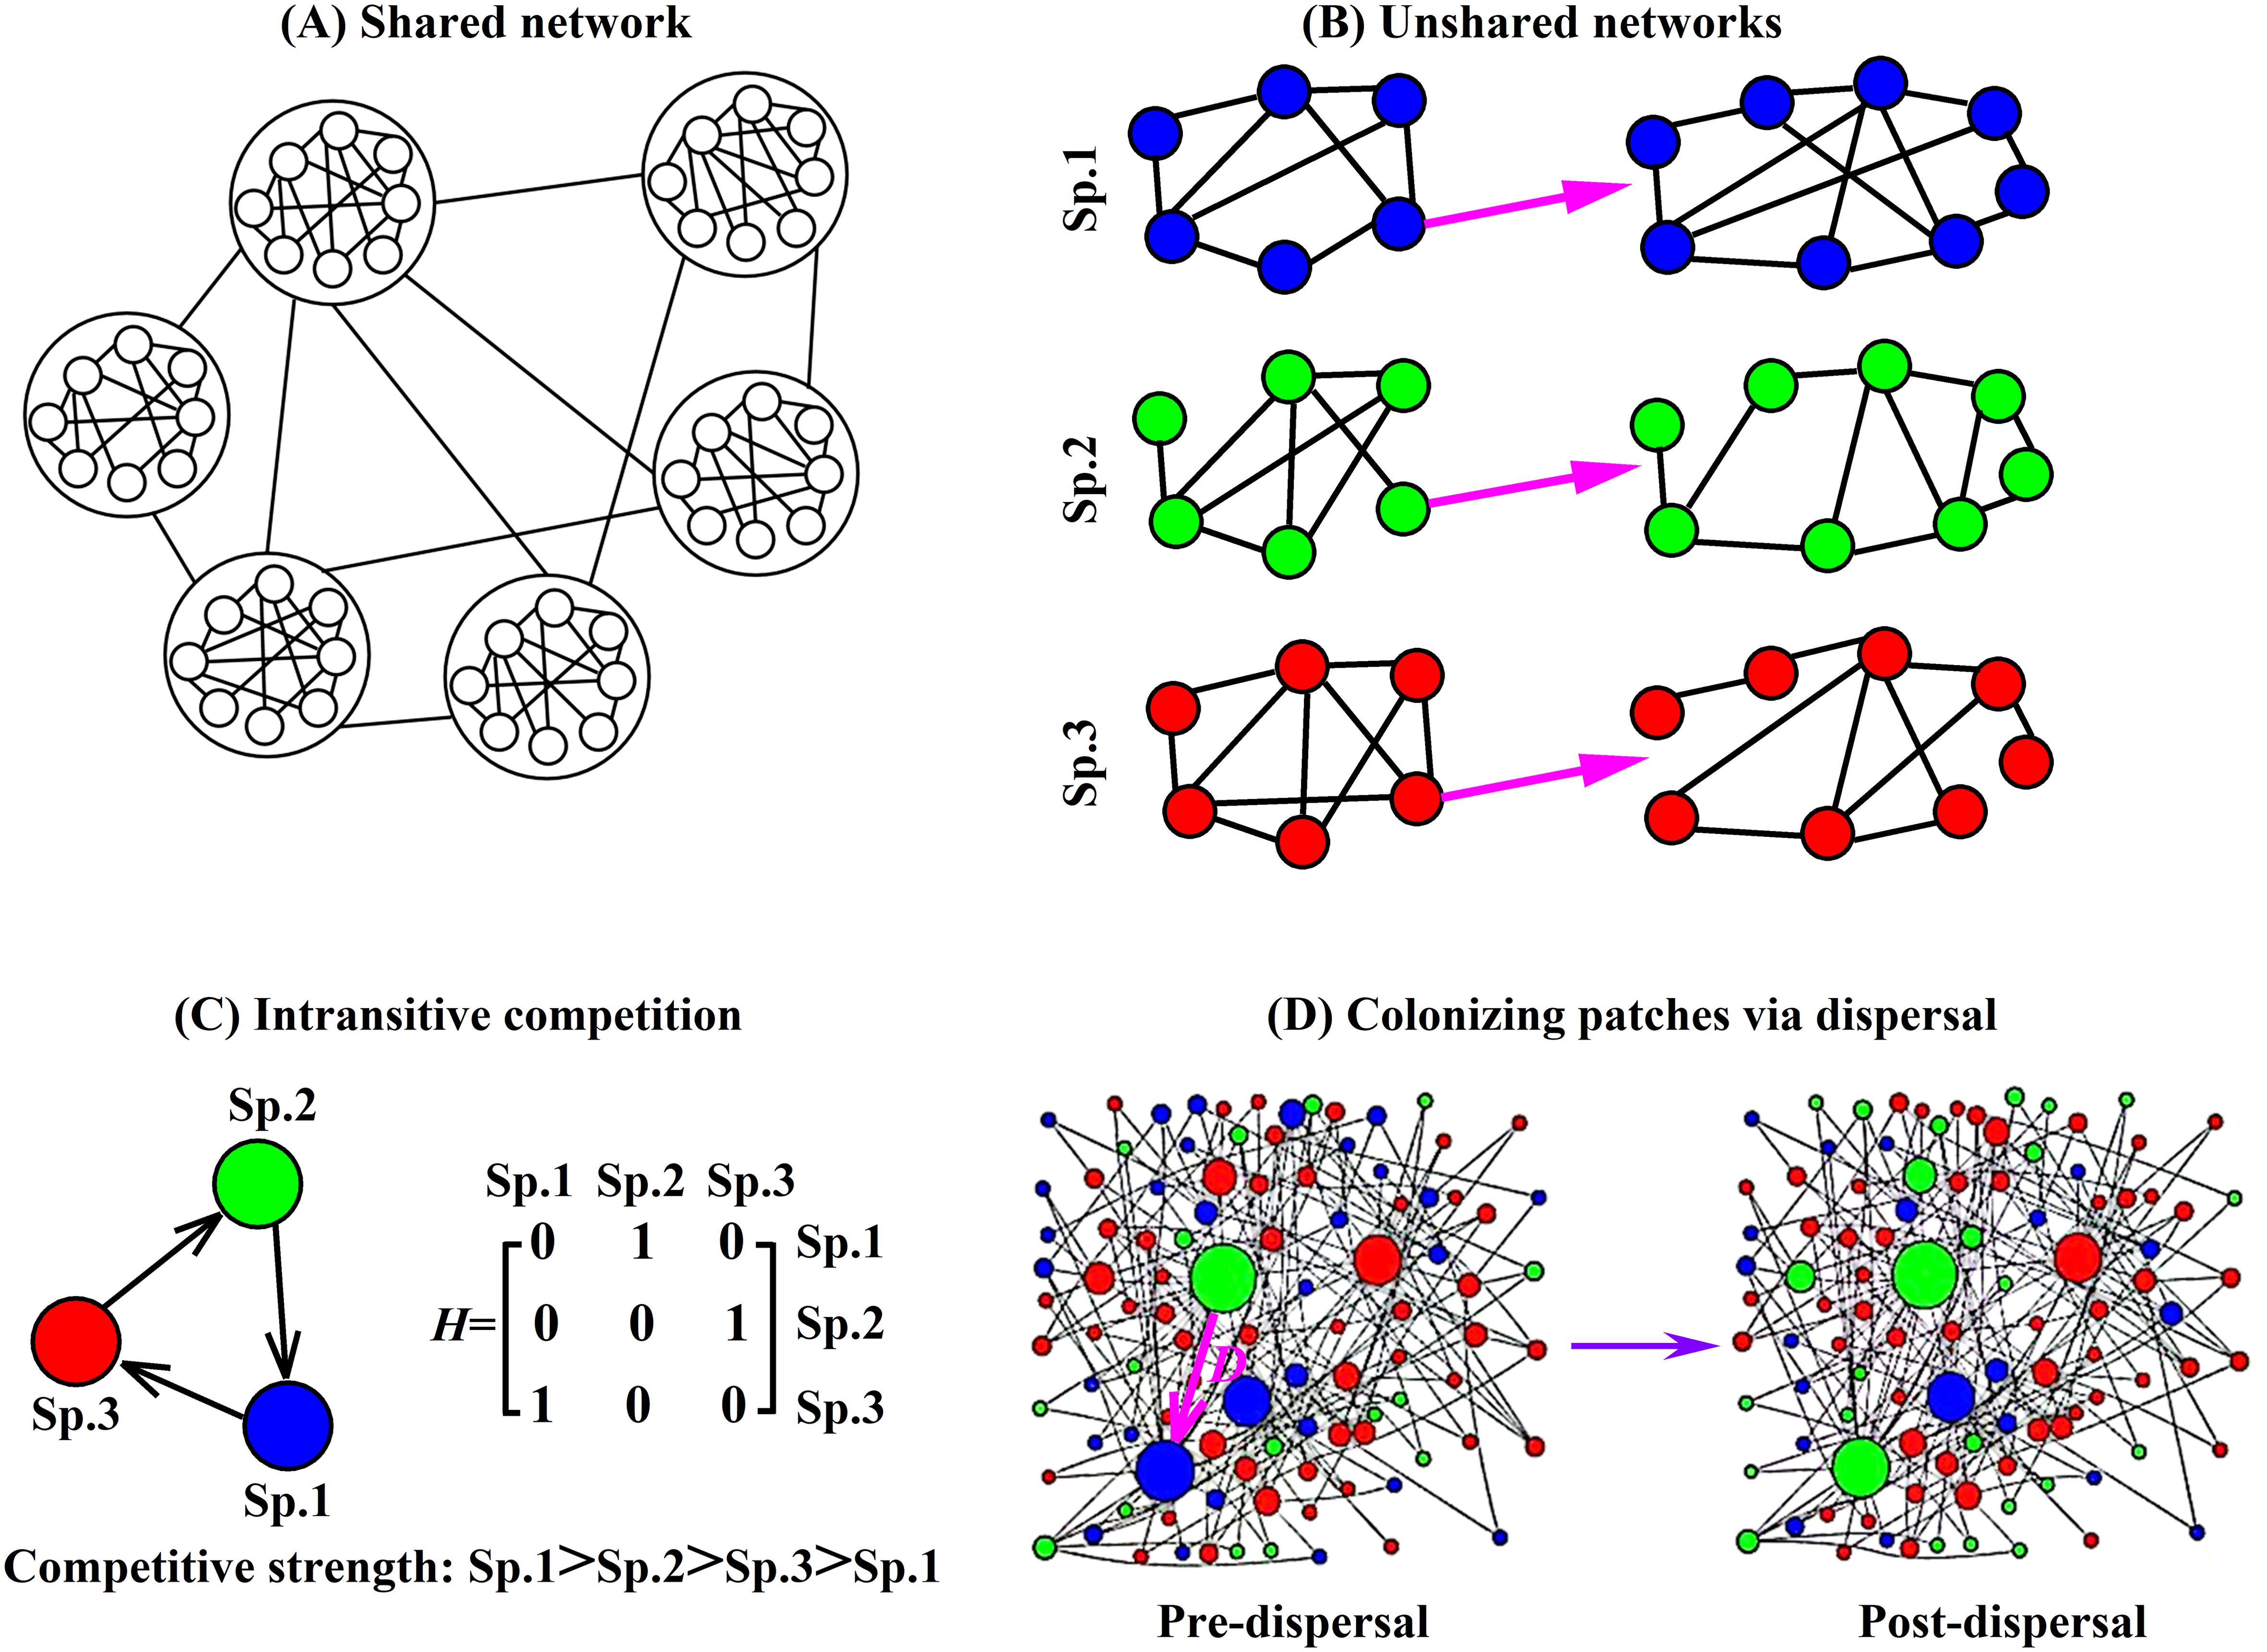
Figure 5. Diagram of a shared network, unshared networks, intransitive competition, and patch colonization through dispersal. (A) Shared network: all three species utilize the same dispersal pathway networks. (B) Unshared networks: each species possesses its own independent dispersal network. (C) Intransitive competition (e.g., rock-paper-scissors dynamics) among three species, with the competition matrix H indicating the relative competitive strength between species: Sp.1>Sp.2>Sp.3>Sp.1. (D) Colonizing patches via dispersal: species 2 displaces species 1 in its patch through dispersal. Each patch is always occupied by a single species at all times, with the entire system maintaining full occupancy across all patches throughout the simulation. This study utilizes four types of typical networks: regular, random, exponential, and scale-free networks.
Specifically, the competition matrix can also characterize different competitive structures (Li et al., 2020). For example, Figure 5C illustrates intransitive competition among the three species. The degree of competitive intransitivity can be quantified using the relative intransitivity index (RI). When RI=0, the system exhibits hierarchical competition, indicating a strict dominance hierarchy. When RI=1, the system displays intransitive competition. Following Laird and Schamp (2008), RI= . Where denotes the variance of the column sums in the competition matrix, while and represent the maximum and minimum column sums, respectively.
Intransitive competitive relationships, also known as circular or rock-paper-scissors relationships, occur when multiple entities or individuals compete with each other, but no single entity consistently dominates or wins over the others. Instead, the outcome of the competition depends on the context or specific circumstances. In this paper, we consider three species in an ecosystem: species A, species B, and species C. Species A may outcompete species B, species B may outcompete species C, and species C may outcompete species A. This creates a cycle of competitive relationships where no species has a clear advantage over the others. We use matrix H to indicate the competitive abilities of the three species. Its elements are randomly composed of 0 and 1. At the same time, it must meet the requirements of , , and . Under such circumstances, many intransitive competitions have been formed in the heterogeneous networks.
Simulations
In this study, we conducted numerical simulations using Matlab 2020b. To ensure that, on average, every patch undergoes one simulation process, we chose 1,024 competition events as one generation and performed 1,500 generations of simulations as stated in Figure 1, resulting in a total of 1,024×1,500 simulation runs per network. At the end of each simulation, we recorded the distribution of the species in all the patches and calculated the density of each species.
Results
Temporal evolution
For shared networks, in which all three species interact through the same networks, we found that the three species in four types of networks (regular network, random network, exponential network, and scale-free network) eventually narrowed down to only one species, while the other two species went extinct. The surviving species occupied all the patches in the network, with species abundances of 1. However, upon closer observation, we found the following patterns: in the regular network, the two species went extinct at approximately 1,300 generations; in the random network, the two species went extinct at approximately 1,100 generations; in the exponential network, the two species went extinct at approximately 800 generations; and in the scale-free network, the two species went extinct at approximately 500 generations (see Figures 1A–D). This means that the higher the heterogeneity of the network, the fewer generations it takes for species to go extinct, indicating faster species extinction rates.
For unshared networks, in which each species uses an independent network, two species go extinct at approximately 500 generations in the regular network, leaving only one species. However, the three species can coexist in the random networks, exponential networks, and scale-free networks. Further observation revealed that in random networks, the species abundances curve of the three species fluctuate significantly; in exponential networks, the species abundances curve of the three species fluctuate less; in scale-free networks, the species abundances curve of the three species fluctuate the least (see Figures 1E–H). This means that in a homogeneous network (i.e., a regular network), the three species cannot coexist; in networks with heterogeneity, the three species can coexist, and as the network heterogeneity increases, the fluctuations in the species abundances curve of the three species gradually decrease, indicating a more favorable environment for their coexistence.
Ternary phase diagrams are commonly used to describe interactions and equilibria in material systems, and they find widespread applications in the fields of physics and chemistry. However, the concept of ternary phase diagrams is not commonly used in ecology.
In ecological systems, we use ternary phase diagrams to describe the interactions and equilibria between species. For example, food webs and food chains can be viewed as networks of interactions, where different species are connected through predator-prey relationships and other interactions. This network structure can be used to describe species interactions, such as energy transfer in food chains and species diversity in ecosystems. Furthermore, we can utilize it to study stability and phase transitions in ecological systems. For instance, when a species disappears or a new species is introduced, the entire ecosystem may undergo changes, resulting in a reshuffling of species composition and interactions.
Therefore, although ternary phase diagrams are not directly applied in ecology, we can utilize them to study species interactions, stability, and phase transitions in ecological systems. Herein, we utilize ternary phase diagrams to analyze the species abundance variations of three species in shared and unshared networks. The three sides of the diagram represent the species abundance changes of the three species from 0 to 1. Figures 1I–L represent the ternary phase diagrams of four typical shared networks, corresponding to Figures 1A–D. Figures 1M–P represent the ternary phase diagrams of four typical unshared networks, corresponding to Figures 1E–H.
From the ternary phase diagrams, in shared networks, the interactions between the three species in regular networks exhibit small fluctuations initially, followed by larger fluctuations later, ultimately resulting in the extinction of two species and the survival of only one species. In scale-free networks, the interactions between the three species exhibit large fluctuations from the beginning, leading to the rapid extinction of two species.
However, in unshared networks, only in the case of regular networks do the interactions between the three species exhibit significant fluctuations, resulting in the extinction of two species. In the other three types of networks, the three species coexist stably with a circular ternary phase diagram. Among them, the circular shape is largest in the random networks and smallest in the scale-free networks.
Stability and fluctuation> size
To demonstrate the robustness of the results in Figure 1, we generated 100 different networks for each type of network, but with the same rules. Taking the random network as an example, we first used the random network to generate a random network consisting of 16 patches, and then nested a random network consisting of 1,024 patches within each patch. We repeated this process to generate 100 such networks. For each type of network, we repeated the experiment 100 times. If two species went extinct, we recorded the generations at which the extinction occurred. If the three species were able to coexist, we calculated the standard deviation (std) and mean of their species abundances, then subsequently computed the fluctuation size (std./mean) based on these values.
For shared networks, we recorded the generations at which the earliest extinction occurred for the four different types of networks. We repeated each typical network 100 times and plotted violin plots with box plots. From Figure 2A, it can be observed that the regular network requires the highest number of generations for extinction to occur, followed by the random network and exponential network. The scale-free network requires the lowest number of generations for extinction to occur. In other words, as the heterogeneity of the network increases, the number of generations required for species extinction decreases, which is less favorable for species coexistence.
For unshared networks, species go extinct and only one species survives in the regular network, while in the random network, exponential network, and scale-free network, the three species can stably coexist. Therefore, the regular network is relatively more unfavorable for species coexistence compared to the other three networks. Thus, in this study investigating the impact of unshared networks on species stability, we recorded the generations at which the first species went extinct in the regular network, and recorded the fluctuation size for the three species in the random, exponential, and scale-free networks. In Figure 2B, we plotted violin plots with box plots using the fluctuation size of the second species. From the figures, it can be observed that the random network has the largest fluctuation size, followed by the exponential network, while the scale-free network has the smallest fluctuation size. That means that as the heterogeneity of the network increases, the fluctuation size decreases and the stability of species coexistence improves.
Effect of the dispersal rates
In order to better understand the impact of dispersal rates on species coexistence, we explored the variations in species coexistence under different dispersal rates within the same network. Taking a regular shared network as an example, we generated a regular network with 16 patches, and within each patch, nested another regular network with 1,024 patches. Subsequently, we simulated all dispersal rates within this shared regular network to observe the changes in species coexistence among the three species. The purpose of this approach was to ensure that only the dispersal rate varied as a single factor, leading to changes in the coexistence of the three species.
In the shared networks, we varied the dispersal rate from 2–13 to 2–8 and recorded the generations at which the earliest species extinction arose in the regular, random, exponential, and scale-free network. The x-axis represents the logarithm of the dispersal rates using a base of 2, while the y-axis represents the logarithm of the generations using a base of 2. We performed a quadratic fit to all data points and obtained the results shown in Figure 3A.
As shown in Figure 3A, as the dispersal rate increases, the number of generations required for species extinction also increases for the same type of network. Specifically, there is a significant change in the number of generations when the dispersal rate is larger than 2-10. When the dispersal rate is less than 2-10, increasing the dispersal rate only slightly affects the number of generations required for extinction. However, when the dispersal rate exceeds 2-10, further increases in the dispersal rate significantly increase the number of generations needed for extinction. This is also why we chose the dispersal rate of 2–10 in Figures 1, 2. This suggests that in the shared network, higher dispersal rates promote coexistence by requiring more generations for species extinction.
At the same dispersal rate, the regular network exhibits the highest number of generations when extinction appears, followed by the random and exponential networks, while the scale-free network requires the fewest generations. Moreover, the curves fitted to these four types of networks in Figure 3A are nearly parallel. This finding confirms the results from Figures 1, 2, indicating that higher network heterogeneity leads to a decrease in the number of generations before extinction and is less favorable for species coexistence. The dispersal rates in Figure 3A only range up to 2-8, because, beyond this range, species do not go extinct but rather persist, also indicating that higher dispersal rates favor species coexistence.
In the unshared networks, we recorded the generations at which extinction first emerged in the regular network, and also recorded the species abundances of the three species in the random, exponential, and scale-free networks. We calculated their standard deviation and mean to determine the fluctuation size. Figure 3B illustrates the fluctuation size in the random, exponential, and scale-free networks, and it presents the relationship between fluctuation size and the dispersal rate for these three types of networks. The x-axis and y-axis in Figure 3B are logarithmic, and the fitted quadratic curves represent the second species’ fluctuation size.
As shown in Figure 3B, when the dispersal rate increases, the magnitude of oscillations also increases, suggesting a greater disadvantage for species coexistence. At the same dispersal rate, the random network exhibits the largest magnitude of oscillations, followed by the exponential network, while the scale-free network has the smallest magnitude of oscillations. This implies that higher network heterogeneity causes a smaller magnitude of oscillations within species and is more beneficial for species coexistence.
Discussion
Over the years, ecologists have been striving to explain the significant robustness exhibited in real ecological systems, including niche models, neutral models, and higher-order interactions (Moffett et al., 2007; Ryan et al., 2010; Grilli et al., 2017). Here, we used the minimal model of competitive ecosystems to demonstrate the impact of network heterogeneity on species coexistence and robustness in rock-paper-scissors games, both in shared and unshared networks.
Our results demonstrate that dispersal network heterogeneity has different effects on species coexistence in shared and unshared networks. In shared networks, as network heterogeneity increases, the speed of species extinction accelerates, making coexistence more unfavorable. However, in unshared networks, species can stably coexist without experiencing extinction events in the presence of heterogeneous networks. Furthermore, with increasing network heterogeneity, the fluctuation size in species abundances becomes smaller, promoting species coexistence. The impact of network heterogeneity on species coexistence is thus diametrically opposed in shared and unshared networks. Therefore, understanding how species interact in shared and unshared networks to influence coexistence is highly meaningful.
The quantities of the three species in Figure 4A (regular network) are roughly equal (represented by three different colors). In Figure 4B (random network), the quantity of the species represented by blue increases, while the quantity of the species represented by red decreases. In Figure 4C (exponential network), the quantity of the species represented by red further decreases, while the quantity of the species represented by blue continues to increase. Meanwhile, the quantity of the species represented by green also decreases. However, there is a rapid increase in the quantity of the species represented by blue in Figure 4D (scale-free network), the red species are close to extinction with only three individuals, and the quantity of the green species also decreases.
From Figure 4A–D, it can be observed that in shared networks, as network heterogeneity increases, the quantity of the species represented by blue gradually increases, while the quantities of the species represented by red and green gradually decrease. Further analysis reveals that with increasing simulation time, the species represented by red goes extinct first, followed by the extinction of the species represented by green. Eventually, the entire network is dominated by the species represented by blue, excluding the other two species. Additionally, the red species goes extinct first in Figure 4D. However, in Figure 4A, the extinction of the red species occurs last. This implies that as network heterogeneity increases, the speed of species extinction accelerates, and the required time for extinction decreases.
Very few nodes in a scale-free network have a significantly higher number of connections, represented by W. Although each node has an equal probability of being chosen, the probability of selecting a node connected to W is higher. During interactions, the species in W have a higher probability of occupying the selected nodes, leading to a faster exclusion of the other two species. However, each node in a regular network has four connections with an equal probability of being chosen. Each node’s species has an equal probability of occupying the node during interactions. Therefore, the speed at which one species excludes the other two is slower and requires more time.
Figures 4E–H represent the quantities of species 1 in a regular network, a random network, an exponential network, and a scale-free network, respectively. Figures 4I–P represent the quantities of species 2 and species 3 in the four types of networks, respectively. In contrast to the changing quantities of the three species in shared networks, the quantities of the three species in the scale-free network are roughly equal for the unshared network. However, in the regular network, there are only two individuals left for species 3, indicating that it is on the verge of extinction. The quantity of species 2, represented by green, is also very low. However, the quantity of species 1, represented by blue, is significantly large. Therefore, the scale-free network is more conducive to species coexistence compared to the regular network. This suggests that greater network heterogeneity favors species coexistence.
In an unshared network, although the scale-free network exhibits the highest network heterogeneity with very few nodes having the most connections, and while interaction complexity among species is low, each species has its own separate network diffusion path. Thus, each time a species occupies a node, the probability of selecting a different species increases, allowing for stable coexistence among species by localizing competitive exclusion. This has been demonstrated in previous research (Zhang et al., 2020). Conversely, in a regular network characterized by each node having precisely four connections, the likelihood of selecting the same species is markedly elevated during each interaction event. This leads to the exclusion of the other two species, resulting in species extinction and leaving only one species remaining. Moreover, as network heterogeneity increases, the differences in the number of connections between nodes also increase. This, in turn, increases the probability of selecting different species when occupying nodes. Consequently, the fluctuation size in species abundance decreases, which is more favorable for species coexistence.
In conclusion, even if this study only explores a certain type of spatial interaction among three species in rock-paper-scissors tournaments, our findings contribute to a better understanding of the role of space in maintaining species coexistence in the natural world. Additionally, our framework assumes intransitive competition rules and symmetrical dispersal rates. While this simplifies mechanistic insights, real-world systems may exhibit asymmetrical interactions or transitive species competition. Future work should test whether our findings hold in non-rock-paper-scissors tournament types and ecological systems with more than three species. Moreover, in the future, we could investigate how network heterogeneity mediates species coexistence in food webs via integrating multiple environment drivers.
Data availability statement
The datasets presented in this study can be found in online repositories. The names of the repository/repositories and accession number(s) can be found in the article/supplementary material.
Author contributions
GG: Methodology, Formal Analysis, Writing – original draft, Conceptualization, Writing – review & editing. HZ: Writing – review & editing, Formal Analysis, Methodology.
Funding
The author(s) declare that financial support was received for the research and/or publication of this article. National Natural Science Foundation of China (32401282); Science and Technology Research Project of Jiangxi Provincial Department of Education (GJJ2403406); Open Fund of Ministry of Education Key Laboratory for Transboundary Ecosecurity of Southwest China (YNUECO2024002).
Conflict of interest
The authors declare that the research was conducted in the absence of any commercial or financial relationships that could be construed as a potential conflict of interest.
Generative AI statement
The author(s) declare that no Generative AI was used in the creation of this manuscript.
Publisher’s note
All claims expressed in this article are solely those of the authors and do not necessarily represent those of their affiliated organizations, or those of the publisher, the editors and the reviewers. Any product that may be evaluated in this article, or claim that may be made by its manufacturer, is not guaranteed or endorsed by the publisher.
References
Axelrod R. and Hamilton W. (1981). The evolution of cooperation. Science 211, 1390–1396. doi: 10.1126/science.7466396
Barabási A. L. and Albert R. (1999). Emergence of scaling in random networks. Science 286, 509–512. doi: 10.1126/science.286.5439.509
Barthélémy M. (2003). Crossover from scale-free to spatial networks. Europhysics Lett. 63, 915–921. doi: 10.1209/epl/i2003-00600-6
Bascompte J. and Solé R. V. (1995). Rethinking complexity: modelling spatiotemporal dynamics in ecology. Trends Ecol. Evol. 10, 361–366. doi: 10.1016/S0169-5347(00)89134-X
Bearup D., Petrovskii S., Blackshaw R. P., and Hastings A. (2013). Synchronized dynamics of Tipula paludosa metapopulation in a southwestern Scotland agroecosystem: linking pattern to process. Am. Nat. 182, 393–409. doi: 10.1086/671162
Calleja-Solanas V., Khalil N., Hernández-García E., Gómez-Gardenes J., and Meloni S. (2020). Structured interactions as a stabilizing mechanism for competitive ecosystems. Populations Evol. 19, 18–25. doi: 10.1103/PHYSREVE.106.064307
Cantwell M. D. and Forman R. T. T. (1993). Landscape graphs: ecological modeling with graph theory to detect configurations common to diverse landscapes. Landscape Ecol. 8, 239–251. doi: 10.1007/BF00125131
Chesson P. (2000). Mechanisms of maintenance of species diversity. Annu. Rev. Ecol. Systematics 31, 343–366. doi: 10.1146/annurev.ecolsys.31.1.343
Dale M. R. T. and Fortin M. J. (2010). From graphs to spatial graphs. Annu. Rev. Ecology Evolution Systematics 41, 21–38. doi: 10.1146/annurev-ecolsys-102209-144718
Dondina O., Orioli V., Colli L., Luppi M., and Bani L. (2018). Ecological network design from occurrence data by simulating species perception of the landscape. Landscape Ecol. 33, 275–287. doi: 10.1007/s10980-017-0600-1
Fortuna M. A., Albaladejo R. G., Fernandez L., Aparicio A., and Bascompte J. (2009). Networks of spatial genetic variation across species. Proc. Natl. Acad. Sci. United States America 106, 19044–19049. doi: 10.1073/pnas.0907704106
Fortuna M., Gómez-Rodríguez C., and Bascompte J. (2006). Spatial network structure and amphibian persistence in stochastic environments. Proc. R. Soc. B: Biol. Sci. 273, 1429–1434. doi: 10.1098/rspb.2005.3448
Franciélli C., Gruchowski W., Cláudia I. S., and Mauro R. (2023). Influence of generalist stingless bees on the structure of mutualistic flower-pollinator networks in the tropics: Temporal variation. Ecol. Entomology 49, 338–356. doi: 10.1111/EEN.13308
Franz I., Vizentin B. J., Repenning M., Rovedder C. E., Boldrini I. I., and Fontana C. S. (2024). Seeds consumed by three sympatric species of threatened Sporophila seedeaters: lessons for conservation and grassland restoration. Bird Conserv. Int. 34, e36. doi: 10.1017/S0959270924000340
Germain R. M., Jones N. T., and Grainger T. N. (2019). Cryptic dispersal networks shape biodiversity in an invaded landscape. Ecology 100, e02738. doi: 10.1002/ecy.v100.8
Gilarranz L. J., Rayfield B., Liňán-Cembrano G., Bascompte J., and Gonzalez A. (2017). Effects of network modularity on the spread of perturbation impact in experimental metapopulations. Science 357, 199–201. doi: 10.1126/science.aal4122
Gilpin M. E. (1975). Limit cycles in competition communities. Am. Nat. 109, 51–60. doi: 10.1086/282973
Grilli J., Barabás G., and Allesina S. (2015). Metapopulation persistence in random fragmented landscapes. PloS Comput. Biol. 11, e1004251. doi: 10.1371/journal.pcbi.1004251
Grilli J., Barabás G., Michalska-Smith M. J., and Allesina S. (2017). Higher-order interactions stabilize dynamics in competitive network models. Nature 548, 210–213. doi: 10.1038/nature23273
Hamilton W. D. (1967). Extraordinary sex ratios. Science 156, 477–488. doi: 10.1126/science.156.3774.477
Hofbauer J. and Sigmund K. (1998). Evolutionary games and population dynamics (Cambridge: Cambridge University Press).
Hofbauer J. and Sigmund K. (2003). Evolutionary game dynamics. Bull. Am. Math. Soc. 40, 479–519. doi: 10.1090/S0273-0979-03-00988-1
Holland M. D. and Hastings A. (2008). Strong effect of dispersal network structure on ecological dynamics. Nature 456, 792–794. doi: 10.1038/nature07395
Huang Z. L., Liu H. L., Chu C. J., and Li Y. Z. (2022). Advance in intransitive competition between organisms. Biodiversity Sci. 30, 21282. doi: 10.17520/biods.2021282
Huisman J., Johansson A. M., Folmer E. O., and Weissing F. J. (2001). Towards a solution of the plankton paradox: The importance of physiology and life history. Ecol. Lett. 4, 408–411. doi: 10.1046/j.1461-0248.2001.00256.x
Huisman J. and Weissing F. J. (1999). Biodiversity of plankton by species oscillations and chaos. Nature 402, 407–410. doi: 10.1038/46540
José R. E. and Stefano A. (2011). Interaction rules affect species coexistence in intransitive networks. Ecology 92, 1174–1180. doi: 10.1890/10-0953.1
Kabir A. T. J. and Tanimoto J. (2021). The role of pairwise nonlinear evolutionary dynamics in the rock-paper-scissors game with noise. Appl. Mathematics Comput. 394, 11–19. doi: 10.1016/j.amc.2020.125767
Kerr B., Riley M. A., and Bohannan B. J. M. (2002). Local dispersal promotes biodiversity in a real-life game of rock-paper-scissors. Nature 418, 171–174. doi: 10.1038/nature00823
Kininmonth S. J., De’ath G., and Possingham H. P. (2010). Graph theoretic topology of the great but small barrier reef world. Theor. Ecol. 3, 75–88. doi: 10.1007/s12080-009-0055-3
Laird R. A. and Schamp B. S. (2006). Competitive intransitivity promotes species coexistence. Am. Nat. 168, 182–193. doi: 10.1086/506259
Laird R. A. and Schamp B. S. (2008). Does local competition increase the coexistence of species in intransitive networks? Ecology 89, 237–247. doi: 10.1890/07-0117.1
Laird R. A. and Schamp B. S. (2009). Species coexistence, intransitivity, and topological variation in competitive tournaments. J. Theor. Biol. 256, 90–95. doi: 10.1016/j.jtbi.2008.09.017
Li Y., Bearup D., and Liao J. (2020). Habitat loss alters effects of intransitive higher-order competition on biodiversity: a new metapopulation framework. Proc. R. Soc. B: Biol. Sci. 287, 20201571.10.1098/rspb.2020.1571
Li C., Feng T., Zhang H., Chen D., Cressman R., Liao J., et al. (2021). Multilayer network structure enhances the coexistence of competitive species. Phys. Rev. E 104, 024402. doi: 10.1103/PhysRevE.104.024402
May R. M. (1972). Will a large complex system be sta ble? Nature 238, 413–414. doi: 10.1038/238413a0
May R. M. and Leonard W. J. (1975). Nonlinear aspects of competition between three species. SIAM J. Appl. Mathematics 29, 243–253. doi: 10.1137/0129022
Maynard Smith J. and Price G. R. (1973). The logic of animal conflict. Nature 246, 15–18. doi: 10.1038/246015a0
Menezes J., Rangel E., and Moura B. (2022). Aggregation as an antipredator strategy in the rock-paper-scissors model. Ecol. Inf. 69, 1–5. doi: 10.1016/j.ecoinf.2022.101606
Moffett A., Shackelford N., and Sarkar S. (2007). Malaria in africa: vector species’ niche models and relative risk maps. PloS One 2, 1–14. doi: 10.1371/journal.pone.0000824
Parker G. A., Baker R. R., and Smith V. G. F. (1972). The origin and evolution of game dimorphism and the male-female phenomenon. J. Theor. Biol. 36, 529–553. doi: 10.1016/0022-5193(72)90007-0
Reichenbach T., Mobilia M., and Frey E. (2007). Mobility promotes and jeopardizes biodiversity in rock-paper-scissors games. Nature 448, 1046–1049. doi: 10.1038/nature06095
Ryan A., Pacala, and Stephen W. (2010). Niche and neutral models predict asymptotically equivalent species abundance distributions in high-diversity ecological communities. Proc. Natl. Acad. Sci. United States America 107, 15821–15825. doi: 10.1073/pnas.1009387107
Schreiber S. J. (2010). Interactive effects of temporal correlations, spatial heterogeneity and dispersal on population persistence. Proc. Biol. Sci. 277, 1907–1914. doi: 10.1098/rspb.2009.2006
Snyder R. E. and Chesson P. (2003). Local dispersal can facilitate coexistence in the presence of permanent spatial heterogeneity. Ecol. Lett. 6, 301–309. doi: 10.1046/j.1461-0248.2003.00434.x
Tilman D. (1994). Competition and biodiversity in spatially structured habitats. Ecology 75, 2–16. doi: 10.2307/1939377
Urban D. and Keitt T. (2001). Landscape connectivity: a graph-theoretic perspective. Ecology 85, 1205–1218. doi: 10.1890/0012-9658(2001)082[1205:LCAGTP]2.0.CO;2
Watts D. and Strogatz S. (1998). Collective dynamics of ‘small-world’ networks. Nature 393, 440–442. doi: 10.1038/30918
Keywords: intransitive competition, rock-paper-scissors game, biodiversity, network heterogeneity, species coexistence, fluctuations size
Citation: Guo G and Zhang H (2025) Dispersal network heterogeneity affects ecosystem stability in rock-paper-scissors tournaments. Front. Ecol. Evol. 13:1610137. doi: 10.3389/fevo.2025.1610137
Received: 11 April 2025; Accepted: 15 May 2025;
Published: 13 June 2025.
Edited by:
Jiang Jiang, Nanjing Forestry University, ChinaReviewed by:
Junpyo Park, Kyung Hee University - Global Campus, Republic of KoreaYe Ye, Anhui University of Technology, China
Copyright © 2025 Guo and Zhang. This is an open-access article distributed under the terms of the Creative Commons Attribution License (CC BY). The use, distribution or reproduction in other forums is permitted, provided the original author(s) and the copyright owner(s) are credited and that the original publication in this journal is cited, in accordance with accepted academic practice. No use, distribution or reproduction is permitted which does not comply with these terms.
*Correspondence: Guanming Guo, Z2dtaW5nMTk5MEAxNjMuY29t