 Yuansuo Zhang1
 Guoqing Zhi
 Huimin Zhou
 Na Cui
- 1College of Applied Arts and Science of Beijing Union University, Beijing, China
- 2General Institute (Special Region), China ELectronics Technology Group Corporation Academy of Electronics and Information Technology, Beijing, China
- 3China ELectronics Technology Group Corporation Academy of Electronics and Information Technology, Beijing, China
- 4School of Management of Tianjin University of Technology, Tianjin, China
- 5Teachers’ College of Beijing Union University, Beijing, China
Introduction: Leisure and recreation behavior has become one of the important lifestyles for urban residents, according to the continuous development of China’s social economy and the improvement of urban residents’ living standards and the spatio-temporal rhythm of these activities presents significant potential for exploration.
Methods: This study investigates the temporal and spatial patterns of citizens’ leisure and recreation activities in Beijing with the social media data from Sina Weibo. Through machine learning and spatial statistical methods, the research analyzes residents’ leisure and recreation behaviors, identifying four main topics: “Popular Nowadays,” “Special Events,” “Scenic Spots,” and “Daily Leisure.”
Results: The analysis reveals the leisure and recreation activity timing correlates closely with daily work and rest habits, which shows significant differences between weekdays and weekends. The “Popular Nowadays” accounts for 21.9% of leisure and recreation activities, while the “Daily Leisure” represents the largest proportion at 29.1% and shows a marked increase on weekends. Spatially, leisure and recreation activities display a centripetal distribution, with the high activity levels of the city center and main roads, and different leisure and recreation topics have distinct hotpots, including commercial areas, scenic spots, and cultural sites. Notably, the “Special Events” demonstrates a significant increase in activity distance on Saturdays, with an average distance considerably higher than other topics.
Discussion: The study concludes that the dynamic level of leisure and recreation activities is influenced by urban facility distribution and quality, which offer valuable insights for urban planning and “leisure and recreation “space improvement in Beijing.
1 Introduction
Urban residents exhibit a cyclical pattern in their daily activities, including the distinctive spatial rhythms through regular patterns of activity which create by human movements (Johnson and Glover, 2013; Liu et al., 2022b). These rhythms arise from the interactions of multiple individual mobility patterns in urban spaces. As a significant component of urban spatial behavior, leisure and recreation activities exhibit distinctive geographical distributions and temporal variations, warranting systematic investigation. These activities vary by location, time, and other factors, but they demonstrate a sustainable cyclical change pattern, which we refer to as “rhythm” (as presented by Henri Lefebvre) (Lefebvre, 2013; Liu et al., 2022a; Zhong et al., 2016; Söylemez and Koramaz, 2024). The study of urban leisure and recreation rhythms provides insight into the urban public spaces from the perspective of urban residents’ behaviors. Additionally, as a subdiscipline of geography, “leisure and recreation geography” examines the spatial distribution of leisure opportunities, access constraints, and the influence of urban morphology on leisure behaviors across diverse populations (Alzaim et al., 2024; Wu et al., 2019; Kuzuoglu and Glover, 2023). The contemporary geographical research increasingly recognizes that leisure is not only an activity that takes place in space, but also a spatial practice that promotes the generation and transformation of urban environments (Navarro et al., 2018; Wang et al., 2024; Ji et al., 2022; Ma et al., 2012).
Geographical big data offers unprecedented opportunities to research the spatiotemporal rhythms of leisure and recreation activities in urban environments, improving our understanding of how leisure and recreation practices were embedded in the broader geographical contexts (Li et al., 2025; Nemeškal et al., 2020). Nowadays, individuals play the role of spatial nodes in the complex connected network, with the popularization of information and communications technology (ICT), particularly mobile devices (Urry, 2012). Not only These technologies record locational data, but they also alter how people navigate and experience urban space (Chen et al., 2022). Geographical research on leisure activities through information and communication technologies has revealed complex spatio-temporal patterns and behavioral differences among various population groups (Zhang et al., 2022; Toger et al., 2023; Gao et al., 2025), while digital interactions are increasingly influencing physical movement through urban spaces (Parady et al., 2019; Wang et al., 2023). Social media and mobile phone signal data typically contain precise geographical coordinates, enabling detailed spatial analysis (Zhi et al., 2021).
With the acceleration of global urbanization, enhancing residents’ quality of life and urban livability while promoting economic growth has become a critical issue in sustainable urban planning. Leisure and recreation activities, as an essential component of quality of life, reflect residents’ daily rhythms and preferences, and provide valuable insights for optimizing public space allocation and urban functions. In recent years, researchers have developed multidimensional indicator systems that integrate socioeconomic, environmental, and transportation factors to construct evaluation frameworks for urban livability and quality of life, thereby informing spatial layout optimization and public service provision (Chi and Mak, 2021). At the same time, advances in big data analytics and Geospatial Artificial Intelligence (GeoAI) have enabled urban spatial analysis based on diverse data sources such as social media, sensors, and remote sensing, making it possible to dynamically capture the temporal rhythms and spatial patterns of human activities (Mortaheb and Jankowski, 2023; Morosini and Zucaro, 2019). The introduction of machine learning and spatial statistical methods has further improved the precision and efficiency of depicting complex human–environment interactions (Salavati et al., 2025). Against this backdrop, social media data, with their high update frequency, wide coverage, and inherent temporal and geographic attributes, have emerged as a valuable source for detecting leisure and recreation behaviors and analyzing their spatiotemporal rhythms. Building on this perspective, this study takes Beijing as a case study, using Sina Weibo data in combination with machine learning and spatial statistical methods to identify and analyze the temporal distribution, spatial patterns, and thematic characteristics of residents’ leisure and recreation activities. The aim is to reveal the spatiotemporal variations of different types of leisure and recreation activities and their relationships with the distribution of urban facilities, providing empirical evidence for optimizing leisure and recreation space allocation and enhancing urban livability.
In urban geography, mobile phone data is particularly useful in studying dynamic spatial changes and residents’ movement patterns, which reveal how leisure and recreation activities cluster and disperse over time in the urban landscape (Šveda et al., 2020; Liu et al., 2018). The continuous time records provided by mobile phone data can help researchers to analyze urban spatial dispersion patterns and flows (Chen et al., 2017). Social media datasets contain rich textual and visual information that can be analyzed using geospatial methods and machine learning techniques to offer complex insights into how leisure and recreation spaces are perceived and experienced (Liu et al., 2021; Zhu et al., 2022).
Previous geographical studies have adopted various methods, data sources and analytical frameworks to explore the spatial characteristics of leisure and recreation activities. However, the application of social media data to the study of leisure and recreation behaviors, especially the research which combines spatial analysis with text content, is still in its infancy. This study proposes a research path of “semantic perception - topic classification - spatio-temporal analysis”. Firstly, semantic language information is extracted from social media (Weibo) data. Then, from the perspective of urban residents’ activities, the spatio-temporal patterns of their leisure and recreation behaviors are explored, their spatio-temporal distribution characteristics are summarized, and the urban spatial pattern is observed from a new perspective. This method can quickly perceive the reactions of urban residents to specific events, and display people’s attitudes on the map at the same time, helping urban managers quickly understand public opinions, optimize the urban functional structure, and provide scientific reference value.
Based on the above background and research gaps, this study aims to address the following research questions: First, what are the spatiotemporal rhythm patterns of urban residents’ leisure and recreation activities in Beijing, and how do these patterns vary between weekdays and weekends? Second, what types of leisure and recreation activities can be identified from social media data, and what are their distinctive temporal and spatial characteristics? Third, how do the spatial distribution patterns of different leisure and recreation activities relate to urban facility distribution and accessibility? Fourth, what are the cross-district mobility patterns for leisure and recreation activities, and what do these patterns reveal about spatial inequalities in leisure and recreation infrastructure access? By answering these questions, this study seeks to provide empirical evidence for understanding urban leisure and recreation dynamics and informing evidence-based urban planning decisions for leisure and recreation space optimization in Beijing.
The structure of the remaining part in this article are as follows: Section 2 introduces the study area and data. Section 3 elaborates on the methodology in detail. Section 4 presents the temporal and spatial changes in citizens’ leisure and recreation activities, as well as the results of thematic classification. Finally, Sections 5 and 6 provide discussion and conclusion, including implications for urban spatial planning and management.
2 Materials and methods
2.1 Study area
Beijing is the capital of China and has 16 administrative districts. By the end of 2019, the population of Beijing had reached 21.9 million. With the development of China’s economy and society, more and more people have the demand for leisure and recreation travel. Moreover, these variable leisure and recreation makes Beijing become the place where residents’ leisure and recreation travel behaviors occur frequently (Figure 1).
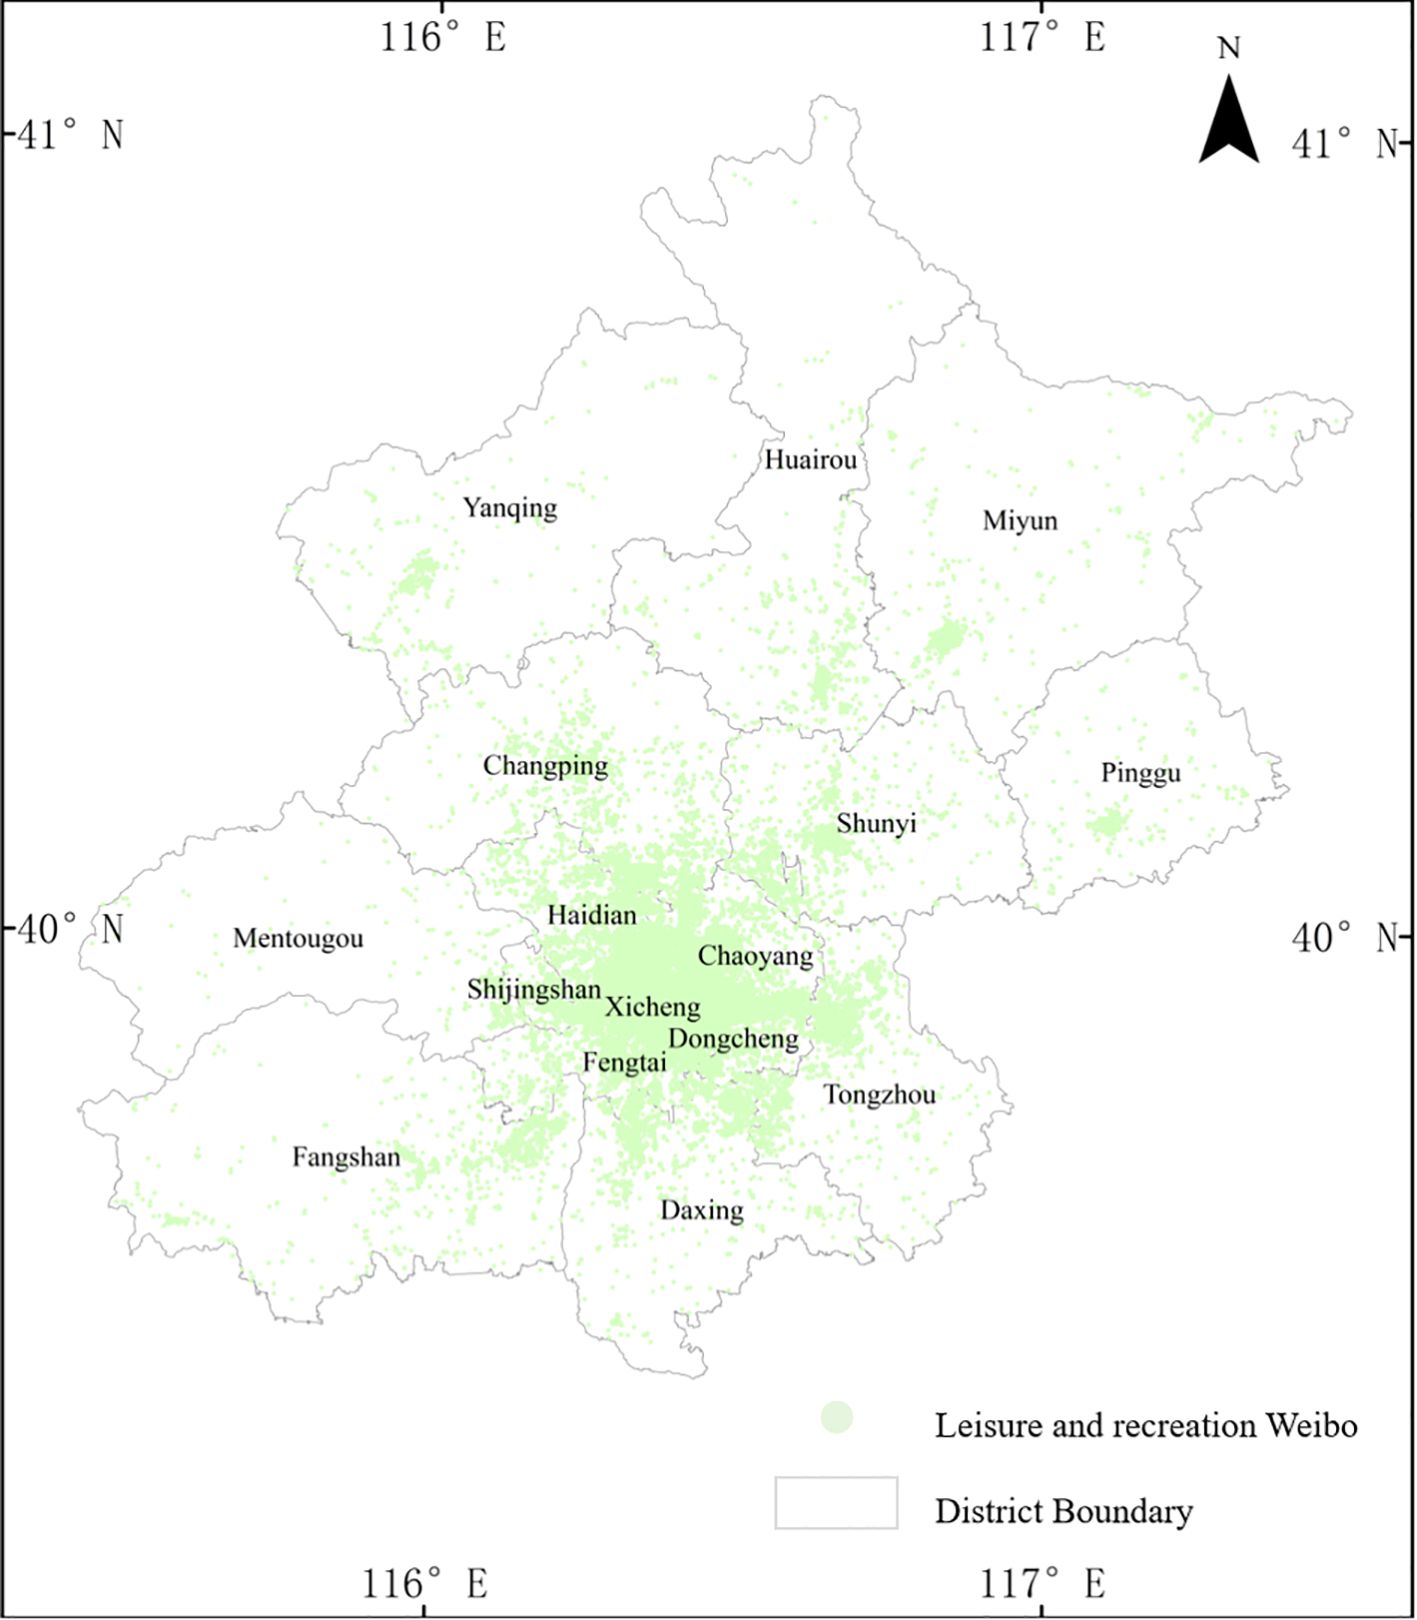
Figure 1. Study area.
2.2 Data sources
2.2.1 Social media data
Sina Weibo, as one of the most frequently used social media platforms in China, has been widely recognized and adopted by a large number of users. As a result, a vast amount of user-generated location information (coordinates), time information, and text information have been stored in the new granularity of Weibo. This study obtained the Weibo data of the Beijing area for the entire year of 2019 to investigate the distribution of citizens’ spatial and temporal leisure and recreation activities, as well as the related semantic texts. The main fields include id (user number), Co-ordinal (latitude), Co-oridi-1 (longitude), PubTime (time of publication), etc. Based on the above fields, Python language was used to conduct machine learning on the semantic texts of Weibo to identify 137,007 Weibo texts related to leisure and recreation, perform text preprocessing and semantic analysis, and use ArcGIS software to spatially display the processed Weibo data based on these location information for further spatial analysis and statistics.
2.2.2 Basic geographic data
In this study, all administrative boundaries maps were obtained from the National Earth System Science Data Center (http://www.geodata.cn/). These boundaries were used to separate counties and extract the Weibo items for the study area. At the same time, the background maps were obtained from Baidu map and open street map, visualized by ArcGIS 10.3.
2.3 Methods
The research framework of this paper follows the process shown in Figure 2.
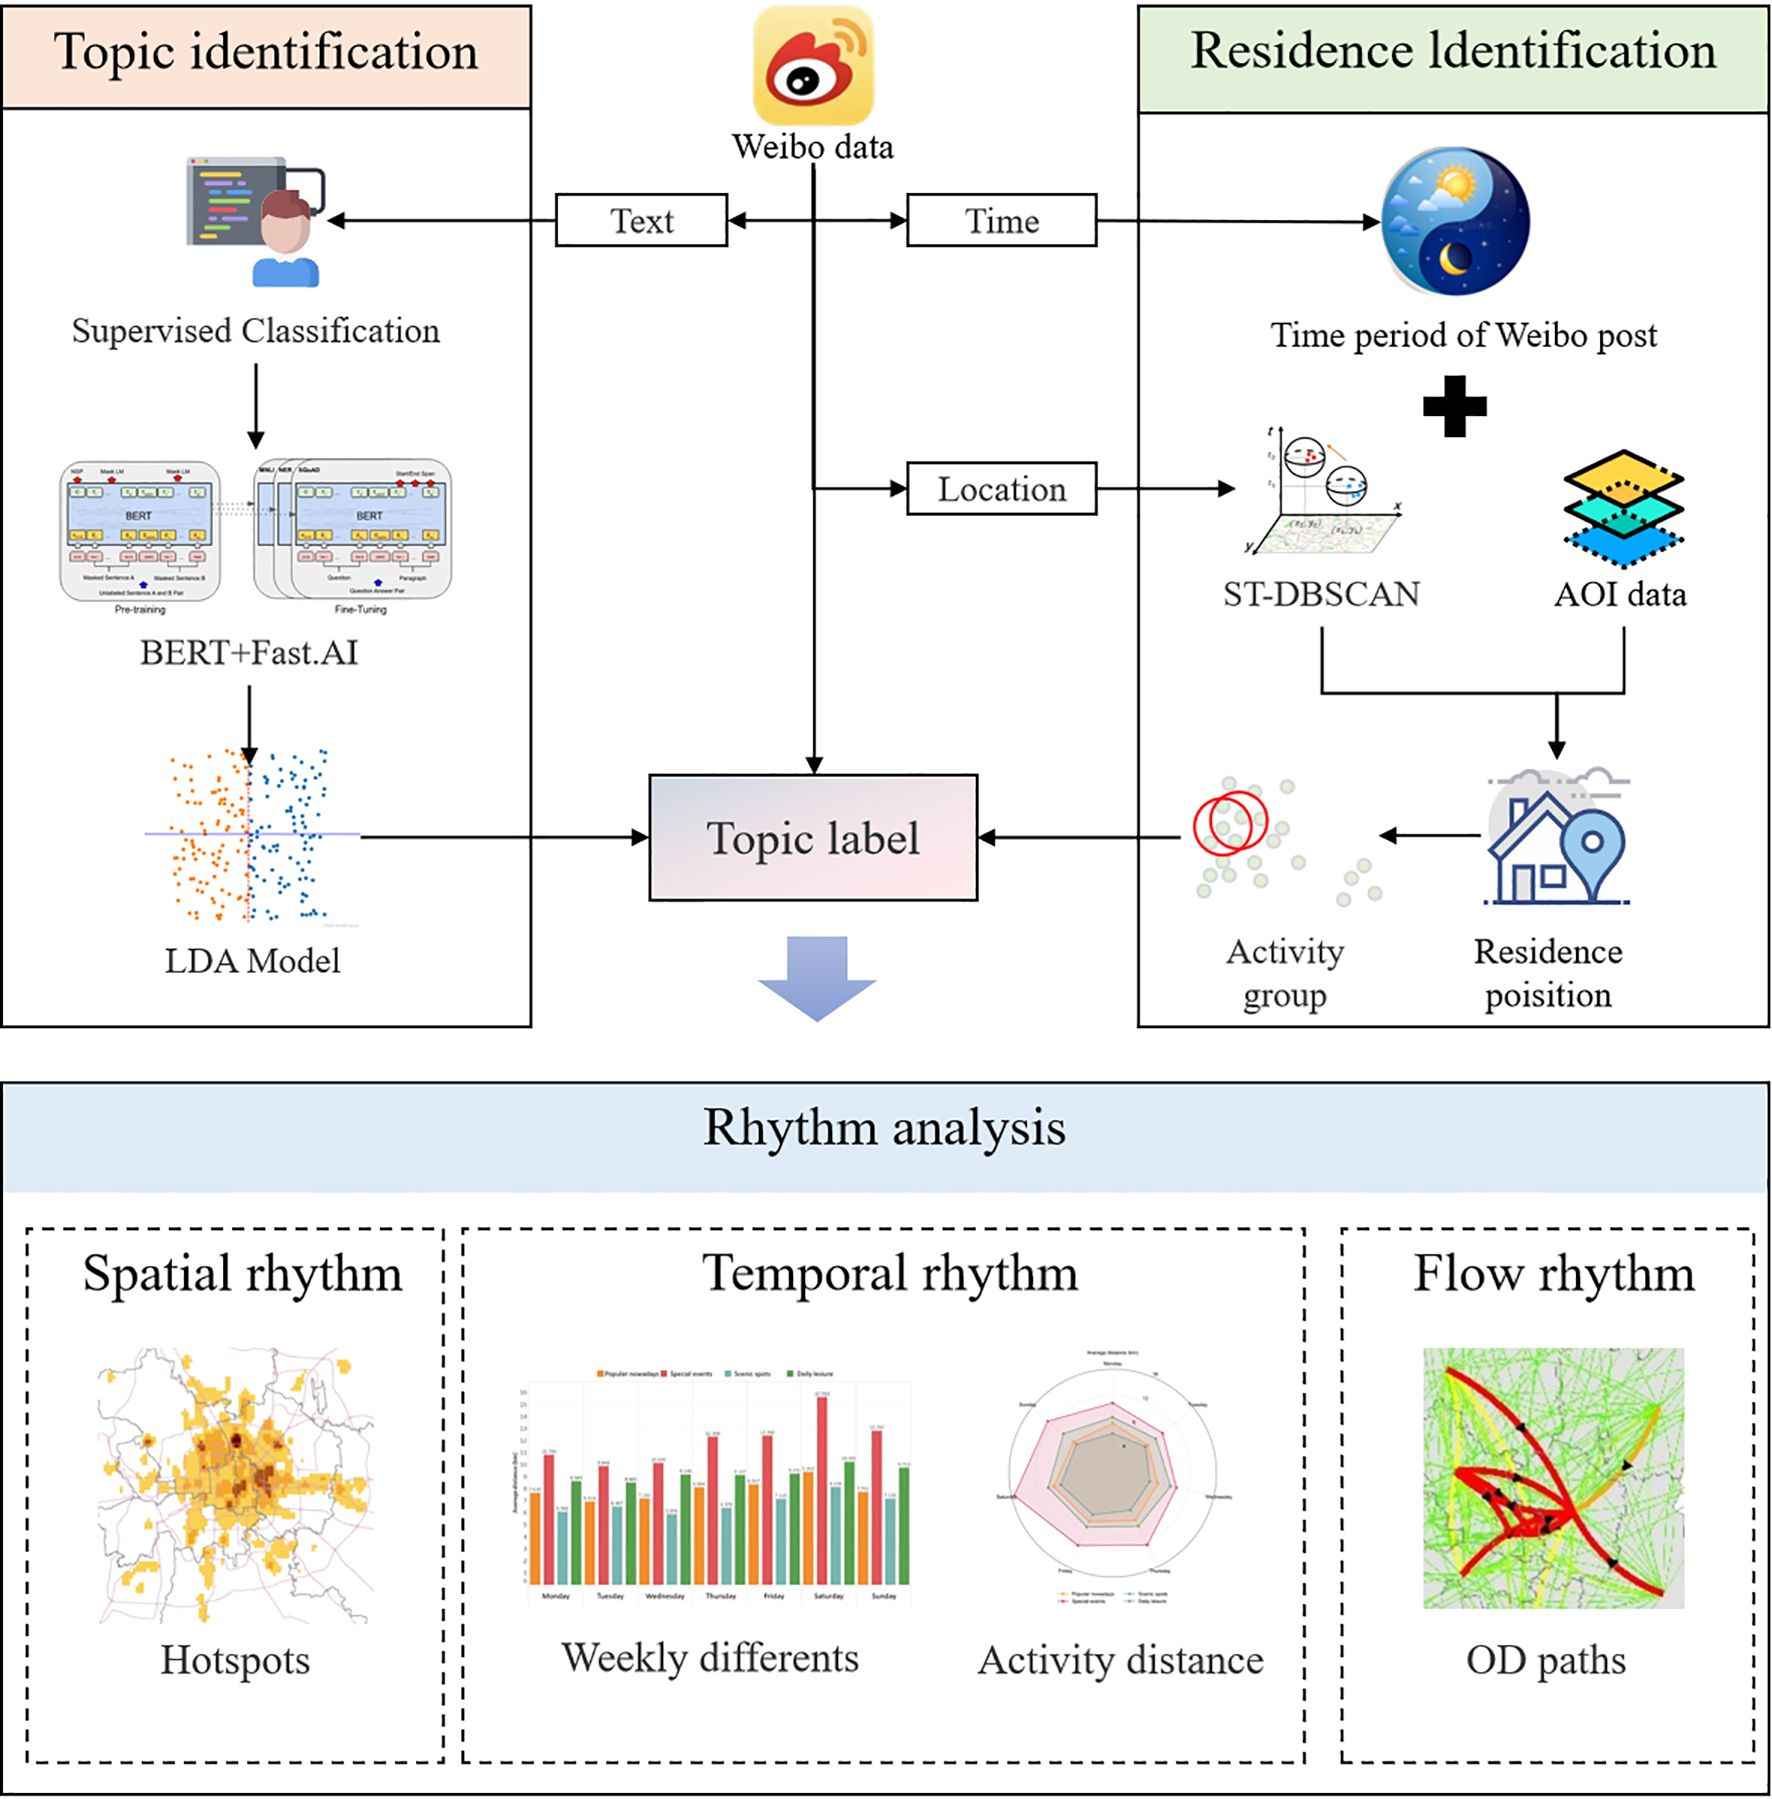
Figure 2. Research framework.
First, this study identifies the cleaned Weibo text information, and then inputs all the Weibo data into the natural language processing (NLP) model for machine learning and topic classification to summarize the themes of leisure and recreation activities. Second, this study combines the Weibo data with the AOI (Area of Interest) data to determine the residence location of Weibo users, and then calculates the straight-line distance between the user’s residence location and the location where the Weibo was sent. Third, this study combines the results of semantic analysis with the results of residence location identification to analyze the temporal rhythm characteristics and spatial distribution characteristics of urban residents’ leisure and recreation activities.
2.3.1 Bidirectional Encoder Representation from Transformers model
In order to quickly identify the text information related to leisure and recreation in Weibo data, this study uses the NLP method to improve the recognition efficiency, and the Bidirectional Encoder Representations from Transformers (BERT) model (Devlin et al., 2019) is employed. BERT, released by Google in November 2018, is a language model that can significantly enhance the accuracy of text recognition and represents a breakthrough in the field of NLP. This study first explores the text content of Weibo after cleaning to remove garbled characters and emoticons. Then, 10,000 Weibo posts are randomly selected for manual identification, with those related to leisure and recreation activities marked as 1 and the rest marked as 0.
When determining whether content is related to leisure and recreation, we follow these criteria: First, we assess whether the content contains actions. If actions are present, we evaluate whether these actions are related to leisure and recreation, such as playing, strolling, checking in, etc. If such actions exist, the leisure and recreation attribute is established. If no actions are present, we then determine whether the content features leisure and recreation facilities, such as malls, parks, tourist attractions, etc., or contains relaxing elements, such as sunshine, movies, games, etc. More Attention that some textual content may convey negative emotional attributes, but if it meets the above criteria, it still qualifies as leisure and recreation behavior. The example of content evaluate is shown in Table 1.
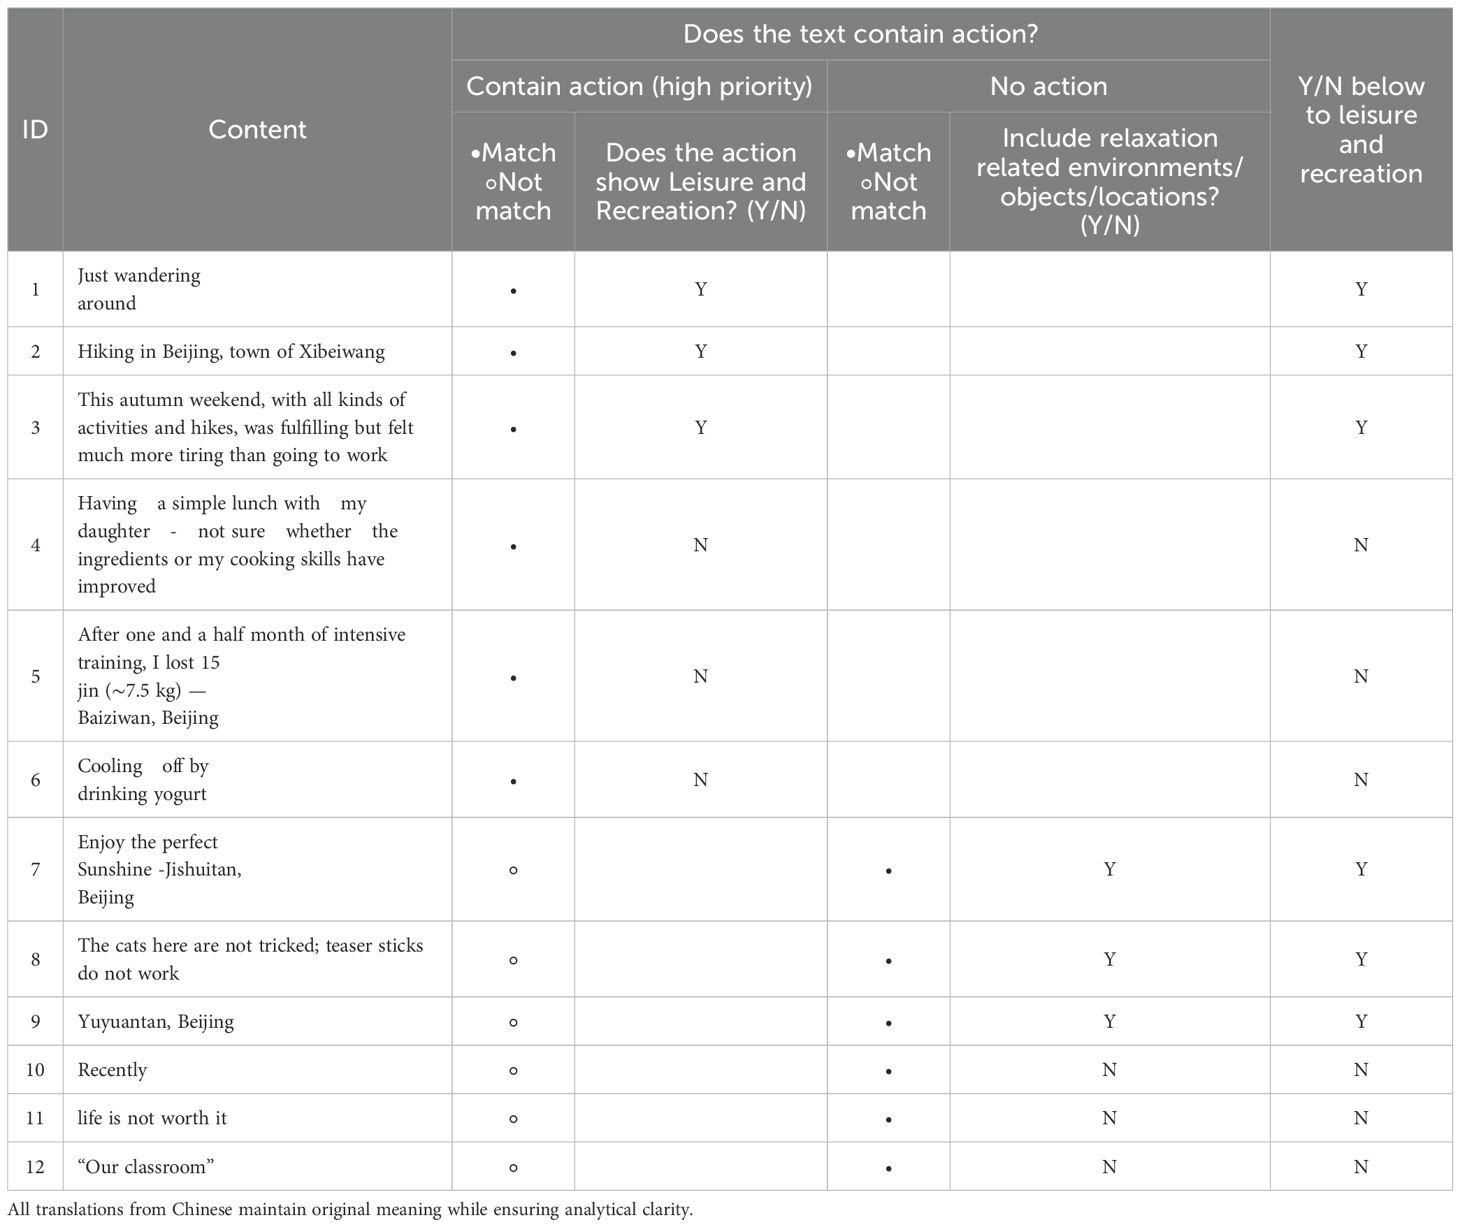
Table 1. Classification of social media posts for leisure and recreation activities.
Finally, a training set is formed. In the next step, the BERT model is compiled using the Python language to pre-train Weibo posts related to leisure and recreation and continuously iterate until the training accuracy reaches a very high level (the training accuracy of the model in this study is 93%). Finally, 137,007 Weibo posts are identified and used for further analysis.
2.3.2 Latent Dirichlet Allocation
Urban residents have a wide variety of leisure and recreation activities. Similarly, the leisure and recreation feelings and activity types expressed in the Weibo space are also diverse. Therefore, classification plays an important role in the feature summary of semantic text (Yang et al., 2025). This study uses the Latent Dirichlet Allocation (LDA) topic model proposed by David M. Blei et al (Blei et al., 2003), which has become a typical case in the research combining geographic big data in recent years (Su et al., 2019; Liang and Li, 2020).
This study employs the LDA topic model to conduct topic mining on the identified data of leisure and recreation activities. The main topic words were extracted and classified, and the word frequencies within the selected topics were estimated. The commonalities and logical patterns of the high-frequency topic words in each topic type were studied, and the typical trends of each topic were summarized. After testing, it was found that the best classification effect was achieved when the number of topics was set to 4. The independence of the topic words in each topic became more obvious, and there was no overlap among the main topic words in each topic type, which facilitated the separate analysis of each topic.
2.3.3 Spatial statistical analysis
Kernel density analysis is a typical method in spatial analysis. It can interpolate based on the geographical location points of large-scale events and highlight hotspots. Compared with simple heat maps, kernel density analysis focuses more on high-value areas, thereby providing more precise spatial range references and facilitating further exploration of event sources. The kernel density estimation of point elements is used to analyze and display the density of points. The Equation 1 for kernel density is as follows:
SearchRadius is the default search radius, SD is the standard distance, is the median distance, and n is the number of points.
2.3.4 Spatio-temporal-density-based spatial clustering of application with noise
This study uses a spatio-temporal clustering model called spatio-temporal DBSCAN (ST-DBSCAN) (Birant and Kut, 2007) for residence identification. The ST-DBSCAN formula system is a spatio-temporal extension of the classic DBSCAN algorithm, with its core focusing on defining distance metrics and neighborhood rules suitable for three-dimensional data (two-dimensional space combined with dimensional time). ST-DBSCAN employs a parameterized distance formula to integrate the spatial and temporal dimensions. The Equation 2 for ST-DBSCAN is as follows:
and represent spatiotemporal data points, each containing spatial coordinates and timestamp information , i.e.,
For point p to be a core point, it must satisfy Equation 3:
represents the spatio-temporal neighborhood set of point , all points that satisfy .
Compared to traditional DBSCAN, ST-DBSCAN effectively captures the correlation of spatio-temporal events by introducing the temporal dimension parameter .
ST-DBSCAN is an improved version of the spatial clustering model DBSCAN (Density-Based Spatial Clustering of Applications with Noise) (Kriegel et al., 2011) by adding a temporal dimension. The clustering process is illustrated in Figure 3 and the rules for identifying the residential locations of Weibo users are shown in Table 2.
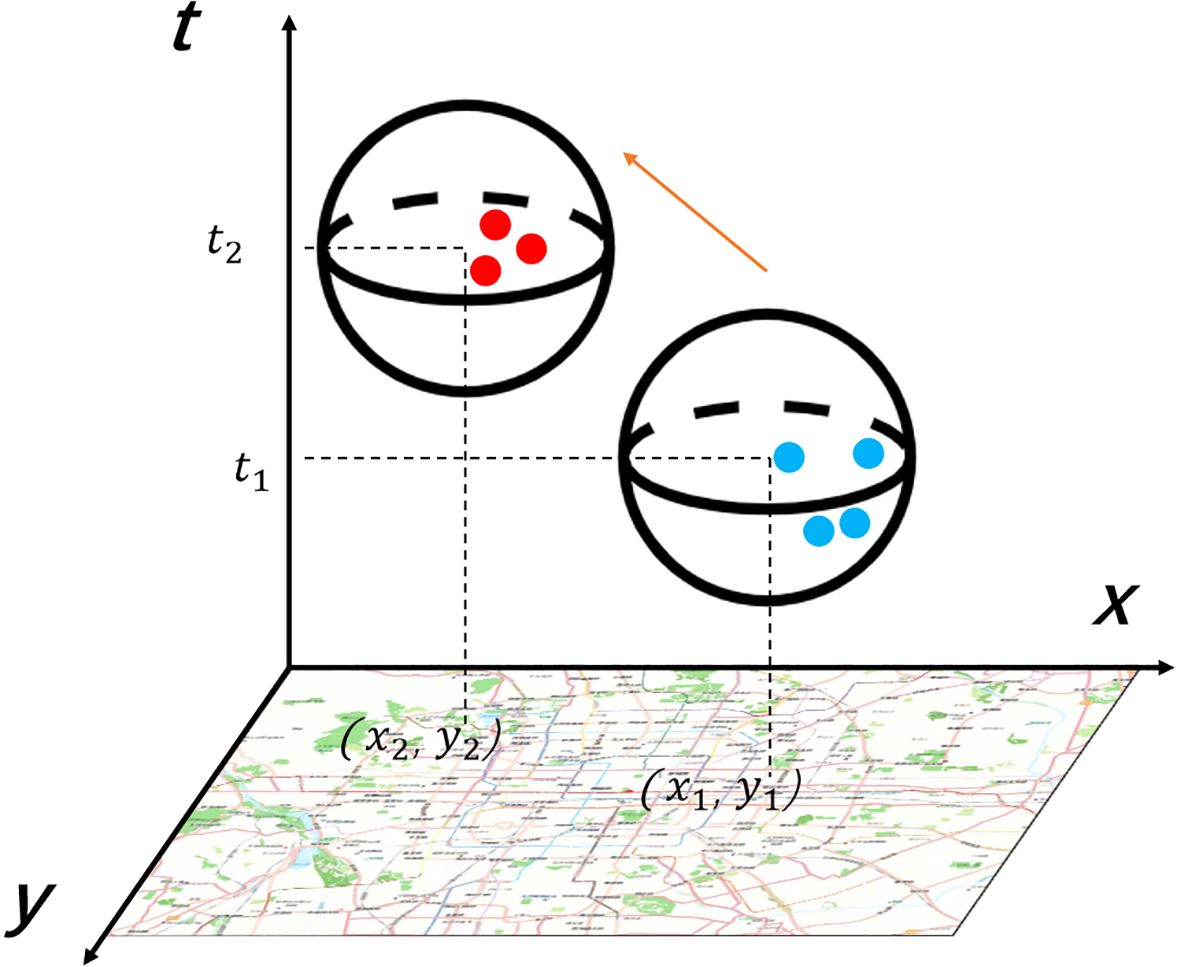
Figure 3. ST-DBSCAN clustering process.
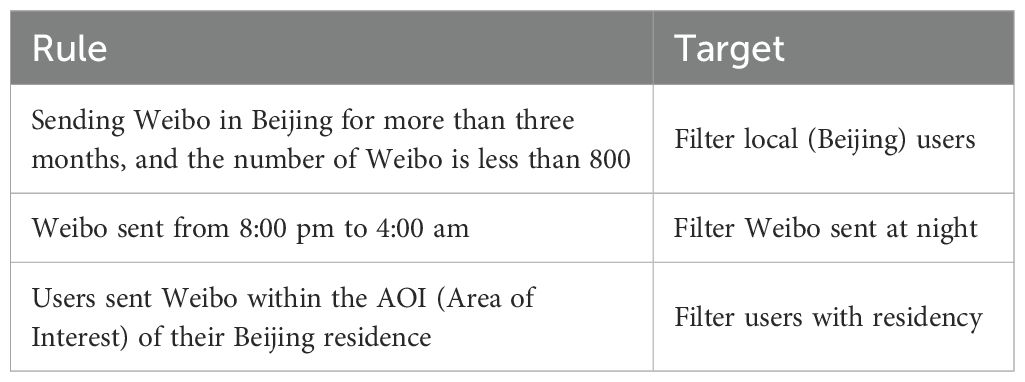
Table 2. Rules for identifying the residence of Weibo users.
3 Results
3.1 Leisure and recreation activities topics classification and sensing
Based on the results from the LDA topic model, this study attempts to set the number of topic categories from 1 to 10. After conducting a consistency test, the consistency score was the highest when the number of categories was 4 (Figure 4), and the perplexity began to show a significant downward trend from this point (Figure 5). Therefore, the optimal number of categories is determined which is 4.
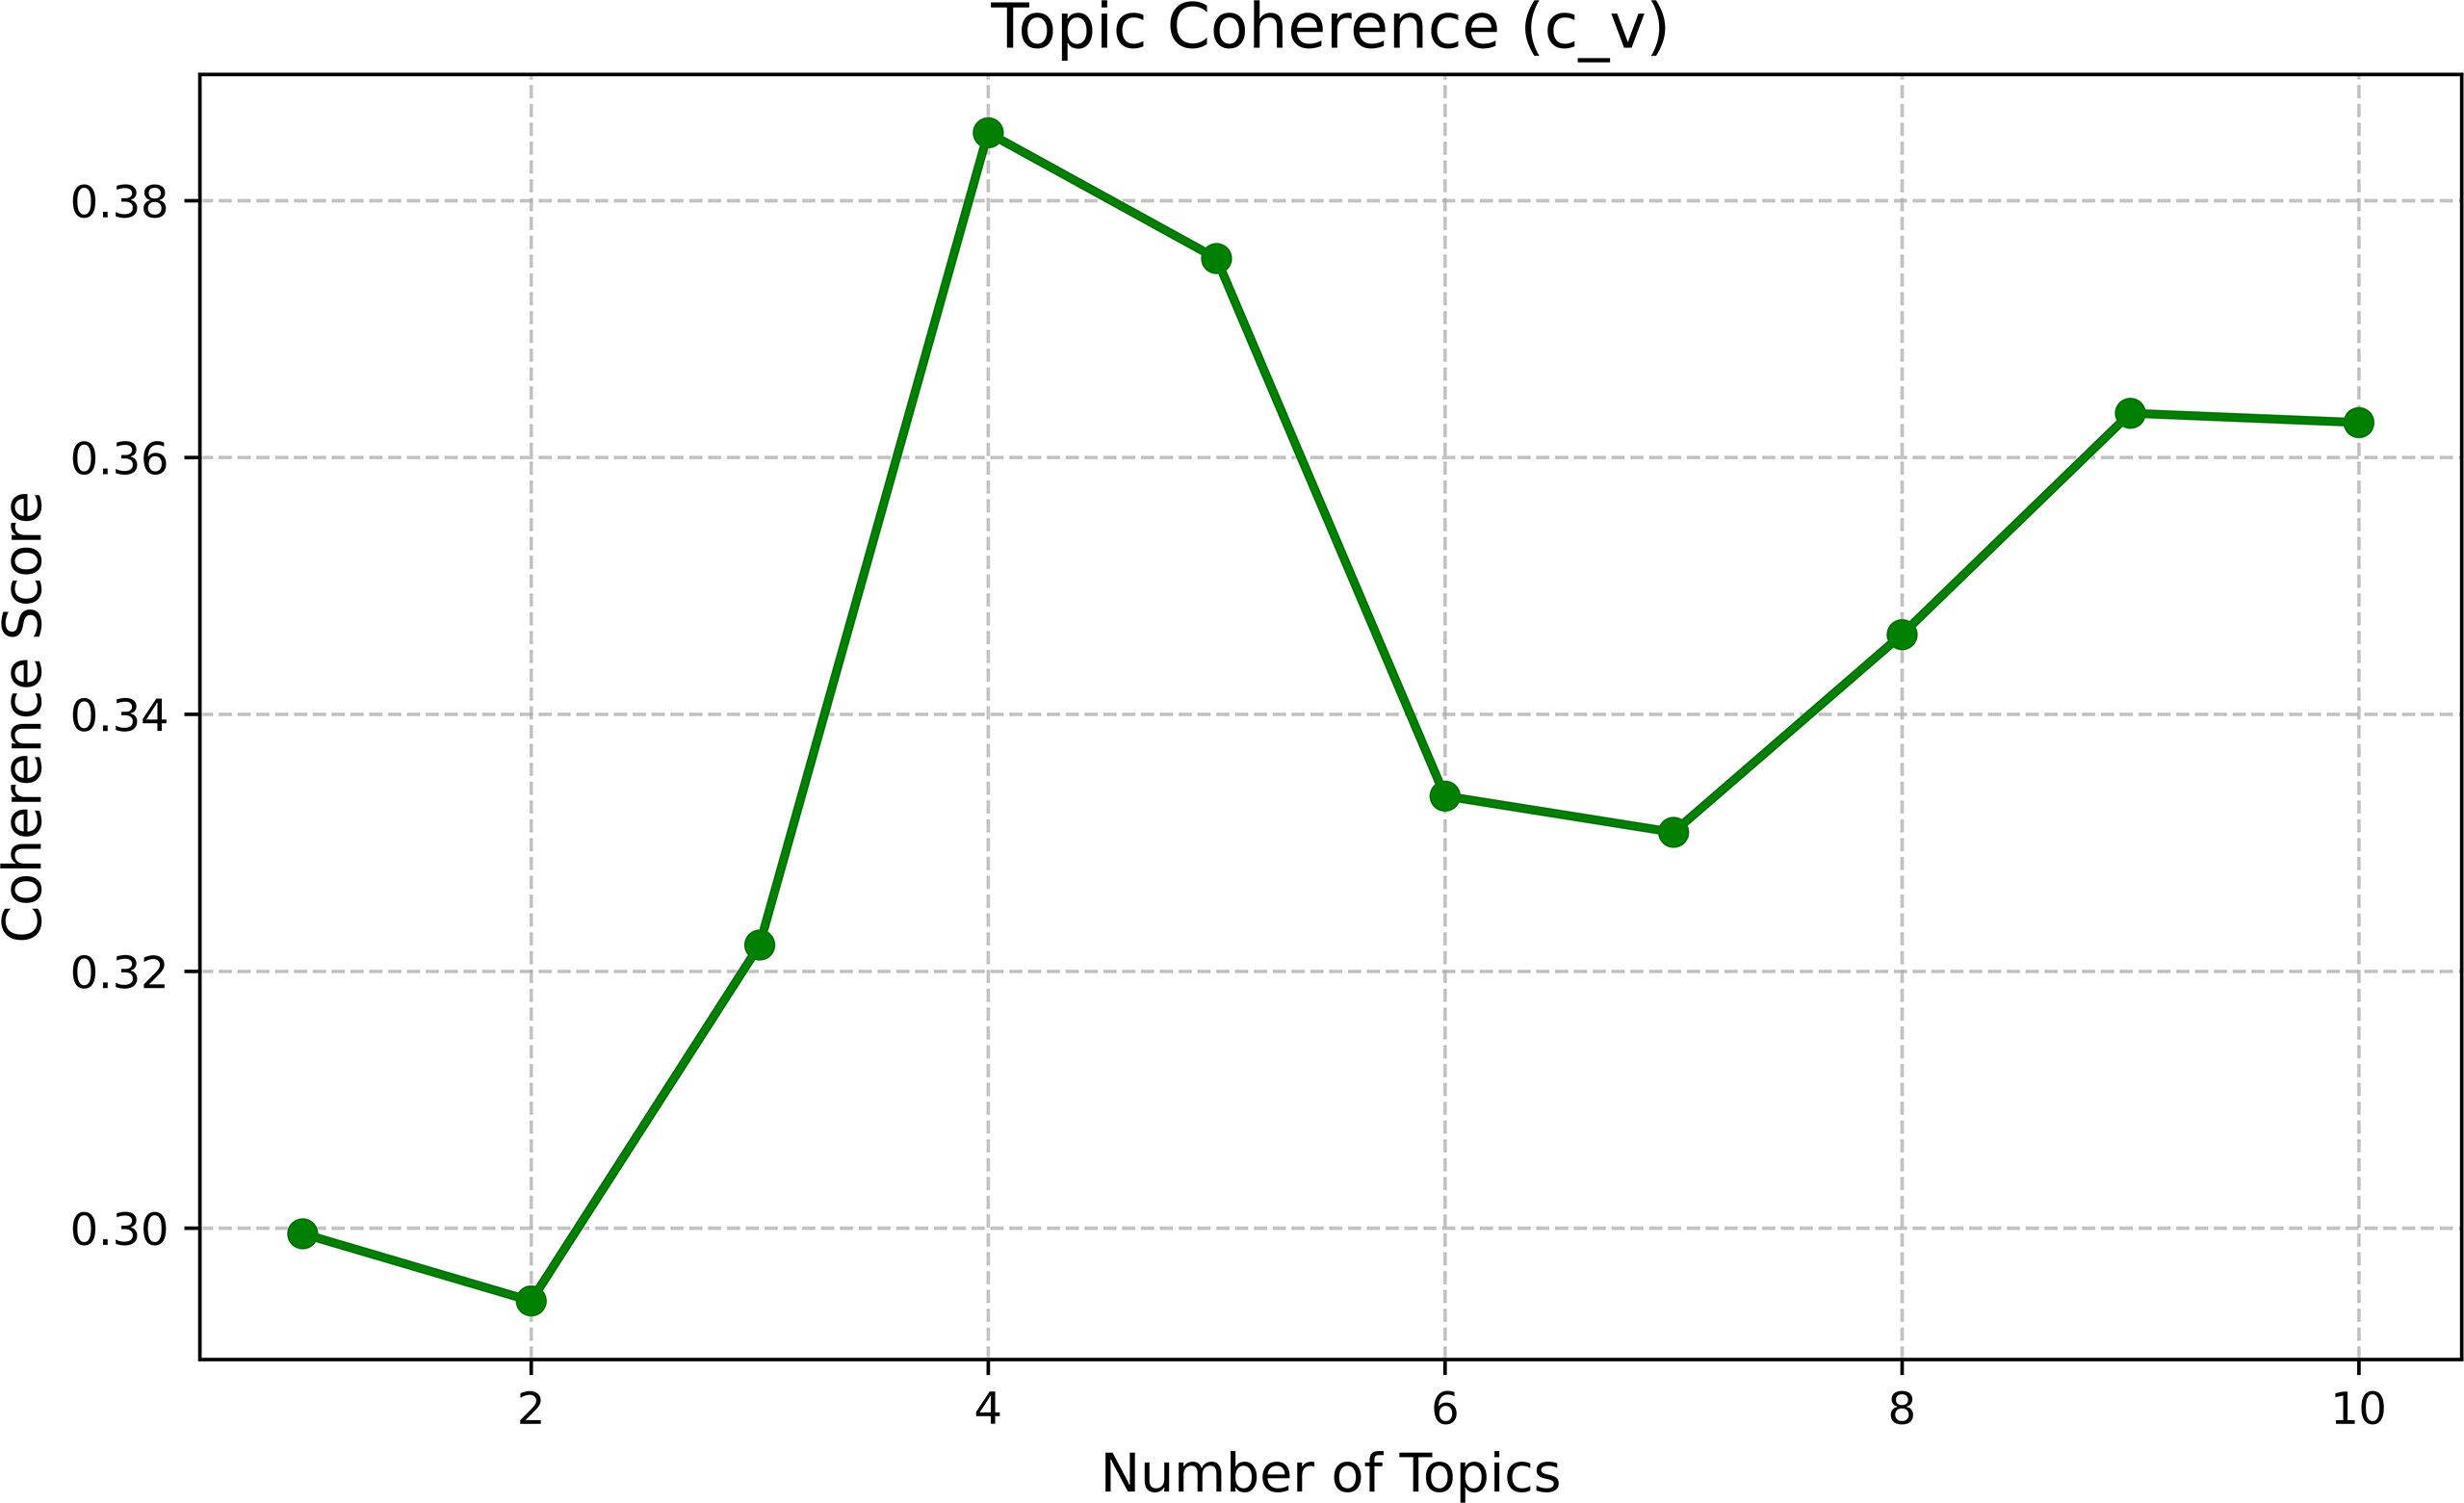
Figure 4. Coherence score of LDA topic numbers.
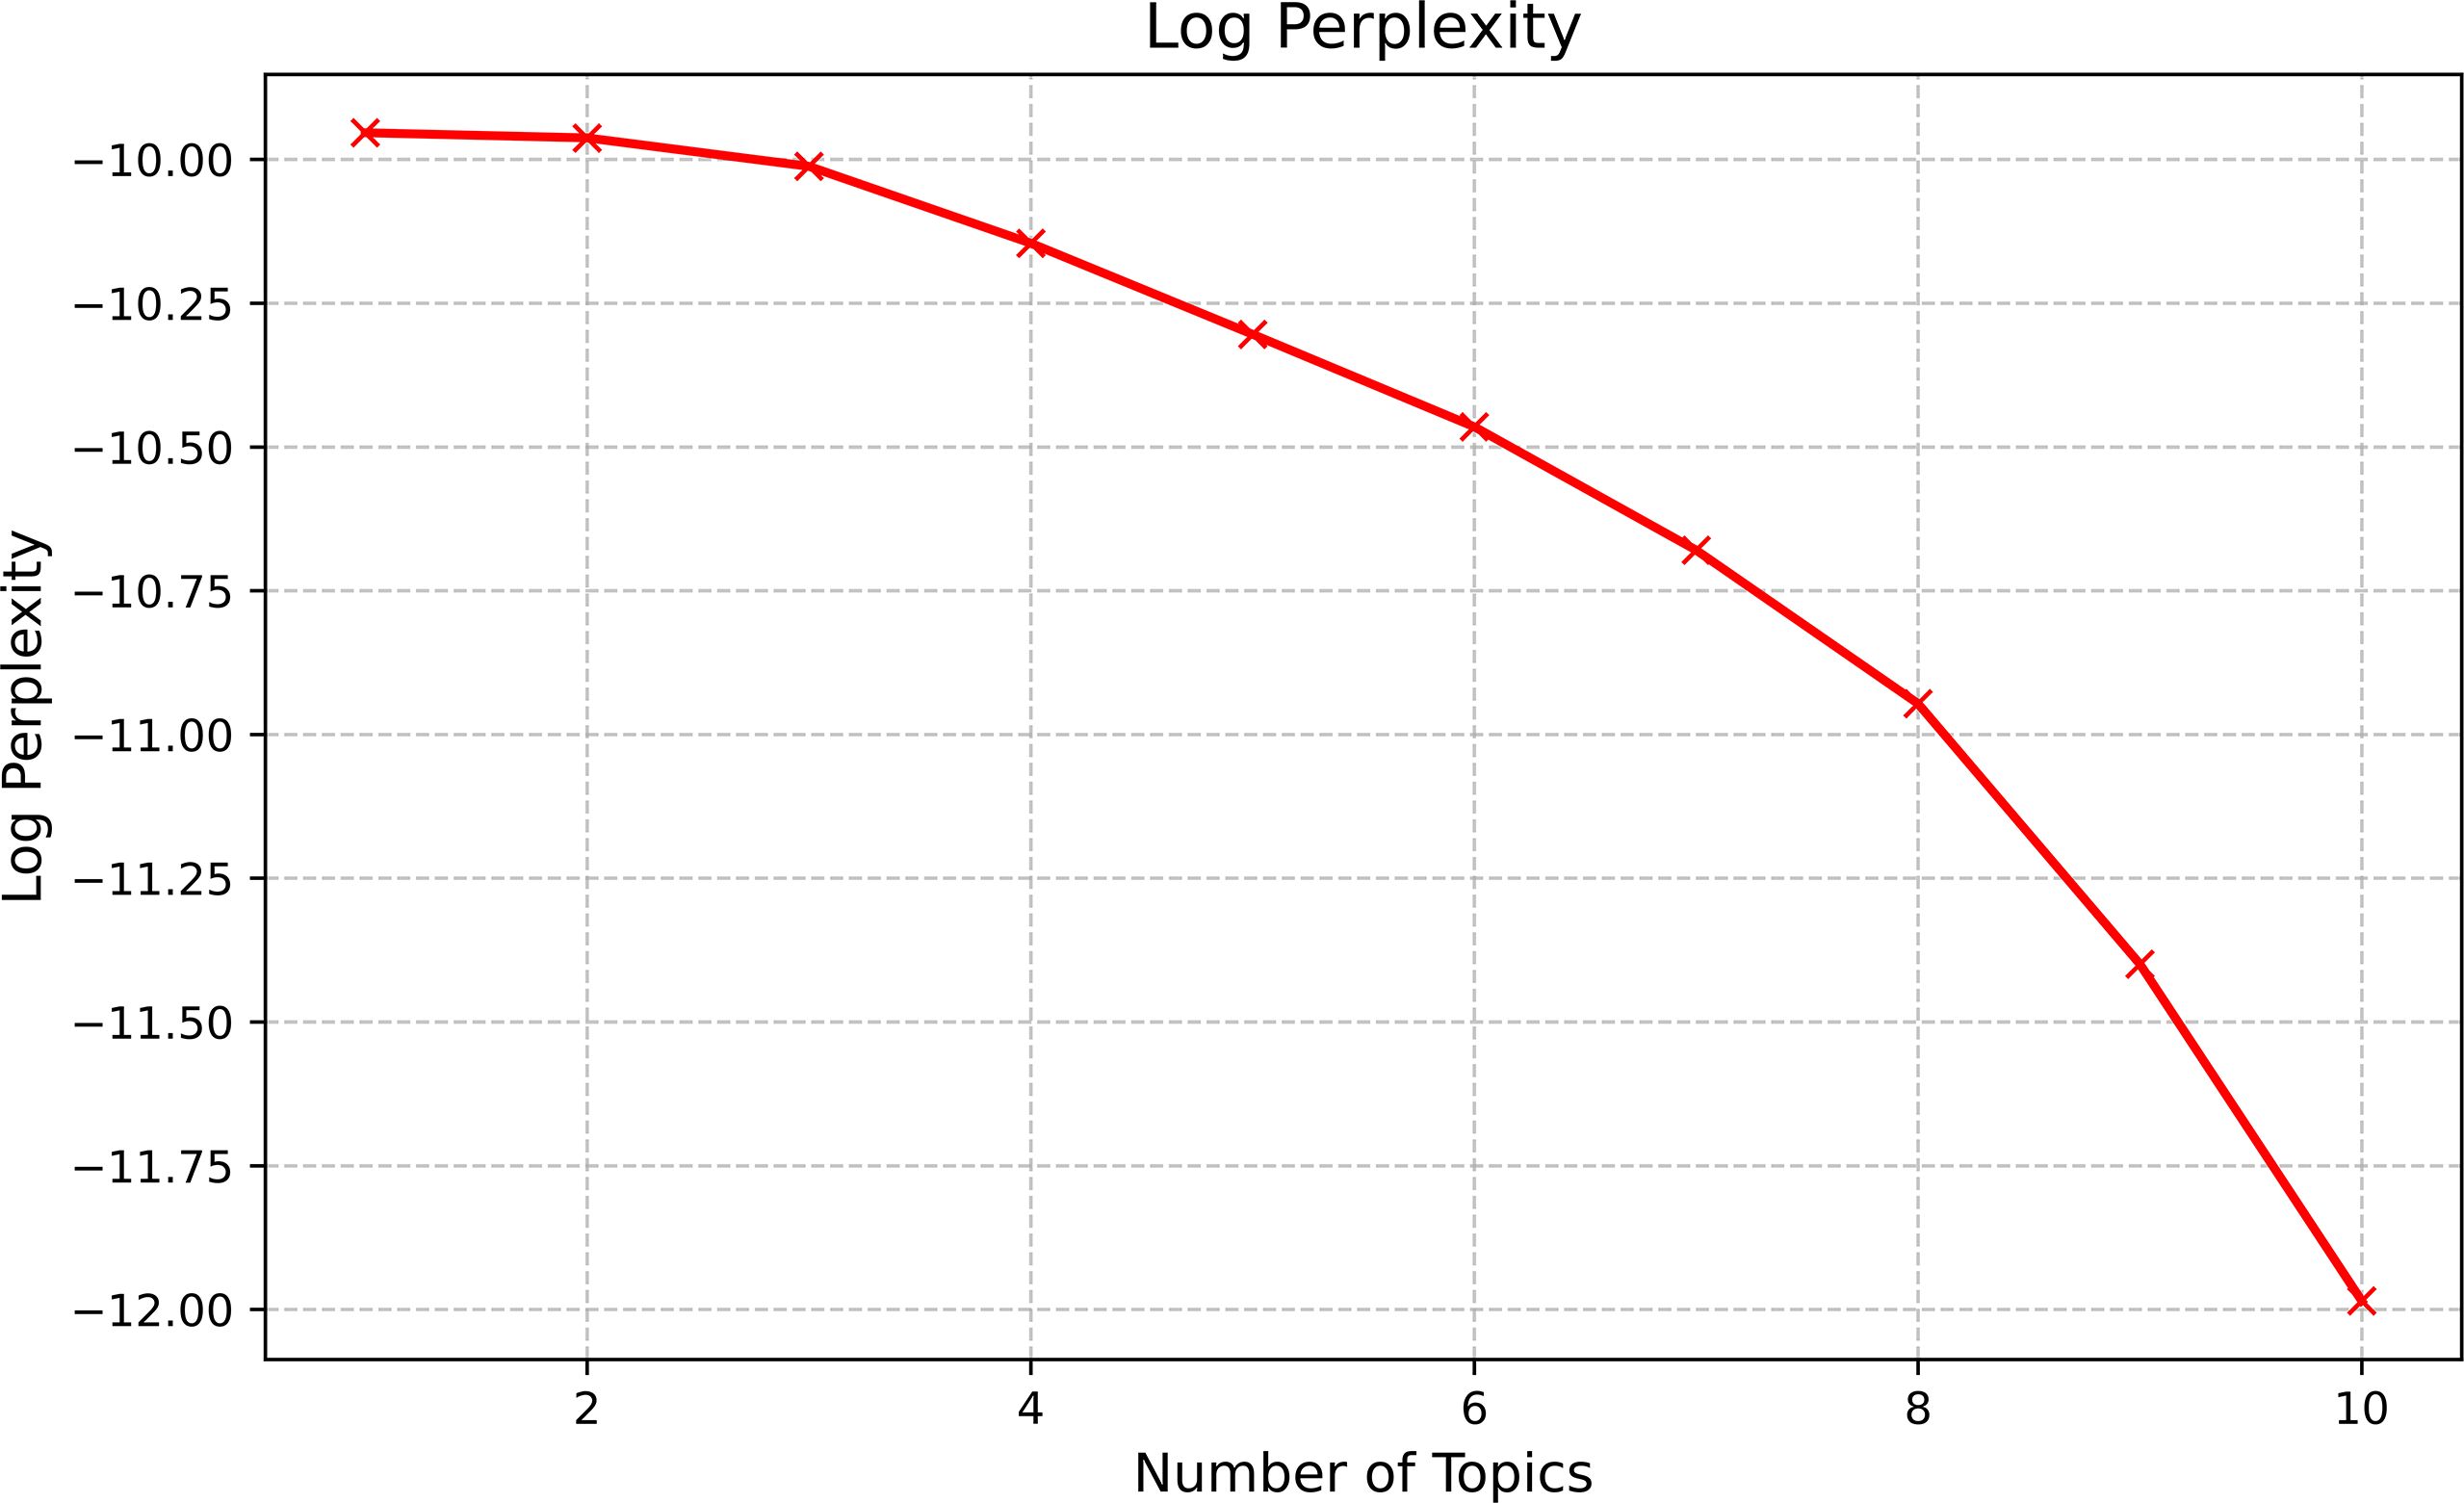
Figure 5. Perplexity of LDA topic numbers.
Based on the BERT classification algorithm, 137,007 Weibo posts containing residential information about citizens’ leisure and recreation activities were identified and placed into the LDA topic model for classification. Eventually, 57,971 Weibo posts with clear thematic features were obtained. The detailed list of topics and untitled topics is shown in Table 3. We summarized the characteristics of each topic based on the high-frequency words (Table 4). Significant differences can be found among the high-frequency words.
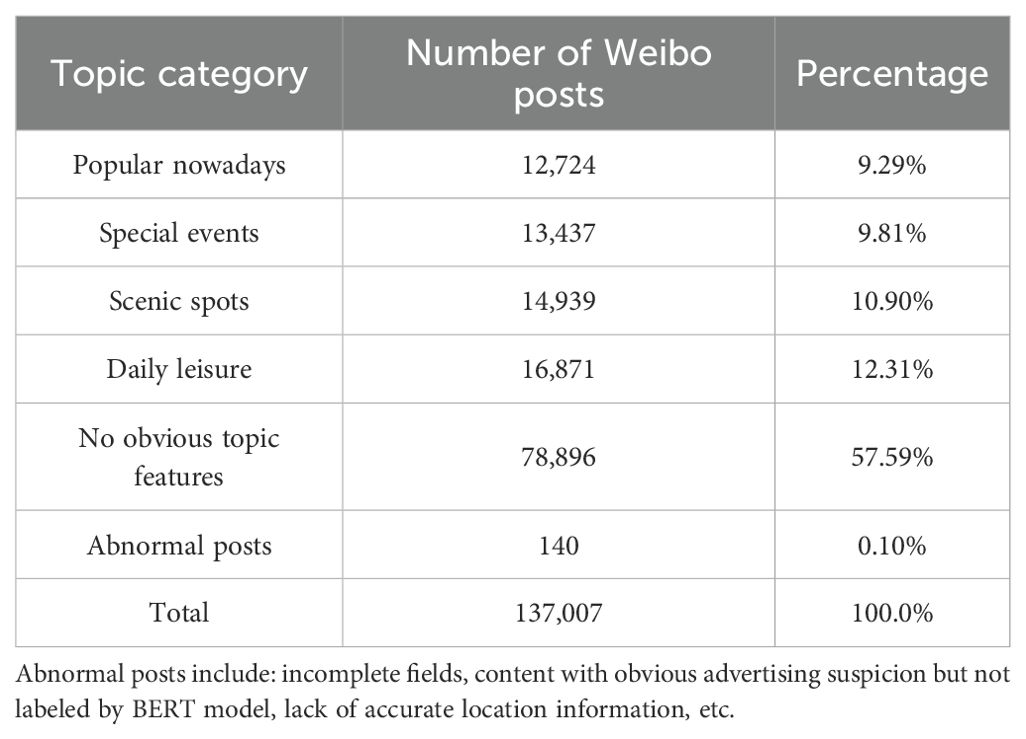
Table 3. Classification results of LDA topic model.
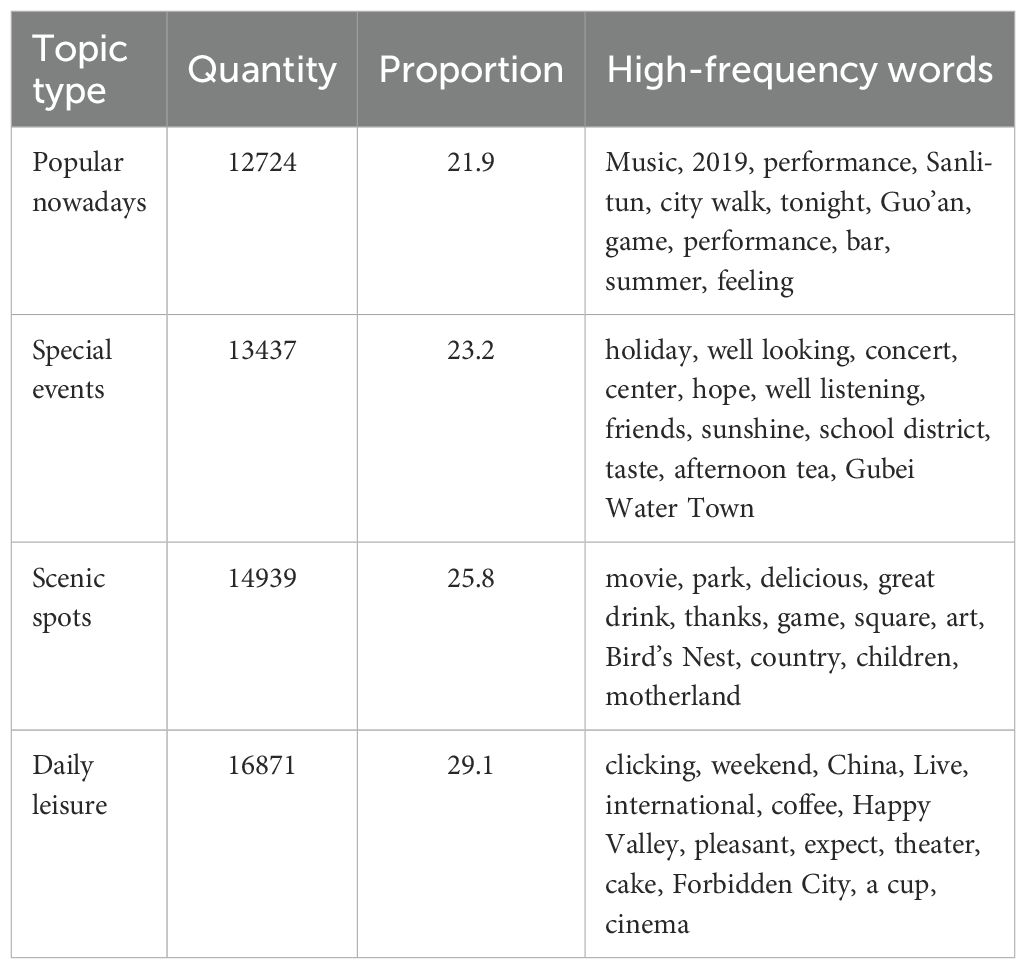
Table 4. LDA topic classification result statistics.
The vocabulary in the “Popular Nowadays” theme can reflect the time, location and activity content expressed in the Weibo text information. These contents are relatively broad and do not specifically refer to the activities carried out. When people express themselves on Weibo, due to environmental factors, time urgency or even personal subjective will, they may not describe more specific things. The locations mentioned in the high-frequency words are also places where popular things often gather at present.
The high-frequency words in the theme “Special Events” reflect activities that do not have a definite location but involve specific events. These events are usually accompanied by social activities and have relatively high costs in terms of time and space.
The high-frequency words in the theme “Scenic Spots” enable us to understand specific leisure and recreation venues or activities. These leisure destinations can offer tourists a variety of experiences and feelings. Meanwhile, people can engage in various activities such as dining while relaxing in these places.
Compared with the above three themes, the vocabulary in the “Daily Leisure” theme more reflects a mental state. In this theme, images of leisure and recreation activities are always integrated with other types of activities, but these activities can help people relax and improve their mental state when they are engaged in them. The temporal and spatial restrictions on the appearance of this theme are relatively low, so it accounts for the largest proportion among all theme types.
3.2 Temporal characteristics of citizens’ leisure and recreation activities
A working day refers to a standard business day (Monday to Friday), during which most offices, schools and government agencies operate on normal hours. The weekend includes Saturday and Sunday, when most businesses and institutions are closed. The work and life cycle of urban residents is one week, so the number of microblogs on different themes of leisure and recreation within a week has certain rhythm characteristics (Figure 6).
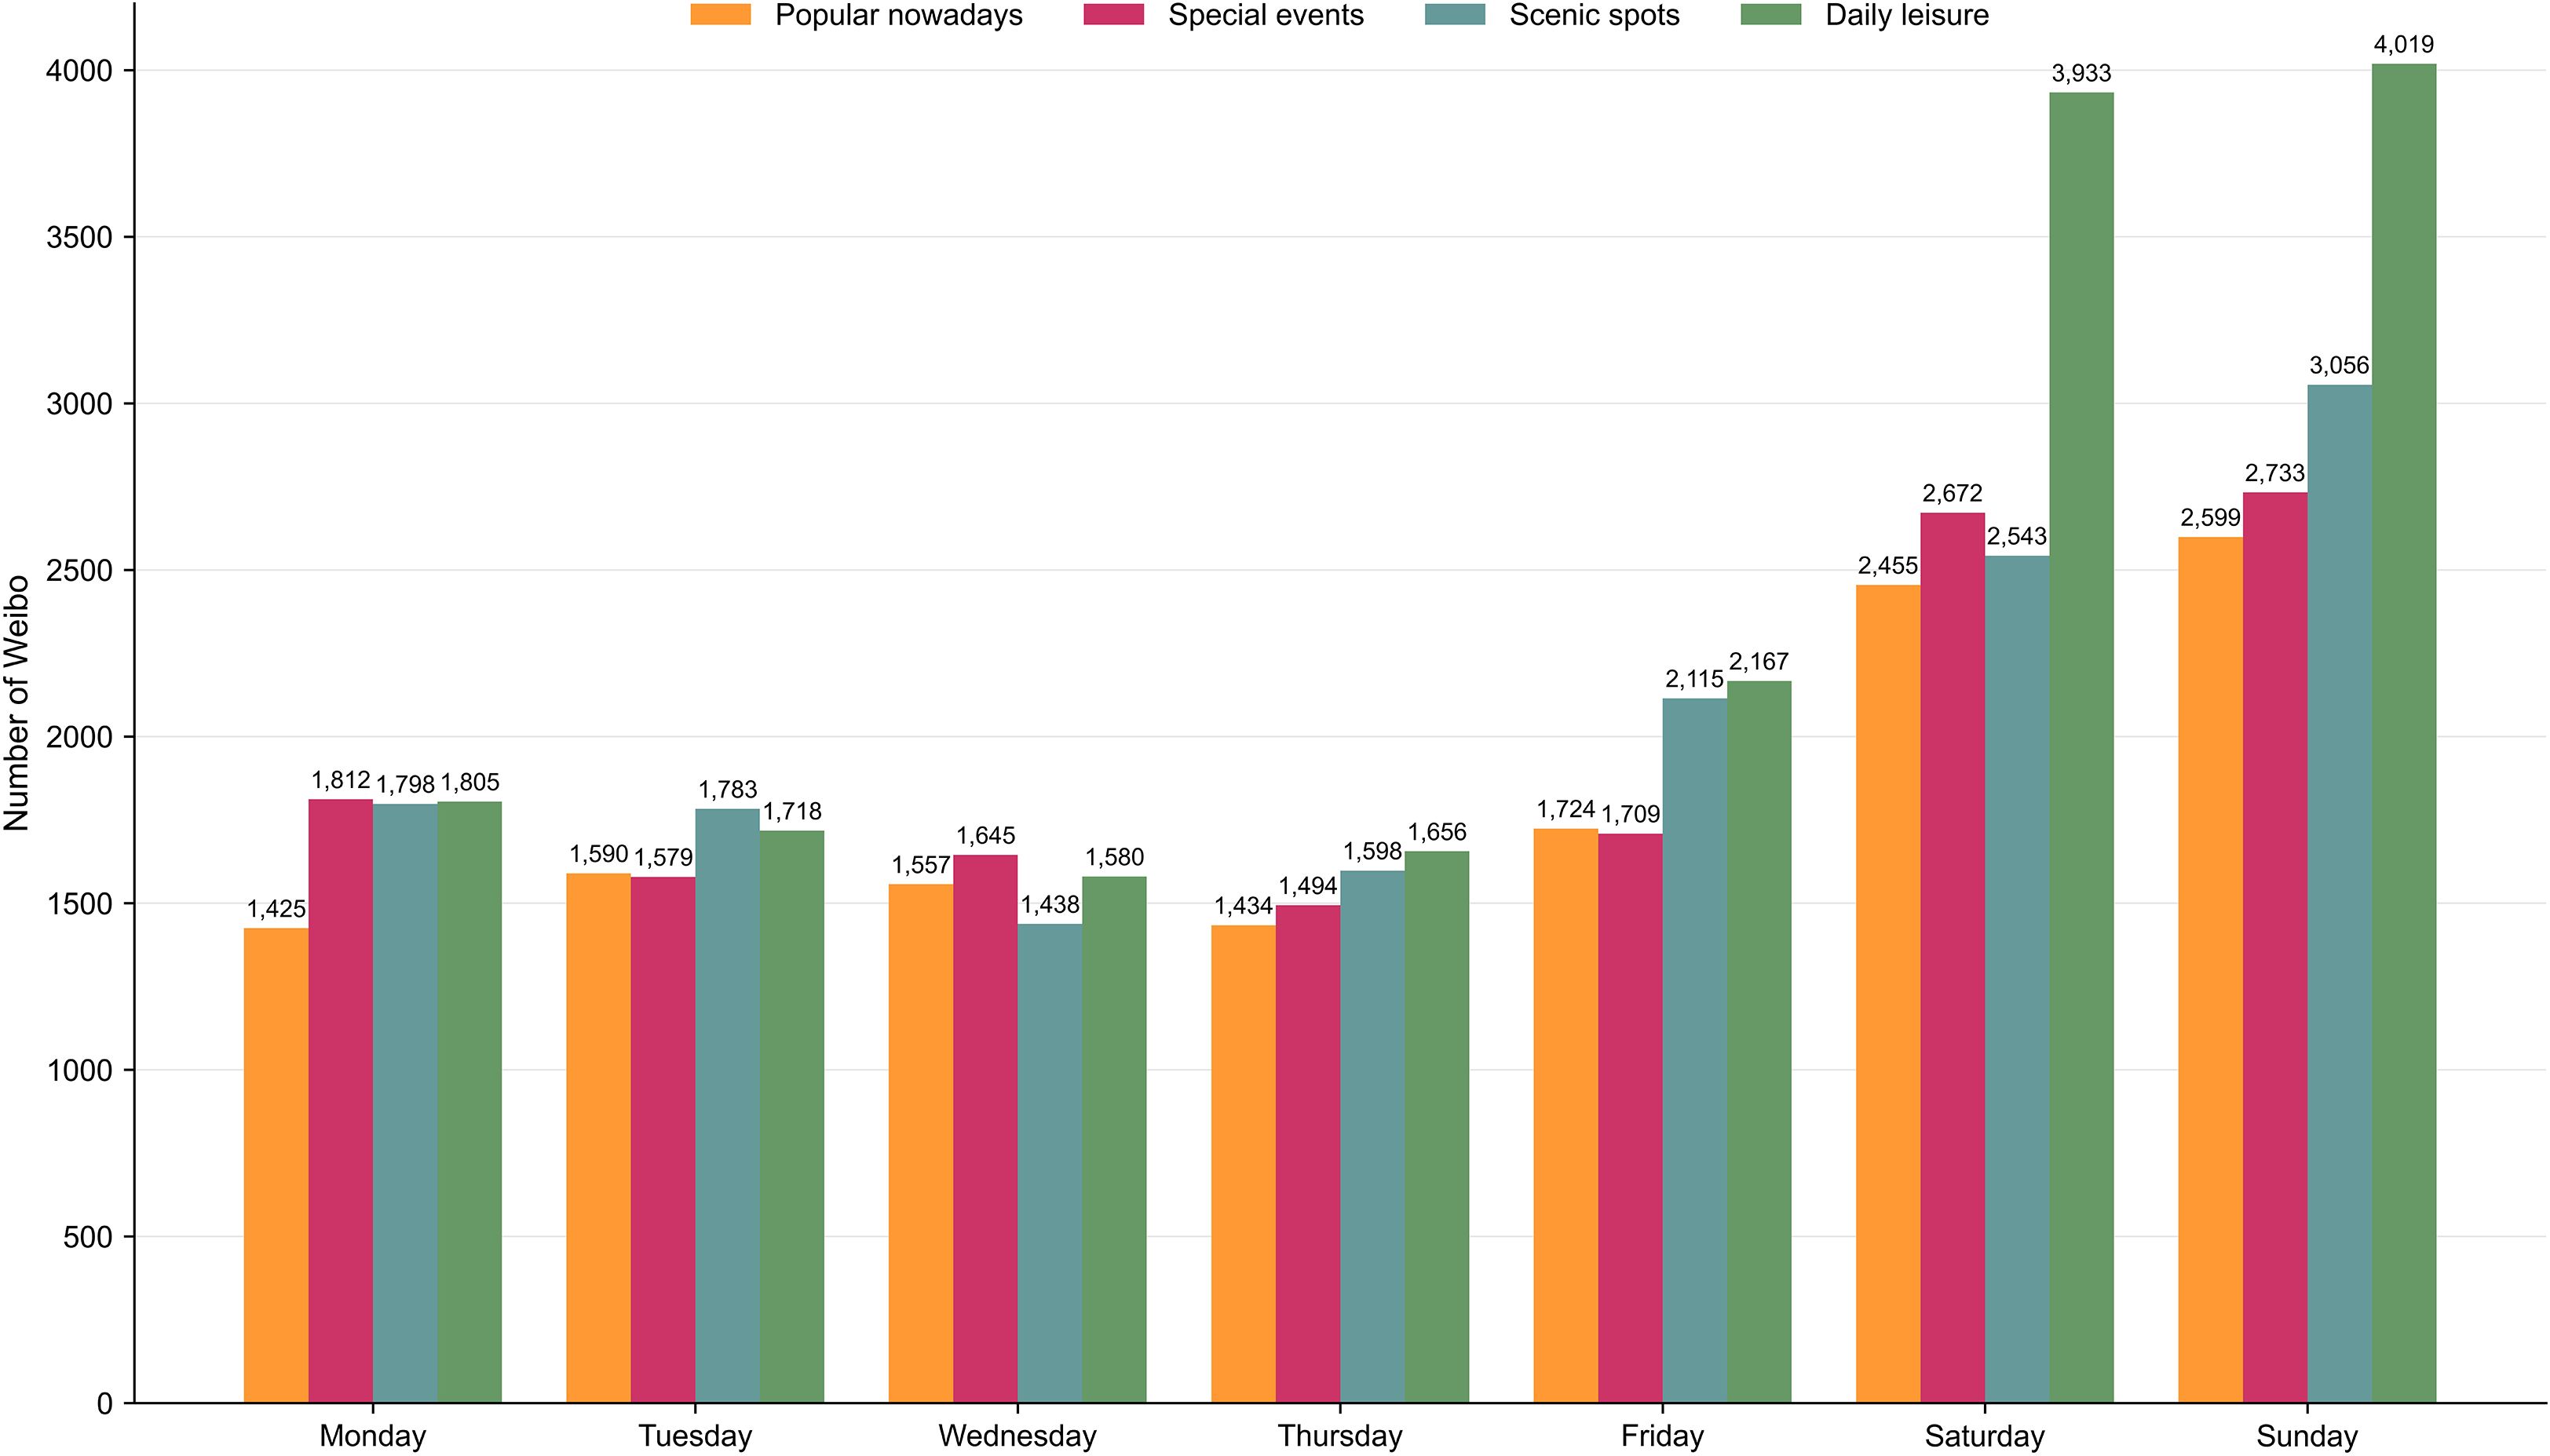
Figure 6. The quantity of Weibo posts by people across 4 topics during weekly periods.
Figure 6 shows that the number of leisure and recreation Weibo varies widely across the week for the four topics. Generally, from Monday to Friday, the numbers are at a relatively low level, with little difference among the four topics. However, on Saturday and Sunday, the numbers are at a relatively high level, and the differences among the four topics are significant. Among them, topic “Daily Leisure” has the largest increase on Saturday and Sunday, while the topic “Scenic Spots”, “Special Events”, and “Popular Nowadays” also have more significant increases on Saturday and Sunday.
The weekly Weibo volumes for these four topics differ, and their corresponding average activity distances show regular patterns (Figure 7).
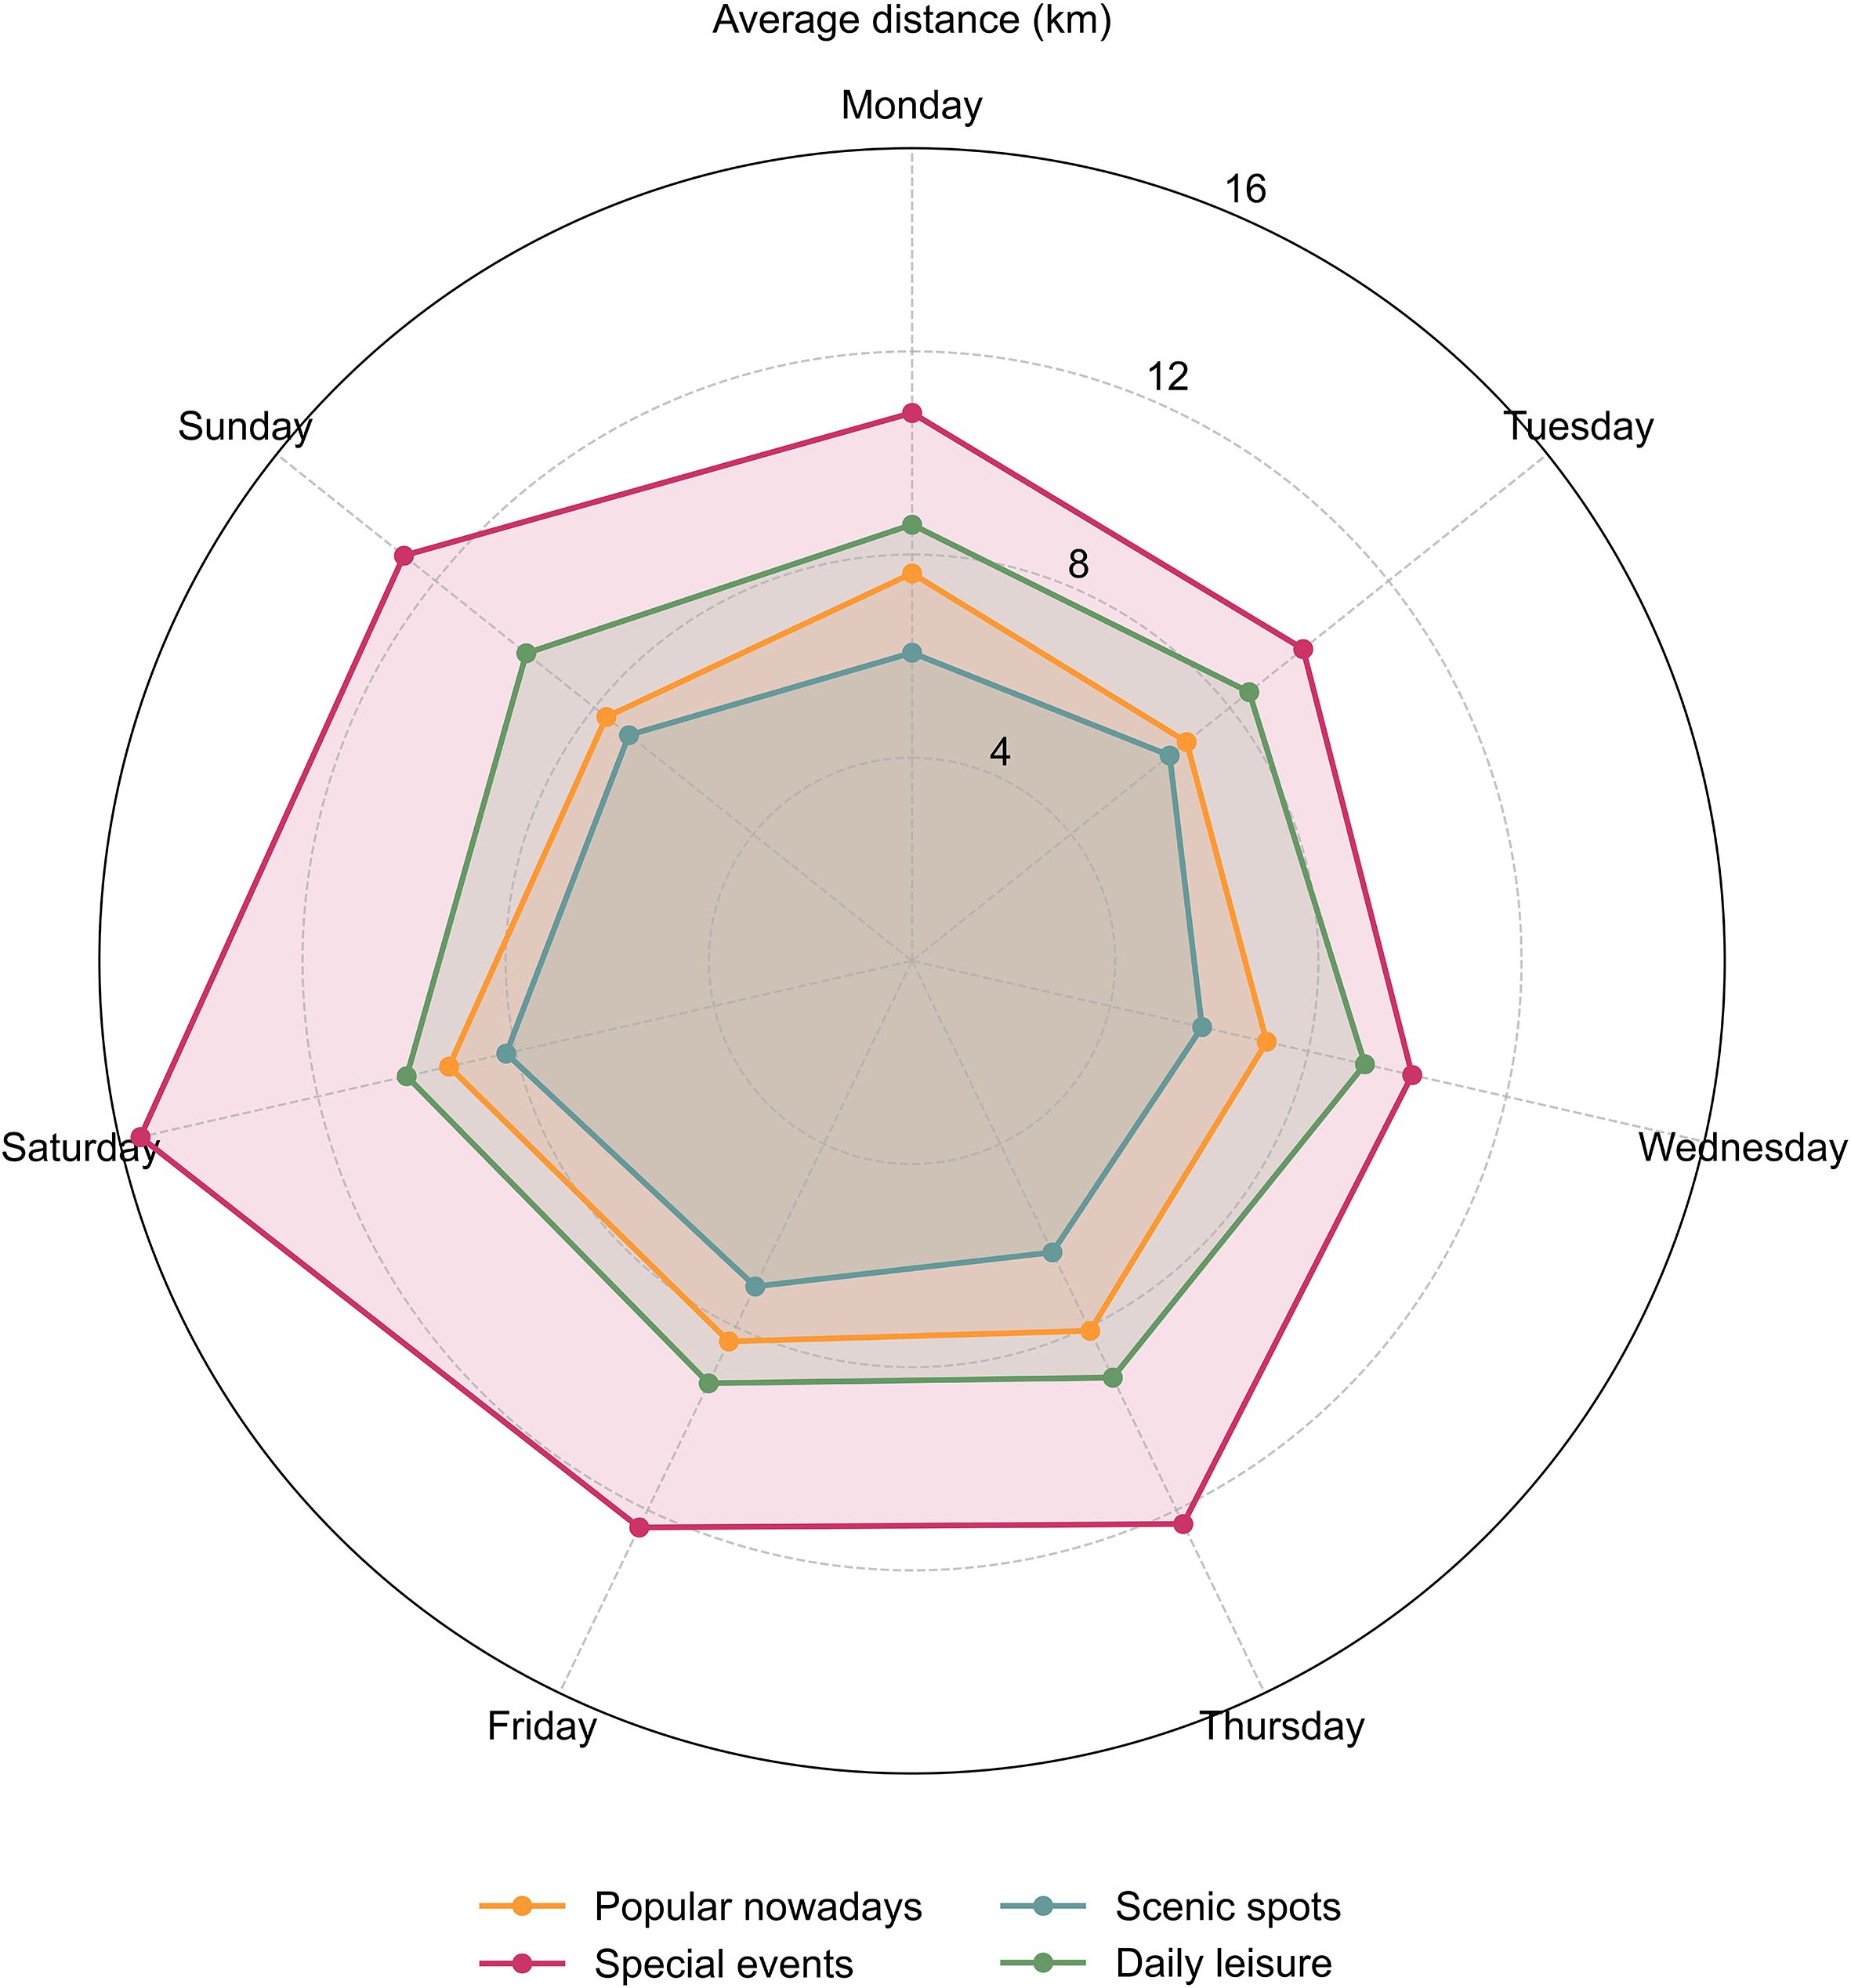
Figure 7. The average distances of Weibo posts by people across 4 topics during weekly periods.
Figure 7 shows that the average distance rhythm of citizens’ leisure and recreation activities in different themes shows different characteristics. Usually, Monday to Friday are weekdays, Saturday and Sunday are weekends. On Saturday and Sunday, residents show significantly greater average activity distances for leisure and recreation activities than Monday to Friday. Topic “Special Events” has the greatest variation within a week, especially on Saturday when it significantly exceeds the other topic activity distances, while the average distance on other days is also significantly higher than other topics. topic “Popular Nowadays”, topic “Scenic Spots”, and topic “Daily Leisure” also peaked on Saturday. This phenomenon is consistent with our perception of the pace of people’s lives during the week. For many people, the only time they have longer discretionary time is on weekends, and thus the range of activities becomes larger with the ST path. Saturday is the best day for people to carry out long-distance leisure and recreation travel activities, while many people are busy with work on Tuesday and prefer a short-distance leisure and recreation approach.
The number of leisure and recreation in (Figure 6) and the average leisure and recreation distance in (Figure 7) also reflects that different topics pay different travel distances for different types of leisure and recreation. For example, topic “Special Events” has a significant increase in the number of Weibo sent on Saturdays and Sundays, and the average movement distance increases as well. The difference is that topic “Daily Leisure” has a significant increase in the number of Weibo sent on Saturdays and Sundays, however, the average distance traveled does not increase significantly.
3.3 Spatial pattern of citizens’ leisure and recreation activities
3.3.1 Leisure and recreation activities hotspot areas
We conducted a kernel density analysis of the location of Weibo sent by citizens’ leisure and recreation activities for the four topics (Figure 8) so that summarize more clearly the spatial aggregation characteristics of each leisure and recreation topic and discover the influencing factors of leisure and recreation behavior behind them.
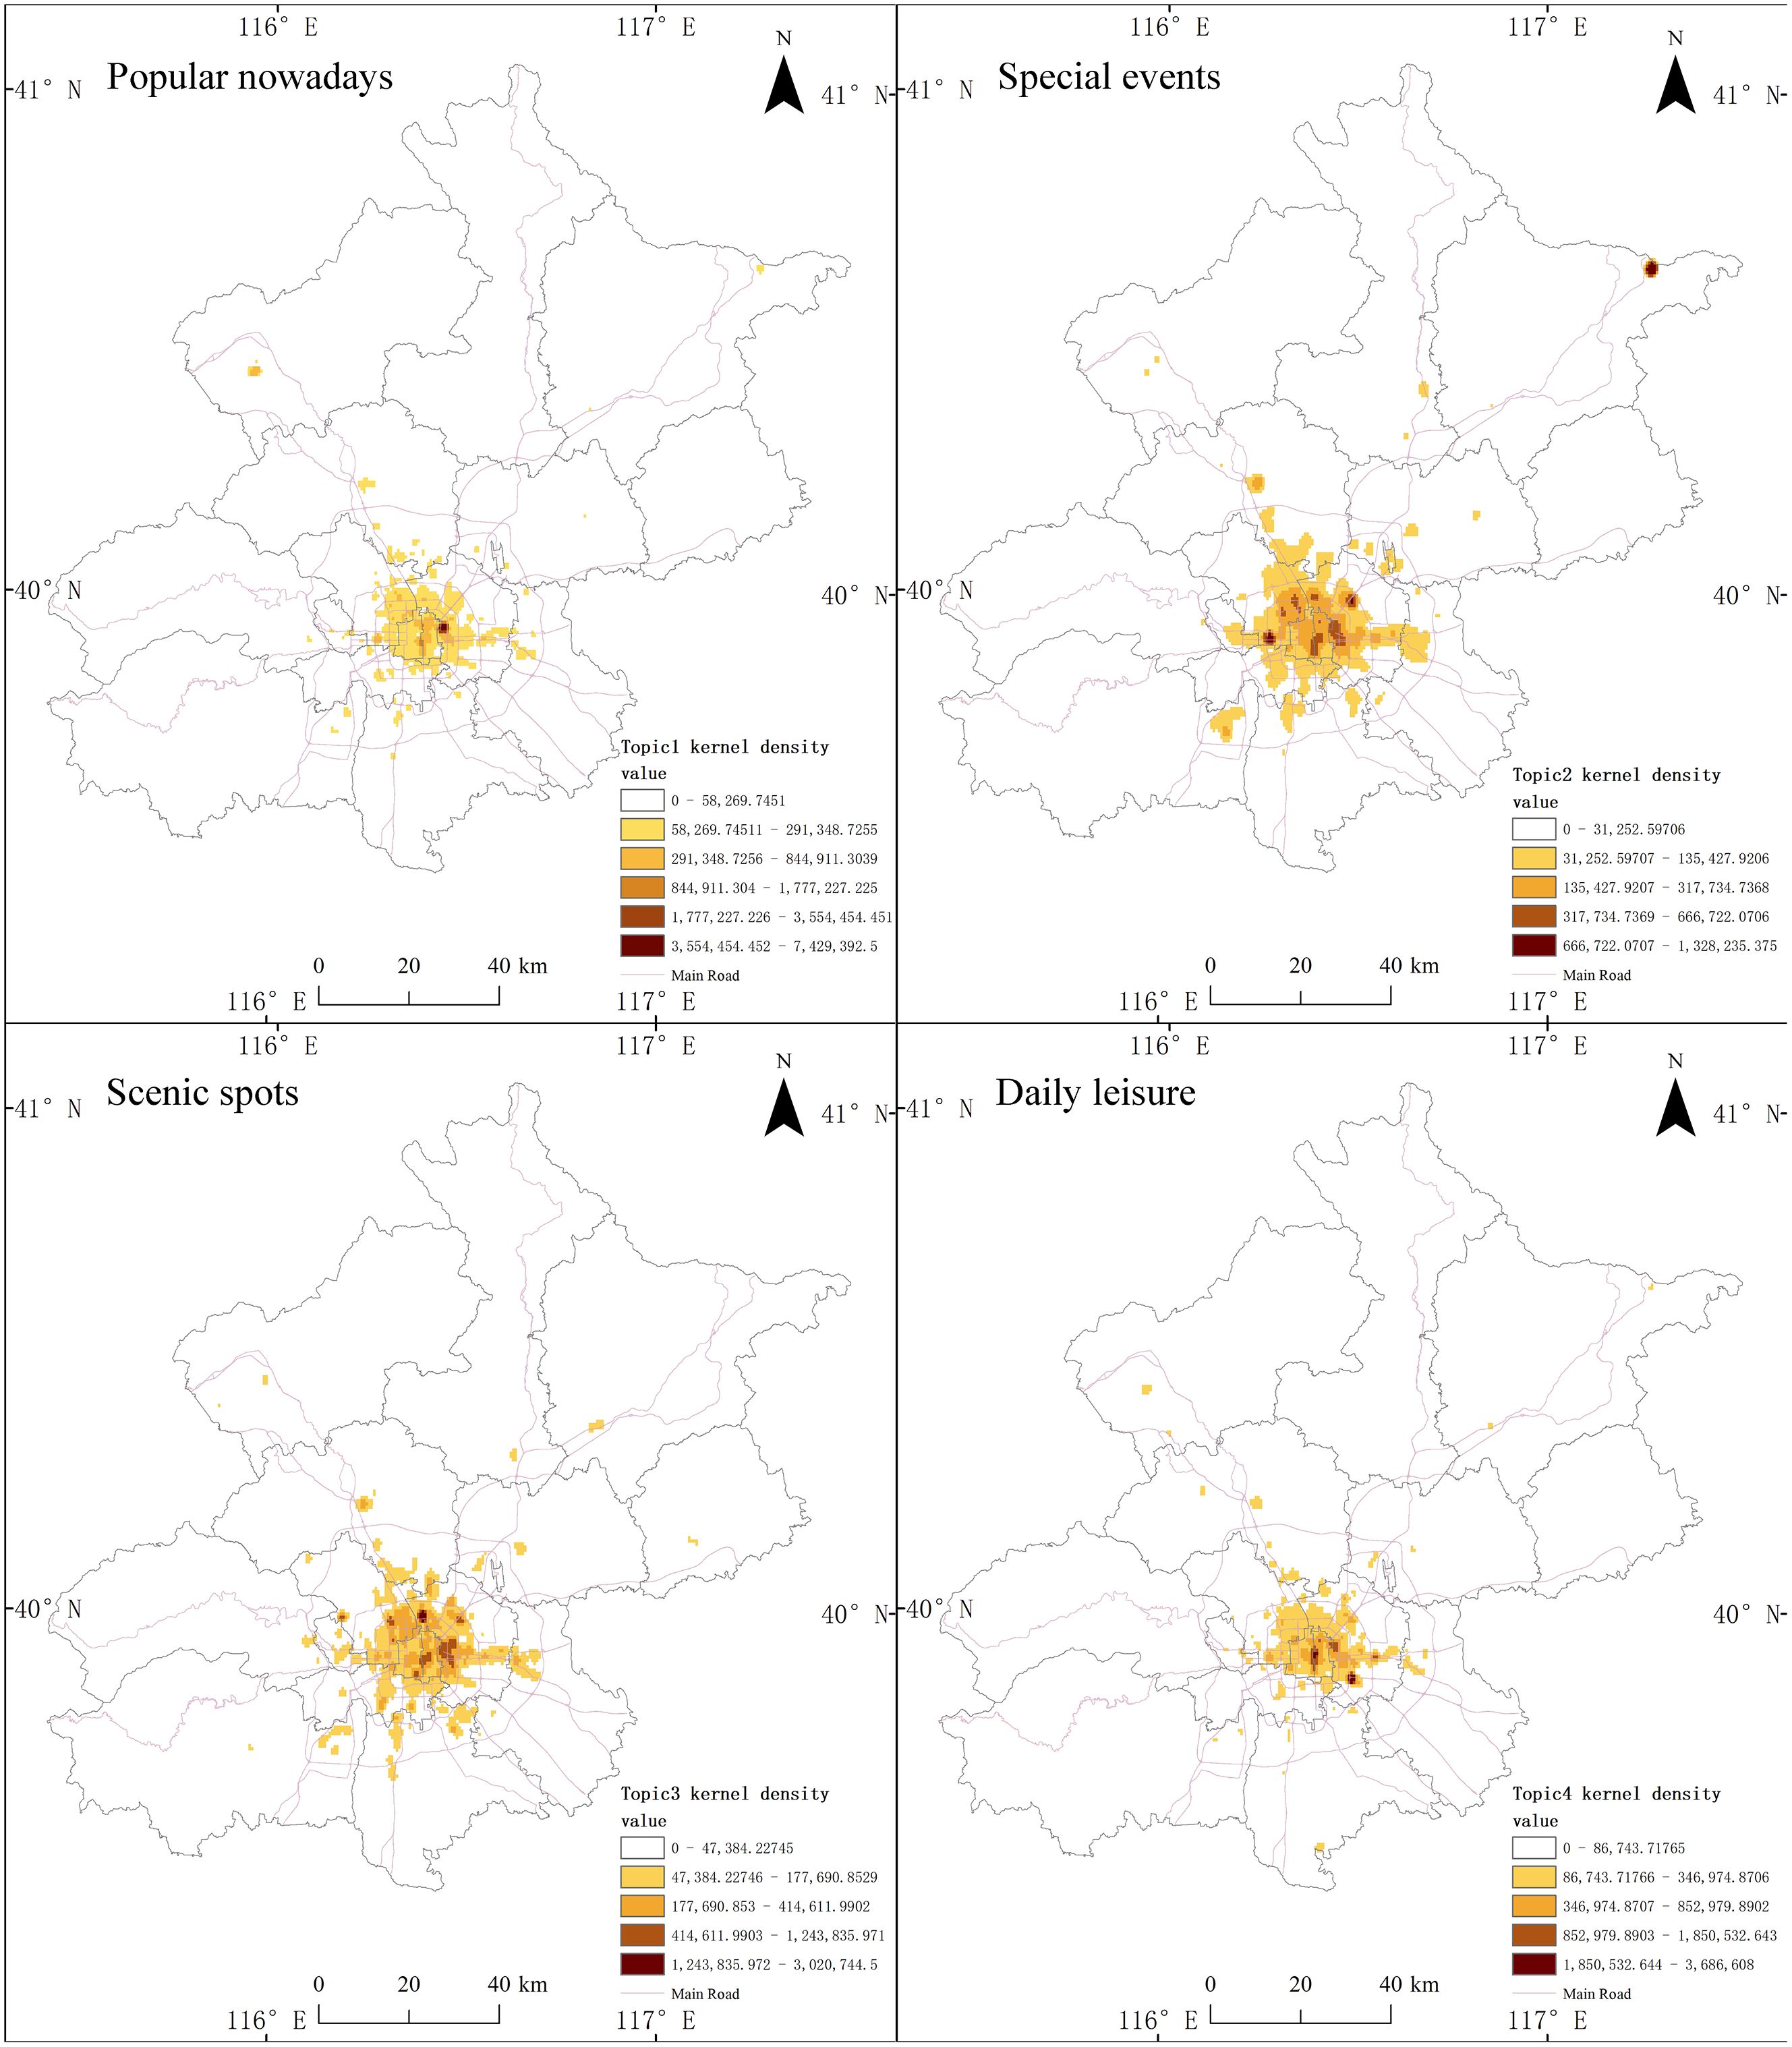
Figure 8. Kernel density analysis of leisure and recreation activities for the 4 topics.
The kernel density results are shown in Figure 8 we find that all four topics have multiple typical gathering areas for citizens’ leisure and recreation activities. The hotspot for topic “Popular Nowadays” is located in the busiest commercial area of Beijing (Sanlitun), as well as in the Forbidden City, Tiananmen Square, Qianmen and other commercial centers with traditional Beijing cultural characteristics. These types of commercial centers are close to the main office areas of Beijing, so people can easily reach these places and start specific leisure and recreation activities. Hotspots of topic “Special Events” are located in parks, large cultural shopping neighborhoods tourist attractions. The most typical area is Gubei Water Town in the northeast, as this scenic spot is far from the urban core and takes a long time to reach. Combined with the semantic features, people in this topic need more free disposable time in leisure and recreation activities. The hotspots in topic “Scenic Spots” are located in the Olympic Park, Xiangshan Mountain, the Forbidden City, the Great Wall, the National Museum and other facilities and attractions, which are closely related to the historical development of the country, international events and activities, and therefore have educational significance, and this topic also reflects the family attribute in the semantics, i.e., there are children in the family. The hotspots in topic “Daily Leisure” appear in the central business district (CBD), with a high number of high-aggregation hotspots, but all concentrated in the core of the city. The textual message reflects the combination with work and other activities, so these locations need to be convenient for starting leisure and recreation activities quickly, but also for ending quickly and getting into other things.
3.3.2 Leisure and recreation activity flows
According to the statistics of the district where the residence and clock. The number of residents’ activities in the region dominates (Figure 9).
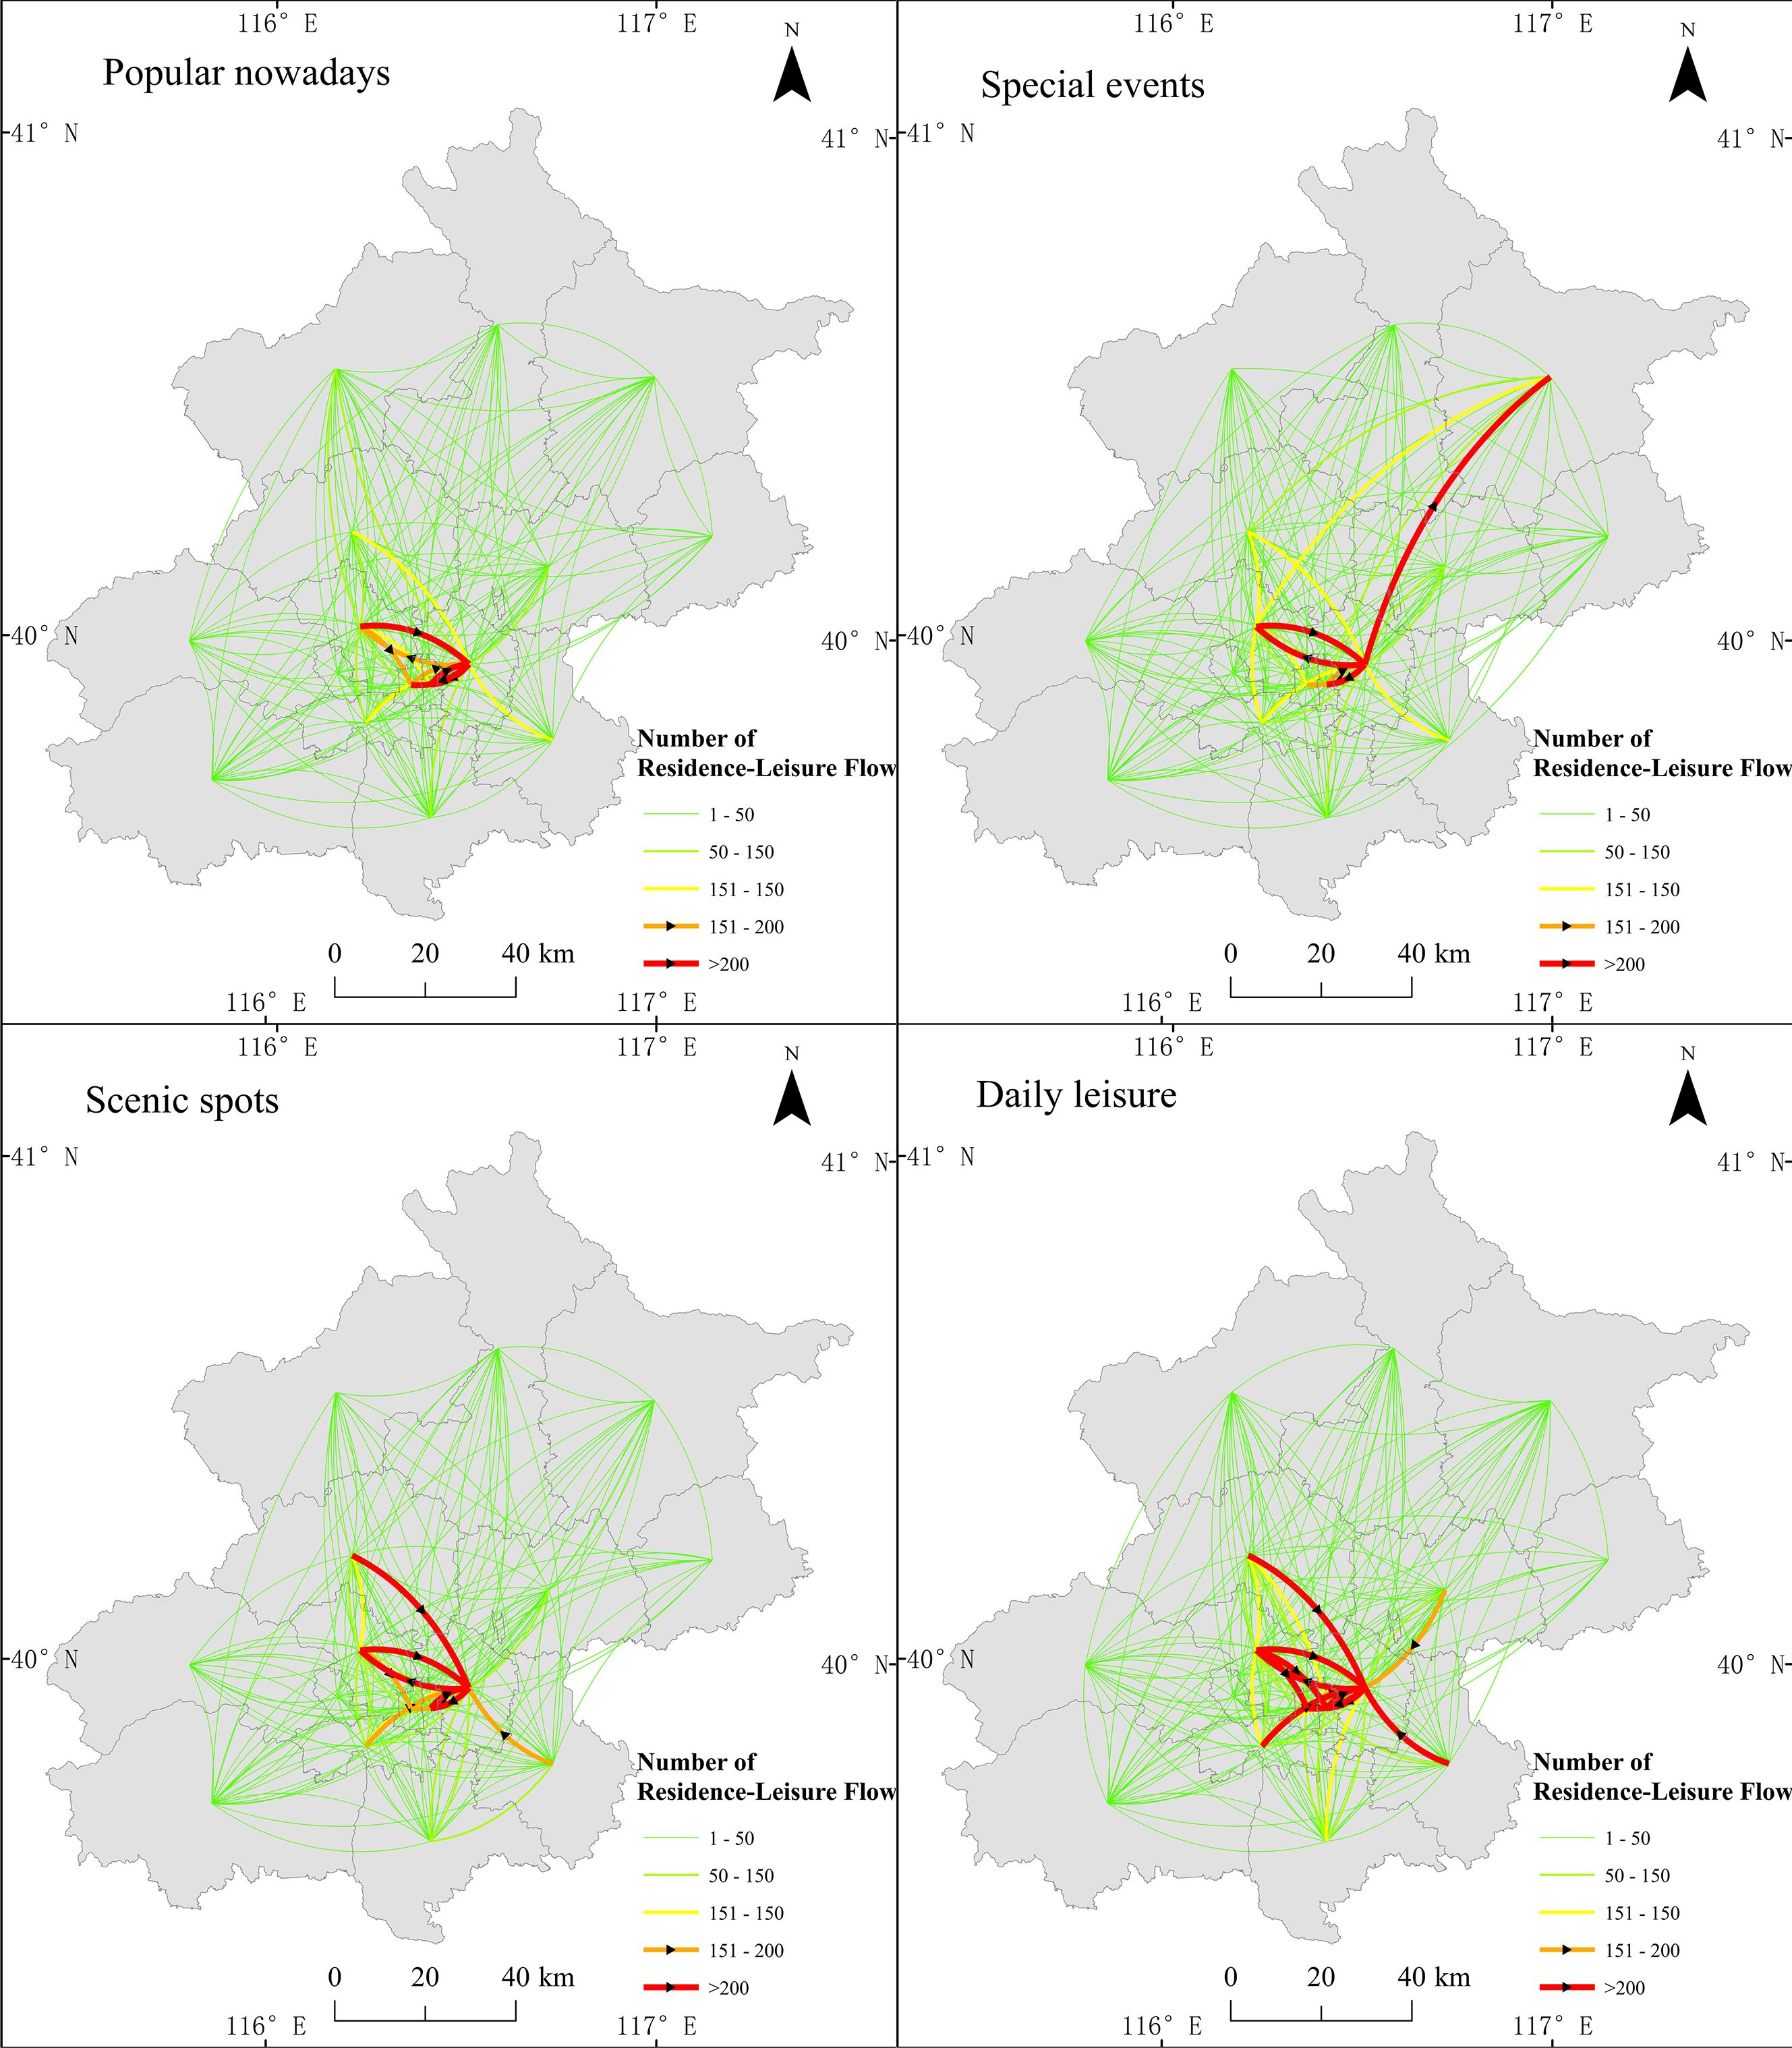
Figure 9. Flows of leisure and recreation activities in the region.
Interestingly, in exception to leisure and recreation travel activities in their own region, the spatial distribution characteristics of leisure and recreation activities performed by residents in different themes across the region have different characteristics. Figure 9 shows the movement of the 4 topics in addition to the leisure and recreation activities in different.
The cross-regional flows in Figure 9 show a high intensity from Haidian District to Chaoyang District, while Chaoyang District is also the main leisure and recreation destination for residents of other districts and counties in Beijing. The cross-regional leisure and recreation activities in topic “Popular Nowadays” are concentrated in several main urban areas in the center of Beijing (Chaoyang, Haidian, Dongcheng, and Xicheng). These districts are usually the more economically developed areas in Beijing, with higher per capita GDP and more complete commercial and recreational facilities. In topic “Special Events”, the cross-regional flow from Chaoyang to Miyun is most typical because Miyun is far from the central city of Beijing and is located in a mountainous area. If one travels from the central city to Miyun for leisure and recreation activities, one has to spend a long time on the road. Therefore, the leisure and recreation characteristics of topic “Special Events” tend to have a longer time scale and wider spatial scope. Topic “Scenic Spots” is more attractive to more districts than topic “Popular Nowadays” and “Special Events”, and has a broader impact. Topic “Daily Leisure” has the broadest pattern of leisure travel activity in spatial scope and the most intense mobility across districts.
4 Discussion
This study uses social media Weibo data to classify and study the temporal rhythm characteristics and spatial distribution characteristics of citizens’ leisure and recreation behaviors of Beijing, to explore different leisure and recreation activity patterns of urban residents, and to demonstrate the vitality of leisure and recreation and the aggregation of leisure and recreation facilities in Beijing.
The spatio-temporal patterns of Beijing residents’ leisure and recreation behaviors across different themes are mainly manifested in the following two aspects.
The first is that Urban residents’ leisure and recreation activities are closely related to the functional facilities within the city and leisure and recreation time availability. For example, commercial districts have lower time requirements for residents’ leisure and recreation activities, allowing for short-term leisure and recreation pursuits; tourism and scenic spots require slightly longer time commitments from residents, involving leisure and recreation activities measured in half-day or full-day units; transportation facilities have the longest time requirements for residents’ leisure and recreation activities, involving long-term leisure and recreation lasting one day or more. This pattern is highly correlated with the underlying reasons for the leisure and recreation behavior topic word characteristics of the three themes identified by the LDA topic model.
The second is that research on the spatiotemporal patterns of urban residents’ leisure and recreation behaviors for different leisure and recreation topic types can further reflect the impact of Beijing’s urban facilities and land use functions on urban residents. For example, commercial districts have a comprehensive influence on urban residents’ leisure and recreation, serving both as venues for short-term entertainment and as locations for leisure and recreation activities during weekends; whereas in urban business districts, CBDs, and similar areas, urban residents have relatively limited spatiotemporal flexibility in their leisure and recreation behaviors. In terms of spatial distribution characteristics, The dynamic level of citizens’ leisure and recreation activities does not exactly coincide with the distribution and scale of major business districts and tourist attractions in Beijing and may be related to the integrity and intensification of urban facilities. In other words, the overall level of commercial, attraction, entertainment, and other service facilities in the city tends to increase the dynamic level of citizens’ leisure and recreation activities. In addition, the four themes are related to the spatial distribution of the city’s facilities according to their behavioral characteristics based on the citizens’ own work and rest patterns, the free time available, the structure of family members, and the purpose to be achieved by the planned activity (e.g., social, educational, etc.).
Based on the above research findings, the following considerations can be made concerning urban structure: First, leisure and recreation activities exhibit distinct spatiotemporal signatures tied to urban infrastructure accessibility. The pronounced Saturday peak in travel distances for “Special Events” (averaging 12.3 km, but 6.8 km on weekdays) demonstrates how temporal flexibility directly translates to spatial mobility, supporting time geography theories while revealing the infrastructure-dependence of leisure choices. Second, leisure topic diversity is associated with spatial concentration. While “Daily Leisure” accounts for 29.1% of activities, it shows the highest spatial clustering in CBD areas, whereas “Special Events” (23.2% of activities) displays the most dispersed patterns. This challenges assumptions that popular activities necessarily create widespread spatial distribution. Third, cross-district mobility patterns reveal systematic spatial inequalities in leisure and recreation access. The dominant flow from Haidian to Chaoyang Districts suggests that leisure and recreation infrastructure distribution may reinforce existing urban hierarchies, with economically developed areas serving as leisure destinations for residents of peripheral districts.
These findings have significant implications for urban planning practice. Current approaches that focus primarily on providing leisure and recreation facilities within residential neighborhoods may be insufficient if residents systematically travel longer distances for certain leisure experiences. The concentration of “Popular Nowadays” activities in Sanlitun and traditional cultural areas suggests that authenticity and cultural significance drive leisure destination choices beyond mere accessibility.
5 Conclusion
This research shows that urban leisure and recreation activities rhythms reflect both individual time constraints and urban infrastructure patterns. The identification of four distinct leisure and recreation topics with unique spatial and temporal signatures provides empirical evidence for differentiated leisure planning approaches. There are 2 contributions: (1) exploring the method of combining the model of BERT and LDA for large-scale leisure and recreation behavior analysis; (2) identification of systematic cross-district leisure flows that reveal spatial inequalities in leisure and recreation infrastructure access. There are 2 contribution: (1) exploring the method of combining the model of BERT and LDA for large-scale leisure and recreation behavior analysis; (2) identification of systematic cross-district leisure flows that reveal spatial inequalities in leisure and recreation infrastructure access.
For urban planning practice, these findings suggest that leisure and recreation facility planning should account for topic-specific spatial requirements rather than applying uniform accessibility standards. The concentration of weekend leisure and recreation activities in specific districts indicates opportunities for better spatial distribution of leisure and recreation infrastructure.
Future research should examine how these patterns vary across different demographic groups, investigate the relationship between leisure and recreation accessibility and residential satisfaction, and explore how digital leisure behaviors complement physical leisure and recreation activities. Longitudinal studies could reveal how leisure and recreation rhythms adapt to urban development and policy interventions.
In this research, limitations include potential demographic bias in Weibo users (typically younger, urban residents), the inability to capture leisure and recreation activities not shared on social media, and the temporal scope limited to 2019 data. The BERT model may miss nuanced leisure-related content, and the residence identification method may exclude temporary residents or frequent travelers. We assume that the temporal and spatial information of Weibo posts corresponds to actual leisure activity locations; however, there may be significant temporal delays and spatial offsets between when or where activities occur and when or where posts are made, potentially compromising the accuracy of location identification.
Due to the diversity and complexity of leisure and recreation behaviors of urban residents in Beijing, the research on the relationship between physical leisure and recreation facilities and leisure behaviors of urban residents in the city needs to be further explored.
Data availability statement
The original contributions presented in the study are included in the article/Supplementary Material. Further inquiries can be directed to the corresponding author.
Author contributions
YZ: Data curation, Methodology, Validation, Investigation, Funding acquisition, Resources, Software, Writing – original draft, Writing – review & editing. XW: Writing – review & editing, Resources, Writing – original draft, Formal Analysis, Validation, Visualization, Project administration, Investigation, Conceptualization. GZ: Conceptualization, Methodology, Writing – original draft, Writing – review & editing, Project administration. HZ: Validation, Supervision, Writing – review & editing, Software. NC: Formal Analysis, Resources, Methodology, Conceptualization, Investigation, Writing – review & editing.
Funding
The author(s) declare that no financial support was received for the research and/or publication of this article.
Acknowledgments
We are grateful to the Electronic Science Research Institute of China Electronics Technology Group Corporation, Chinese Academy of Sciences for providing data and resource support, and to Beijing Union University for providing innovations in ideas and analytical methods.
Conflict of interest
Authors XW and GZ were employed by the China Electronics Technology Group Corporation. The China Electronics Technology Group Corporation had the following involvement in the study: data and resource support.
Generative AI statement
The author(s) declare that no Generative AI was used in the creation of this manuscript.
Any alternative text (alt text) provided alongside figures in this article has been generated by Frontiers with the support of artificial intelligence and reasonable efforts have been made to ensure accuracy, including review by the authors wherever possible. If you identify any issues, please contact us.
Publisher’s note
All claims expressed in this article are solely those of the authors and do not necessarily represent those of their affiliated organizations, or those of the publisher, the editors and the reviewers. Any product that may be evaluated in this article, or claim that may be made by its manufacturer, is not guaranteed or endorsed by the publisher.
Supplementary material
The Supplementary Material for this article can be found online at: https://www.frontiersin.org/articles/10.3389/fevo.2025.1615395/full#supplementary-material
References
Alzaim M., AlAli M., Mattar Y., and Samara F. (2024). Integrated framework for enhancing liveability and ecological sustainability in UAE communities. Sustainability 16, 9872. doi: 10.3390/su16229872
Birant D. and Kut A. (2007). ST-DBSCAN: An algorithm for clustering spatial–temporal data. Data Knowledge Eng. 60, 208–221. doi: 10.1016/j.datak.2006.01.013
Blei D. M., Ng A. Y., and Jordan M. I. (2003). Latent dirichlet allocation. J. Mach. Learn. Res. 3, 993–1022. doi: 10.5555/944919.944937
Chen S., Meng B., Liu N., Qi Z., Liu J., and Wang J. (2022). Cultural perception of the historical and cultural blocks of Beijing based on Weibo photos. Land 11 (4), 495. doi: 10.3390/land11040495
Chen Y., Liu X., Li X., Liu X., Yao Y., Hu G., et al. (2017). Delineating urban functional areas with building-level social media data: A dynamic time warping (DTW) distance based k-medoids method. Landscape Urban Plann. 160, 48–60. doi: 10.1016/j.landurbplan.2016.12.001
Chi Y. L. and Mak H. W. L. (2021). From comparative and statistical assessments of liveability and health conditions of districts in hong kong towards future city development. Sustainability 13 (16), 8781. doi: 10.3390/su13168781
Devlin J., Chang M. W., Lee K., and Toutanova K. (2019). “BERT Pre-training of deep bidirectional transformers for language understanding”. in Proceedings of the 2019 Conference of the North American Chapter of the Association for Computational Linguistics: Human Language Technologies. Volume 1 (Long and Short Papers). eds. J. Burstein, C. Doran, T. Solorio T. (Minneapolis, Minnesota: Association for Computational Linguistics), 4171–4186. doi: 10.18653/v1/N19-1423
Gao H., Zhou L., Dong Y., Wang X., Sun Q., Wang S., et al. (2025). Identifying critical road sections using the weighted periodicity mined from trajectory data for efficient urban transportation. GIScience Remote Sens. 62 (1), 2448251. doi: 10.1080/15481603.2024.2448251
Ji H., Wang J., Zhu Y., Shi C., Wang S., Zhi G., et al. (2022). Spatial distribution of urban parks’ effect on air pollution-related health and the associated factors in Beijing city. ISPRS Int. J. Geo-Information 11, 616. doi: 10.3390/ijgi11120616
Johnson A. and Glover T. (2013). Understanding urban public space in a leisure context. Leisure Sci. 35 (2), 190–197. doi: 10.1080/01490400.2013.761922
Kriegel H.-P., Kröger P., Sander J., and Zimek A. (2011). Density-based clustering. WIREs Data Min. Knowledge Discov. 1, 231–240. doi: 10.1002/widm.30
Kuzuoglu S. and Glover T. (2023). Social infrastructure: Directions for leisure studies. Leisure Sci., 1–18. doi: 10.1080/01490400.2023.2253230
Lefebvre H. (2013). Rhythmanalysis: Space, Time and Everyday Life (Bloomsbury Publishing). Available online at: https://books.google.com.hk/books?id=hv_eBAAAQBAJ.
Li X., Wang S., Zhou L., Sun Y., Zheng J., Liu C., et al. (2025). Geospatial analytics of urban bus network evolution based on multi-source spatiotemporal data fusion: A case study of Beijing, China. ISPRS Int. J. Geo-Information 14, 112. doi: 10.3390/ijgi14030112
Liang C. and Li R. (2020). Tourism destination image perception analysis based on the latent dirichlet allocation model and dominant semantic dimensions: A case of the old town of Lijiang. Prog. Geogr. 39, 614–626. doi: 10.18306/dlkxjz.2020.04.008
Liu C., Yang Y., Chen B., Cui T., Shang F., Fan J., et al. (2022a). Revealing spatiotemporal interaction patterns behind complex cities. Chaos: Interdiscip. J. Nonlinear Sci. 32, 081105. doi: 10.1063/5.0098132, PMID: 36049958
Liu J., Meng B., Wang J., Chen S., Tian B., and Zhi G. (2021). Exploring the spatiotemporal patterns of residents’ daily activities using text-based social media data: A case study of beijing, China. ISPRS Int. J. Geo-Information 10 (6), 389. doi: 10.3390/ijgi10060389
Liu J., Meng B., Yang M., Peng X., Zhan D., and Zhi G. (2022b). Quantifying spatial disparities and influencing factors of home, work, and activity space separation in Beijing. Habitat Int. 126, 102621. doi: 10.1016/j.habitatint.2022.102621
Liu Z., Ma T., Du Y., Pei T., Yi J., and Peng H. (2018). Mapping hourly dynamics of urban population using trajectories reconstructed from mobile phone records. Trans. GIS 22, 494–513. doi: 10.1111/tgis.12323
Ma T., Zhou C., Pei T., Haynie S., and Fan J. (2012). Quantitative estimation of urbanization dynamics using time series of DMSP/OLS nighttime light data: A comparative case study from China’s cities. Remote Sens. Environ. 124, 99–107. doi: 10.1016/j.rse.2012.04.018
Morosini R. and Zucaro F. (2019). Land use and urban sustainability assessment: A 3D-GIS application to a case study in Gozo. City, Territory and Architecture, 6 (1), 7. doi: 10.1186/s40410-019-0106-z
Mortaheb R. and Jankowski P. (2023). Smart city re-imagined: City planning and GeoAI in the age of big data. J. Urban Manage. 12, 4–15. doi: 10.1016/j.jum.2022.08.001
Navarro R., Tschöke Santana D., and Rechia S. (2018). Public leisure space and community-based action. Leisure Stud. 37, 747–762. doi: 10.1080/02614367.2018.1535613
Nemeškal J., Ouředníček M., and Pospíšilová L. (2020). Temporality of urban space: Daily rhythms of a typical week day in the prague metropolitan area. J. Maps 16, 30–39. doi: 10.1080/17445647.019.1709577
Parady G., Katayama G., Yamazaki H., Yamanami T., Takami K., and Harata N. (2019). Analysis of social networks, social interactions, and out-of-home leisure activity generation: Evidence from Japan. Transportation 46, 537–562. doi: 10.1007/s11116-018-9873-8
Salavati S. M., Janalipour M., and Abbaszadeh Tehrani N. (2025). Measuring urban quality of life through spatial analytics and machine learning: A data-driven framework for sustainable urban planning and development. Sustainability 17 (11), 4863. doi: 10.3390/su17114863
Söylemez E. and Koramaz T. (2024). Rhythmanalysis theory as a dialectical method in urban geography. Eur. J. Geogr. 15, 293–304. doi: 10.48088/ejg.e.soy.15.4.293.304
Su K., Cheng C. X., Murzintcev N., and Zhang T. (2019). Application and comparison of topic model in identifying latent topics from disaster-related tweets. J. Geo-information Sci. 21 (8), 1152–1160. doi: 10.12082/dqxxkx.2019.190046
Šveda M., Madajová M., Barlík P., Križan F., and Šuška P. (2020). Mobile phone data in studying urban rhythms: Towards an analytical framework. Moravian Geographical Rep. 28, 248–258. doi: 10.2478/mgr-2020-0018
Toger M., Türk U., Östh J., Kourtit K., and Nijkamp P. (2023). Inequality in leisure mobility: An analysis of activity space segregation spectra in the Stockholm conurbation. J. Transport Geogr. 111, 103638. doi: 10.1016/j.jtrangeo.2023.103638
Urry J. (2012). Social networks, mobile lives and social inequalities. J. Transport Geogr. 21, 24–30. doi: 10.1016/j.jtrangeo.2011.10.003
Wang S., Wang R., Su C., Zhou L., Wang W., and Liang H. (2023). “Optimization of shared bicycle location in wuhan city based on multi-source geospatial big data,” in Proceedings of the 2nd ACM SIGSPATIAL International Workshop on Spatial Big Data and AI for Industrial Applications (Association for Computing Machinery, New York, NY, USA), 43–46.
Wang S., Xu D., Zhou J., Su C., Li X., Liang X., et al. (2024). “Convenience stores geospatial location optimization analytics using deep reinforcement learning,” in Proceedings of the 3rd ACM SIGSPATIAL International Workshop on Spatial Big Data and AI for Industrial Applications (Association for Computing Machinery, New York, NY, USA), 16–23.
Wu J., Li J., and Ma Y. (2019). A comparative study of spatial and temporal preferences for waterfronts in Wuhan based on gender differences in check-in behavior. ISPRS Int. J. Geo-Information 8, 413. doi: 10.3390/ijgi8090413
Yang J., Mu L., and Grigsby-Toussaint D. S. (2025). Public perceptions and expectations of urban park environments on children’s play: A GIS and text mining analysis on children’s activity in Atlanta’s parks using social media data. Environ. Plann. B: Urban Analytics City Sci. 52, 412–429. doi: 10.1177/23998083241260484
Zhang Y., Song Y., and Fan Y. (2022). Improving data quality of smartphone-based activity–travel survey: A framework for data post-processing. Trans. GIS 26, 475–504. doi: 10.1111/tgis.12865
Zhi G., Meng B., Wang J., Chen S., Tian B., Ji H., et al. (2021). Spatial analysis of urban residential sensitivity to heatwave events: Case studies in five megacities in China. Remote Sens. 13 (20), 4086. doi: 10.3390/rs13204086
Zhong C., Batty M., Manley E., Wang J., Wang Z., Chen F., et al. (2016). Variability in regularity: Mining temporal mobility patterns in london, Singapore and beijing using smart-card data. PloS One 11, e0149222. doi: 10.1371/journal.pone.0149222, PMID: 26872333
Keywords: urban leisure and recreation activities, social media Weibo data, tourism big data, machine learning, urban rhythm, Beijing
Citation: Zhang Y, Wang X, Zhi G, Zhou H and Cui N (2025) The rhythms of citizens’ leisure and recreation: a case study based on social media data. Front. Ecol. Evol. 13:1615395. doi: 10.3389/fevo.2025.1615395
Received: 21 April 2025; Accepted: 03 October 2025;
Published: 23 October 2025.
Edited by:
Hugo Wai Leung Mak, Hong Kong University of Science and Technology, Hong Kong SAR, ChinaCopyright © 2025 Zhang, Wang, Zhi, Zhou and Cui. This is an open-access article distributed under the terms of the Creative Commons Attribution License (CC BY). The use, distribution or reproduction in other forums is permitted, provided the original author(s) and the copyright owner(s) are credited and that the original publication in this journal is cited, in accordance with accepted academic practice. No use, distribution or reproduction is permitted which does not comply with these terms.
*Correspondence: Na Cui, Y3VpbmEwMjAzQDE2My5jb20=