 Lin Yang
 Xue Han1,2,3
 Longyan Tan
- 1Guizhou Institute of Crop Germplasm Resources, Guizhou Academy of Agricultural Sciences, Guiyang, China
- 2Guizhou Engineering Research Center for the Cultivation and Planting of Chinese Medicine Bletilla Striata, Guiyang, China
- 3School of Pharmacy, Guizhou University of Traditional Chinese Medicine, Guiyang, China
Bletilla striata, a precious traditional Chinese medicinal herb, has long lacked systematic investigation into the dynamic patterns of secondary metabolites in its flowers and their resource utilization potential. This study employed gas chromatography-mass spectrometry (GC-MS) and liquid chromatography-mass spectrometry (LC-MS) to comprehensively analyze the spatiotemporal distribution and regulatory mechanisms of secondary metabolites in buds (B) and flowers (F) of the geo-authentic cultivar B.striata ‘Gui Ji 1’ across four critical developmental stages (P1-P4). Volatile components were dominated by esters (e.g., ethyl acetate and ethyl propionate), with peak diversity (81 types) observed at the P3 stage, where total ester content in flowers significantly exceeded that in buds (ethyl acetate in P3-F reached 357.76 mg/g). Non-volatile components prominently featured glycosides like Militarine, Dactylorhin E and organic acids, with P3-stage floral organs exhibiting maximal accumulation of bioactive compounds (Militarine: 37.28 mg/g in P3-F; total polysaccharides: 115.58 mg/g; total flavonoids: 26.56 mg/g in P3-B). Principal component analysis (PCA) and orthogonal partial least squares discriminant analysis (OPLS-DA) demonstrated that P3-stage flowers (P3-F), enriched with both high-value bioactive components and characteristic aromatic compounds, represent the optimal harvest window for medicinal and fragrance product development, while buds (P3-B) serve as supplementary sources for flavonoid-derived functional ingredients. This study pioneers the construction of a metabolic dynamic atlas for B.striata flowers, revealing coordinated regulatory mechanisms between floral organ development and secondary metabolite accumulation. By shifting focus from traditional rhizome-centric research to floral metabolic profiling, it provides scientific foundations for holistic industrial chain development, precision harvesting strategies, and high-value product design. This study provides a scientific foundation for understanding the dynamic changes of key metabolites, thereby optimizing the harvesting time of B.striata flowers. The findings suggest that the bud stage represents the optimal period for extracting medicinal components.
1 Introduction
Bletilla striata (Thunb.) Reichb.f., a renowned traditional Chinese medicinal herb, has been widely utilized in traditional medicine and health food industries for its therapeutic effects, including reducing swelling, stopping bleeding, removing blood stasis, and promoting tissue regeneration (He et al., 2017; Zhu et al., 2023). The rhizome of B.striata is rich in bioactive compounds such as bibenzyls, phenanthrenes, and polysaccharides, which exhibit pharmacological activities like hemostasis, anti-inflammatory, and antioxidant properties and have been applied in clinical formulations for wound healing, hemostatic drugs, and functional food additives as natural antioxidants, making it a critical resource for clinical applications and health product development (Zhang et al., 2019; Wu et al., 2024; Wu et al., 2025). Beyond the rhizome, the flowers of B.striata, as reproductive organs of the orchid family, not only possess ornamental value but also contain volatile components, flavonoids, and glycosides, highlighting their potential for medicinal and edible applications (Xu et al., 2019; Fang et al., 2022; Han et al., 2023). However, current research on B.striata flowers has predominantly focused on the extraction of active constituents, while systematic investigations into the dynamic accumulation patterns of secondary metabolites in floral organs and the regulatory mechanisms during flowering remain scarce, limiting the rational development of floral resources for industrial applications. Elucidating these mechanisms would facilitate optimized cultivation practices, enhance medicinal efficacy evaluation, and unlock new avenues for diversified product development inpharmaceutics, food science, and horticulture.
The natural flowering period of B.striata spans from April to June, during which buds and flowers on the inflorescence axis undergo gradient developmental stages accompanied by intricate metabolic regulation. Studies have shown that metabolic profiles in petals and buds shift significantly during plant flowering due to physiological functional transitions, such as anthocyanin accumulation for pollinator attraction and the synthesis of defensive flavonoids for tissue protection (Yang et al., 2019; Penfield, 2024). For B.striata, floral organs at different developmental stages may exhibit distinct chemical compositions and bioactivities, with these dynamic variations directly influencing harvest timing and product quality. Nevertheless, systematic studies on the metabolic changes in B.striata flowers across flowering stages are lacking, resulting in a scientific gap that hinders evidence-based resource utilization.
Advances in modern analytical technologies have provided robust tools for investigating the bioactive components and quality of B.striata flowers. Gas chromatography-mass spectrometry (GC-MS) and liquid chromatography-mass spectrometry (LC-MS), two high-efficiency analytical techniques, are widely applied in pharmaceutical and phytochemical analyses (Borghi et al., 2022). GC-MS is primarily used for volatile compound profiling, while LC-MS excels in non-volatile component characterization. The integration of these methods enables comprehensive coverage of plant secondary metabolite diversity (Li et al., 2022). In this study, we employed GC-MS and LC-MS for the first time to analyze buds and flowers of B.striata across four critical flowering stages (P1–P4), aiming to elucidate the dynamic patterns of volatile and non-volatile components, clarify metabolic differences between buds and flowers, and establish a theoretical foundation for determining optimal harvest windows and enhancing value-added utilization.
Using the geo-authentic cultivar B.striata ‘Gui Ji 1’ from Guizhou Province as the study material (Zhang et al., 2022), we systematically characterized metabolites from the initial flowering to senescence stages through GC-MS and LC-MS, combined with principal component analysis (PCA) and orthogonal partial least squares discriminant analysis (OPLS-DA) to identify key differential components. The findings not only fill the research gap in understanding metabolic dynamics during B.striata flowering but also provide scientific support for developing functional products derived from its flowers. This work holds significant implications for extending the industrial chain of B.striata and promoting efficient resource utilization.
2 Materials and methods
2.1 Materials and reagents
Fresh flowers of the B.striata cultivar ‘Gui Ji 1’ were collected from the medicinal plant germplasm nursery of the Guizhou Crop Variety Resources Institute. All plants were cultivated under semi-wild conditions beneath secondary forest canopy (50-60% density) without fertilizer application, with nutrient supply relying exclusively on natural litter mineralization. Throughout the cultivation period, no significant occurrence of diseases or pests was observed, and biotic stress remained at an extremely low level. Meanwhile, through measures such as deploying hail nets during risk periods and improving drainage systems, the impact of abiotic stress was effectively avoided, providing a stable environment for plant growth. All reagents and reference standards, including glucose, rutin, and proanthocyanidin (purity >99%, Wuhan Zhongbiao Technology Co., Ltd., China), met analytical requirements, and organic solvents were of analytical or chromatographic grade.
2.2 Instruments and equipment
Instrumentation included an Agilent 7890A-5975C GC-MS system (Agilent Technologies, USA), a manual solid-phase microextraction (SPME) device with a PDMS/CAR/DVB fiber (50/30 μm, 2 cm; Supelco, USA), an HP8453 UV-Vis spectrophotometer (Aoyi Instruments, Shanghai), a BSA2202S-CW electronic balance (Youke Instrument, Shanghai), and a CTFD-18S freeze dryer (Qingdao Yonghe Chuangxin Electronics, China).
2.3 Experimental procedures
2.3.1 Flower collection and processing
Fresh flowers of the B.striata cultivar ‘Gui Ji 1’ (a biennial plant) were collected from Guizhou Academy of Agricultural Sciences. Over four developmental stages (P1–P4), collections were conducted at 7-day intervals, encompassing a total sampling period of 21 days. For each sampling event, 500 g fresh weight was harvested for both flower buds and fully opened flowers, with the former labeled as B and the latter as F (see Table 1 for detailed sampling criteria). Based on the team’s previous research findings, the following method was used for sample processing: The collected flowers were gently rinsed under running water for 15 seconds, then flash-frozen at -80 °C for 12 hours, and subsequently lyophilized for 24 hours to obtain dried samples. Finally, the samples were aliquoted into sealed containers and stored at 4 °C (Han et al., 2023). Collected flowers were rinsed under running water for 15 s, flash-frozen at -80 °C for 12 h, and lyophilized for 24 h to obtain dried samples, which were then stored at 4 °C in sealed containers.
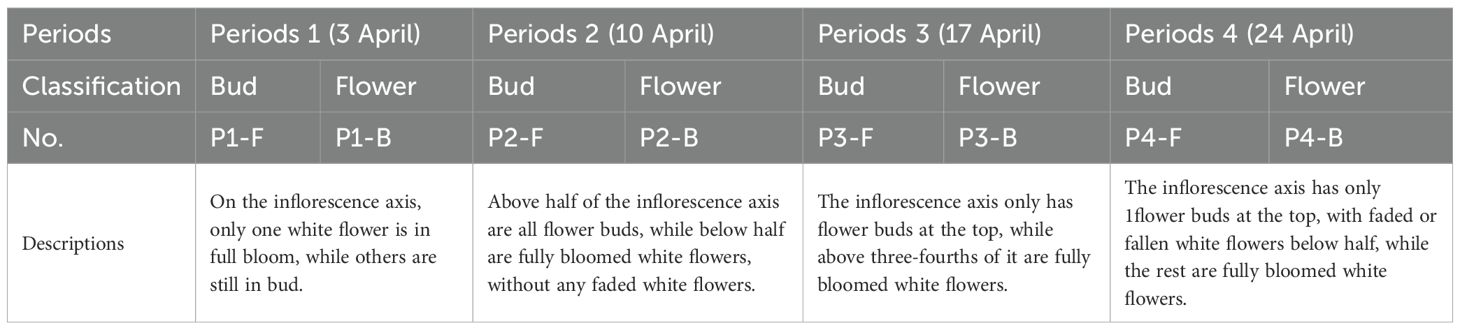
Table 1. Developmental stages and grouping criteria for B.striata flower samples.
2.3.2 Determination of total polysaccharides, total flavonoids, and anthocyanins
Lyophilized samples were equilibrated to room temperature, pulverized, and sieved (200-mesh). A 1.0 g aliquot was mixed with 20 mL of deionized water (for polysaccharides) or anhydrous ethanol (for flavonoids and anthocyanins), followed by ultrasonic extraction (30 min), centrifugation, and filtration to obtain test solutions. Total polysaccharides were quantified using the phenol-sulfuric acid method (SN/T 4260-2015), total flavonoids via spectrophotometry (SN/T 4592-2016), and anthocyanins by HPLC (NY/T 3164-2017), adhering to export food testing standards.
2.3.3 GC-MS analysis
2.3.3.1 Experimental procedure
Refrigerated samples were equilibrated at room temperature for 2 hours, pulverized, and sieved through a 200-mesh sieve. An aliquot of the powdered sample was transferred to a 15 mL extraction vial and sealed immediately. The SPME fiber was conditioned in the GC-MS inlet at 240 °C until no contaminant peaks were detected. The vial was placed on a solid-phase microextraction (SPME) device set to 60 °C with a stirring speed of 500 rpm. After preheating the vial for 15 minutes, the SPME fiber was inserted through the vial cap into the headspace, positioned approximately 1.0 cm above the sample surface, and exposed for 50 minutes. The fiber was then retracted, removed from the vial, and inserted into the GC-MS inlet, where it was desorbed at 240 °C for 3 minutes before analysis.
2.3.3.2 Chromatographic conditions, column
DB-WAX (30.0 m × 250 μm, 0.25 μm). Temperature Program: Initial: 40 °C (held for 2 minutes). Ramp 1: 3 °C/min to 85 °C (held for 2 minutes).Ramp 2: 2 °C/min to 110 °C (held for 2 minutes). Ramp 3: 5 °C/min to 160 °C (held for 1 minute). Ramp 4: 5 °C/min to 220 °C (held for 5 minutes). Inlet: 240 °C. Transfer Line: 230 °C. Carrier Gas: Helium at 1 mL/min (splitless mode).
2.3.3.3 Mass spectrometry conditions
Ionization: Electron Ionization (EI) source with 70 eV electron energy. Temperatures: Ion Source: 230 °C. Quadrupole: 150 °C. Scan Mode: Full scan with a mass range of 35–500 u.
2.3.3.4 Qualitative analysis
Detected components were identified by matching mass spectra against the NIST11 database and retention times. Column bleed peaks were excluded during database screening to ensure accurate compound identification.
Using n-decanol (mass concentration: 100 μg/mL) as the internal standard, the mass concentration of each component was calculated by multiplying the ratio of its peak area to the internal standard’s peak area by the internal standard’s concentration. The formula is expressed as
2.3.4 LC-MS analysis
The UPLC system was a Dionex Ultimate 3000 (Thermo Fisher Scientific, CA, USA) with Orbitrap Exploris™ 240 mass spectrometer (Thermo Scientific, San Jose, USA) equipped with a heat electrospray ionization (HESI) source in positive mode. The capillary voltage setting was set to +3.5 kV during the operation of the instrument. The flow rate of the gas in the sheath was 30 arbitrary units. The auxiliary as was 10 arbitrary units, and the temperature was 350 °C. The capillary temperature was 320 °C. The full MS scan was in the range of 50–500 m/z. and obtained using a mass resolution of 60000 (full width at half maximum). The maximal injection time was 50 ms, and the automatic-gain controlled objective setting was normal. All individual degradation-product extracted-ion chromatograms were rebuilt from full scan data with a mass tolerance of 5 ppm (adequate for minimizing the background noise and distinguishing the interfering and analyte signals). In MS2 mode, the resolution was 17500, and samples were analyzed at 10, 30, and 60 normalized collisional energy. The spectra were analyzed using Xcalibur 4.0 software (Thermo Fisher Scientific). Metabolites product identifications were carried on Compound Discovery 3.0 (Thermo Fisher Scientific., CA, USA).
Metabolites product was separated using a T3 column (1.7 mm × 150 mm, 1.8 µm, Waters, Ireland). The mobile phase consisted of solvent A, water with 0.1% formic acid, and solvent B, acetonitrile. The injection volume was 2 µL. The gradient was 1%B for 1.5 min and was linearly increased to 99% in 11.5 min and kept for 3.5 min. The gradients were at a flow rate of 0.3mL/min, and the column temperatures were 25°C.
2.4 Statistical analysis
All experiments were performed in triplicate. Data were collated and summarized using Microsoft Excel. Statistical analyses, including ANOVA or one-way ANOVA, were conducted with SPSS 22.0 software. Multivariate analyses (PCA and OPLS-DA) were performed using SIMCA 14.1. Graphical representations were generated with GraphPad Prism 8.0. All experiments were conducted in triplicate (n=3).
3 Results and analysis
3.1 Morphological characteristics of B.striata across flowering stages
Floral samples were collected according to the stages defined in the Methods section (Figure 1). At the initial flowering stage (P1), when the first flower began to bloom, both flowers and buds were sparse and concentrated at the apex of the short inflorescence axis. One week after the first flower opened (P2), the inflorescence axis elongated, with fully bloomed flowers at the base and continued bud differentiation at the apex. By the second week (P3), the inflorescence axis reached its maximum length; flowers at the base transitioned from full bloom to senescence, while the apex still produced new buds. By the third week (P4), the inflorescence axis ceased elongation, with basal flowers showing advanced senescence or abscission, and minimal bud differentiation observed at the apex.
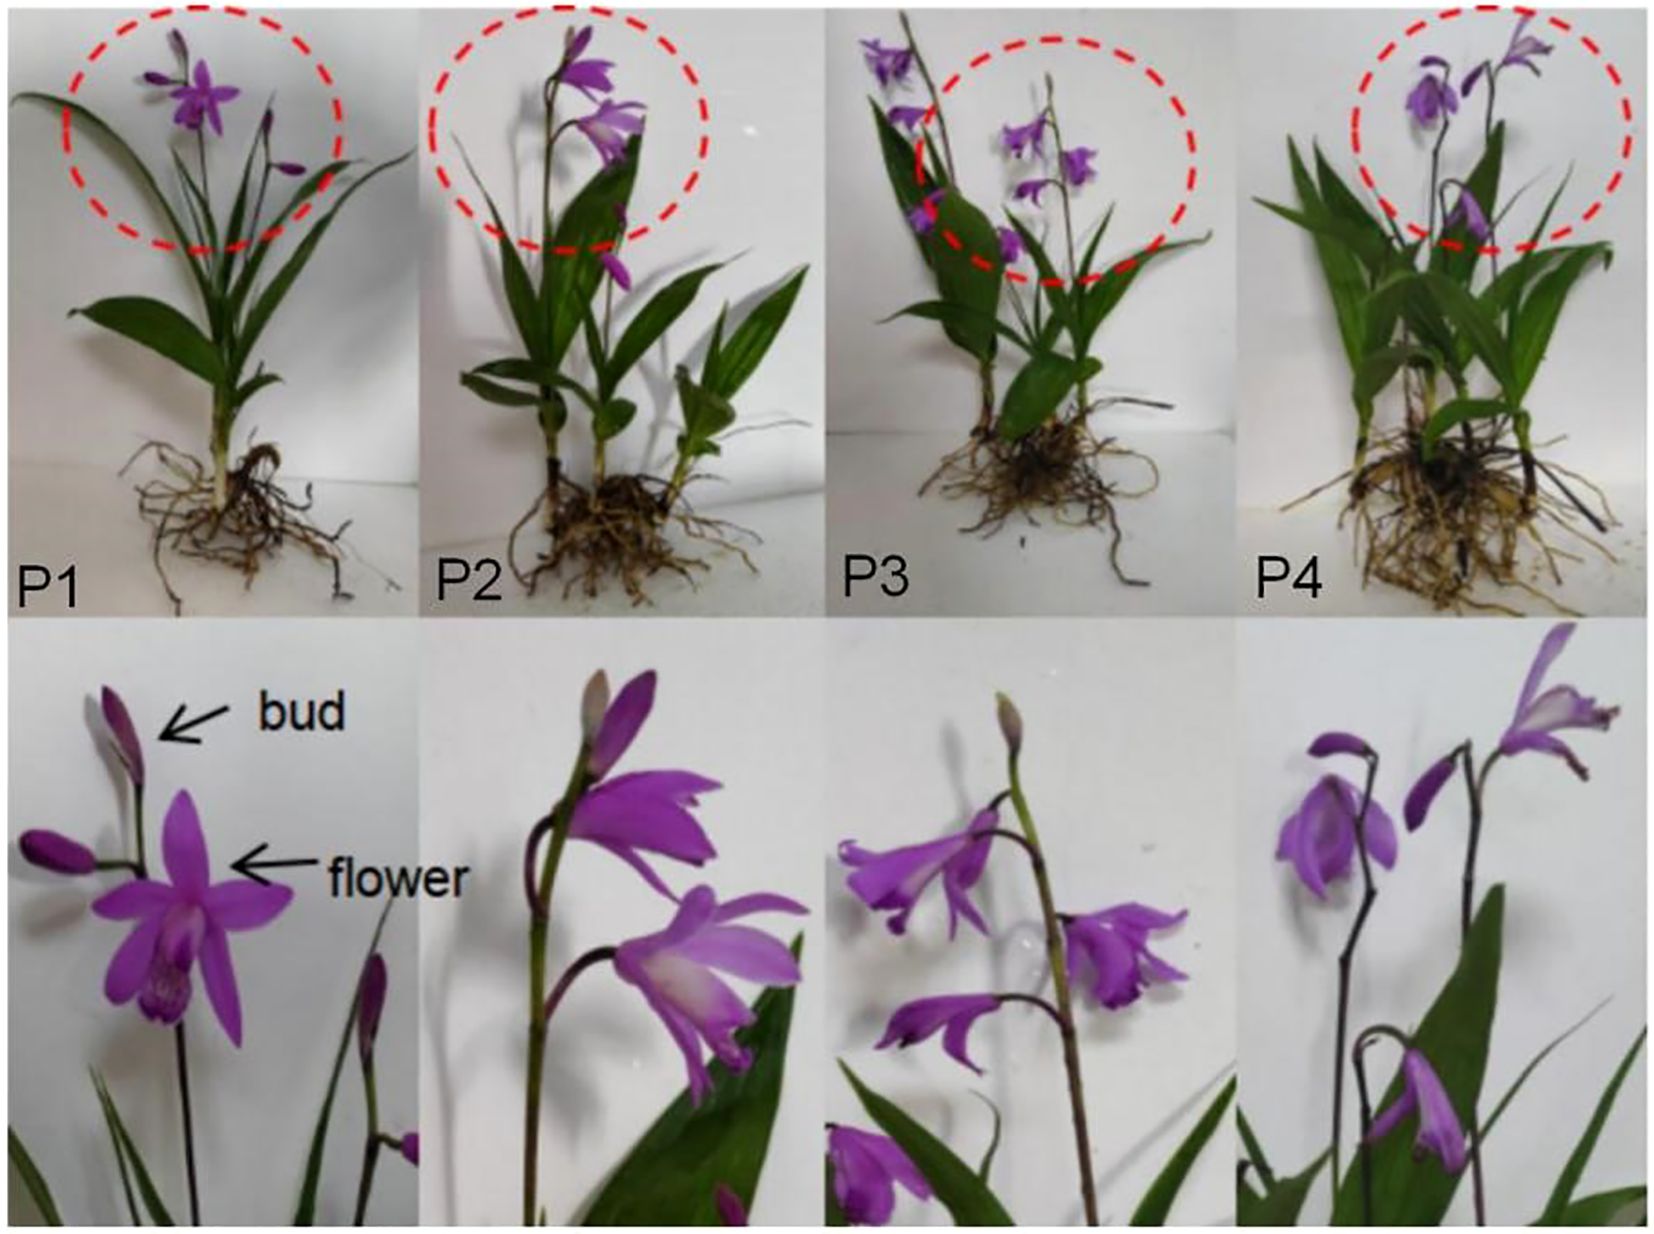
Figure 1. Morphology of B.striata flowers and buds across developmental stages (P1–P4).
3.2 Analysis of total polysaccharides, anthocyanins, and total flavonoids
Analyzing the contents of total polysaccharides, anthocyanins, and total flavonoids in buds and flowers across different developmental stages revealed a shared trend of initial increase followed by decline for all three components (Figure 2). Results revealed a shared trend of initial increase followed by decline for all three components. Total polysaccharides and anthocyanins peaked at stage P3, while total flavonoids reached their maximum at stage P2. Notably, total flavonoid content in buds consistently exceeded that in flowers during stages P2–P4, suggesting that flavonoids may serve as key regulators of bud development (Pei et al., 2023). In contrast, polysaccharides and anthocyanins likely accumulate to meet functional demands during full bloom (e.g., nectar production, pigmentation) and are subsequently recycled during floral senescence (Tremlová et al., 2021). These dynamic shifts in bioactive compound levels between buds and flowers may reflect distinct physiological strategies: bud-specific flavonoid enrichment could protect immature tissues, while post-anthesis fluctuations in polysaccharides and anthocyanins may align with pollinator attraction and energy reallocation (Castaldo et al., 2023). These findings provide a theoretical basis for optimizing harvest timing (targeting peak bioactive compound levels) and selecting appropriate floral organs (buds vs. flowers) for specific applications.
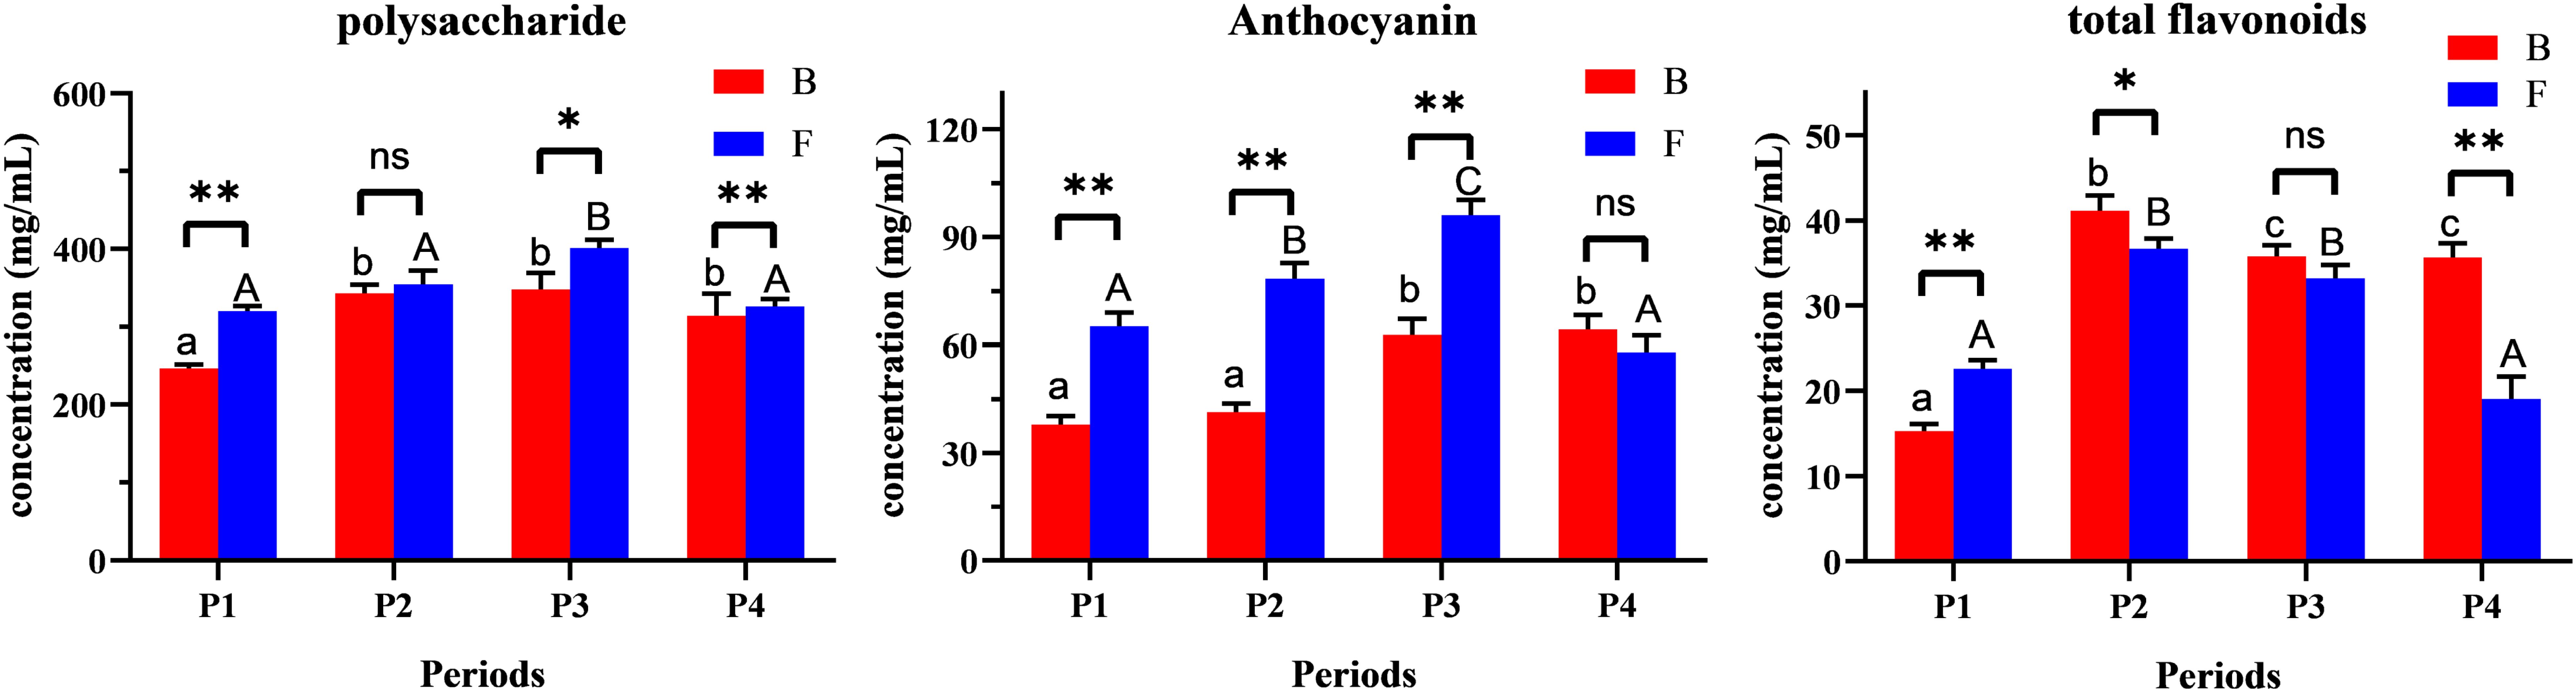
Figure 2. Content of bioactive components (total polysaccharides, flavonoids, and anthocyanins) in B.striata flowers across developmental stages (P1–P4). *P<0.05; **,P<0.01; ns, P>0.05.
3.3 GC-MS analysis
GC-MS analysis of eight sample groups (Table 2) identified 86 volatile components. The highest compositional diversity was observed in P2-F (flowers at stage P2) and P3-B (buds at stage P3), while P1-F (flowers at stage P1) and P4-B (buds at stage P4) exhibited the lowest diversity. Notably, flowers contained a broader range of volatile compounds than buds across all stages except P2. In terms of abundance, esters dominated the volatile profile, with ethyl acetate and ethyl propionate as the most abundant components, followed by butyl acetate. These ester compounds constitute the primary source of the characteristic fragrance in B.striata flowers. Additional high-abundance volatiles included alkanes such as 2,4-dimethylheptane, 10-methylnonadecane, and derivatives of palmitic acid (e.g., palmitamide), which synergistically contribute to the unique aromatic signature of the flowers.
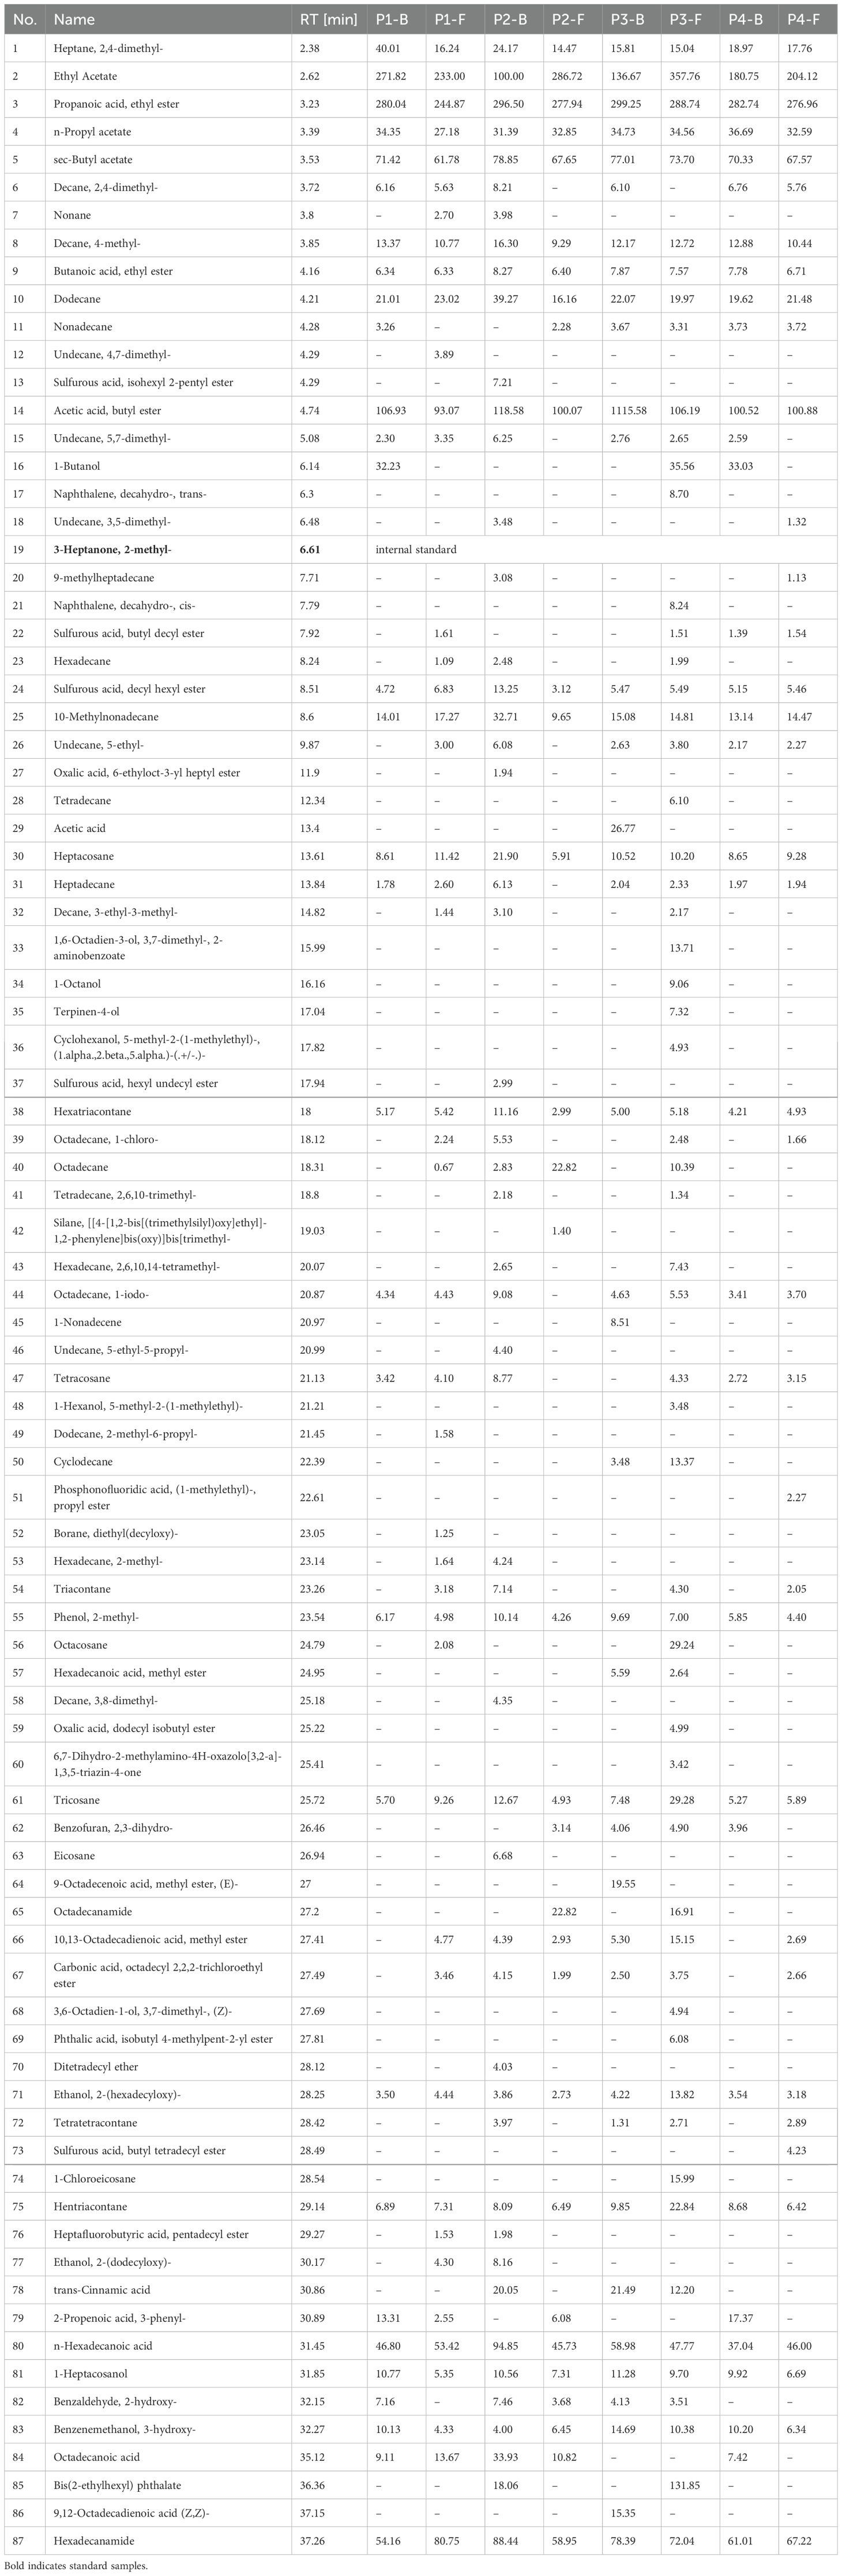
Table 2. Content of volatile components (mg/g) in B.striata flowers across developmental stages (P1–P4).
Buds of B.striata contained fewer volatile components compared to flowers, with only 5.6% of shared components between the two organs, indicating significant divergence in volatile profiles (Figure 3). Across developmental stages, 17 common components were detected in all four stages, while stage P3 exhibited the highest number of unique components (40 species). Notably, P3 also showed the greatest diversity of volatile compounds (81 components), suggesting that stage P3 may represent the period of most distinctive fragrance in B.striata flowers.
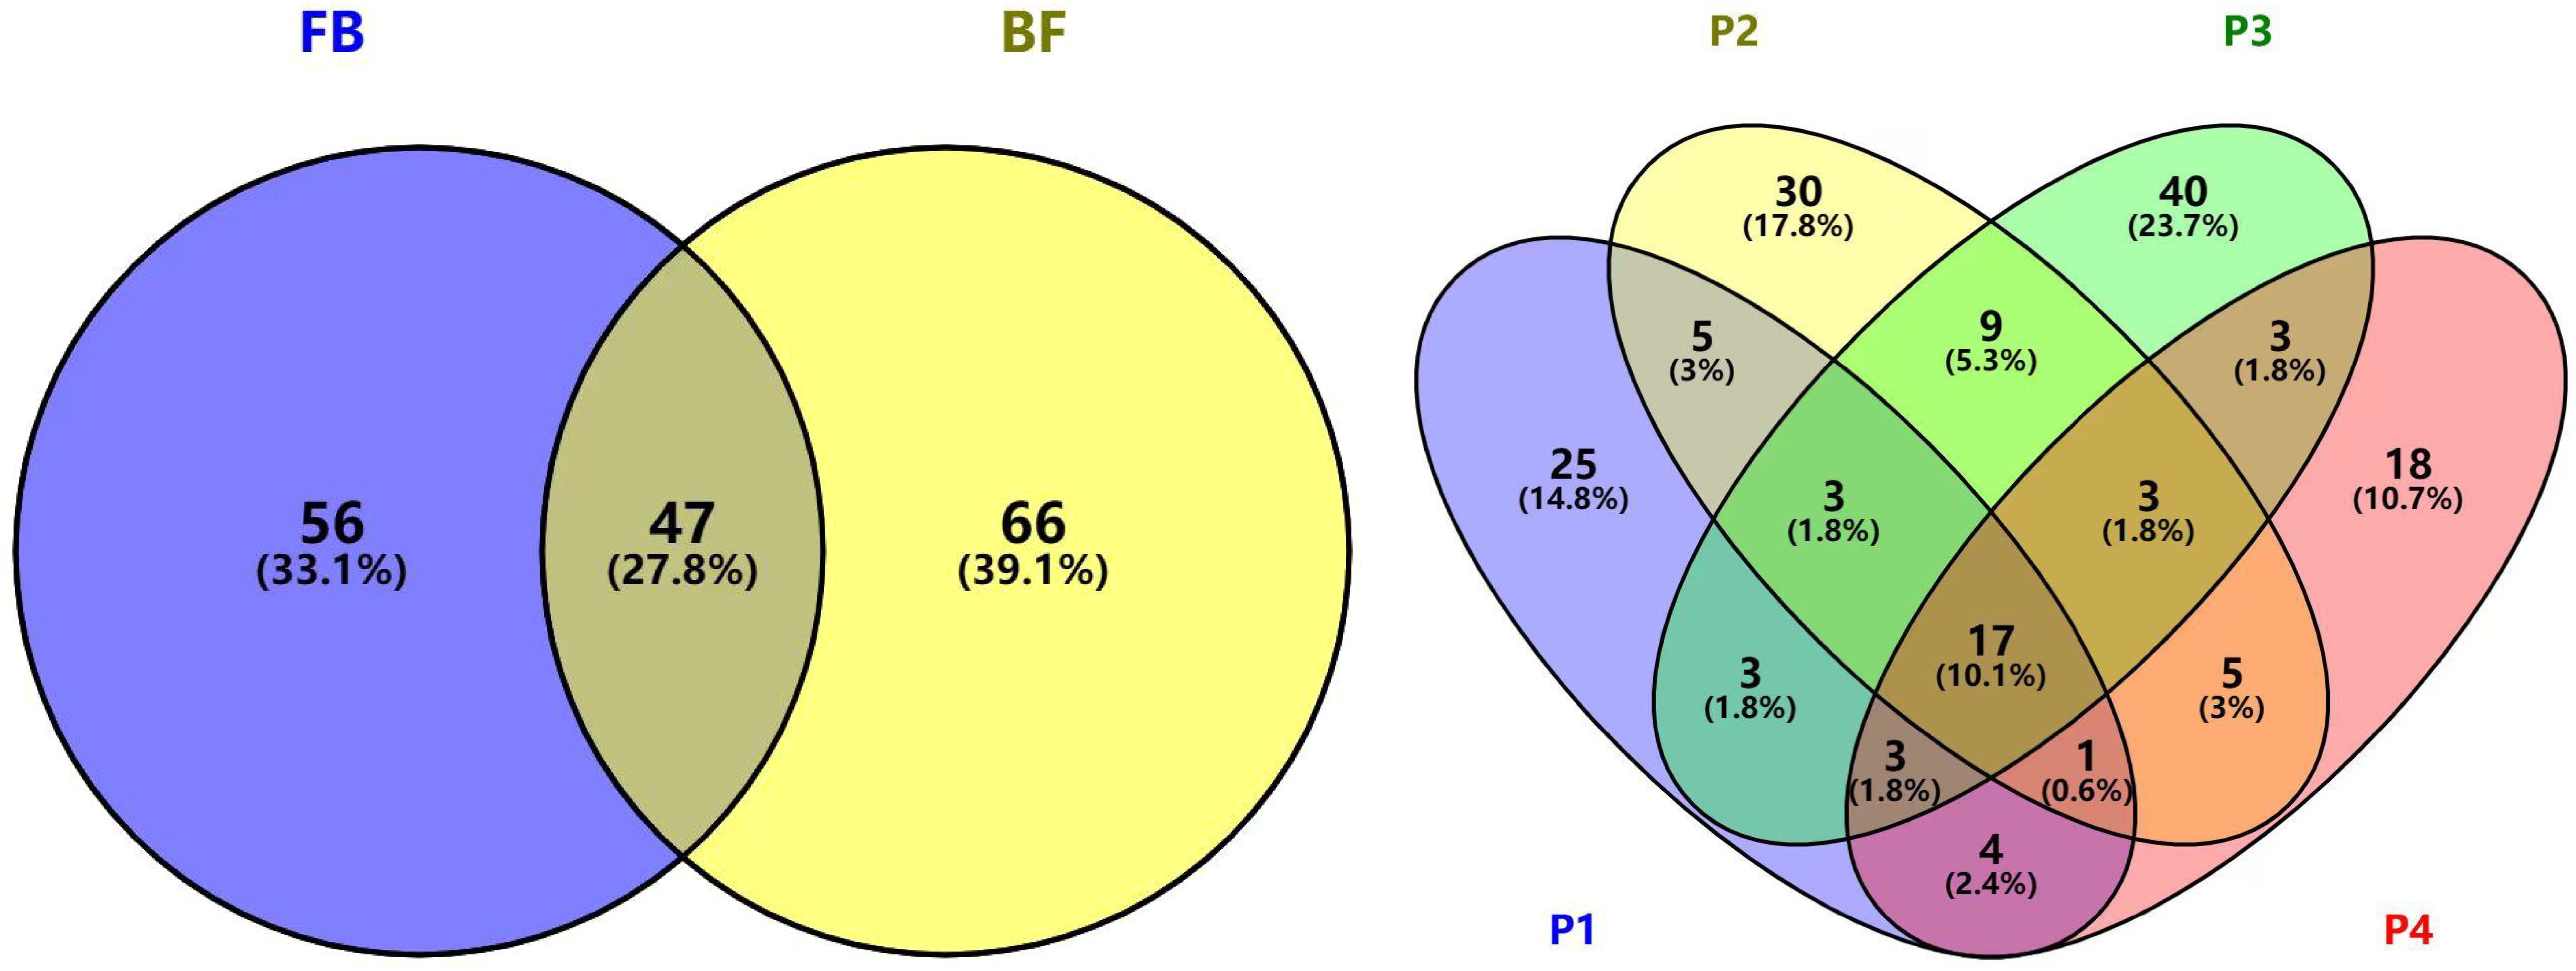
Figure 3. Venn diagram of shared and unique volatile components in B.striata flowers and buds.
3.4 Principal component analysis and orthogonal partial least squares discriminant analysis of major volatile components
Volatile components with concentrations exceeding 10 mg/mL were summarized in Table 3, comprising a total of 10 compounds labeled as X1–X10. These components were predominantly lipid derivatives.
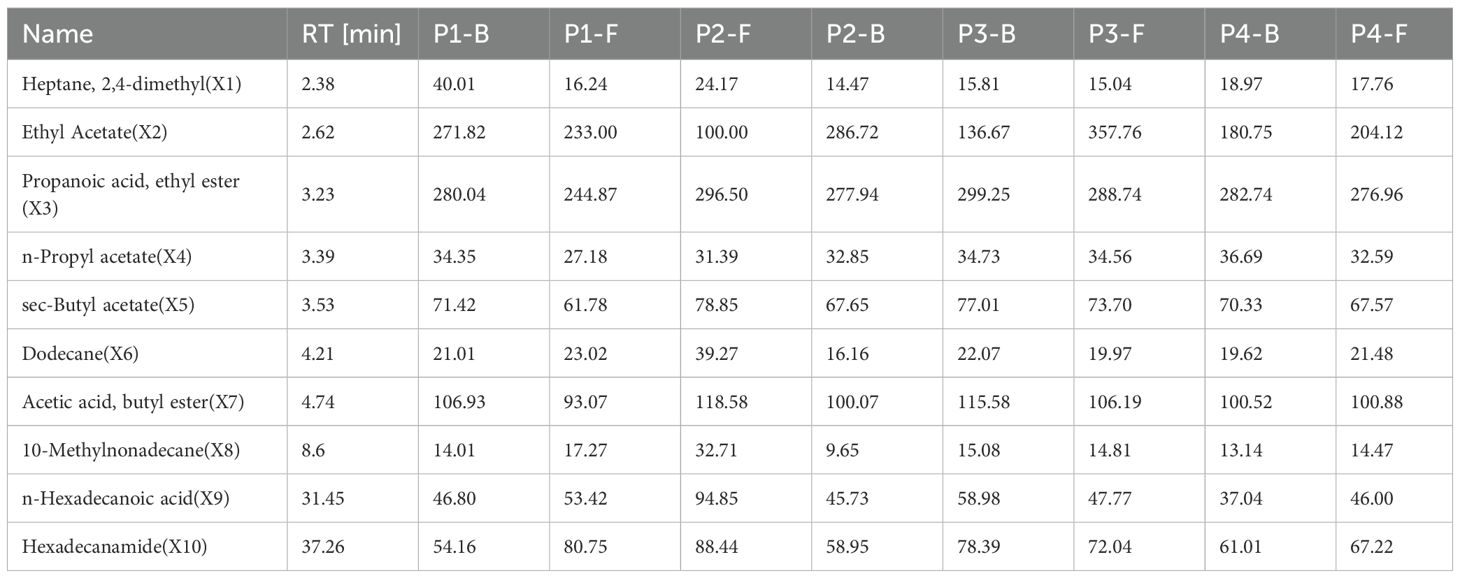
Table 3. Major volatile components identified in B.striata flowers.
PCA and OPLS-DA were performed on these components. The results are as follows: The cumulative R²X value of the first two principal components reached approximately 0.8, indicating strong overall model fitness to the data (Figure 4A). Distinct separation trends were observed in the principal component space, with samples P2-F, P1-B, and P3-F being markedly distant from other groups, while P2-B, P3-B, P4-B clustered closer to P1-F and P4-F (Figure 4B). This suggests that the volatile profiles of buds (e.g., P1-B) resemble those of early- or late-stage flowers, whereas flowers at stages P2 and P3 exhibit greater compositional complexity. The isolation of P1-B may stem from its limited or oversimplified volatile composition. PCA analysis further confirmed that stages P2 and P3 are characterized by the richest diversity of major volatile components in B.striata flowers, signifying these periods as optimal for harvesting.

Figure 4. PCA analysis of major volatile components in B.striata flowers. (A) Explained variance plot of PCA, (B) PCA score plot.
The OPLS-DA analysis yielded results consistent with PCA. As shown in Figure 5A, the cumulative R²X value of the first two components reached approximately 0.8, demonstrating strong overall model fitness. A negative intercept was observed for the permutation Q² value (R² = 0.558), with the original model’s Q² exceeding permuted values—this confirms the model’s reliability without overfitting and validates its classification capability (Figure 5B). Buds and flowers exhibited clear separation in the score plot, indicating significant inter-group differences (high discriminative power) (Figure 5C). Distinct clustering patterns were observed across flowering stages in the score plot: P3 and P4 groups displayed intra-group homogeneity (tight clustering) and inter-group heterogeneity, suggesting stage-specific metabolic signatures (Figure 5D). Further analysis (Figures 5E, F) identified X3, X4, X5, and X7 as core discriminatory variables with VIP values >1, highlighting their significant contributions to group classification. Except for X3, these components showed positive correlations, suggesting that X4, X5, and X7 may serve as key signature volatiles responsible for the characteristic fragrance of B.striata flowers.
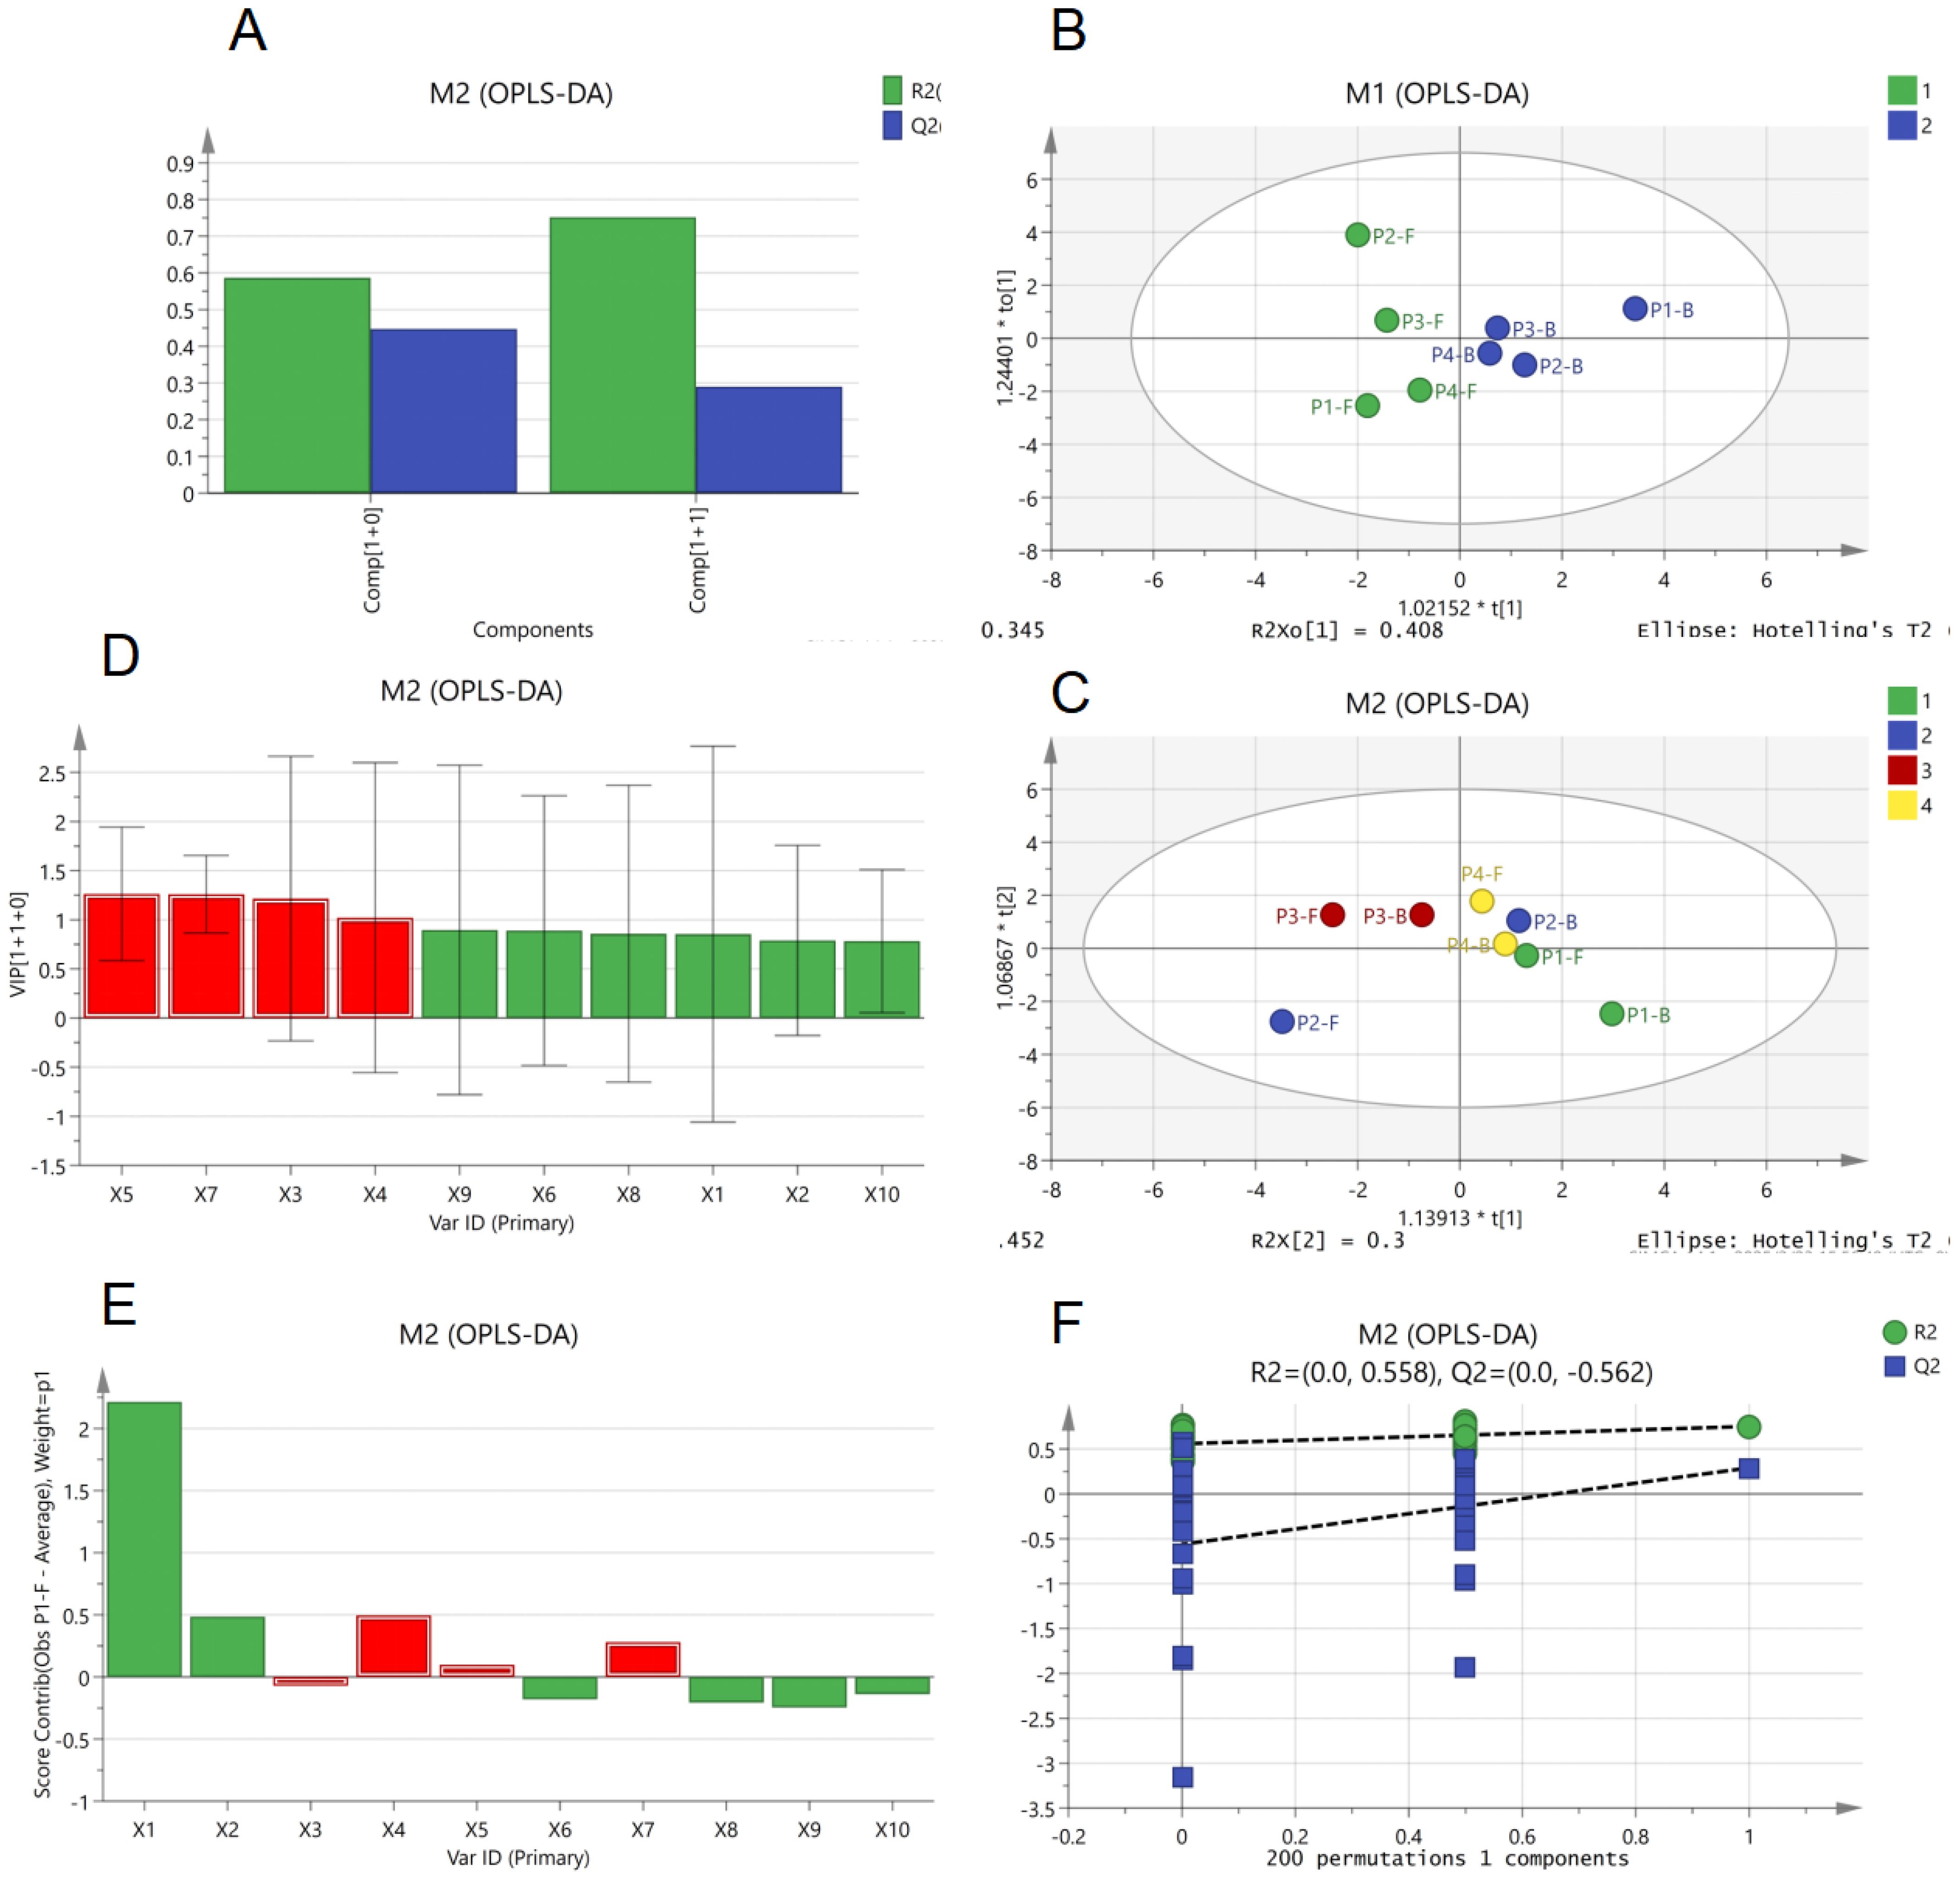
Figure 5. Orthogonal partial least squares discriminant analysis (OPLS-DA) of major volatile components in B.striata flowers. (A) R² and Q² bar plot of OPLS-DA model, (B) Permutation test plot of OPLS-DA model, (C, D) OPLS-DA score plots grouped by organ (flowers vs. buds) and developmental stage, (E) variable importance in projection (VIP) values bar plot from OPLS-DA, (F) variable contribution plot of OPLS-DA.
3.4.1 LC-MS analysis
LC-MS analysis of eight sample groups (Table 4) identified and annotated 115 secondary metabolites, with glycosides and esters as the dominant classes, followed by organic acids. Notably, compounds such as DactylorhinE, 6-O-[(2E)-3-(3,4-Dihydroxyphenyl)-2-propenoyl]-D-glucopyranose, 1-O-(4-coumaroyl)-beta-D-glucose, Militarine, and Ethyl [(5-amino-1H-1,2,4-triazol-3-yl)sulfanyl]acetate exhibited significantly higher concentrations compared to other components. Militarine, a quality marker for B.striata specified in the Chinese Pharmacopoeia, is synthesized via the phenylpropanoid pathway. The other highlighted compounds are critical intermediates in the biosynthetic or glycoside metabolic pathways of B.striata(Li et al., 2024).
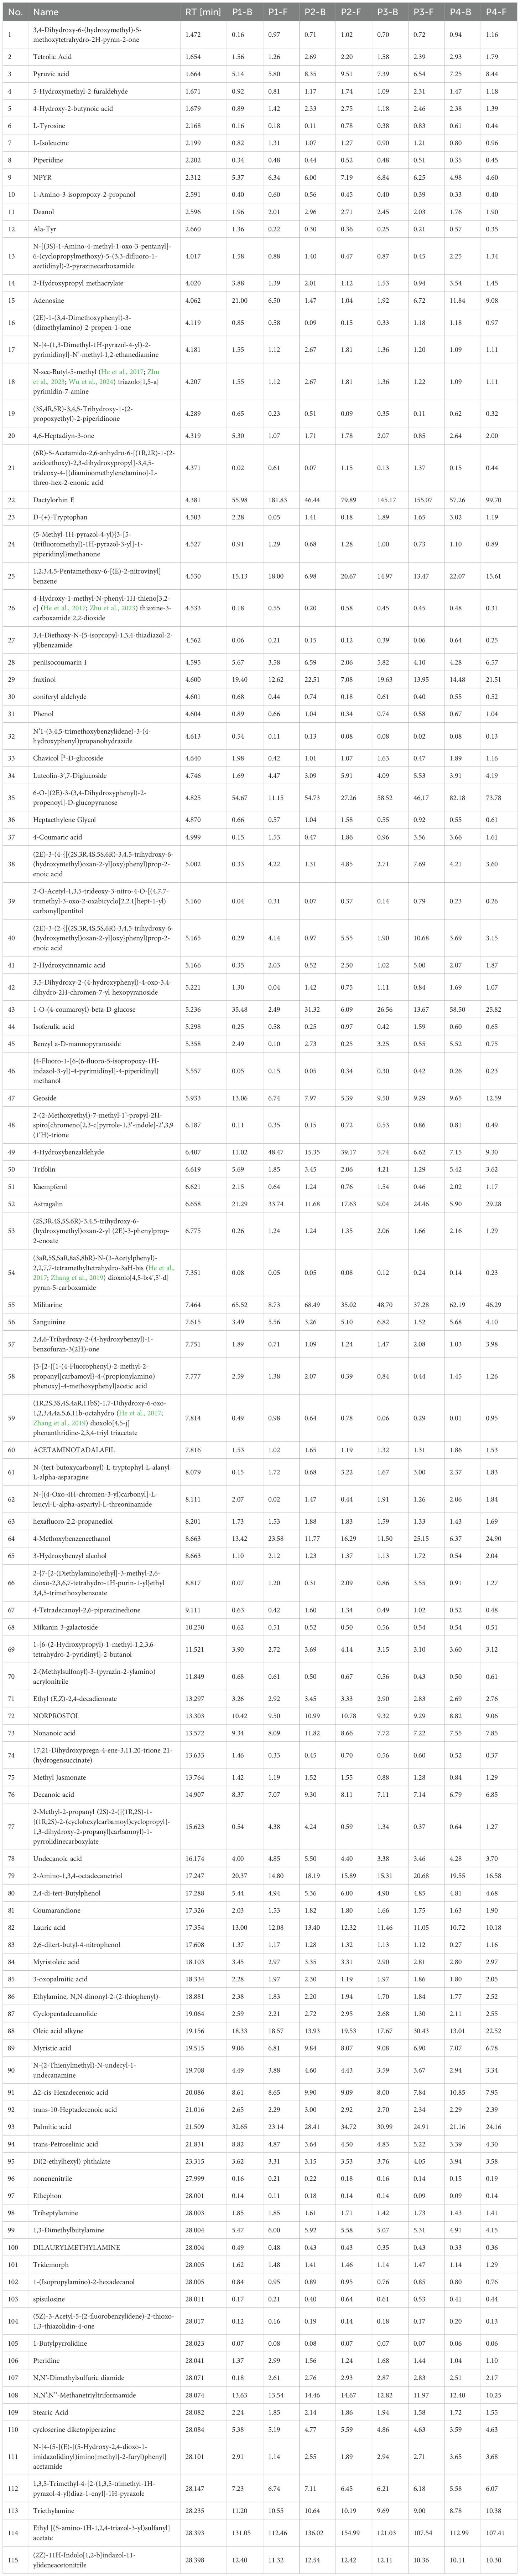
Table 4. Content of non-volatile components (mg/g) in B.striata flowers across developmental stages (P1–P4).
While these components were abundant across all stages, their levels varied temporally. In P1-B (buds at stageP1), 1-O-(4-coumaroyl)-beta-D-glucose and Militarine were relatively low, whereas Dactylorhin E reached its highest concentration among all groups. P2-B (buds at stage P2) showed reduced levels of 1-O-(4-coumaroyl)-beta-D-glucose, with overall lower abundances of these compounds, potentially linked to environmental factors and the physiological state of flowers during harvesting. In contrast, stage P3 exhibited peak accumulations: total concentrations of these four components reached 278.96 mg/g in P3-B (buds) and 252.19 mg/g in P3-F (flowers). This suggests an initial metabolic investment in Militarine storage to support flowering, followed by rapid consumption during bloom initiation and subsequent upregulation of synthesis in both buds and flowers at P3. Post-P3, metabolic activity declined, with components either degraded or translocated to rhizomes for future physiological needs.
These findings imply that timely removal of flowers during the flowering period may preserve bioactive compounds in the rhizomes. For harvesting flowers as byproducts, stage P3 is optimal: buds (P3-B) maximize retention of active ingredients, while flowers (P3-F) balance slightly reduced bioactive levels with peak volatile diversity. Thus, P3-F represents the optimal harvest window for applications requiring both medicinal and aromatic properties.
3.4.2 Principal component analysis and orthogonal partial least squares discriminant analysis of major components in LC-MS
Components with concentrations exceeding 10 mg/mL in the LC-MS analysis were compiled into Table 5, totaling 12 compounds labeled as Y1–Y12. These were predominantly glycosides and ethyl [(5-amino-1H-1,2,4-triazol-3-yl)sulfanyl]acetate, with Militarine—a quality marker for B.striata pharmacopeial standards—being abundantly present in the flowers.
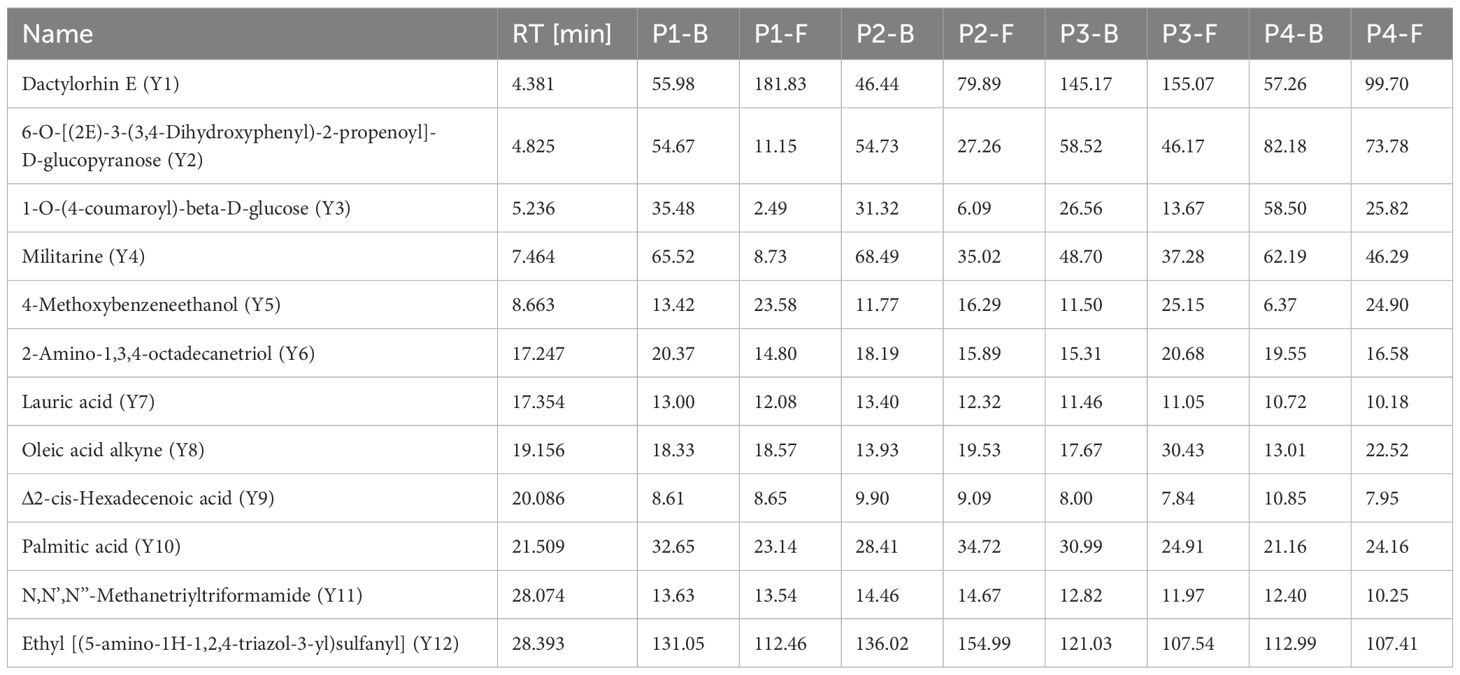
Table 5. Content of major non-volatile components (mg/g) in B.striata flowers across developmental stages (P1–P4).
PCA and OPLS-DA were applied to these components. As shown in Figure 6A, the cumulative R²X value of the first two principal components exceeded 0.75, indicating strong overall model fitness. Figure 6B demonstrates distinct separation trends in the principal component space: buds and flowers were significantly differentiated across groups except for P2-B (buds at stage P2) and P3-F (flowers at stage P3), which exhibited overlapping clustering due to their temporal proximity in floral developmental progression. This suggests marked compositional differences between buds and flowers, with PCA effectively distinguishing floral organs at stages P1, P2, and P4, thereby offering a robust method for quality evaluation of B.striata flowers. However, at stage P3, the rapid accumulation and peak levels of key bioactive components likely reduced discriminative resolution, reflecting metabolic saturation during this critical developmental phase.
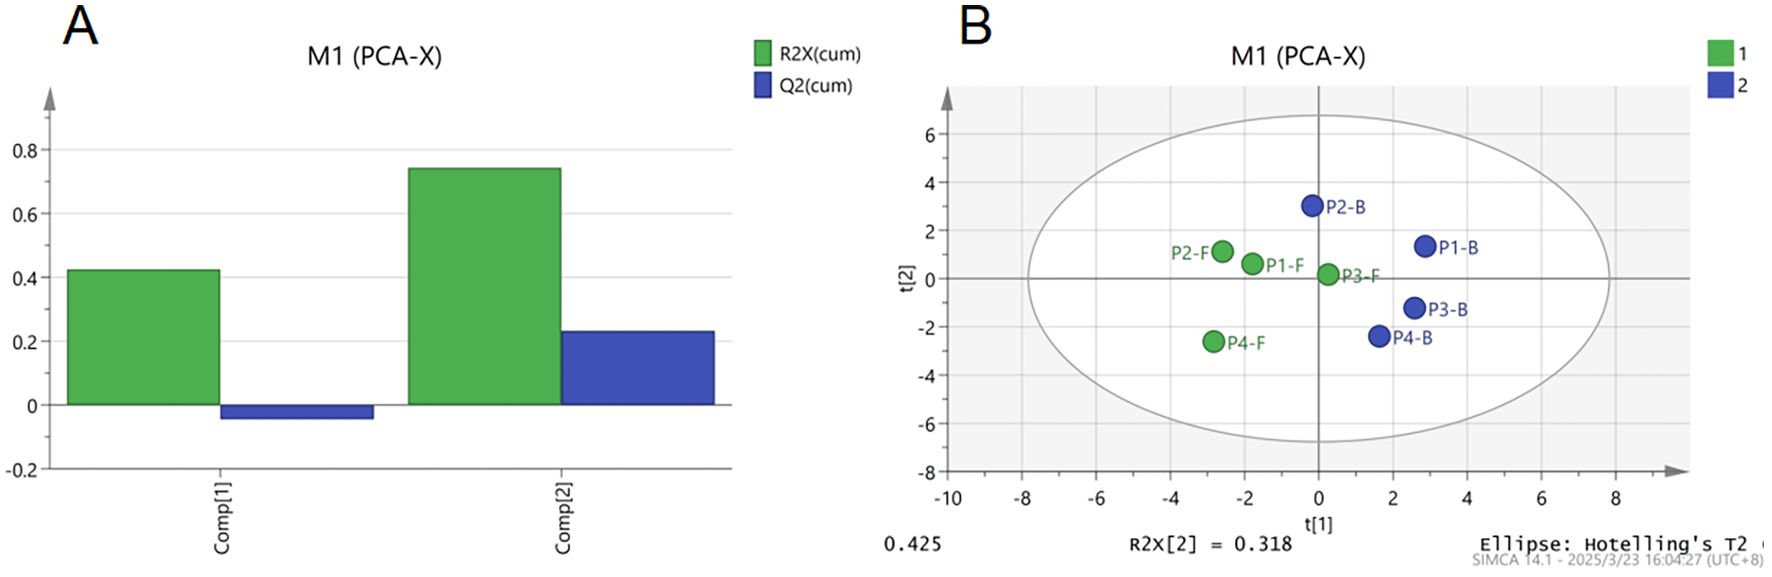
Figure 6. Principal component analysis (PCA) of major non-volatile components in B.striata flowers, (A) explained variance contribution plot of PCA, (B) PCA score plot.
The OPLS-DA results are as follows: In Figure 7A, the cumulative R² values of the first two components exceeded 0.9, indicating strong overall model fitness to the data. Figure 7B shows a negative intercept for the permutation Q² value (R² = 0.695), with the original model’s Q² surpassing permuted values, confirming the absence of overfitting and validating the model’s reliability and classification capability. In Figure 7C, samples from different developmental stages were completely separated in the score plot, demonstrating significant inter-group differences (high discriminative power), consistent with PCA results. This highlights OPLS-DA’s superior separation efficacy compared to PCA, suggesting its potential as a robust method for quality assessment of B.striata floral organs. Figure 7D reveals distinct clustering patterns across flowering stages: P1 and P2 groups exhibited intra-group homogeneity, while P4-F (flowers at stage P4) emerged as an outlier, likely due to advanced floral senescence. These patterns collectively reflect intra-group homogeneity and inter-group heterogeneity.
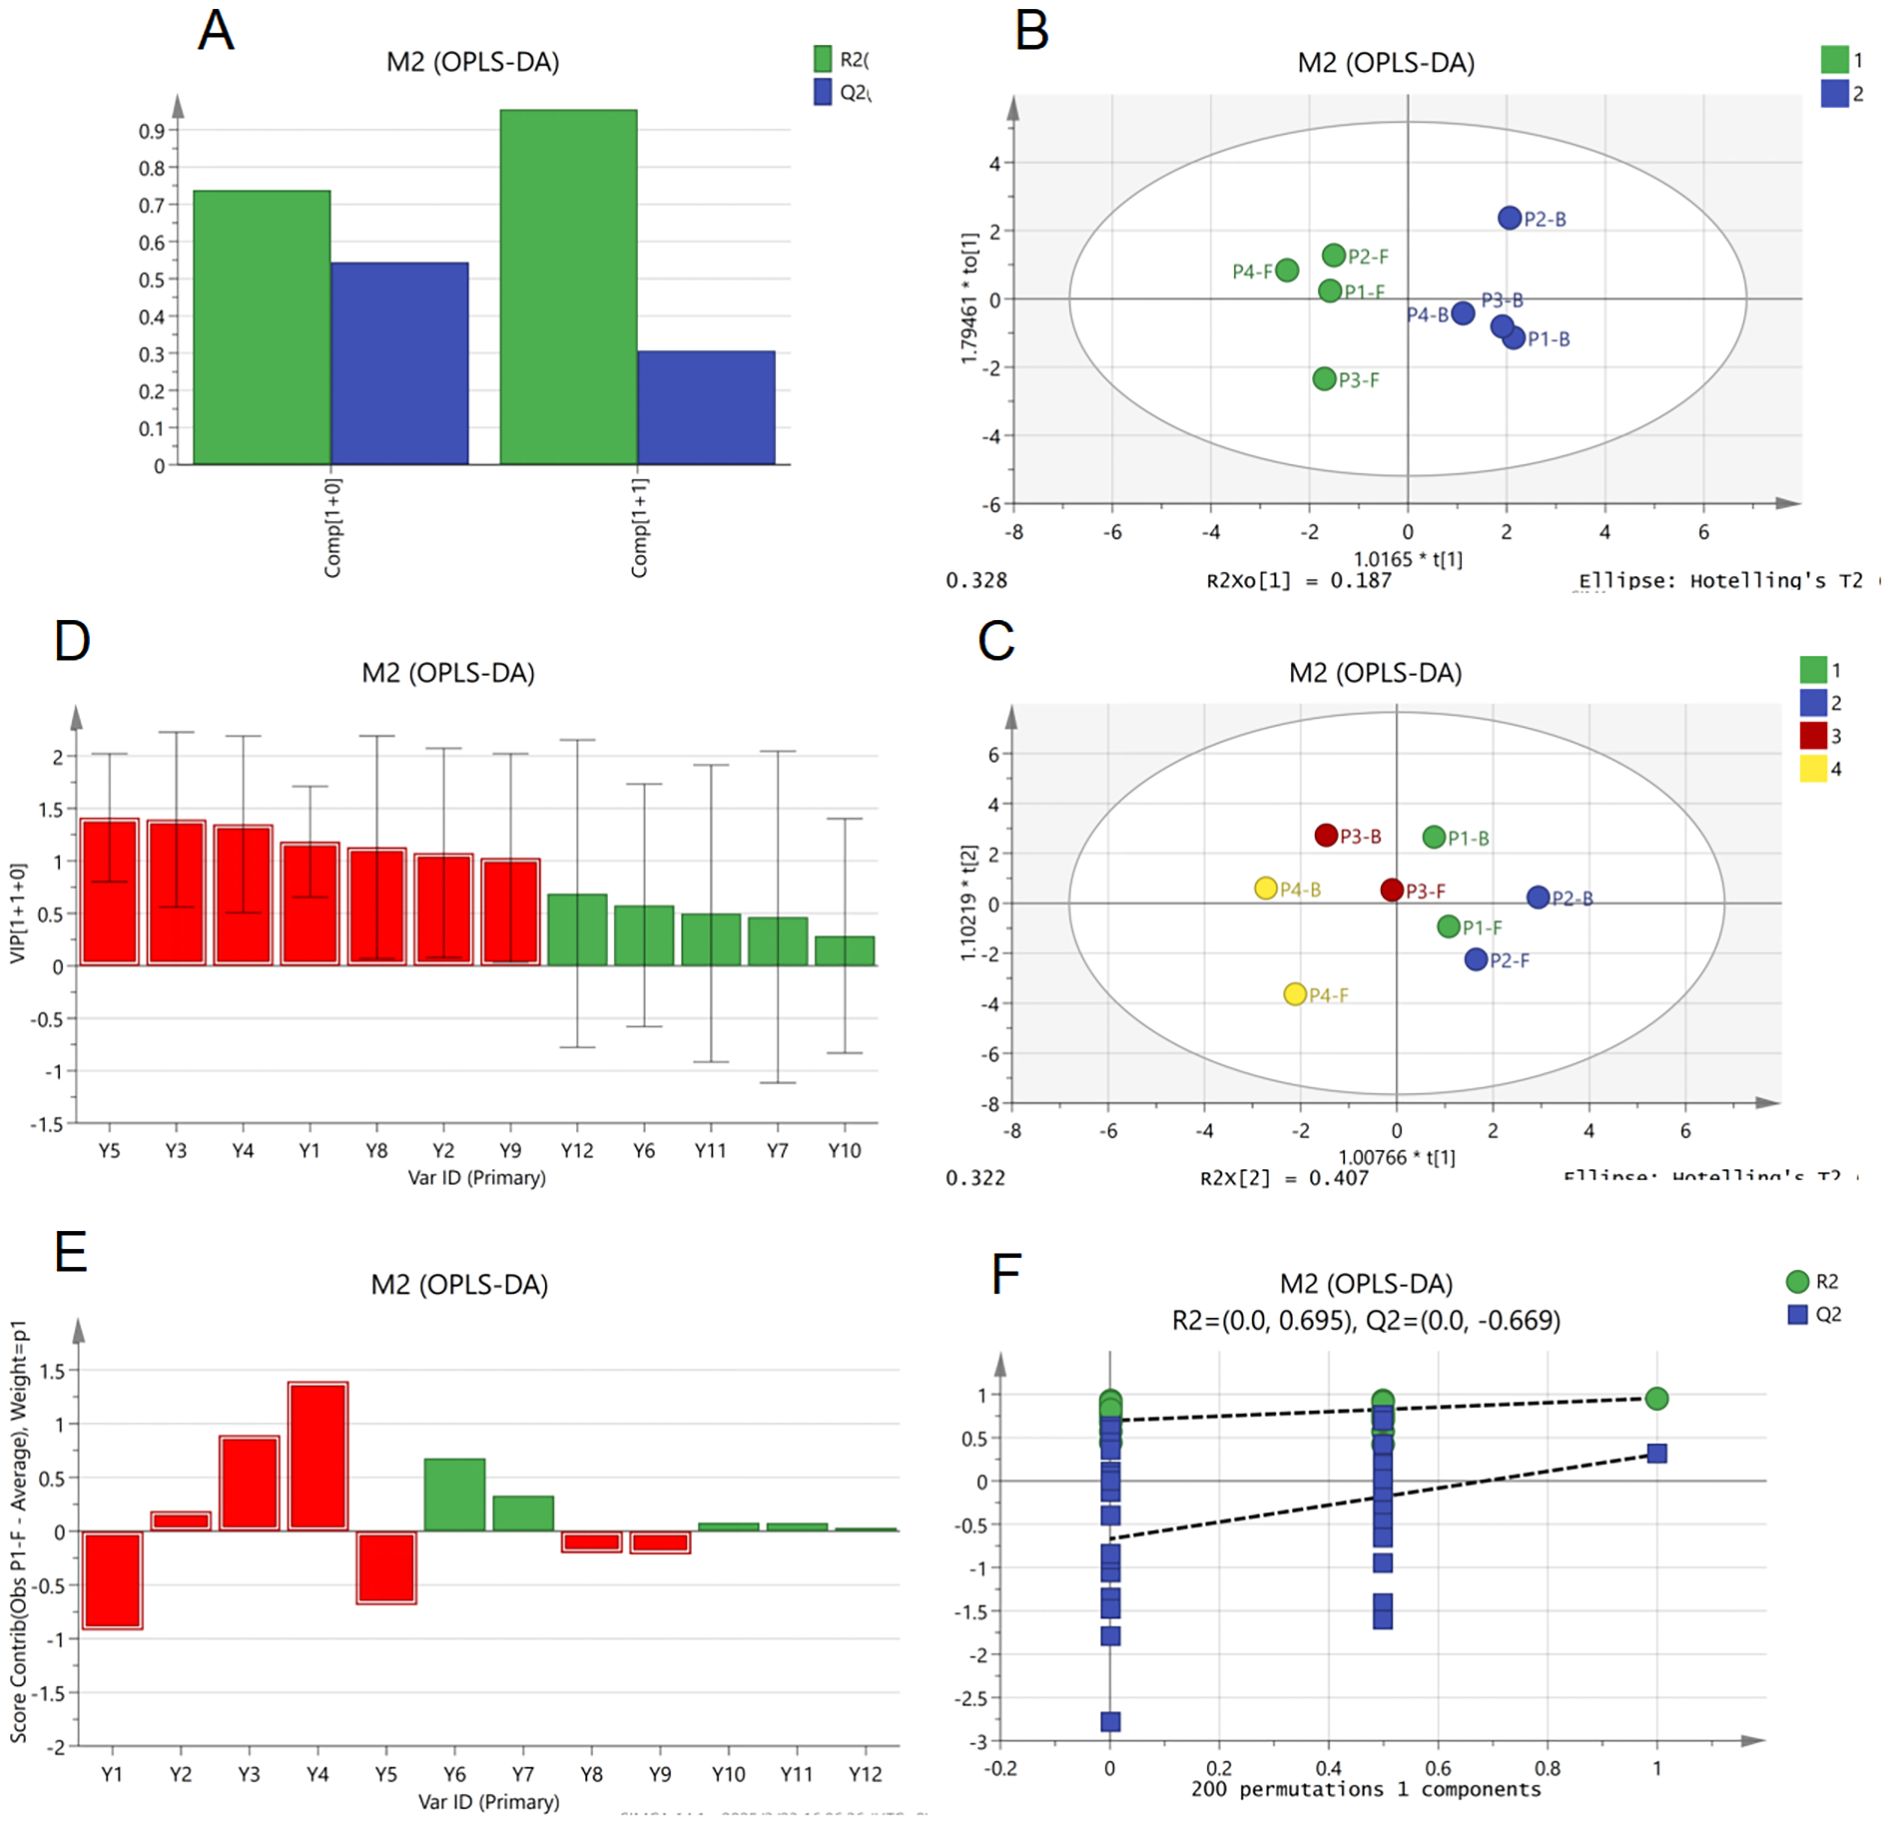
Figure 7. Orthogonal partial least squares discriminant analysis (OPLS-DA) of major non-volatile components in B.striata flowers, (A) R² and Q² bar plot of OPLS-DA model, (B) permutation test plot of OPLS-DA model, (C, D) OPLS-DA score plots grouped by organ (flowers vs. buds) and developmental stage, (E) variable importance in projection (VIP) values bar plot from OPLS-DA, (F) variable contribution plot of OPLS-DA.
Further analysis (Figures 7E, F) identified Y1–Y5 and Y8–Y9 as core discriminatory variables with VIP values >1, significantly contributing to group classification. Among these, Y1–Y4 were glycosides, potentially serving as stage-specific biomarkers. Notably, Y2–Y4 showed positive correlations, underscoring glycosides as critical quality markers in B.striata flowers. Y4, exhibiting the strongest positive correlation with classification, aligns with the quality marker for B.striata rhizomes specified in the Chinese Pharmacopoeia. This congruence suggests shared bioactive components and pharmacological activities between the flowers and rhizomes, providing a data-driven foundation for further exploration of the flowers’ therapeutic potential.
4 Conclusions
This study systematically investigated the dynamic profiles of secondary metabolites in buds (B) and flowers (F) of B.striata across four developmental stages (P1–P4) using GC-MS and LC-MS. Stage P3 was identified as a critical metabolic phase, with distinct compositional features in floral organs: flowers at P3 (P3-F) accumulated high levels of Militarine and ester volatiles, synergistically addressing reproductive needs and stress adaptation, while buds at P3 (P3-B) exhibited sustained accumulation of flavonoid components (e.g., Y3), likely contributing to the protection of immature tissues. For optimal resource utilization, P3-F is recommended as the primary harvest stage for raw material processing due to its dual advantages of bioactive richness (e.g., Militarine) and aromatic complexity. Although P3-B showed slightly reduced bioactive content compared to P3-F, it retained elevated glycoside levels (e.g., Y1), positioning it as a valuable supplementary source for medicinal applications. These insights provide a scientific basis for the efficient exploitation of B.striata floral resources. Future studies should prioritize optimizing drying techniques (e.g., freeze-drying vs. hot-air drying) to preserve thermolabile metabolites such as Militarine and volatile esters, freeze-drying is recommended for preserving heat-sensitive compounds like flavonoids, whereas sun-drying may be suitable for volatile esters with higher thermal stability, as demonstrated in prior studies examining drying-induced metabolite changes in B.striata flowers (Han et al., 2023). Industrial applications may require balancing energy efficiency with metabolite stability, potentially through hybrid drying protocols.
The secondary metabolites Y1-Y4 (Dactylorhin E, 6-O-acrylglucoside, 1-O-coumaroylglucose, and Millarine) in B.striata flowers are biosynthesized through an intricate phenylpropanoid-alkaloid hybrid metabolic network. This pathway utilizes phenylalanine and glucose as primary precursors, undergoing a series of enzymatic reactions to achieve structural diversification and functional specialization.
The metabolic cascade initiates with phenylalanine ammonia-lyase (PAL) catalyzing the deamination of phenylalanine to yield trans-cinnamic acid, which is subsequently hydroxylated by cinnamate-4-hydroxylase (C4H) to form 4-coumaric acid. The activated intermediate, 4-coumaroyl-CoA, is then generated via 4-coumaroyl-CoA ligase (4CL), serving as a critical branching point for downstream metabolism. The carbon flux is precisely regulated by glycosyltransferases (UGTs) and oxidative enzymes, directing biosynthetic pathways toward distinct end products. In the glycosylation branch, UGTs mediate the transfer of glucose moieties to either the carboxyl or hydroxyl groups of 4-coumaric acid, yielding 1-O-coumaroylglucose (Y3) and 6-O-acrylglucoside (Y2), respectively. Glycosylation not only enhances the hydrophilicity and stability of these compounds but also influences their subcellular storage and transport. Further structural elaboration leads to the formation of Dactylorhin E (Y1), likely derived from oxidative coupling or condensation of Y2/Y3, potentially facilitated by peroxidase (POD) or cytochrome P450-mediated reactions. Notably, Millarine (Y4), an alkaloid, may originate independently from tryptophan or ornithine via decarboxylation and cyclization. However, if its structure incorporates an aromatic ring, it could form hybrid metabolites through the conjugation of phenylpropanoid derivatives (e.g., coumaric acid) with alkaloid precursors, involving enzymes such as N-methyltransferases. The regulatory core of this metabolic network hinges on the activities of PAL and 4CL, which govern carbon allocation into the phenylpropanoid pathway, while the substrate specificity of UGTs dictates structural diversity in end products. Additionally, suppression of competing pathways (e.g., flavonoid biosynthesis) may enhance the accumulation of target metabolites. Biologically, Y1-Y3 function as phenolic antioxidants in plant stress responses, whereas Y4 may contribute to ecological adaptability (Li et al., 2024; Xu et al., 2024; Huang et al., 2025).
For biotechnological applications, heterologous expression of key enzymes (PAL, 4CL, and UGTs), coupled with metabolic flux optimization and dynamic regulatory strategies, holds promise for the scalable production of these high-value secondary metabolites, offering potential for pharmaceutical and nutraceutical development. Future studies should focus on elucidating the precise structures of Y1 and Y4, alongside kinetic and metabolomic analyses to validate the proposed network and its regulatory mechanisms.
Data availability statement
The original contributions presented in the study are included in the article/supplementary material. Further inquiries can be directed to the corresponding authors.
Author contributions
LY: Writing – review & editing, Data curation, Conceptualization, Writing – original draft. XH: Data curation, Writing – review & editing. HL: Investigation, Methodology, Writing – review & editing, Project administration. YC: Investigation, Formal Analysis, Writing – review & editing. MW: Funding acquisition, Writing – review & editing, Project administration. LT: Project administration, Supervision, Funding acquisition, Writing – review & editing.
Funding
The author(s) declare financial support was received for the research and/or publication of this article. This work was supported by the Science and Technology Program of Guizhou Province (Grant No. (2023)007); the National Key Research and Development Program of China (Grant No. 2021YFD1601002); Modern Agricultural Technology System of Traditional Chinese Medicine in Guizhou Province (GZZYCCYJSTX-02).
Conflict of interest
The authors declare that the research was conducted in the absence of any commercial or financial relationships that could be construed as a potential conflict of interest.
Generative AI statement
The author(s) declare that no Generative AI was used in the creation of this manuscript.
Any alternative text (alt text) provided alongside figures in this article has been generated by Frontiers with the support of artificial intelligence and reasonable efforts have been made to ensure accuracy, including review by the authors wherever possible. If you identify any issues, please contact us.
Publisher’s note
All claims expressed in this article are solely those of the authors and do not necessarily represent those of their affiliated organizations, or those of the publisher, the editors and the reviewers. Any product that may be evaluated in this article, or claim that may be made by its manufacturer, is not guaranteed or endorsed by the publisher.
References
Borghi M., Perez S. L., and Fernie A. R. (2022). Measurement of flower metabolite concentrations using gas chromatography-mass spectrometry and high-performance liquid chromatography-mass spectrometry. Methods Mol. Biol. 2484, 3–12. doi: 10.1007/978-1-0716-2253-7_1
Castaldo L., Lombardi S., Izzo L., and Ritieni A. (2023). Exploring the chemical composition of female zucchini flowers for their possible use as nutraceutical ingredient. Antioxidants (Basel). 12, 2108. doi: 10.3390/antiox12122108
Fang Y. K., Shang Z. M., Sun G. Q., Zhang M. S., Wang G., Xu D. L., et al. (2022). Glucosyloxybenzyl 2-isobutylmalates and phenolic glycosides from the flowers of Bletilla striata. Fitoterapia 160, 105220. doi: 10.1016/j.fitote.2022.105220
Han X., Song Z., Liu J., Zhang Y., Wu M., and Liu H. (2023). Effects of different drying methods on the quality of bletilla striata scented tea. Molecules 28, 2438. doi: 10.3390/molecules28062438
He X., Wang X., and Fang J. (2017). Bletilla striata: Medicinal uses, phytochemistry and pharmacological activities. J. Ethnopharmacol. 195, 20–38. doi: 10.1016/j.jep.2016.11.026
Huang R., Chang Y., Zheng S., Li J., Liu S., and Niu J. (2025). Integrative analysis of the R2R3-MYB gene family revealed that BsMYB36 and BsMYB51 significantly regulate the accumulation of flavonoids in Bletilla striata (Orchidaceae). Plant Physiol. Biochem. 222, 109733. doi: 10.1016/j.plaphy.2025.109733
Li X., Cao J., Zhao H., Jiang G., Liu J., and Yu Y. (2022). Ph5GT silencing alters flower color and flavonoids metabolome profile in petunia. Physiol. Plant 174, e13795. doi: 10.1111/ppl.13795
Li Q., Xu M., Wu F., Guo Z., Yang N., Li L., et al. (2024). Integrated transcriptomics and metabolomics provide insights into the biosynthesis of militarine in the cell suspension culture system of Bletilla striata. Advanced Biotechnol. 2, 25. doi: 10.1007/s44307-024-00032-w
Pei L., Gao Y., Feng L., Zhang Z., Liu N., Yang B., et al. (2023). Phenolic acids and flavonoids play important roles in flower bud differentiation in mikania micrantha: transcriptomics and metabolomics. Int. J. Mol. Sci. 24, 16550. doi: 10.3390/ijms242316550
Penfield S. (2024). Beyond floral initiation: the role of flower bud dormancy in flowering time control of annual plants. J. Exp. Bot. 75, 6056–6062. doi: 10.1093/jxb/erae223
Tremlová B., Mikulášková H. K., Hajduchová K., Jancikova S., Kaczorová D., Zeljković S. Ć., et al. (2021). Influence of technological maturity on the secondary metabolites of hemp concentrate (Cannabis sativa L.). Foods 10, 1418. doi: 10.3390/foods10061418
Wu Q., Chen Y., Zhu B., Zhou F., Li X., Ye X., et al. (2025). Bletilla striata polysaccharides alleviate ARDS by inhibiting NETs-induced pyroptosis in pulmonary alveolar macrophage through the PAD4 pathway. Int. J. Biol. Macromol. 305. doi: 10.1016/j.ijbiomac.2025.141026
Wu Q., Zhou M., Chen Y., Zhu B., Zhou F., Ye X., et al. (2024). Bletilla striata polysaccharides protect against ARDS by modulating the NLRP3/caspase1/GSDMD and HMGB1/TLR4 signaling pathways to improve pulmonary alveolar macrophage pyroptosis. J. Ethnopharmacol. 319, 117361. doi: 10.1016/j.jep.2023.117361
Xu D., Pan Y., and Chen J. (2019). Chemical constituents, pharmacologic properties, and clinical applications of bletilla striata. Front. Pharmacol. 10. doi: 10.3389/fphar.2019.01168
Xu S., Zhang Y., Liang F., Jiang S., Niu S., Wang X., et al. (2024). Metabolomic and transcriptomic analyses reveal the mechanism of polysaccharide and secondary metabolite biosynthesis in Bletilla striata tubers in response to shading. Int. J. Biol. Macromol. 279, 135545. doi: 10.1016/j.ijbiomac.2024.135545
Yang B., Mustafa G., Zhong Z., Wang T., and Zhang L. (2019). Integrative omics of Lonicera japonica Thunb. Flower development unravels molecular changes regulating secondary metabolites. J. Proteomics. 208, 103470. doi: 10.1016/j.jprot.2019.103470
Zhang M., Shao Q., Xu E., Wang Z., Wang Z., and Yin L. (2019). Bletilla striata: a review of seedling propagation and cultivation modes. Physiol. Mol. Biol. Plants. 25, 601–609. doi: 10.1007/s12298-019-00644-w
Zhang J. X., Yang L. L., Liu H., Luo M., Song Z. Q., and Wu M. K. (2022). A new bletilla striata cultivar ‘Guiji 1’. Acta Hortic. Sin. 49, 203–204. doi: 10.16420/j.issn.0513-353x.2021-1182
Zhu Z., Liang T., Dai G., Zheng J., Dong J., Xia C., et al. (2023). Extraction, structural-activity relationships, bioactivities, and application prospects of Bletilla striata polysaccharides as ingredients for functional products: A review. Int. J. Biol. Macromol. 245, 125407. doi: 10.1016/j.ijbiomac.2023.125407
Keywords: Bletilla striata flower, gas chromatography-mass spectrometry (GC-MS), liquid chromatography-mass spectrometry (LC-MS), volatile compounds, secondary metabolites
Citation: Yang L, Han X, Liu H, Chen Y, Wu M and Tan L (2025) Effects of different flowering stages on secondary metabolites in Bletilla striata flowers analyzed by GC-MS and LC-MS. Front. Ecol. Evol. 13:1617009. doi: 10.3389/fevo.2025.1617009
Received: 23 April 2025; Accepted: 06 October 2025;
Published: 30 October 2025.
Edited by:
Anne Marie Cortesero, University of Rennes 1, FranceReviewed by:
Mokhtar Abdulsattar Arif, Ministry of Agriculture, IraqDelin Xu, Zunyi Medical University, China
Copyright © 2025 Yang, Han, Liu, Chen, Wu and Tan. This is an open-access article distributed under the terms of the Creative Commons Attribution License (CC BY). The use, distribution or reproduction in other forums is permitted, provided the original author(s) and the copyright owner(s) are credited and that the original publication in this journal is cited, in accordance with accepted academic practice. No use, distribution or reproduction is permitted which does not comply with these terms.
*Correspondence: Mingkai Wu, Ynl3bWsxOTk5QDE2My5jb20=; Longyan Tan, bHl0YW4xOTgyQDEyNi5jb20=