 Luã Aleff de Paula Silva
 Fernanda Michalski
 Darren Norris
- 1Coordenação de Ciências Ambientais, Universidade Federal do Amapá, Macapá, Brazil
- 2Programa de Pós-Graduação em Biodiversidade Tropical, Universidade Federal do Amapá, Macapá, Brazil
- 3Laboratório de Ecologia e Conservação de Vertebrados, Universidade Federal do Amapá, Macapá, Brazil
- 4Instituto Pró-Carnívoros, Atibaia, São Paulo, Brazil
Introduction: Spatial prioritization is essential for conservation strategies seeking to reverse population losses among Amazonian freshwater turtles, including the yellow-spotted river turtle (Podocnemis unifilis). Nesting areas represent critical habitats for populations of this species. Broad-scale assessments may, however, fail to detect anthropogenic threats to nesting areas. Therefore, acquiring local-scale data is crucial for accurately identifying these threats and subsequently informing effective, site-specific conservation and restoration measures.
Methods: We assessed the vulnerability of P. unifilis nesting areas (n = 275) along 197 km of rivers in equatorial Brazilian Amazonia across a gradient of anthropogenic impacts. We adopted a multiscale approach that included variables associated with anthropogenic impacts and land cover change. We quantified vulnerability at three spatial scales (nesting area, 5 km river reaches, and ~50 km zones) by analyzing a combination of field and remote sensing data on nesting area size, land cover change, and anthropogenic threats. A multifactorial vulnerability index was calculated based on the variables analyzed. We then used this index to map nesting area vulnerability at different spatial scales. We then explored the main drivers associated with vulnerability through hierarchical-clustering-on-principal-components, which identified six clusters.
Results: The most vulnerable nesting areas were in the downstream locations close to a town and hydroelectric dam. We found that 14 nesting areas (1.4% of the overall area) had very high vulnerability, while most nesting areas (206) had very low vulnerability.
Discussion: We established conservation priorities based on a combination of nesting area size, location, and vulnerability. Our results can help inform conservation and restoration actions for P. unifilis. The approach could be useful to generate similar assessments across the species pan-Amazonian range.
1 Introduction
The Amazon Basin is home to diverse freshwater turtle species (Buhlmann et al., 2009), which face ever-increasing anthropogenic pressures, including overexploitation, deforestation, urbanization, and hydroelectric dams (Bárcenas-García et al., 2021; Fagundes et al., 2021, 2018; Johns, 1987; Smith, 1979). The yellow-spotted river turtle, Podocnemis unifilis, Troschel, 1848 is one of the most widely distributed and abundant Amazonian turtles (TTWG, 2021); however, its populations have declined significantly in recent decades due to overexploitation and habitat loss (Escalona et al., in press, Páez et al., 2015; TTWG, 2021). A modeling analysis of P. unifilis populations predicted severe (≥50%) and rapid (<50 years) future losses across 60% (5.3 M km2) of its pan-Amazonian range (Norris et al., 2019). It is currently assessed as Vulnerable (A1acd) by the IUCN Red List (TFTSG, 1996), pending publication of the most recent assessment of Vulnerable (A2cd+4bcd) (Escalona et al., in press)
Effective nesting area protection is essential for the integrated conservation management of P. unifilis and, likely other, Amazonian freshwater turtles (Andrade et al., 2022; Norris et al., 2019; Páez et al., 2015). Nest site selection is crucial for the fitness of P. unifilis, influencing egg-hatching success, hatchling development, and population demography (Refsnider and Janzen, 2010; Escalona et al., 2009; Iverson, 1991; Norris et al., 2019). Although predominantly aquatic, P. unifilis lay their eggs on land close to the water’s edge (Thorbjarnarson et al., 1993). These terrestrial nesting areas are susceptible to anthropogenic threats (Fagundes et al., 2021; Steen et al., 2012), and are prone to habitat degradation and fragmentation due to the close associations with human needs and resource use (Leal et al., 2016; Paula et al., 2018). Furthermore, the spatial and temporal predictability of nesting facilitates exploitation, with females and their eggs targeted during the nesting season (Pezzuti et al., 2010; Norris and Michalski, 2013; Smith, 1979). Nesting areas can, therefore, represent an evolutionary trap for P. unifilis (Quintana et al., 2019). The environmental cues females use to select nesting areas do not account for human-induced threats, which in turn makes populations vulnerable to overexploitation (Quintana et al., 2019; Fagundes et al., 2021).
Assessing the vulnerability of nesting areas is necessary to develop more effective conservation strategies for Amazonian turtles including P. unifilis (Fagundes et al., 2021). Vulnerability is the degree to which a system, subsystem, or system component is likely to experience harm due to exposure to a hazard, either a perturbation or stressor (Turner et al., 2003). Spatial analysis of species occurrence and/or habitat use helps to identify areas that are most vulnerable to anthropogenic activities (Kukkala and Moilanen, 2013; Ippolito et al., 2010). This is often used in the risk-hazard model, where the vulnerability component called exposure is frequently evaluated to quantify the overlap between the variable of interest and hazards/threats (Auber et al., 2022; Ippolito et al., 2010). Predictions can then be made to estimate the degree to which vulnerable areas are likely to change when exposed to multiple threats to inform management and conservation actions (Turner et al., 2003; Ippolito et al., 2010). By identifying critical habitats and factors contributing to vulnerability, conservationists can prioritize areas for protection and restoration efforts to prevent local extinction and facilitate the recovery of impacted populations (Norris et al., 2019).
Remote sensing has been used to identify and map freshwater turtle nesting area vulnerability in the Brazilian Amazon (Fagundes et al., 2021). While such broad-scale assessments provide much relevant information, more local scale data is needed to generate insight at the level of river basins (Ippolito et al., 2010). This is especially true for P. unifilis, which uses nesting areas that can be too small and/or too close to canopy forests to be detected by remote sensing (D. Norris pers. obs.). Local-scale information is therefore necessary to develop more effective management plans for riparian habitats and other important areas for turtle nesting, as well as mitigation or compensation measures for environmental impacts.
Here we use data on P. unifilis nesting areas upstream of a recently operational hydroelectric dam to assess their vulnerability to anthropogenic activities. We asked (a) what is the level of nesting area vulnerability, (b) which variables determine nesting area vulnerability, and (c) where should different conservation strategies be prioritized?
2 Materials and methods
2.1 Study area
This study was conducted in the Araguari River basin, in the central region of the Brazilian state of Amapá (Figure 1). The study area is part of the eastern Amazon Guianan forests (Ter Steege et al., 2001). The Araguari basin comprises “clear water” rivers, i.e., rivers with lower dissolved sediment and ion loads (Junk et al., 2015). The region’s climate is humid tropical [“Am” Tropical monsoon (Kottek et al., 2006)], with a dry season from September to November (<150 mm of monthly rain) and a rainy season (>300 mm of monthly rain) from February to April (Supplementary Figure S1).
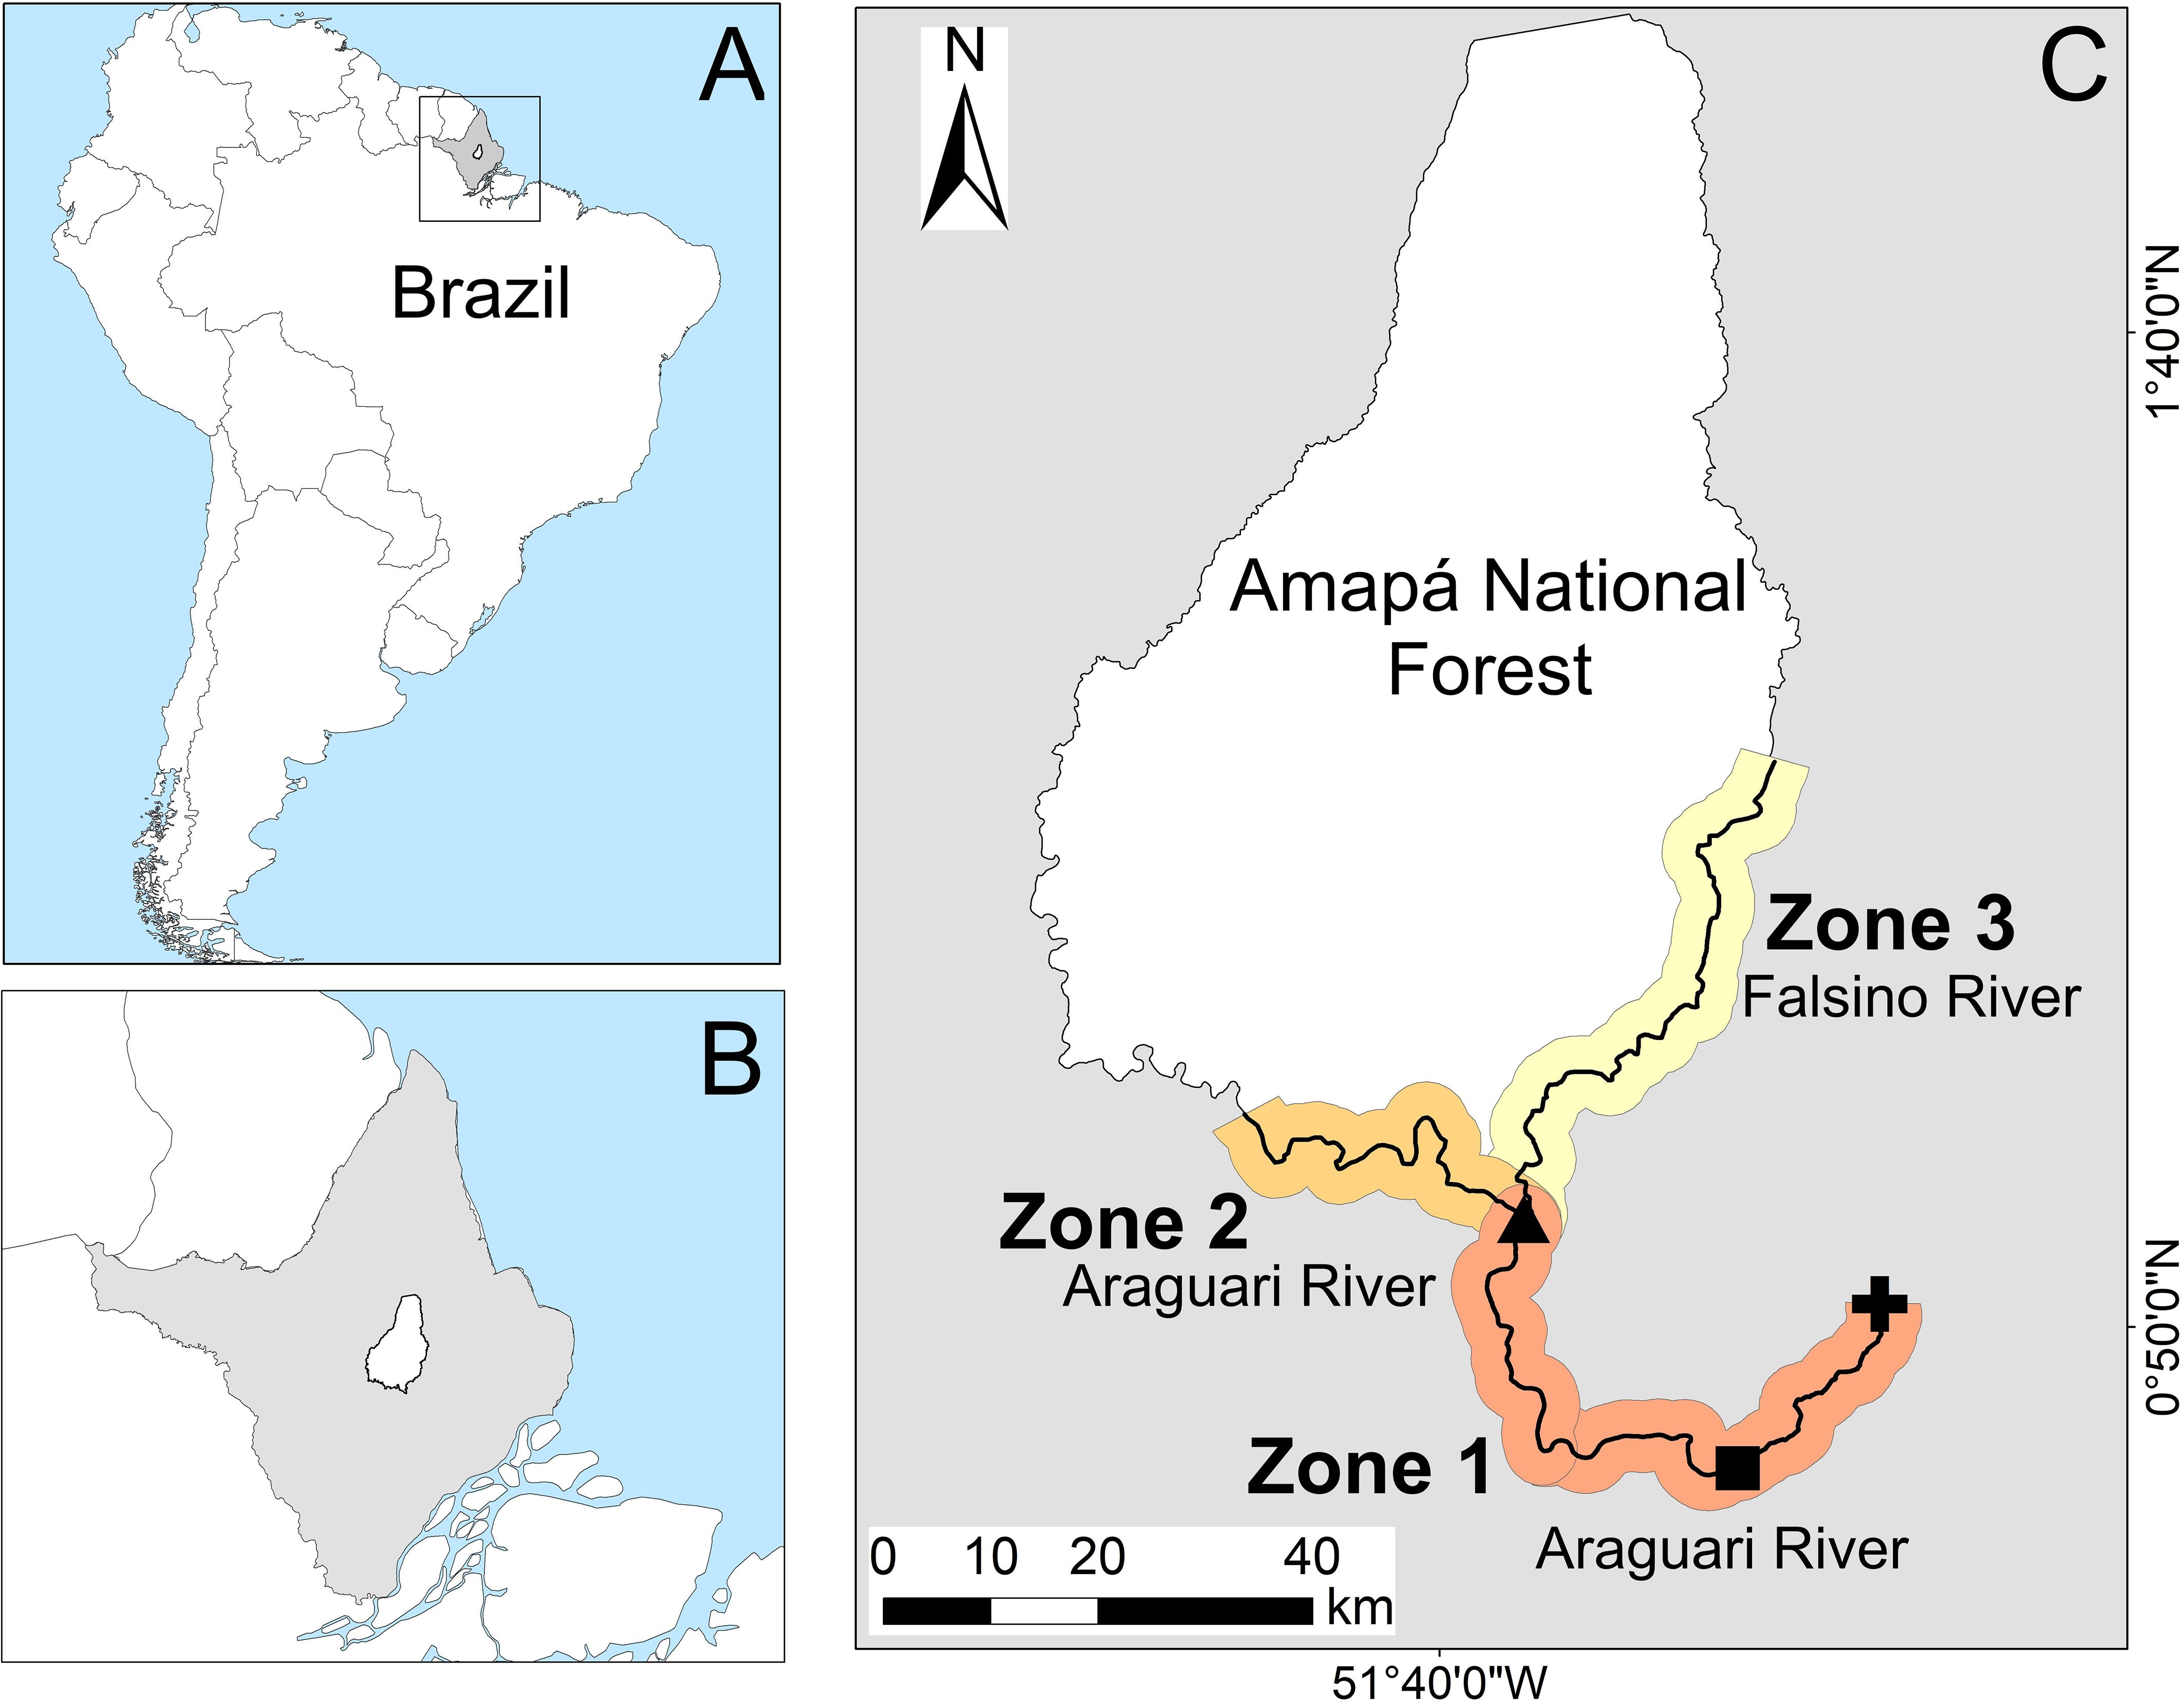
Figure 1. Location of the study area in the equatorial eastern Amazon. The small insets show (A) the location of Amapá state in Brazil/South America and (B) the location of FLONA in Amapá state. (C) Polygon of the Amapá National Forest (FLONA) showing the sampling area and its division into three zones (see Material and Methods for zone definition) along the Araguari and Falsino rivers, showing the Cachoeira Caldeirão dam (black cross), the FLONA headquarters (black triangle) and the town of Porto Grande (black square). Figure adapted from de Oliveira et al. (2015).
We assessed the vulnerability of nesting areas to anthropogenic activities along 197 km of rivers upstream of the Cachoeira Caldeirão dam (Figure 1). This encompassed an area starting 12 km upstream from the dam, continuing upstream to the town of Porto Grande and then to relatively remote stretches of the Falsino River bordering the Amapá National Forest (hereafter FLONA), where commercial activities are prohibited. Amapá is the state with the lowest deforestation rate within the Brazilian Amazonia (INPE, 2024). Localized deforestation extends approximately 50 km upstream from Porto Grande. However, the majority of surveyed rivers remain bordered by continuous primary forest i.e.< 5% forest loss from 2000 to 2020 within 10 km of the rivers (Hansen et al., 2013). The riverbanks are generally elevated, so that forests close to the margin (e.g., within 110–554 m) are never flooded (Caron et al., 2021).
2.2 Nesting areas
Nesting areas were located along the 197 km sampling area from 2016 to 2019 after the Cachoeira Caldeirão dam became operational in 2016. Areas suitable for turtle nesting were identified based on the following features: areas >1 m2, with exposed sand/gravel substrates, raised above river level, without being waterlogged to a depth of 15 cm. Here we consider nesting areas as those where at least one P. unifilis nest was identified in 2016, 2017 or 2018. Full details of nesting area surveys are presented in previous studies (Bárcenas-García et al., 2022; Norris et al., 2018; Quintana et al., 2019).
2.3 Vulnerability of nesting areas
We defined eight variables representing anthropogenic threats to nesting areas (Table 1): riverine commercial activities (fishing, gravel extraction), distance to the nearest town, distance to the nearest hydroelectric dam, distance to the nearest house, proportion of recent natural forest loss (2000-2021) and natural forest cover (2021) within 500-m and 10-km radii. These variables were chosen based on known threats to Amazonian freshwater turtles and their nesting areas (Bárcenas-García et al., 2022; Norris and Michalski, 2013; Conway-Gomez, 2007; Fagundes et al., 2021, 2018; Castello and Macedo, 2016). The 500-m and 10-km radii were chosen to represent local-scale and broader-scale changes around the nesting areas. The radii values were selected considering that P. unifilis movements appear to be relatively localized to areas of approximately 0.8–5 km2 (Bock et al., 1998; Naveda-Rodríguez et al., 2018; Ponce De Leão et al., 2019). Field data (e.g., location of houses and nesting areas) were only collected upstream of the Cachoeira Caldeirão dam (Bárcenas-García et al., 2022; Quintana et al., 2019).
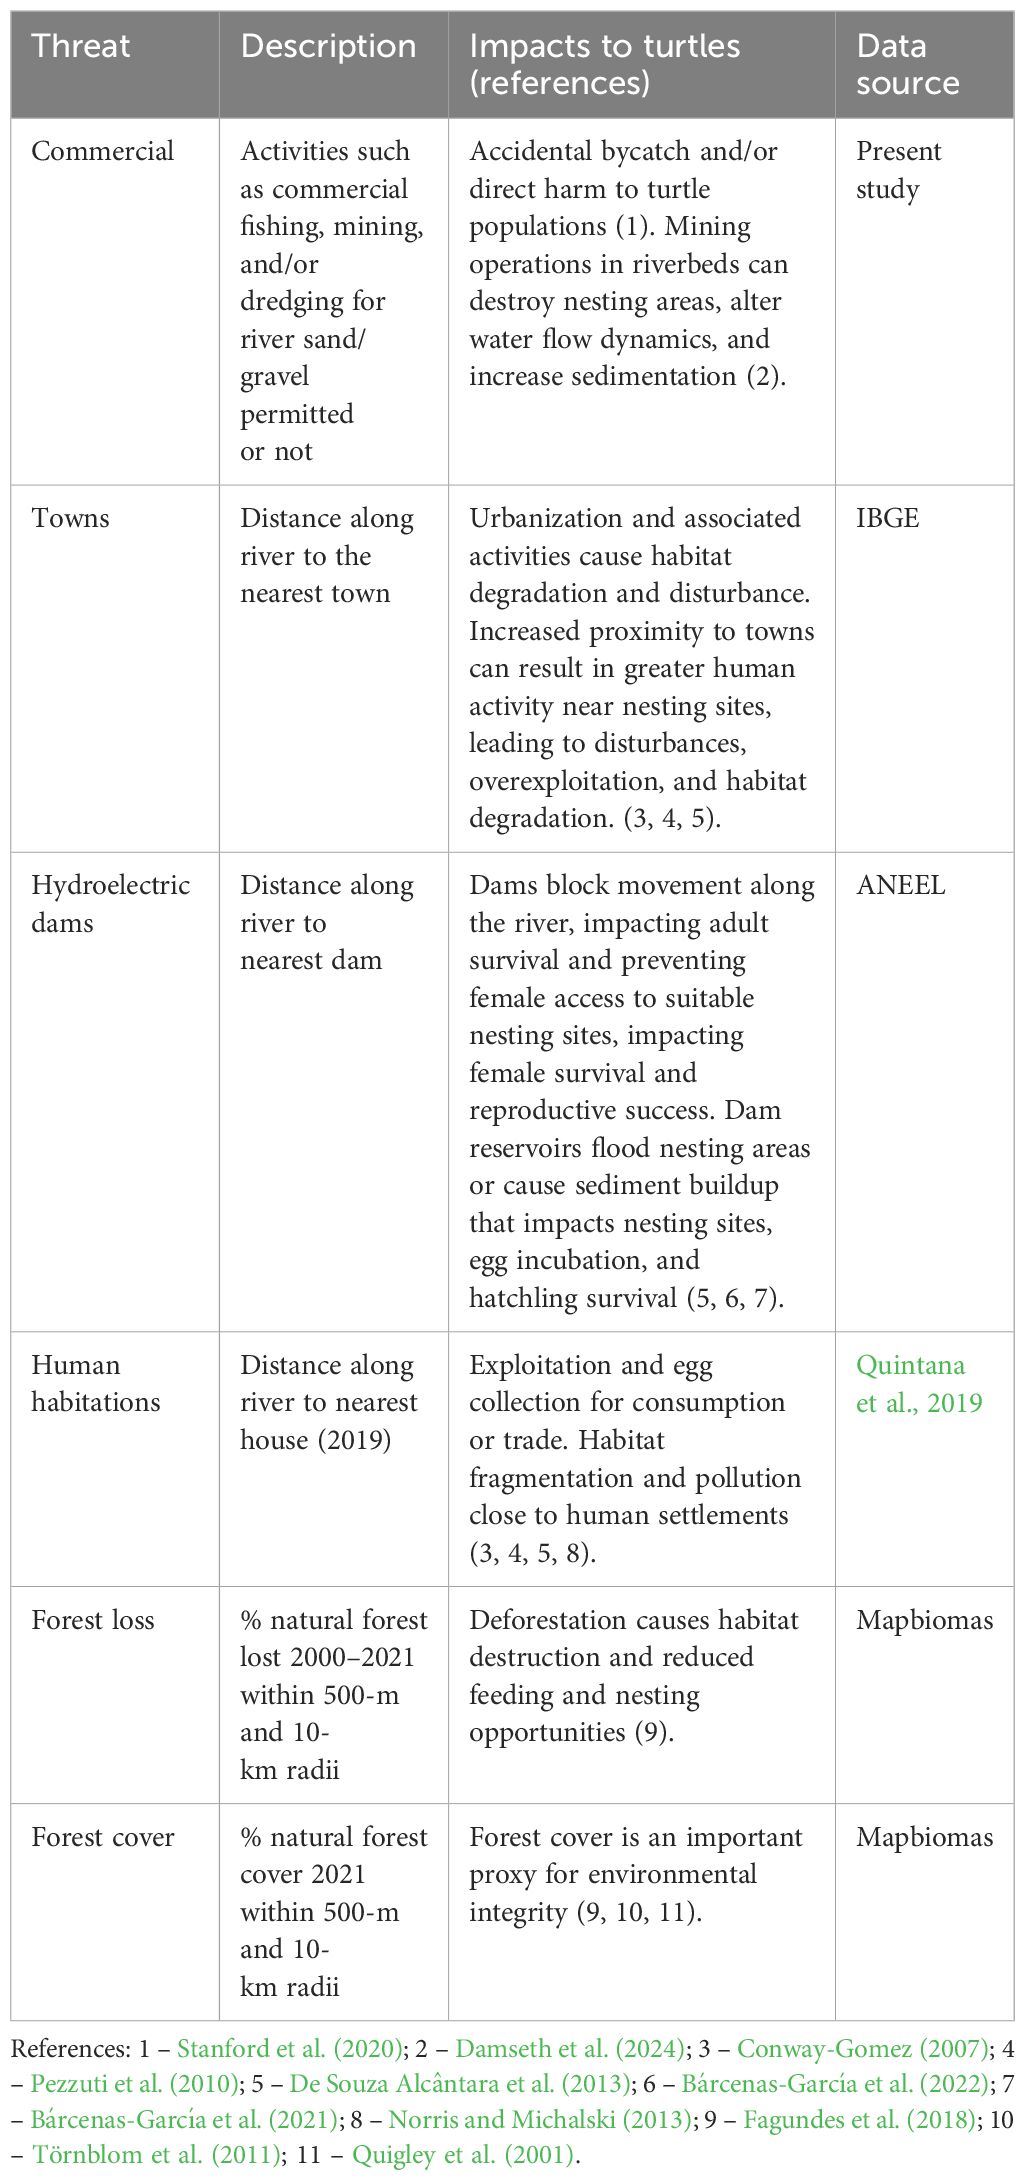
Table 1. Details of the anthropogenic threats to Podocnemis unifilis nesting area vulnerability analyses used in this study.
Distance variables were calculated along the rivers from each nesting area using functions available in the R package “riverdist” (Tyers, 2020). The proportion of recent natural forest loss (2000-2021) and natural forest cover (2021) was calculated around each nesting area using annual land use and land cover classifications provided by Mapbiomas Collection 7 (https://brasil.mapbiomas.org/) derived from 30-m resolution Landsat images (Souza et al., 2020). The proportion of natural forest cover in 2000 and 2021 was calculated within 500-m and 10-km radii around each nesting area using functions available in the R package “landscapemetrics” (Hesselbarth et al., 2019). Forest loss was expressed as the percentage difference in natural forest cover between 2021 and 2000.
2.4 Data analysis
To calculate the vulnerability of P. unifilis nesting areas to human threats, the sampling area was divided into three zones (following de Oliveira et al., 2015): Zone 1, the most downstream area near the Cachoeira Caldeirão dam and the town of Porto Grande to FLONA headquarters (75 km along the Araguari River); Zone 2, 49 km upstream of Zone 1 along the Araguari River from the FLONA headquarters; and Zone 3–74 km upstream from Zone 1 along the Falsino River from the FLONA headquarters (Figure 1). To account for differences in human use and river geomorphology Zones 1 and 3 were further subdivided. Zone 1 was subdivided into 1.1, from Porto Grande town to the Amapari River confluence; and 1.2, from the Amapari River confluence to the FLONA headquarters. Zone 3 was subdivided into 3.1, from the FLONA headquarters to the most upstream human habitation; and 3.2, 42 km upstream of the last human habitation.
We used an index approach to estimate vulnerability (Turner et al., 2003; Auber et al., 2022). In this method, indicators are selected and integrated into an index that depicts the overall vulnerability quantitatively. To calculate nesting area vulnerability we adapted the methodology of Alaniz et al. (2022). The threats were scaled to values between 0 to 1. This rescaling provided a standardized vulnerability scale, so threats contributed equally to the index.
We adopted linear and non-linear relationships to model the vulnerability associated with each of the threat variables (Figure 2; Supplementary File 1). We modeled a non-linear decline in vulnerability with distance to the nearest house and the dam. It was shown previously that 95% of daily fishing activity in the area occurs within 4.5 km of houses (Norris and Michalski, 2013), but impacts can extend to 15 km (Quintana et al., 2019). The impact of the dam was shown to decline non-linearly up to 75 km upstream (Bárcenas-García et al., 2022; Norris et al., 2018, 2020). The maximum distance of a nesting site from the town (94 km) was well within the range of known impacts of urban developments (>1000 km) (Tregidgo et al., 2017), therefore vulnerability was modeled as declining linearly with increasing distance from the town to reflect a gradient in intensity of use by town residents. Regarding landcover change (including deforestation), it has been shown that initial (patch size) and percolation thresholds were detected with 40-60% natural forest cover, i.e., to avoid the effects of forest loss it is necessary to retain at least 70% forest cover (De Filho and Metzger, 2006). Conversely, the persistence of species that need high habitat quality and that did not disperse through the matrix was limited in areas with 40-60% forest cover (De Filho and Metzger, 2006). Here we assumed a non-linear relationship of vulnerability with forest cover, declining to zero above 70% forest cover. Forest loss (change in forest cover between 2000 and 2021) was included as a proxy for recent human activity, assuming a linear decline of vulnerability with increasing forest loss.
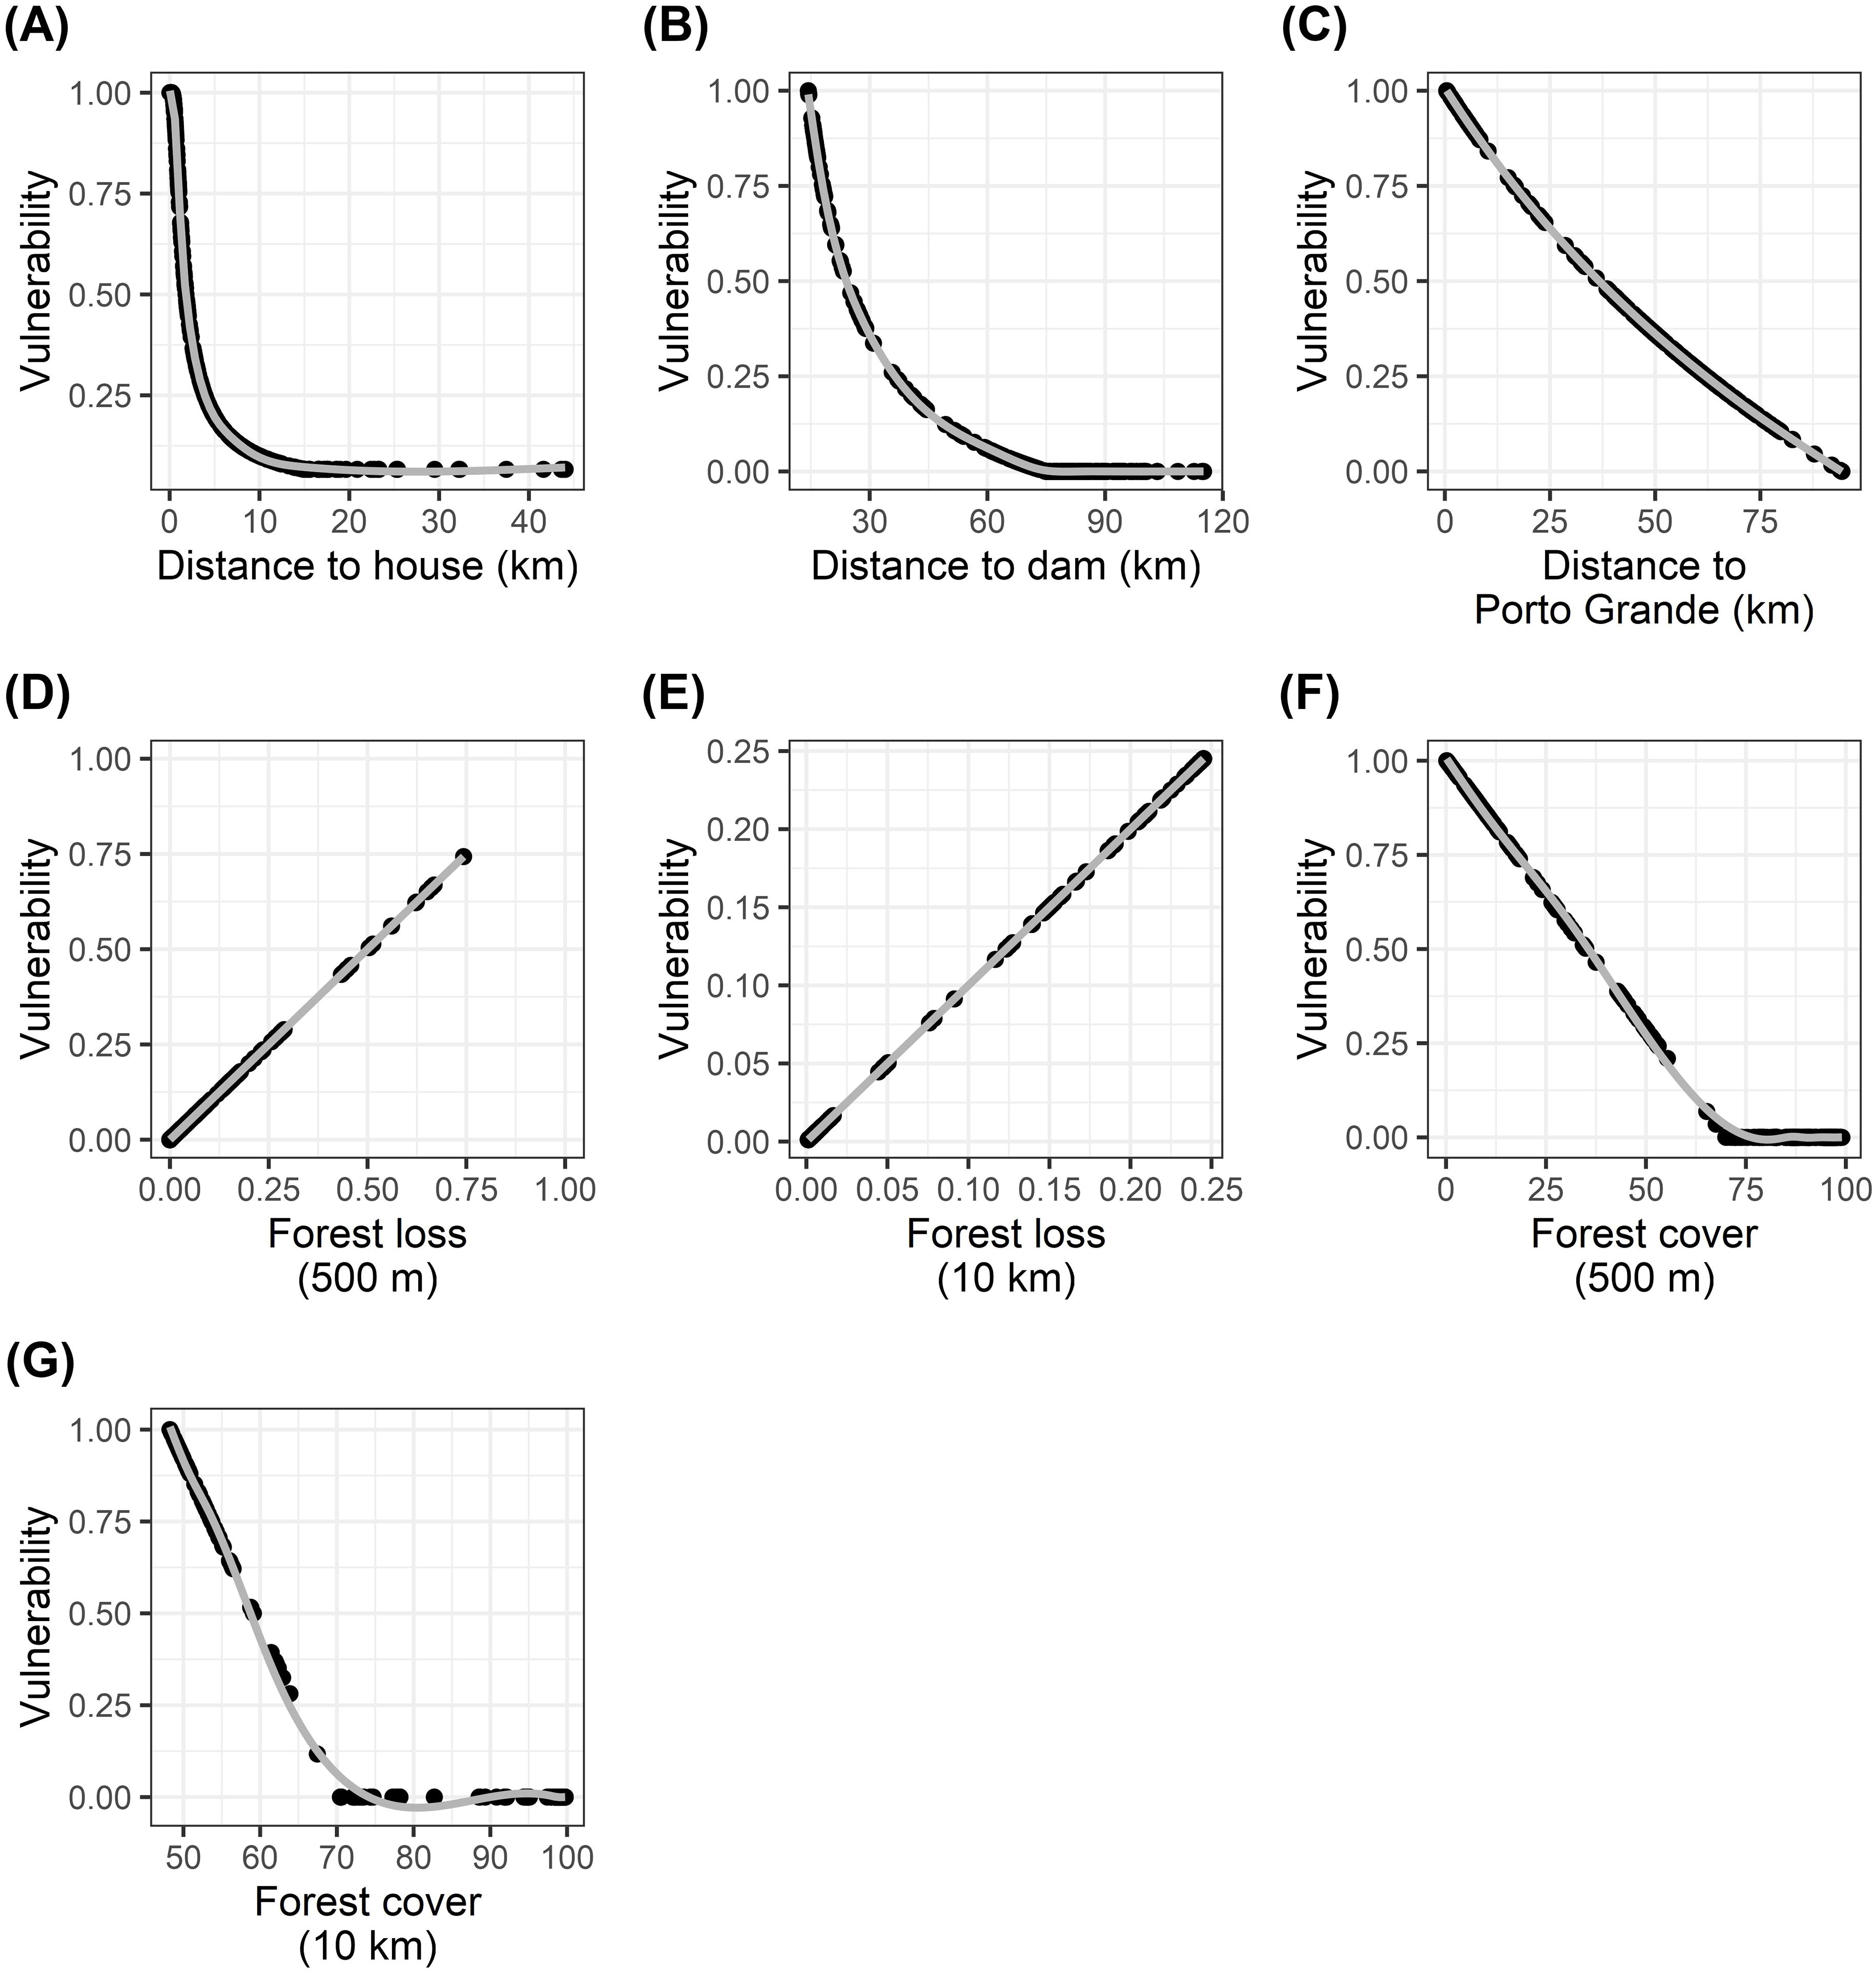
Figure 2. Scaled vulnerability scores of threat variables to Podocnemis unifilis nesting areas. Variables were rescaled to provide a standardized overall vulnerability index calculation. (A): Vulnerability and distance to house. (B): Vulnerability and distance to dam. (C): Vulnerability and distance to town (Porto Grande). Vulnerability and forest loss at (D) 500 meters and (E) 10 kilometers. Vulnerability and forest cover forest cover at (F) 500 meters and (G) 10 kilometers. Linear and non-linear relationships reflect the impacts of the different threats. The lines were obtained from Generalized Additive Models to aid visual interpretation.
An additive approach was then applied to calculate an overall vulnerability index (VI) (Alaniz et al., 2022; Tian et al., 2022) for each nesting area using Equation (1).
Where ni = vulnerability value of the nesting area for each variable (ranging from 0 to 1). VI is then calculated as the sum of ni for the 8 variables, divided by the sum of maximum possible values (8).
The VI was then adjusted to account for the variation in vulnerability values. If there was considerable disparity between the vulnerability values, VI was increased by adding the coefficient of variation of the vulnerability values (vulnerability SD/mean vulnerability), so that beaches with identical vulnerability values received a zero increase, and those with widely divergent values received a relatively higher VI (Pearson correlation coefficient of original and adjusted values, r =0.997). We chose to increase values slightly as populations of the species are likely to be seriously affected by any of the anthropogenic threat variables. This increase reflects the expectation that even in cases where only a few variables have high index values, turtle populations are likely to be increasingly vulnerable. Finally, we reclassified all nesting areas into five levels of vulnerability: very high (>0.5), high (>0.4–0.5), medium (>0.3–0.4), low (>0.2–0.3), and very low (<0.2).
Hierarchical clustering on principal components (HCPC) was used to identify and prioritize vulnerability clusters of nesting areas. HCPC is a well-established technique widely used in ecological and environmental vulnerability analysis (Tian et al., 2022; Wu et al., 2020; Alaniz et al., 2022). It combines principal component analysis (PCA) and hierarchical clustering to explore and group data with complex structures (Husson et al., 2017), and can therefore be used to group locations with similar vulnerability profiles (Alaniz et al., 2022; Tian et al., 2022). HCPC works by first applying PCA to the data to reduce the dimensionality and identify the most important underlying dimensions. PCA transforms a set of correlated variables into a smaller set of uncorrelated variables. It does so by identifying the principal components, which are linear combinations of the original features that capture the maximum variance in the data (Greenacre et al., 2022). Hierarchical clustering is then applied to the principal components to identify clusters of data points that are similar in terms of these dimensions. HCPC was performed using the R (R Core Team, 2020) package ‘FactoMineR’ with default settings (Kukkala and Moilanen, 2013). See Supplementary File 1 for full details on the HCPC approach. We selected this method as PCA is generalizable, enabling the inclusion of multiple variables that may have different correlations depending on the local contexts across the species range. Additionally, the hierarchical structure of the dendrogram can represent the spatial hierarchy of zones and sub-zones along the rivers (Alaniz et al., 2022). The HCPC results were then mapped to prioritize vulnerability and restoration actions.
Priorities for conservation were established based on a combination of nesting area size, vulnerability scores and location. Larger nesting areas being most important as they can be used by a greater number of females. ‘Priority 1’ (highest) was assigned to clusters with large nesting areas, and to areas with the highest vulnerability. ‘Priority 2’ and ‘Priority 3’ were intermediate categories for high vulnerability with small nesting areas or low vulnerability with medium nesting areas. ‘Priority 4’ (lowest) was assigned to clusters with medium/low vulnerability and small/medium nesting areas. Location was implicitly handled by the clustering itself, as the clusters were geographically distinct. A low priority (4) was assigned to the most distant medium sized nesting area class with the lowest vulnerability scores.
Vulnerability was compared among zones using a non-parametric Kruskal-Wallis test as parametric assumptions of normality and homogeneity of variance were not met. This was followed by a pairwise Mann–Whitney test with Bonferroni correction to identify zones with different vulnerabilities.
3 Results
Vulnerability varied substantially across the nesting areas, ranging from 0.01 to 0.81, increasing along an upstream to downstream gradient (Figure 3). Vulnerability varied significantly among zones (Kruskal-Wallis, P< 0.0001). The post-hoc tests indicated that differences were significant among all zones (adjusted P< 0.0001 for all pairwise comparisons).
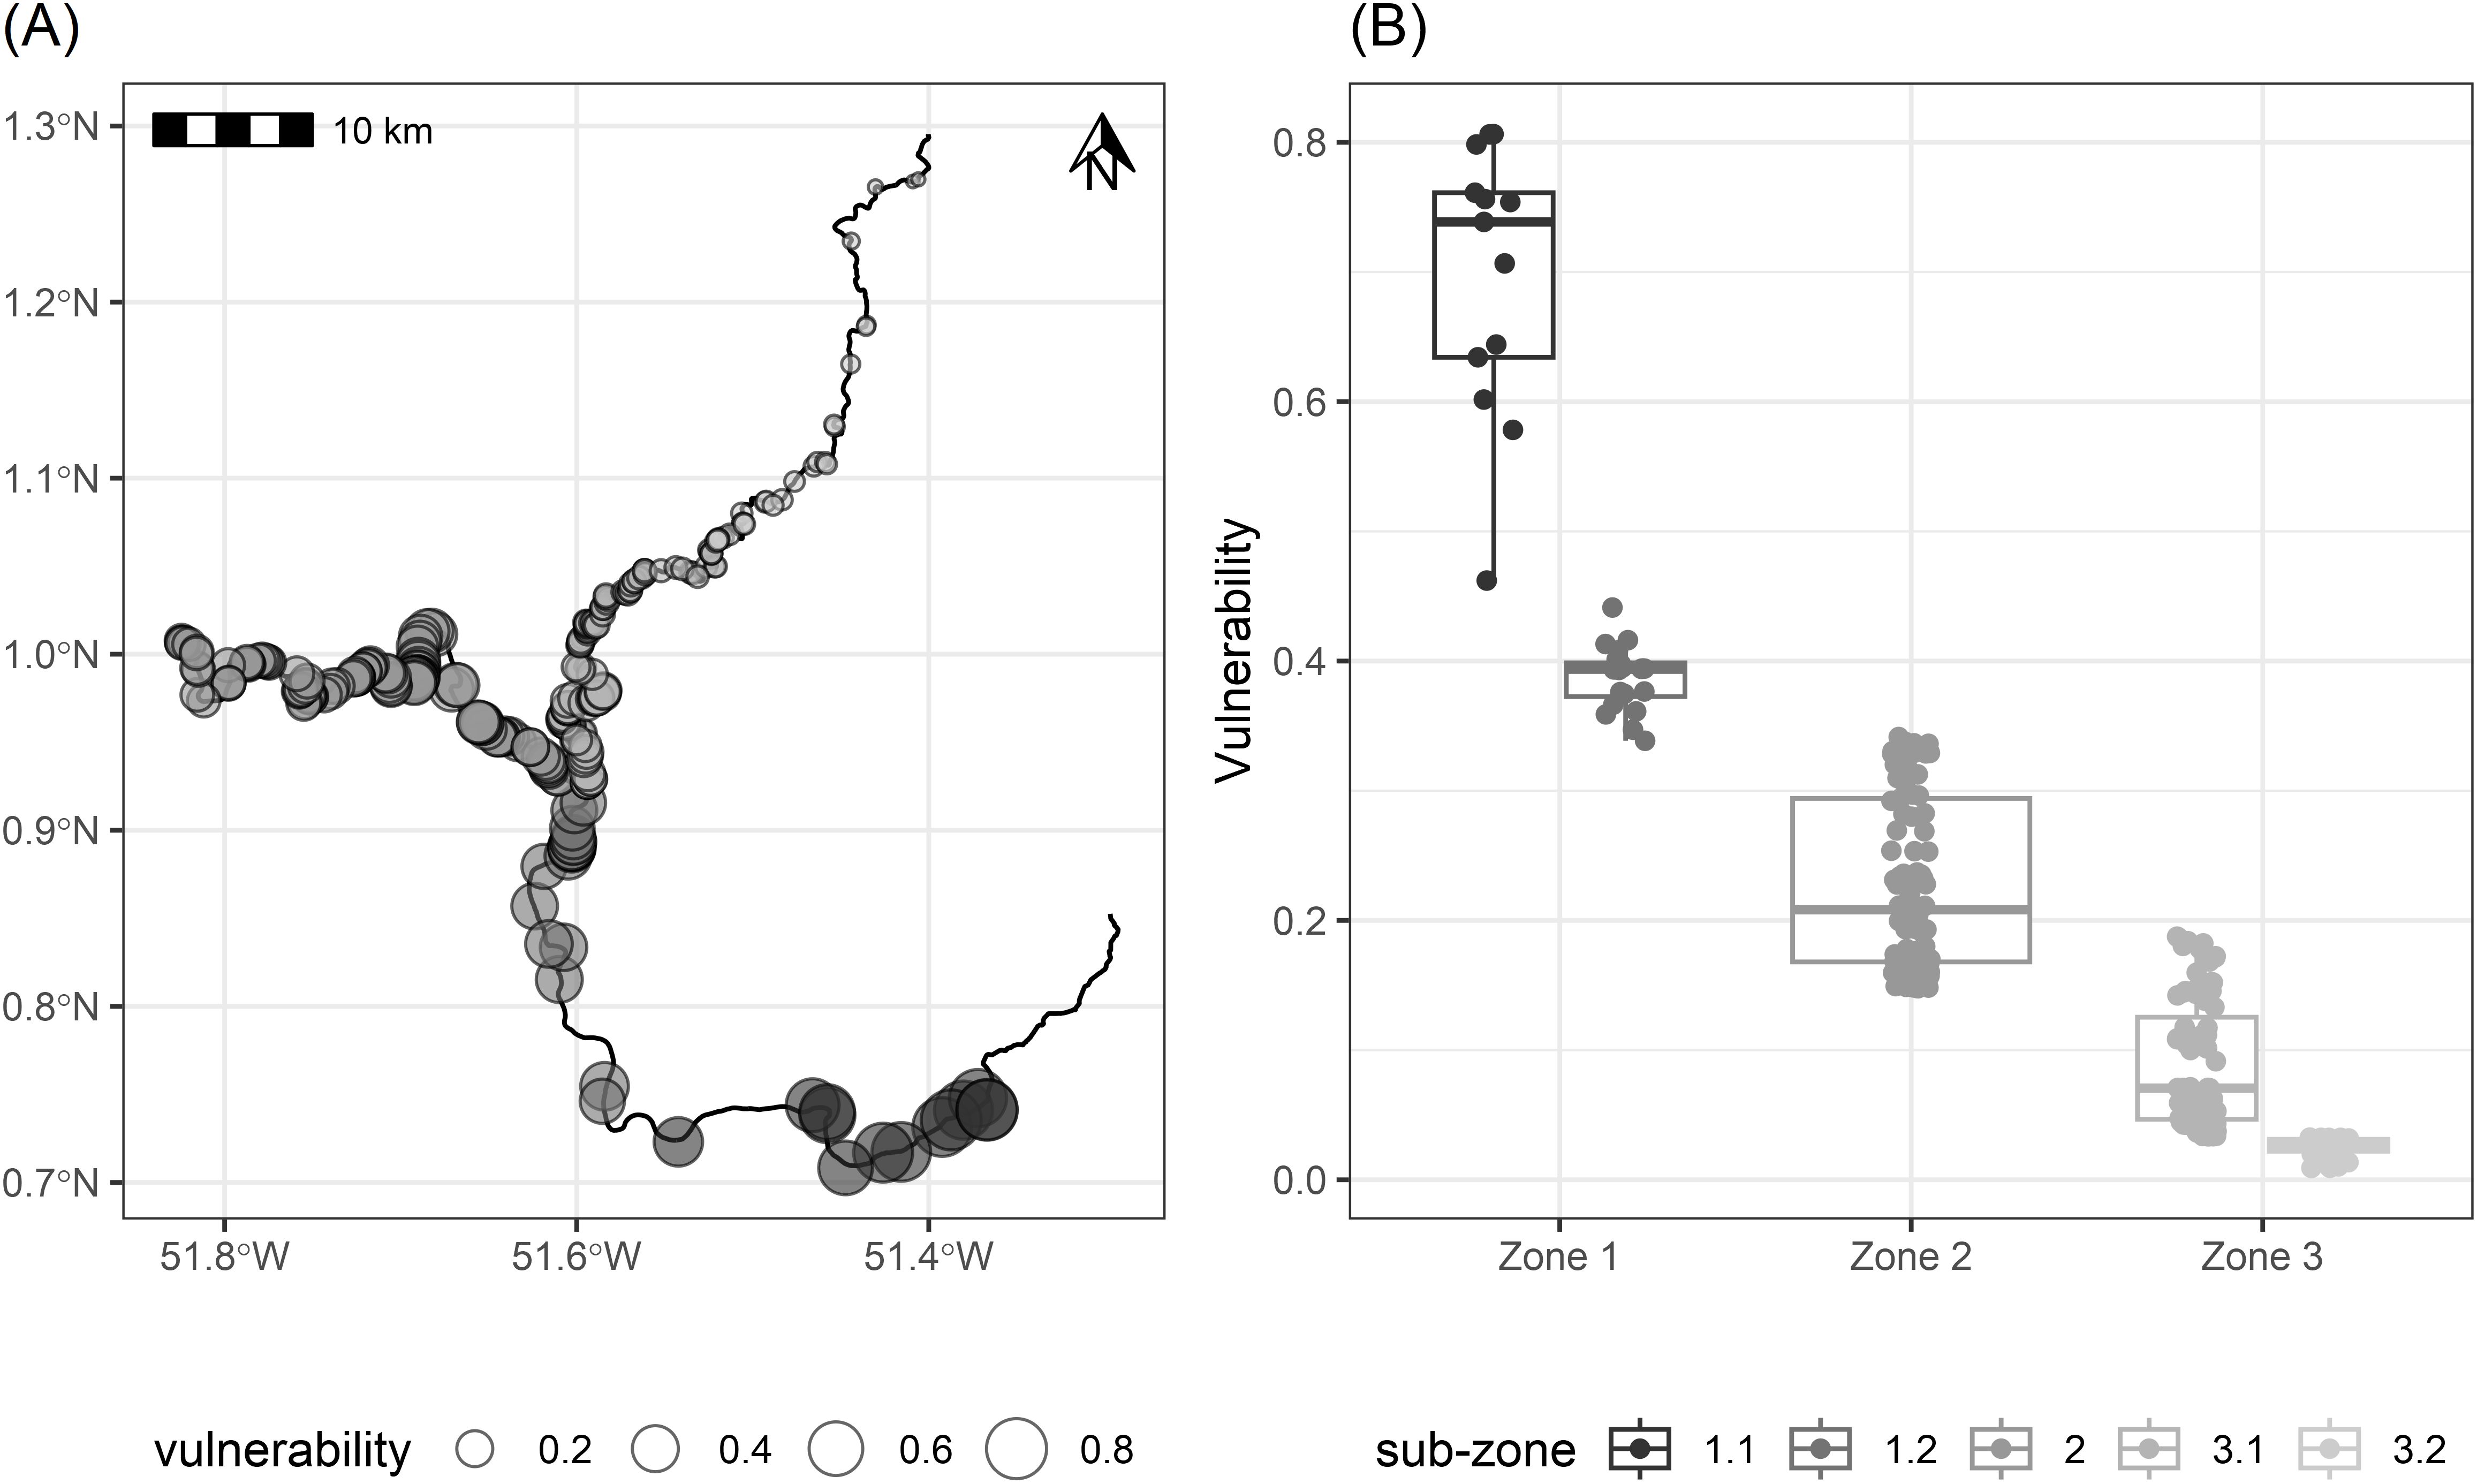
Figure 3. Nesting area vulnerability. (A) Vulnerability index to anthropic threats of mapped nesting areas of Podocnemis unifilis along Araguari and Falsino rivers in Amapá, Brazil; (B) Vulnerability index grouped by zones (1,2,3) and subzones (1.1, 1.2, 3.1, 3.2) within the study area. The horizontal line within the boxes is the mean, the box marks the 95% confidence limits estimated via nonparametric bootstrap.
The differences in vulnerability were associated with different threats among zones (Table 2). The least vulnerable zones were those without commercial activity and further away from houses located along the Falsino River, representing 37% of the overall river length surveyed. Commercial activity and distance to the nearest house were important in determining the difference between Zones 2 and Subzone 3.1, which had similar distances to the town and hydroelectric dam (Table 2). Distance to the nearest house was also relevant to determine the difference in vulnerability between the upstream Subzone 3.2 and the downstream Subzone 3.1 (Table 2).
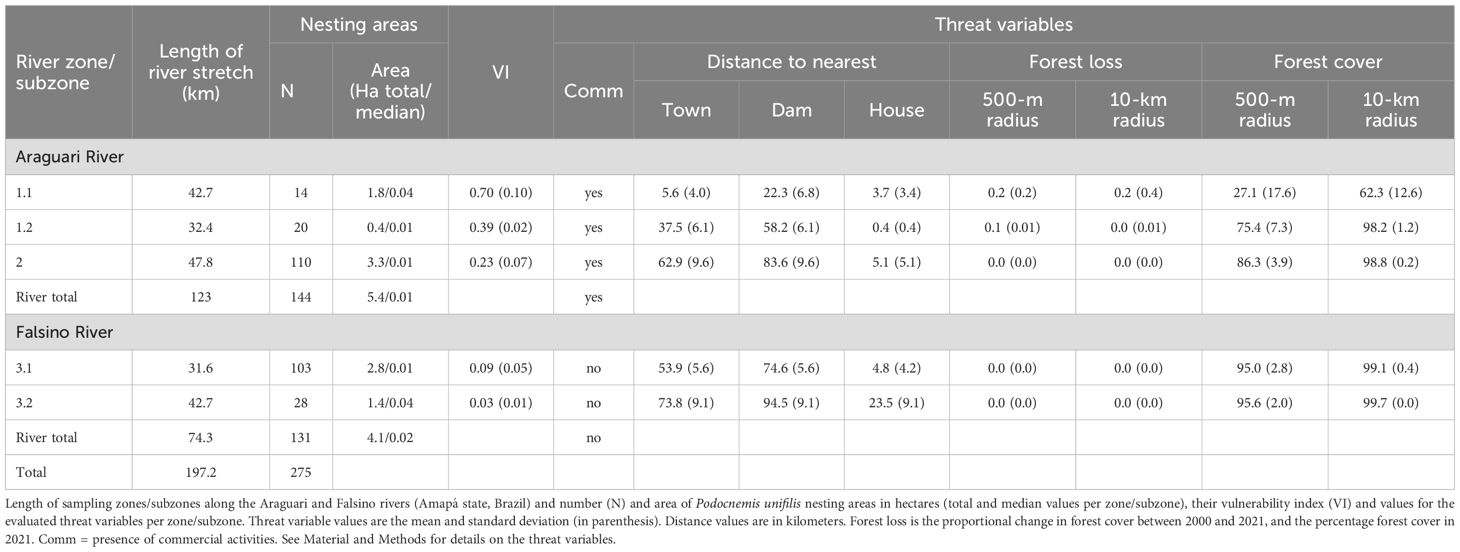
Table 2. Comparison of Podocnemis unifilis nesting area vulnerability.
The first three components of the PCA accounted for 97.4% of the variance in the data (56.8, 24.3, and 16.4% for components 1, 2, and 3, respectively). Commercial activity (r = 0.97) and distance to the nearest house (r = 0.88) were most strongly associated with components 1 and 2, respectively (Supplementary Figures S3.1, S3.2). The only variable that was not strongly correlated with any of the first three components was forest loss in a 500m radius area (r = 0.33, 0.33, and 0.47, respectively). The other five variables were strongly associated with component 3 (r > 0.80).
HCPC identified six clusters that differed in nesting area average size and vulnerability, three of them with high conservation priority (Table 3). The highest priority covered a quarter of the river stretch studied (24.4%, 48.2 km) and was separated into three distinct spatial clusters. Subzones 3.1 and 3.2 were presented mid to large size and low-vulnerability clusters, while large nesting areas with high vulnerability occurred downstream, close to both the town and the dam (Figure 4).
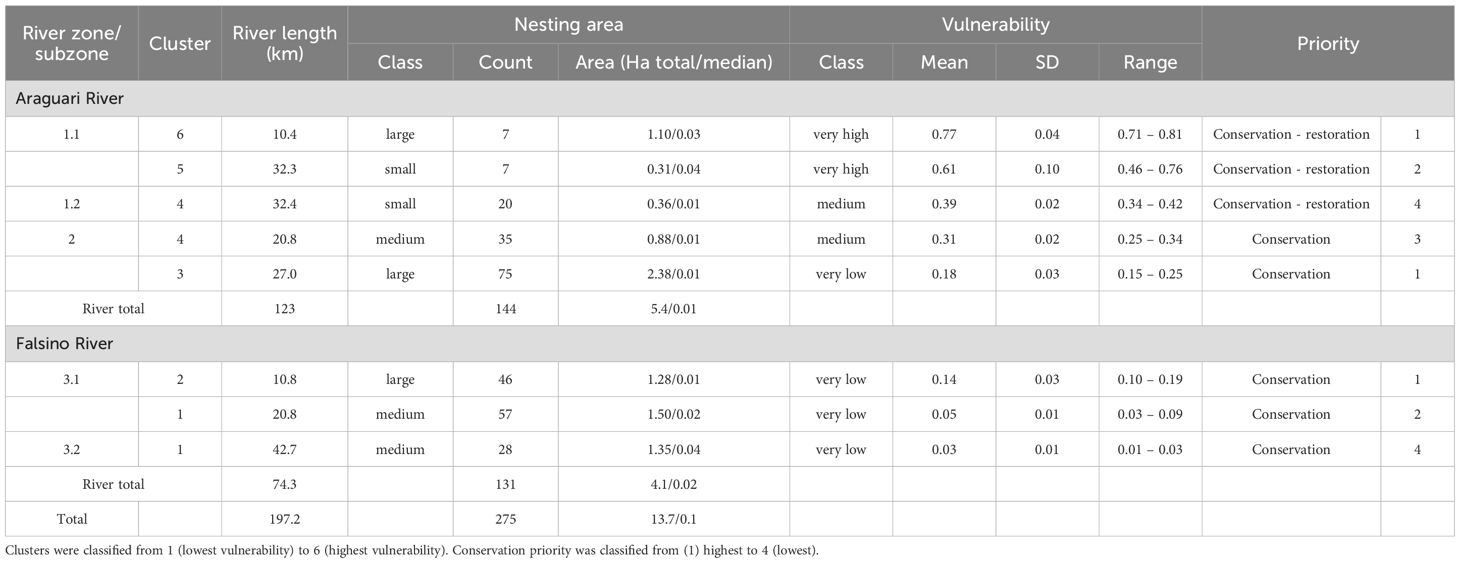
Table 3. Multi-scale variation in Podocnemis unifilis nesting area vulnerability in the zones/subzones of the study area along the Araguari and Falsino rivers (Amapá state, Brazil) and according to six clusters determined by HCPC.
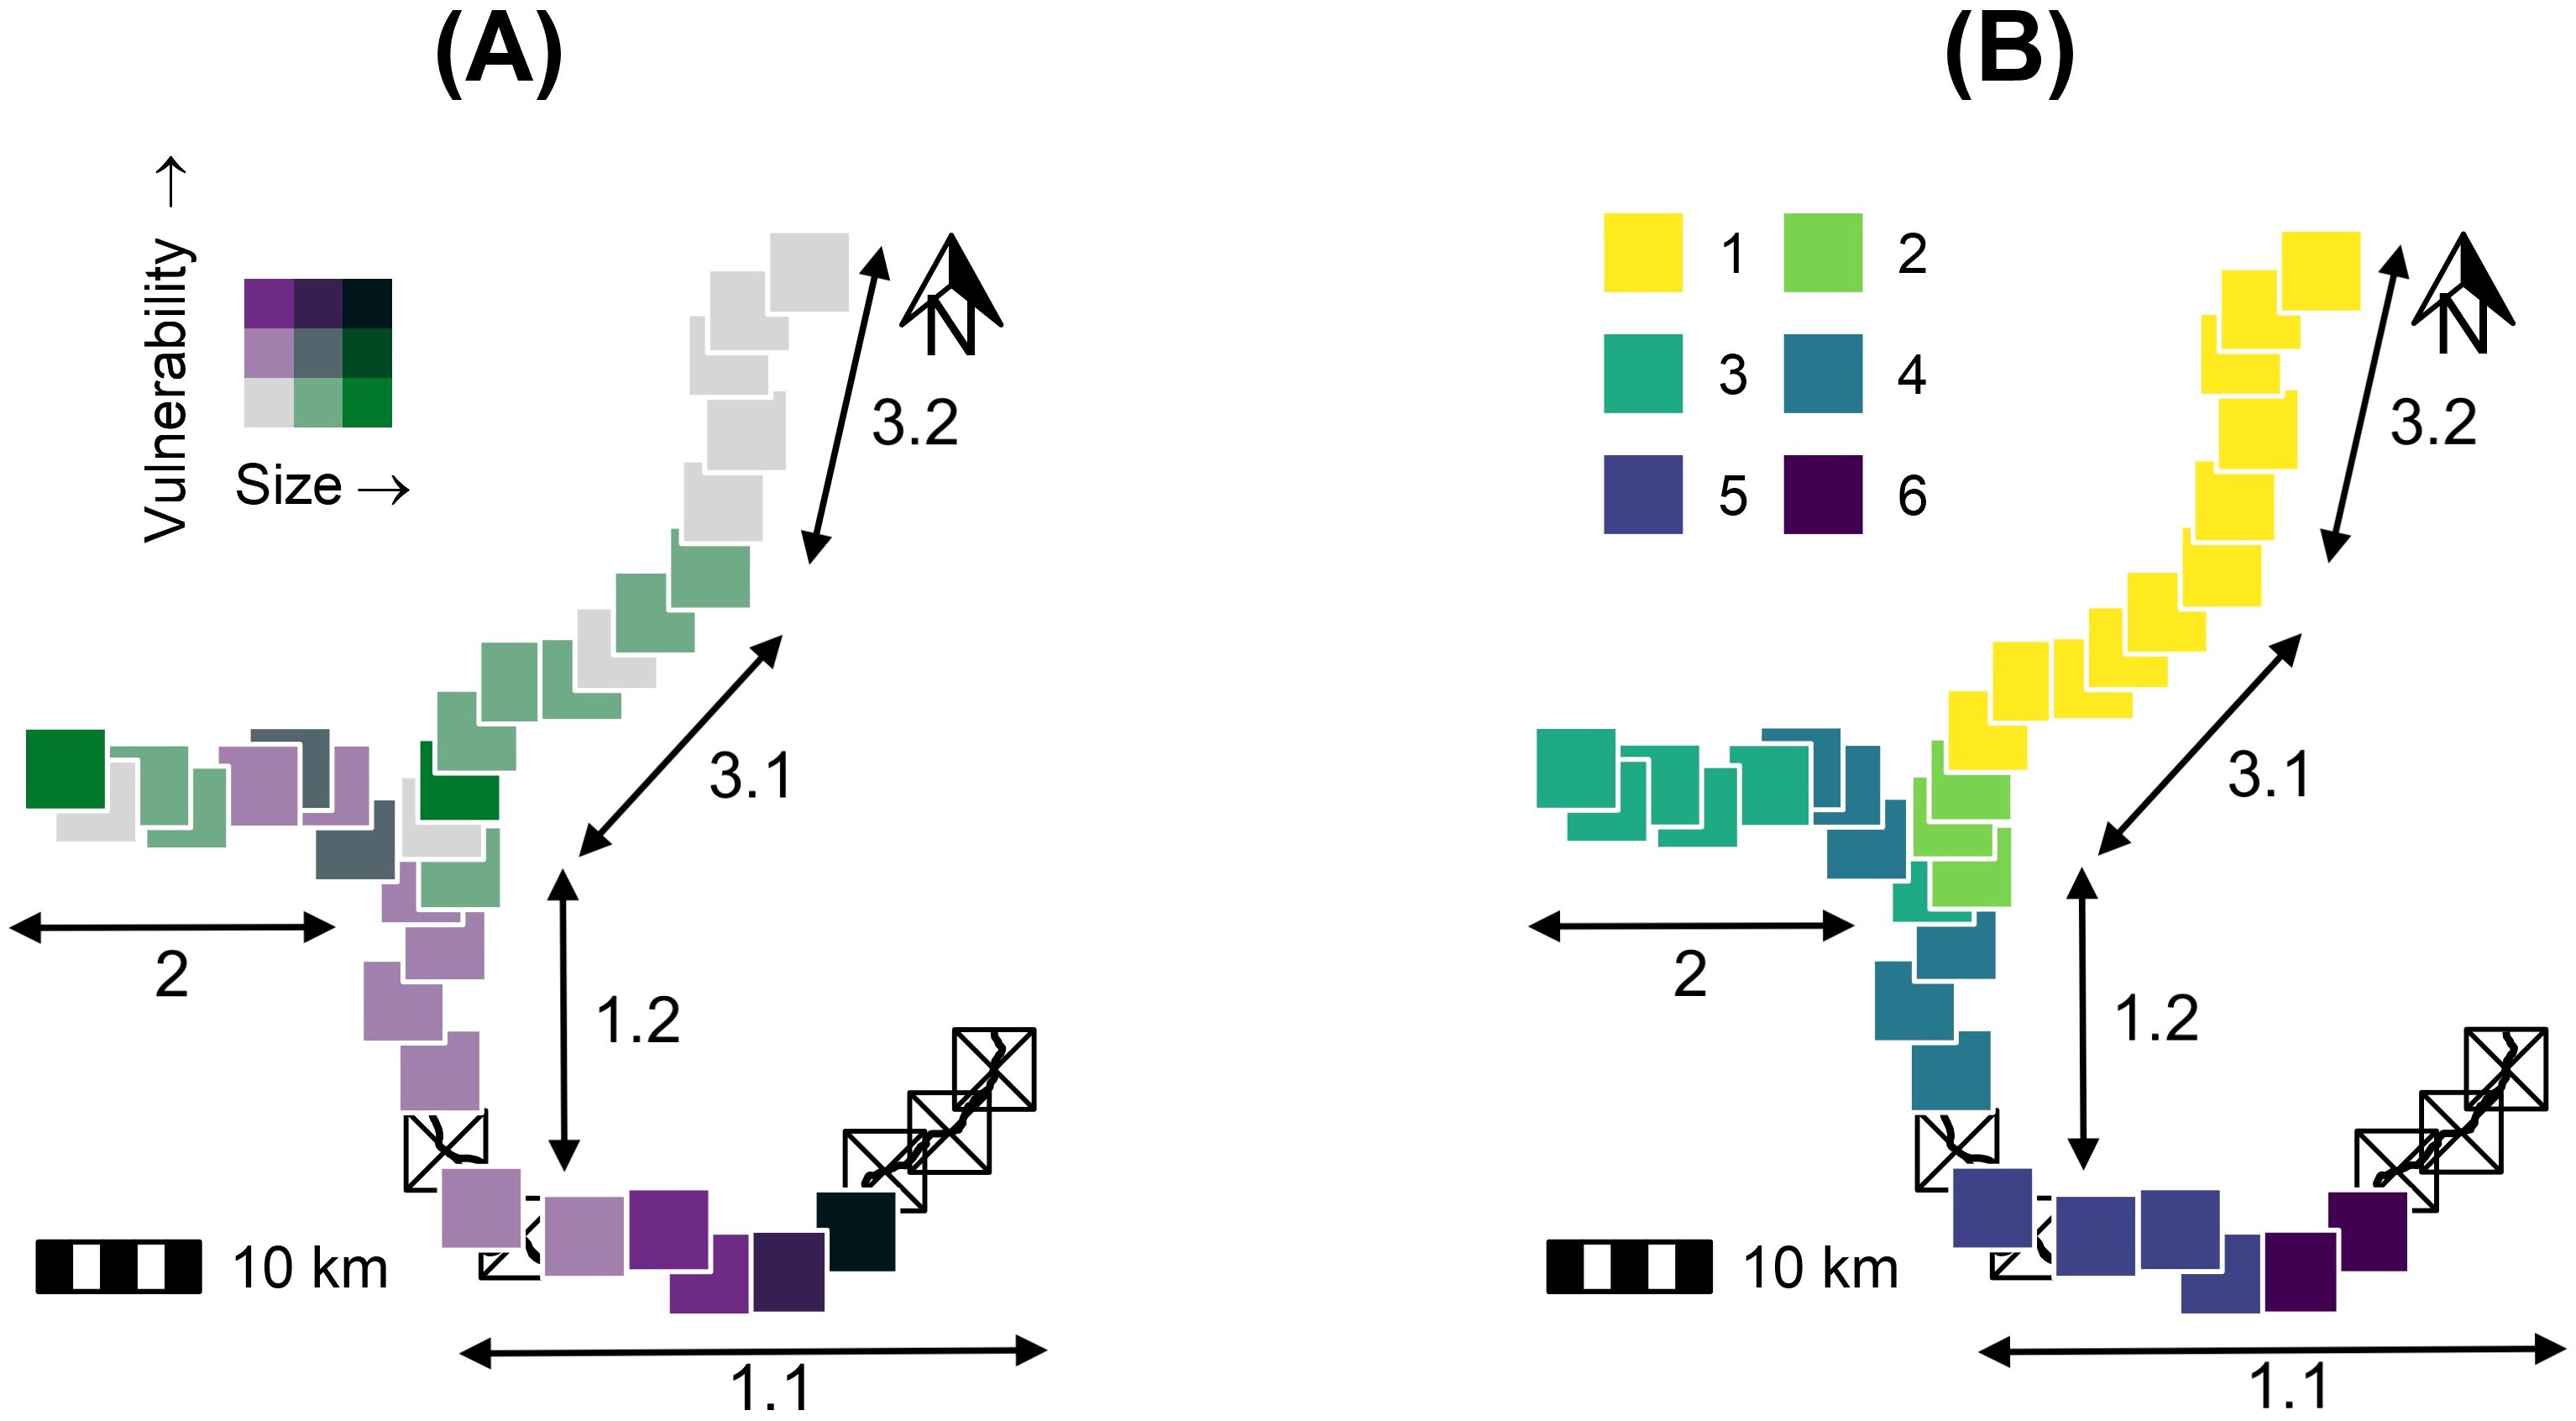
Figure 4. River reach vulnerability. (A) Distribution of Podocnemis unifilis nesting areas along the Araguari and Falsino rivers (Amapá state, Brazil) according to total size of summed nesting areas vs mean vulnerability index in 5-km river reaches (shade increases with area size and vulnerability); and (B) the hierarchical-clustering-on-principal-components classification into six clusters. Crossed-out open squares represent river sections lacking nesting areas. Labels show the locations of river zones (1,2,3) and subzones (1.1, 1.2, 3.1, 3.2) within the study area.
4 Discussion
As expected, there was a clear gradient of nesting area vulnerability relative to anthropic impacts. The proximity to both a town and a hydroelectric dam generated surprisingly high vulnerability immediately upstream for a region with such high environmental protection. Urbanization and hydroelectric dams have numerous, often synergistic, impacts on freshwater turtles (Lovich et al., 2018; Bárcenas-García et al., 2021; Chaves et al., 2021; Conway-Gomez, 2007). The vulnerability gradient we found reflects the well-documented limitations of terrestrial protected areas to adequately conserve aquatic species (Anderson et al., 2019; Nogueira et al., 2021; Mollmann et al., 2022). Indeed, the protected areas in the study region appear to have limited capacity to conserve aquatic species such as turtles (Norris et al., 2018).
Our findings, which identify commercial activity and proximity to human infrastructure such as towns and hydroelectric dams as drivers of nesting area vulnerability, align with a broad consensus in the literature on Amazonian chelonians (Sousa et al., 2024; Fagundes et al., 2021, 2018; TTWG, 2021). While we employed a fine-scale, multi-factor vulnerability index, other research on P. unifilis and its congeners present similar conclusions. Our finding that vulnerability increased near human settlements is explained by empirical results from other regions, which documented unsustainable harvesting of eggs and females as a direct consequence of human proximity and urban demand for turtle meat and eggs (Mayor et al., 2024; Chaves et al., 2021; Conway-Gomez, 2007; Pezzuti et al., 2010). Furthermore, the risks we identified are reflected at an evolutionary scale in population genetic studies of Podocnemis species. Anthropogenic impacts and landscape features, including natural rapids (barriers analogous to dams), can restrict gene flow and are associated with significant population structure, demonstrating the potential long-term consequences of the vulnerability we mapped at a local scale (Dos Santos et al., 2016; Agostini et al., 2024; Cárdenas-Barrantes et al., 2024). Thus, by capturing threats invisible from space our vulnerability predictions complement broader scale assessments (Fagundes et al., 2021, 2018; Sousa et al., 2024).
Commercial activities and proximity to human habitations increased vulnerability both among and within the zones/subzones. Remote sensing provides increasingly fine-scale models of land-use and land-cover change (Pettorelli et al., 2018; Kissling et al., 2018). However, variables such as the presence of commercial activity and distance to the nearest house are still difficult to obtain via remote sensing, as they are almost undetectable (Peres et al., 2006). The relevance of these variables, which were not included in previous remote sensing studies (Fagundes et al., 2021), shows the importance of more detailed field data to inform vulnerability assessments along Amazonian rivers. Although fieldwork-based publications are declining (Ríos-Saldaña et al., 2018), integrating field data to complement remote sensing approaches is vital to generate robust scientific evidence.
By integrating results on nesting area size, vulnerability, and geographic location, it was possible to identify and prioritize conservation and management options. While all high-priority clusters included relatively large nesting areas, recovery and restoration actions are most urgently needed in the most downstream cluster to mitigate losses associated with the dam and the nearby town (Bárcenas-García et al., 2022; Norris et al., 2018). These actions should include the creation of new nesting areas along 15 km of river currently devoid of nesting areas due to flooding by the hydroelectric dam.
Although scientific evidence can inform solutions and actions to conserve vulnerable nesting areas, the greatest challenge is to act and implement them. For example, the hydroelectric power plant operator needs to act to reduce vulnerability and mitigate impacts associated with the dam. Evidence documenting the effects of the hydroelectric dam on nesting areas was presented to the relevant authorities in 2018 (MPAP, 2023). To date, this process is stalled, and neither the state environmental agency nor the company operating the dam has acted to create and/or restore turtle nesting areas. While enforcement actions appear to be ineffective, community-based actions may generate viable alternatives to counteract threats (Andrade et al., 2022; Campos-Silva et al., 2018; Páez et al., 2015).
Community-based management of nesting areas could turn vulnerability into resilience (Norris et al., 2020, 2018). Areas near Porto Grande, for example, are potentially ideal for environmental education and community-based management actions, which have been successful for the conservation of Podocnemis turtles outside of protected areas (Campos-Silva et al., 2018; Rivera et al., 2021; Andrade et al., 2022). Conservation strategies may include buffer zone establishment, community engagement, and sustainable land-use practices to mitigate the impact of human activities (Andrade et al., 2022; Bárcenas-García et al., 2021; Steen et al., 2012; Campos-Silva et al., 2018). More specifically, fishing and gravel extraction could be restricted in zones or subzones with important nesting sites. Buffer zones could also be established around nesting sites to reduce human disturbance.
The index we used is adaptable to local contexts across the species’ range. For example, while we used distance to the nearest house as a proxy for human activity, other variables like distance to settlements or number of residents could better reflect harvest pressure in different areas. Further studies are needed to test and refine the index across the species range, assessing its generalizability and identifying context-specific modifications.
Several caveats should be considered when interpreting our results. First, a more detailed understanding of how anthropogenic impacts affect P. unifilis populations is crucial. Currently, there is a lack of data on adult population dynamics and the effects of threats like deforestation and dams, hindering comprehensive impact assessments (Páez et al., 2015). This information is crucial for the development of effective mitigation or compensation measures in the context of infrastructure projects. Second, grouping continuous values into classes (e.g., low to very high) remains subjective. Future studies should evaluate the sensitivity of vulnerability assessments to these classifications. Third, some of the variables that we included reflected the local context. It may be necessary to include additional variables to adequately reflect the threats in other areas. The inclusion of additional social data would strengthen planning and stakeholder involvement, e.g., reporting wildlife crimes and the participation of local communities in conservation and development programs (Pimid et al., 2022; Bennett et al., 2017; Turner et al., 2003). Finally, we did not use variable weights due to a lack of robust evidence on the relative importance of different threats. The relative importance of different threats could likely depend on factors such as the ecosystem, geographic location, and socio-economic context, among others. Although there is a lack of data for the study region, expert opinion or meta-analyses could provide valuable information to enable a weighted approach in future assessments.
5 Conclusions
Our findings provide evidence of the local scale vulnerability of turtle nesting areas and identify priority clusters for conservation actions. Clusters provided a spatially explicit baseline to inform the choice of priority nesting areas for local scale population studies. Conservation actions should initially be focused on maximizing nesting success by reducing losses due to flooding (Norris et al., 2020) and unsustainable harvest levels (Quintana et al., 2019), and then advance to include environmental education to reduce hunting of adults (Páez et al., 2015). Integrating turtle nesting area assessments in state-wide biodiversity conservation planning could benefit broader conservation strategies for the region’s human well-being, minimizing conflicts between stakeholders.
Data availability statement
Publicly available datasets were analyzed in this study. This data can be found here: Norris, D., Michalski, F. Gibbs, J. P. (2018). Beyond harm’s reach? Submersion of river turtle nesting areas and implications for restoration actions after Amazon hydropower development. Peerj, 6, e4228. doi: 10.7717/peerj.4228 Data: https://doi.org/10.7717/peerj.4228/supp-2 Bárcenas-García, A., Michalski, F., Gibbs, J. P.Norris, D. (2022). Amazonian run-of-river dam reservoir impacts underestimated: Evidence from a before–after control–impact study of freshwater turtle nesting areas. Aquat. Conserv.: Mar. Freshwat. Ecosyst., 32, 508-522. doi: 10.1002/aqc.3775 Data https://onlinelibrary.wiley.com/action/downloadSupplement?doi=10.1002%2Faqc.3775&file=aqc3775-sup-0001-aqc-21-0281-File007.docx.
Ethics statement
Ethical approval was not required for the study involving animals in accordance with the local legislation and institutional requirements because data came from previously published research.
Author contributions
LP: Writing – original draft, Writing – review & editing, Formal Analysis. FM: Investigation, Writing – review & editing, Conceptualization. DN: Writing – original draft, Formal Analysis, Data curation, Methodology, Writing – review & editing, Conceptualization, Investigation, Supervision.
Funding
The author(s) declare that financial support was received for the research and/or publication of this article. This study was funded by The United States National Academy of Sciences and the United States Agency for International Development through the Partnership for Enhanced Research (http://sites.nationalacademies.org/pga/peer/index.htm), award number AID-OAA-A11-00012 to Darren Norris and Fernanda Michalski; Conselho Nacional de Desenvolvimento Científico e Tecnológico, Grant/Award Numbers: 433638/2018-4, 302806/2018-0, 403679/2016-8; and Coordenação de Aperfeiçoamento de Pessoal de Nível Superior, Grant/Award Number: 88882.429990/2019-01.
Acknowledgments
We are grateful to Alvino Pantoja and Gilberto Souza dos Santos for their invaluable assistance during field-work in 2019. We are also grateful to the field assistants, students and volunteers who have helped to collect data during the previous nesting seasons. We would like to thank the Universidade Federal do Amapá and the Instituto Chico Mendes de Conservação da Biodiversidade (ICMBio) for providing logistical support, IBAMA for authorization (IBAMA/SISBIO permit 49632-1) to conduct research around FLONA. We thank editors and reviewers of previous versions for their comments that improved the text.
Conflict of interest
The authors declare that the research was conducted in the absence of any commercial or financial relationships that could be construed as a potential conflict of interest.
The author(s) declared that they were an editorial board member of Frontiers, at the time of submission. This had no impact on the peer review process and the final decision.
Generative AI statement
The author(s) declare that no Generative AI was used in the creation of this manuscript.
Publisher’s note
All claims expressed in this article are solely those of the authors and do not necessarily represent those of their affiliated organizations, or those of the publisher, the editors and the reviewers. Any product that may be evaluated in this article, or claim that may be made by its manufacturer, is not guaranteed or endorsed by the publisher.
Supplementary material
The Supplementary Material for this article can be found online at: https://www.frontiersin.org/articles/10.3389/fevo.2025.1622535/full#supplementary-material
References
Agostini M. A. P., MaChado A. F., Ritter C. D., Félix-Silva D., Pezzuti J. C. B., Andrade P. C. M., et al. (2024). Riverscape features determining the genetic structure of the Yellow-Spotted Amazon River Turtle (Podocnemis unifilis) in Brazilian Amazonia. Biotropica 56, e13323. doi: 10.1111/btp.13323
Alaniz A. J., Smith-Ramírez C., Rendón-Funes A., Hidalgo-Corrotea C., Carvajal M. A., Vergara P. M., et al. (2022). Multiscale spatial analysis of headwater vulnerability in South-Central Chile reveals a high threat due to deforestation and climate change. Sci. Total Environ. 849, 157930. doi: 10.1016/j.scitotenv.2022.157930
Anderson E. P., Osborne T., Maldonado-Ocampo J. A., Mills-Novoa M., Castello L., Montoya M., et al. (2019). Energy development reveals blind spots for ecosystem conservation in the Amazon Basin. Front. Ecol. Environ. 17, 521–529. doi: 10.1002/fee.2114
Andrade P. C. M., De Oliveira P. H. G., De Lima A. C., Da Mota Duarte J. A., Da Silva Azevedo S. H., De Oliveira A. B., et al. (2022). Community-based conservation and management of chelonians in the amazon. Front. Ecol. Evol. 10. doi: 10.3389/fevo.2022.769328
Auber A., Waldock C., Maire A., Goberville E., Albouy C., Algar A. C., et al. (2022). A functional vulnerability framework for biodiversity conservation. Nat. Commun. 13, 4774. doi: 10.1038/s41467-022-32331-y
Bárcenas-García A., Michalski F., Gibbs J. P., and Norris D. (2022). Amazonian run-of-river dam reservoir impacts underestimated: Evidence from a before–after control–impact study of freshwater turtle nesting areas. Aquat. Conserv.: Mar. Freshwat. Ecosyst. 32, 508–522. doi: 10.1002/aqc.3775
Bárcenas-García A., Michalski F., Morgan W. H., Smith R. K., Sutherland W. J., Gibbs J. P., et al. (2021). Impacts of dams on freshwater turtles: a global review to identify conservation solutions. Trop. Conserv. Sci. 15, 1–21. doi: 10.1177/19400829221103709
Bennett N. J., Roth R., Klain S. C., Chan K., Christie P., Clark D. A., et al. (2017). Conservation social science: Understanding and integrating human dimensions to improve conservation. Biol. Conserv. 205, 93–108. doi: 10.1016/j.biocon.2016.10.006
Bock B. C., Páez V. P., and Pérez N. F. (1998). Estudio preliminar con radiotelemetría sobre los desplazamientos de hembras de la tortuga Podocnemis unifilis en el río Caquetá, Amazonas, Colombia. Actual. Biol. 20, 29–36. doi: 10.17533/udea.acbi.329826
Buhlmann K. A., Akre T. S. B., Iverson J. B., Karapatakis D., Mittermeier R. A., Georges A., et al. (2009). A global analysis of tortoise and freshwater turtle distributions with identification of priority conservation areas. Chelonian Conserv. Biol. 8, 116–149. doi: 10.2744/CCB-0774.1
Campos-Silva J. V., Hawes J. E., Andrade P. C. M., and Peres C. A. (2018). Unintended multispecies co-benefits of an Amazonian community-based conservation programme. Nat. Sustainability 1, 650–656. doi: 10.1038/s41893-018-0170-5
Cárdenas-Barrantes M., Matta N. E., Rodríguez-Fandiño O. A., Fritz U., and Vargas-Ramírez M. (2024). Genetic structure and loss of genetic diversity in the savannah side-necked turtle podocnemis vogli (Testudines: podocnemididae). Chelonian Conserv. Biol. 23, 92–102. doi: 10.2744/CCB-1584.1
Caron T. M. F., Chuma V. J. U. R., Sandi A. A., and Norris D. (2021). Big trees drive forest structure patterns across a lowland Amazon regrowth gradient. Sci. Rep. 11, 3380. doi: 10.1038/s41598-021-83030-5
Castello L. and Macedo M. N. (2016). Large-scale degradation of Amazonian freshwater ecosystems. Global Change Biol. 22, 990–1007. doi: 10.1111/gcb.13173
Chaves W. A., Valle D., Tavares A. S., Morcatty T. Q., and Wilcove D. S. (2021). Impacts of rural to urban migration, urbanization, and generational change on consumption of wild animals in the Amazon. Conserv. Biol. 35, 1186–1197. doi: 10.1111/cobi.13663
Conway-Gomez K. (2007). Effects of human settlements on abundance of Podocnemis unifilis and P. expansa turtles in Northeastern Bolivia. Chelonian Conserv. Biol. 6, 199–205. doi: 10.2744/1071-8443(2007)6[199:EOHSOA]2.0.CO;2
Damseth S., Thakur K., Kumar R., Kumar S., Mahajan D., Kumari H., et al. (2024). Assessing the impacts of river bed mining on aquatic ecosystems: A critical review of effects on water quality and biodiversity. HydroResearch 7, 122–130. doi: 10.1016/j.hydres.2024.01.004
De Filho F. J. B. O. and Metzger J. P. (2006). Thresholds in landscape structure for three common deforestation patterns in the Brazilian Amazon. Landscape Ecol. 21, 1061–1073. doi: 10.1007/s10980-006-6913-0
de Oliveira I. A. P., Norris D., and Michalski F. (2015). Anthropogenic and seasonal determinants of giant otter sightings along waterways in the northern Brazilian Amazon. Mamm. Biol. 80, 39–46. doi: 10.1016/j.mambio.2014.07.006
De Souza Alcântara A., Da Silva D. F., and Pezzuti J. C. B. (2013). Effects of the hydrological cycle and human settlements on the population status of Podocnemis unifilis (Testudines: Podocnemididae) in the Xingu River, Brazil. Chelonian Conserv. Biol. 12, 134–142. doi: 10.2744/CCB-0954.1
Dos Santos R. C., Das Neves Silva Viana M., Dos Santos Monjeló L. A., Andrade P. C. M., Pantoja-Lima J., Oliveira P. H. G., et al. (2016). Testing the effects of barriers on the genetic connectivity in podocnemis erythrocephala (Red-headed amazon river turtle): implications for management and conservation. Chelonian Conserv. Biol. 15, 12–22. doi: 10.2744/CCB-1184.1
Escalona T., Norris D., De Thoisy B., Carvajal-Bacarreza P., Cueva R., Conway-Gómez K., et al. (in press). Podocnemis unifilis. The IUCN red list of threatened species. Available online at: https://www.iucnredlist.org/.
Escalona T., Valenzuela N., and Adams D. C. (2009). Nesting ecology in the freshwater turtle Podocnemis unifilis: spatiotemporal patterns and inferred explanations. Funct. Ecol. 23, 826–835. doi: 10.1111/j.1365-2435.2009.01562.x
Fagundes C. K., Fath F., Côrtes L. G., Uhlig V., Andrade P. C. M., Vogt R. C., et al. (2021). A large scale analysis of threats to the nesting sites of Podocnemis species and the effectiveness of the coverage of these areas by the Brazilian Action Plan for Amazon Turtle Conservation. J. Nat. Conserv. 61, 125997. doi: 10.1016/j.jnc.2021.125997
Fagundes C. K., Vogt R. C., De Souza R. A., and De Marco J. P. (2018). Vulnerability of turtles to deforestation in the Brazilian Amazon: Indicating priority areas for conservation. Biol. Conserv. 226, 300–310. doi: 10.1016/j.biocon.2018.08.009
Greenacre M., Groenen P. J. F., Hastie T., D’enza A. I., Markos A., and Tuzhilina E. (2022). Principal component analysis. Nat. Rev. Methods Primers 2, 100. doi: 10.1038/s43586-022-00184-w
Hansen M. C., Potapov P. V., Moore R., Hancher M., Turubanova S. A., Tyukavina A., et al. (2013). High-resolution global maps of 21st-century forest cover change. Science 342, 850–853. doi: 10.1126/science.1244693
Hesselbarth M. H., Sciaini M., With K. A., Wiegand K., and Nowosad J. (2019). landscapemetrics: an open-source R tool to calculate landscape metrics. Ecography 42, 1648–1657. doi: 10.1111/ecog.04617
Husson F., Lê S., and Pagès J. (2017). Exploratory multivariate analysis by example using R (Boca Raton, FL, USA: Chapman & Hall).
INPE (2024). PRODES - Amazônia Monitoramento do Desmatamento da Floresta Amazônica Brasileira por Satélite. Available online at: http://www.obt.inpe.br/OBT/assuntos/programas/amazonia/prodes (Accessed March 11, 2024).
Ippolito A., Sala S., Faber J. H., and Vighi M. (2010). Ecological vulnerability analysis: A river basin case study. Sci. Total Environ. 408, 3880–3890. doi: 10.1016/j.scitotenv.2009.10.002
Iverson J. B. (1991). Patterns of survivorship in turtles (order Testudines). J. Zoology 69, 385–391. doi: 10.1139/z91-060
Johns A. D. (1987). Continuing problems for Amazon river turtles. Oryx 21, 25–28. doi: 10.1017/S0030605300020445
Junk W. J., Wittmann F., Schöngart J., and Piedade M. T. F. (2015). A classification of the major habitats of Amazonian black-water river floodplains and a comparison with their white-water counterparts. Wetlands Ecol. Manage. 23, 677–693. doi: 10.1007/s11273-015-9412-8
Kissling W. D., Walls R., Bowser A., Jones M. O., Kattge J., Agosti D., et al. (2018). Towards global data products of Essential Biodiversity Variables on species traits. Nat. Ecol. Evol. 2, 1531–1540. doi: 10.1038/s41559-018-0667-3
Kottek M., Grieser J., Beck C., Rudolf B., and Rubel F. (2006). World Map of the Köppen-Geiger climate classification updated. Meteorologische Z. 15, 259–263. doi: 10.1127/0941-2948/2006/0130
Kukkala A. S. and Moilanen A. (2013). Core concepts of spatial prioritisation in systematic conservation planning. Biol. Rev. 88, 443–464. doi: 10.1111/brv.12008
Leal C. G., Pompeu P. S., Gardner T. A., Leitão R. P., Hughes R. M., Kaufmann P. R., et al. (2016). Multi-scale assessment of human-induced changes to Amazonian instream habitats. Landscape Ecol. 31, 1725–1745. doi: 10.1007/s10980-016-0358-x
Lovich J. E., Ennen J. R., Agha M., and Gibbons J. W. (2018). Where have all the turtles gone, and why does it matter? Bioscience 68, 771–781. doi: 10.1093/biosci/biy095
Mayor P., Bodmer R., Moya K., Solis S., Kirkland M., Perez-Peña P., et al. (2024). Trends in urban wild meat trade of chelonians (Turtles and tortoises) in the Peruvian amazon. Animals 14, 3205. doi: 10.3390/ani14223205
Mollmann V. H. D. S., Santos S., Fernandes G., Mossolin E. C., Dalosto M. M., Cardoso S. M. V. S., et al. (2022). Terrestrial protected areas do not fully shield their streams from exogenous stressors. Environ. Conserv. 49, 215–224. doi: 10.1017/S0376892922000261
MPAP (2023). Ministério Público do Estado do Amapá. Consulta de Processos Extrajudiciais. Available online at: https://www.mpap.mp.br/consultas/index.php?pg=extrajudicial (Accessed April 7, 2024).
Naveda-Rodríguez A., Cueva R., and Zapata-Ríos G. (2018). Space use of yellow-spotted river turtles (Podocnemis unifilis) in yasuni national park, Ecuador. Chelonian Conserv. Biol. 17, 37–43. doi: 10.2744/CCB-1270.1
Nogueira J. G., Teixeira A., Varandas S., Lopes-Lima M., and Sousa R. (2021). Assessment of a terrestrial protected area for the conservation of freshwater biodiversity. Aquat. Conserv.: Mar. Freshwat. Ecosyst. 31, 520–530. doi: 10.1002/aqc.3502
Norris D. and Michalski F. (2013). Socio-economic and spatial determinants of anthropogenic predation on Yellow-spotted River Tuttle, Podocnemis unifilis (Testudines: Pelomedusidae), nests in the Brazilian Amazon: Implications for sustainable conservation and management. Zoologia 30, 482–490. doi: 10.1590/s1984-46702013000500003
Norris D., Michalski F., and Gibbs J. P. (2018). Beyond harm’s reach? Submersion of river turtle nesting areas and implications for restoration actions after Amazon hydropower development. Peerj 6, e4228. doi: 10.7717/peerj.4228
Norris D., Michalski F., and Gibbs J. P. (2020). Community based actions save Yellow-spotted river turtle (Podocnemis unifilis) eggs and hatchlings flooded by rapid river level rises. PeerJ 8, e9921. doi: 10.7717/peerj.9921
Norris D., Peres C. A., Michalski F., and Gibbs J. P. (2019). Prospects for freshwater turtle population recovery are catalyzed by pan-Amazonian community-based management. Biol. Conserv. 233, 51–60. doi: 10.1016/j.biocon.2019.02.022
Páez V. P., Lipman A., Bock B. C., and Heppell S. S. (2015). A plea to redirect and evaluate conservation programs for South America’s Podocnemidid River Turtles. Chelonian Conserv. Biol. 14, 205–216. doi: 10.2744/CCB-1122.1
Paula F. R. D., Gerhard P., Ferraz S. F. D. B., and Wenger S. J. (2018). Multi-scale assessment of forest cover in an agricultural landscape of Southeastern Brazil: Implications for management and conservation of stream habitat and water quality. Ecol. Indic. 85, 1181–1191. doi: 10.1016/j.ecolind.2017.11.061
Peres C. A., Barlow J., and Laurance W. F. (2006). Detecting anthropogenic disturbance in tropical forests. Trends Ecol. Evol. 21, 227–229. doi: 10.1016/j.tree.2006.03.007
Pettorelli N., Schulte to Bühne H., Tulloch A., Dubois G., Macinnis-Ng C., Queirós A. M., et al. (2018). Satellite remote sensing of ecosystem functions: opportunities, challenges and way forward. Remote Sens. Ecol. Conserv. 4, 71–93. doi: 10.1002/rse2.59
Pezzuti J. C. B., Lima J. P., Da Silva D. F., and Begossi A. (2010). Uses and taboos of turtles and tortoises along rio negro, amazon basin. J. Ethnobiology 30, 153–168. doi: 10.2993/0278-0771-30.1.153
Pimid M., Mohd Nasir M. R., Krishnan K. T., Chambers G. K., Ahmad A. G., and Perijin J. (2022). Understanding social dimensions in wildlife conservation: multiple stakeholder views. Animals 12, 811. doi: 10.3390/ani12070811
Ponce De Leão S., Famelli S., and Vogt R. C. (2019). Home range of yellow-spotted amazon river turtles (Podocnemis unifilis) (testudines: podocnemididae) in the trombetas river biological reserve, pará, Brazil. Chelonian Conserv. Biol. 18, 10–18. doi: 10.2744/CCB-1273.1
Quigley T. M., Haynes R. W., and Hann W. J. (2001). Estimating ecological integrity in the interior Columbia River basin. For. Ecol. Manage. 153, 161–178. doi: 10.1016/S0378-1127(01)00459-5
Quintana I., Norris D., Valerio A., Becker F., Gibbs J. P., and J. Michalski F. (2019). Nest removal by humans creates an evolutionary trap for Amazonian freshwater turtles. J. Zool. 309, 94–105. doi: 10.1111/jzo.12689
R Core Team (2020). R: A language and environment for statistical computing (Vienna, Austria: R Foundation for Statistical Computing). 4.0.1 ed.
Refsnider J. M. and Janzen F. J. (2010). Putting eggs in one basket: Ecological and evolutionary hypotheses for variation in oviposition-site choice. Annu. Rev. Ecology Evolution Systematics 41, 39–57. doi: 10.1146/annurev-ecolsys-102209-144712
Ríos-Saldaña C. A., Delibes-Mateos M., and Ferreira C. C. (2018). Are fieldwork studies being relegated to second place in conservation science? Global Ecol. Conserv. 14, e00389. doi: 10.1016/j.gecco.2018.e00389
Rivera C. J., Macey S. K., Blair M. E., and Sterling E. J. (2021). Assessing ecological and social dimensions of success in a community-based sustainable harvest program. Environ. Manage. 67, 731–746. doi: 10.1007/s00267-021-01425-6
Smith N. J. H. (1979). Aquatic turtles of Amazonia: an endangered resource. Biol. Conserv. 16, 165–176. doi: 10.1016/0006-3207(79)90019-3
Sousa L. M., Correia L. L., Alexandre R. J. R., Pena S. A., and Vieira T. B. (2024). Conservation units alone are insufficient to protect Brazilian Amazonian chelonians. Sci. Rep. 14, 10827. doi: 10.1038/s41598-024-61722-y
Souza C. M., Shimbo J. Z., Rosa M. R., Parente L. L., Alencar A. A., Rudorff B. F. T., et al. (2020). Reconstructing three decades of land use and land cover changes in Brazilian biomes with landsat archive and earth engine. Remote Sens. 12, 2735. doi: 10.3390/rs12172735
Stanford C. B., Iverson J. B., Rhodin A. G. J., Van Dijk P. P., Mittermeier R. L. A., Kuchling G., et al. (2020). Turtles and tortoises are in trouble. Curr. Biol. 30, R721–R735. doi: 10.1016/j.cub.2020.04.088
Steen D. A., Gibbs J. P., Buhlmann K. A., Carr J. L., Compton B. W., Congdon J. D., et al. (2012). Terrestrial habitat requirements of nesting freshwater turtles. Biol. Conserv. 150, 121–128. doi: 10.1016/j.biocon.2012.03.012
Ter Steege H., Sabatier D., Castellanos H., Van Andel T., Duivenvoorden J., Adalardo De Oliveira A., et al. (2001). An analysis of the floristic composition and diversity of Amazonian forests including those of the Guiana Shield. J. Trop. Ecol. 16, 801–828. doi: 10.1017/S0266467400001735
TFTSG (1996). “Tortoise & Freshwater turtle specialist group,” in Podocnemis unifilis. The IUCN red list of threatened species 1996. e.T17825A97397562. doi: 10.2305/IUCN.UK.1996.RLTS.T17825A7506933.en (Accessed July 23, 2025).
Thorbjarnarson J. B., Perez N., and Escalona T. (1993). Nesting of Podocnemis unifilis in the Capanaparo river, Venezuela. J. Herpetol. 27, 344–347. doi: 10.2307/1565161
Tian Y., Wen Z., Zhang X., Cheng M., and Xu M. (2022). Exploring a multisource-data framework for assessing ecological environment conditions in the Yellow River Basin, China. Sci. Total Environ. 848, 157730. doi: 10.1016/j.scitotenv.2022.157730
Törnblom J., Degerman E., and Angelstam P. (2011). Forest proportion as indicator of ecological integrity in streams using Plecoptera as a proxy. Ecol. Indic. 11, 1366–1374. doi: 10.1016/j.ecolind.2011.02.011
Tregidgo D. J., Barlow J., Pompeu P. S., De Almeida Rocha M., and Parry L. (2017). Rainforest metropolis casts 1,000-km defaunation shadow. Proc. Natl. Acad. Sci. U.S.A. 114, 8655–8659. doi: 10.1073/pnas.1614499114
TTWG (2021). Turtles of the world: annotated checklist and atlas of taxonomy, synonymy, distribution, and conservation status, 9th ed. Vermont, USA: Chelonian Research Foundation and Turtle Conservancy.
Turner B. L., Kasperson R. E., Matson P. A., Mccarthy J. J., Corell R. W., Christensen L., et al. (2003). A framework for vulnerability analysis in sustainability science. Proc. Natl. Acad. Sci. U.S.A. 100, 8074–8079. doi: 10.1073/pnas.1231335100
Tyers M. (2020). riverdist: River Network Distance Computation and Applications. R package version 0.15.3, Available online at: https://CRAN.R-project.org/package=riverdist.
Wu J., Li P., Wang D., Ren X., and Wei M. (2020). Statistical and multivariate statistical techniques to trace the sources and affecting factors of groundwater pollution in a rapidly growing city on the Chinese Loess Plateau. Hum. Ecol. Risk Assessment: Int. J. 26, 1603–1621. doi: 10.1080/10807039.2019.1594156
Keywords: Amazonia, conservation, nesting area, Podocnemididae, reptile, spatial planning, turtle, vulnerability
Citation: de Paula Silva LA, Michalski F and Norris D (2025) Anthropogenic threats increase vulnerability of Podocnemis unifilis nesting areas in the most protected Brazilian Amazon State. Front. Ecol. Evol. 13:1622535. doi: 10.3389/fevo.2025.1622535
Received: 03 May 2025; Accepted: 16 July 2025;
Published: 01 August 2025.
Edited by:
Jose F. Gonzalez-Maya, Metropolitan Autonomous University, MexicoReviewed by:
Vivian Patricia Páez, University of Antioquia, ColombiaSpatial Mountains, Universidad Nacional de La Plata, Argentina
Copyright © 2025 de Paula Silva, Michalski and Norris. This is an open-access article distributed under the terms of the Creative Commons Attribution License (CC BY). The use, distribution or reproduction in other forums is permitted, provided the original author(s) and the copyright owner(s) are credited and that the original publication in this journal is cited, in accordance with accepted academic practice. No use, distribution or reproduction is permitted which does not comply with these terms.
*Correspondence: Darren Norris, ZG5vcnJpczc1QGdtYWlsLmNvbQ==