 Chong Chen1
 Man Chen2
 Lintao Luo1
 Ying Zhu1Hongbing Chen1Minzhu Zhao1Yuhang Cao1Yongguo Li1Li Lan1Chunmei Shen3*
 Jianbo Li1*
- 1Department of Forensic Medicine, Faculty of Basic Medical Science, Chongqing Medical University, Chongqing, China
- 2Shanghai Key Laboratory of Forensic Medicine, Shanghai Forensic Service Platform, Ministry of Justice, Academy of Forensic Science, Shanghai, China
- 3Department of Laboratory Medicine, Nanfang Hospital, Southern Medical University, Guangzhou, China
Introduction: The Tujia ethnic group, belonging to the Tibeto-Burman linguistic family, predominantly resides in the mountainous regions of central and southern China. Despite their substantial population size and rich historical background, the maternal genetic characteristics of the Tujia, especially regarding the complete mitochondrial genome, remain insufficiently studied.
Methods: In this study, we obtained 131 complete mitochondrial sequences from healthy, unrelated Tujia individuals in Chongqing utilizing MPS technology. To facilitate population genetic comparisons, we selected 8,861 global modern individuals and 1,635 ancient individuals as reference datasets.
Results: Our findings revealed that the Chongqing Tujia exhibited significant representations of maternal haplotypes prevalent in East Asia, particularly in southern East Asia. Phylogenetic tree and Bayesian analyses indicated that the Tujia likely experienced several distinct population expansions during their formation. Moreover, genetic analyses revealed intimate matrilineal relationships between the Tujia and neighboring populations, such as Han populations. Additionally, the Tujia also demonstrated maternal genetic connections to geographically distant populations, such as those from Tibeto-Burman linguistic family. For ancient reference populations, close maternal genetic affinities between Tujia and populations from the Yellow River Basin were revealed, particularly those from the Late Neolithic to Early Bronze Age.
Discussion: The complex maternal genetic architecture of the Chongqing Tujia was elucidated based on complete mitochondrial genomes. Recent population admixture or ancient genetic imprints may play roles in shaping the genetic diversity patterns of the Tujia group. This study enhances our understanding of the maternal genetic background of Chongqing Tujia, offering valuable insight into the genetic diversity and broader evolutionary history of Chinese ethnic minorities.
1 Introduction
Chongqing Municipality, a prominent city in southwest China, is situated upstream of the Yangtze River and known for its rugged terrain. Historically, it has been a confluence where multiple populations have coexisted and interacted with one another. This region exhibits substantial ethnolinguistic diversity, primarily encompassing language families such as Sino-Tibetan, Hmong-Mien and Tai-Kadai (Wang et al., 2022). Notably, the Sino-Tibetan language family, comprising mainly Chinese and Tibeto-Burman languages, is the world’s second-largest and has undergone a complex historical evolution (Sagart et al., 2019; Zhang et al., 2019). The Tujia is an indigenous ethnic group belonging to the Tibeto-Burman language family, primarily inhabiting the Wuling Mountains, which span the junction of Hubei, Hunan, and Guizhou provinces, as well as Chongqing Municipality. This area is characterized by Karst topography, which is incised by deep river valleys. According to the 2020 national census, the population size of Tujia in China is 9,587,732. Recent large-scale human genomic resources have enabled us to gain a deeper understanding of human genetic history and the key genetic determinants of various human traits (GenomeAsia, 2019; Bergstrom et al., 2020; Taliun et al., 2021; He et al., 2024a, 2025; Wang et al., 2025a, b; Yang et al., 2025). However, key European biases from a global perspective, and Han biases on a regional East Asian scale (He et al., 2024a; Wang et al., 2025a), have limited our understanding of the genetic past and medical characteristics of underrepresented populations in early human genetic research. As the eighth-largest population in China, the Tujia have a complex history and unique cultural traditions, making their origins and migration patterns a focal point of academic research. However, its genomic resource is relatively limited in the public genomic source.
Mitochondrial DNA (mtDNA), serving as a maternal genetic marker, is extensively utilized in studies of human migration and genetic diversity due to its high conservation and absence of recombination (Kutanan et al., 2017). However, its population genetic history and medical relevance for the genetic basis of disease in NUMT or mtDNA (Luo et al., 2025) is often ignored compared to the extensive research focused on autosomal and Y-chromosome variations (Wang et al., 2025a, c, d). Complete mtDNA genome sequencing provides detailed genetic information that aids in elucidating the origins, migration routes, and genetic relationships among populations (Chen et al., 2020; Li et al., 2023c; Chen et al., 2024a). Through the analysis of mtDNA, researchers can trace the genetic imprints of maternal ancestors and reconstruct population migration histories (Li et al., 2023c). Although some studies have shed light on parts of the genetic background of the Tujia people, most have limited sample sizes or focus mainly on partial mtDNA fragments or nuclear DNA analyses, lacking comprehensive research on complete mtDNA genomes (Li et al., 2007a; Luo et al., 2020; He et al., 2021; Li et al., 2023a; Chen et al., 2024b). Thus, a more comprehensive analysis of the genetic background of the Tujia group, based on the complete mitochondrial genome, remains necessary. This could offer a more detailed elucidation of maternal origins, reveal potential historical events of population migration and admixture, and clarify their maternal genetic relationships with other modern or ancient populations.
As mentioned above, Chongqing is one of the primary historical settlements of the Tujia group, which may have preserved a considerable degree of genetic polymorphism and ancestral genetic imprints (Wang et al., 2022). Furthermore, the Tujia is the second-largest population in this region, making it an ideal subject for studying the maternal genetic landscape of the Chinese Tujia. For this purpose, we recruited 131 healthy, unrelated Chongqing Tujia (TJ) individuals and sequenced their complete mitochondrial genomes using the HiSeq X Ten system (Illumina, San Diego, CA, USA) through mass parallel sequencing (MPS) technology. A total of 8,861 complete mitochondrial genomes from 127 modern populations and 1,635 mitochondrial haplotypes from 23 ancient populations were selected as reference datasets. While contemporary genetic studies cannot yet completely decipher the demographic history of the Tujia group, the present-day maternal gene pool might still retain ancient imprints from early humans. Integrating comparative data from both modern and ancient populations will facilitate a comprehensive understanding of the maternal genetic architecture and population history of the Tujia, as well as elucidate their genetic affinities with other populations at a global scale.
2 Materials and methods
2.1 Sample preparation and ethical declaration
A total of 131 healthy and unrelated Tujia individuals from Chongqing, Southwest China, were recruited for this study. Whole blood samples were collected from these participants after obtaining written informed consent. This study was conducted in compliance with the World Medical Association’s guidelines (Association WM, 2013) and approved by the Ethics Committee of Chongqing Medical University (approval number: 2023057).
2.2 Sequencing of mitochondrial genome and data processing
The MultipSeqTm AImumiCap Panel (Enlighten Biotechnology Company, Shanghai, China) was utilized to construct the sequencing library. Initially, target DNA fragments were amplified using multiplex PCR and then purified with magnetic beads. Next, indexes were appended to the ends of the target DNA fragments through reamplification, followed by another round of purification using magnetic beads. The library was then quantified using the Qubit 2.0 Fluorometer platform (Thermo Fisher Scientific, CA, USA) and assessed via agarose gel electrophoresis. Finally, sequencing was performed on the Illumina HiSeq X Ten instrument (Illumina, San Diego, CA, USA). Detailed parameters for library construction and sequence data processing from FASTQ to FASTA format can be found in our previously published research (Chen et al., 2020).
2.3 MtDNA haplotype allocation and statistical analyses
Haplotypes of the complete mitochondrial genomes were classified using PhyloTree build 17 (http://www.phylotree.org/index.htm) via HaploGrep 3 (https://haplogrep.i-med.ac.at/) and were manually verified against the revised Cambridge Reference Sequence (rCRS) (Andrews et al., 1999) using Snapgene (https://www.snapgene.com/). Statistical indices for the TJ group and its predominant haplogroups were calculated using DnaSP v5 (Librado and Rozas, 2009), including haplotype diversity (Hd), nucleotide diversity (Pi), number of segregating sites (S), and average number of pairwise nucleotide differences (K). The mismatch distributions for the TJ group were analyzed using Arlequin 3.5 (Excoffier and Lischer, 2010), which included tests for the sum of squared deviations (SSD) and Harpending’s raggedness index (HRI). Neutrality tests for the TJ group were also conducted using Arlequin 3.5 (Excoffier and Lischer, 2010), encompassing Tajima’s D and Fu’s Fs tests, based on complete mitochondrial sequences.
2.4 Population dynamic and phylogenetic tree analyses of TJ group
Before conducting the Bayesian analysis, we pre-evaluated the nucleotide substitution model for the TJ group using ModelFinder in IQ-Tree (http://www.iqtree.org/). A Bayesian skyline plot (BSP) of the TJ group was constructed using BEAST v1.6.1 (Drummond and Rambaut, 2007). The BSP parameters included a strict molecular clock model with a fixed substitution rate of 1.708×10⁻⁸ per site per year for the coding region and 9.883×10⁻⁸ per site per year for the control region (Soares et al., 2009), and the optimal nucleotide substitution model was determined to be TN+F+G4. The Markov Chain Monte Carlo (MCMC) analysis was conducted 80,000,000 generations, with data sampled every 4000 generations. Effective sampling size (ESS) values, which measure the convergence of MCMC, were all above 200 for the TJ group. Bayesian results were visualized using Tracer v1.4, and the population expansion time was estimated based on previous studies (Gignoux et al., 2011). Finally, the phylogenetic tree for the TJ group was generated using TreeAnnotator v1.7.5 based on the coding region, with the first 1% of the chain length discarded as burn-in, and visualized with FigTree v1.4.3.
2.5 Analyses of genetic relationships between TJ and modern populations
2.5.1 The modern populations for comparison
To thoroughly investigate the genetic structure of the TJ group from a maternal perspective, we selected a total of 8,861 complete mitochondrial sequences from 127 previously published modern populations, ensuring that each reference population included at least 15 individuals. Detailed information on these populations, including abbreviations, sizes, geographic origins, language families, and cited references, can be found in Supplementary Table 1. Notably, the Tibeto-Burman populations in this study was separated from the Sino-Tibetan language family for genetic analyses.
2.5.2 Genetic relationships detection for TJ and worldwide modern populations
Principal component analyses (PCA) were conducted using SPSS v16.0, with haplotype frequencies from the TJ and reference populations. The genetic distances (F-statistics, FST) and Molecular variance analyses (AMOVA) between TJ and the other modern populations were determined using Arlequin v3.5 software (Excoffier and Lischer, 2010). Heatmaps illustrating pairwise FST values between TJ and the reference populations, as well as chord diagrams depicting haplotype sharing, were generated using the R statistical package (https://www.r-project.org/). A total of 8,992 mitochondrial sequences, encompassing both TJ and reference populations, were classified into different haplogroups. The groups, including TJ individuals, were used to construct reduced median networks with Network v5.0 (https://www.fluxus-engineering.com/) and visualized using Network Publisher (http://www.fluxus-engineering.com/index.htm). Finally, phylogenetic trees for shared haplotypes were built using Bayesian MCMC analyses via BEAST v1.6.1 (Drummond and Rambaut, 2007), as detailed in section 2.4.
2.6 Analyses of genetic relationships between TJ and ancient populations
Supplementary Table 2 summarizes information on 1,635 individuals from 23 ancient populations, including details such as haplogroups, geographic locations, date periods, and coordinates (longitude and latitude). The analyses based on haplotype frequencies of TJ and ancient populations, including PCA, FST, heatmaps of pairwise FST values, and haplotype-sharing chord diagrams, were performed in accordance with the methods described in Section 2.5.2.
3 Results
3.1 Sequencing depth and haplotype allocation
A total of 131 TJ individuals underwent successful sequencing using the Illumina HiSeq X Ten System (Illumina, San Diego, CA, USA). The mean read depth per sample at each site was 1094× with a standard deviation of 475×. Boxplots illustrating the sequencing depths for all individuals can be found in Supplementary Figure 1 The average read depth per site across all individuals varied between approximately 328× and 2554×, ensuring a high level of confidence.
A comprehensive analysis of the mitochondrial genomes from 131 TJ individuals revealed 128 distinct haplotypes. The haplogroups identified within the TJ group were exclusively classified under East Asian-specific lineages (Supplementary Table 3). The M macrohaplogroup was predominantly composed of the D haplogroup (D4, D5, and D6), which accounted for 15.26% of the total TJ individuals, followed by the M7 haplogroup (M7b1a1 and M7c) at 8.40%, the M8 haplogroup (M8, C7 and Z3) at 7.63%, the G haplogroup (G2 and G4) at 6.11%, and other haplotypes belonging to M macrohaplogroup (M10a1a, M9a, M74a, M12a, M13a, M20, M33, and M76a) at 10.69%. Additionally, a significant proportion of TJ individuals were categorized into sub-lineages of the N macrohaplogroup, with 38.93% falling under the R macrohaplogroup, 9.16% under the A haplogroup (A, A15, A17, and A5), 3.05% under the N9a haplogroup and 0.76% under the N10a haplogroup. Within the R macrohaplogroup, the B4 haplogroup (B4a, B4c, B4d, B4h and B4k) comprised 14.50%, the F haplogroup (F1a, F1b, F1d, F1e, F1g, F2a, F2c, F2f and F3a) made up 18.32%, the B5a1 haplogroup accounted for 4.58%, and the R9c and R22 represented 0.76% each.
3.2 Descriptive statistical indexes
As indicated in Table 1, 128 distinct haplotypes were identified among 131 TJ individuals, with Hd, S, K, and Pi values of 0.9996, 706, 35.2950, and 0.0021, respectively. Additionally, we conducted a statistical comparison of the genetic diversities of the major haplogroups within the TJ group. The most prevalent haplogroups identified in the TJ group were B (n = 25), F (n = 24), and D (n = 20). Within these lineages, the most significant sub-haplogroups were B4 (n = 19), F1 (n = 17), and D4 (n = 15), respectively. As anticipated, haplogroups B (S = 137), D (S = 130), and F (S = 135) exhibited the highest number of mutation sites. Additionally, haplogroup B4 (S=111) also demonstrated high mutation site polymorphism, comprising sub-haplotypes such as B4a, B4c, B4d, B4h, and B4k. The K values for haplogroups B, D, and F were 20.600, 20.484, and 20.120, respectively, ranking them as the top three. Additionally, these haplogroups exhibited higher Pi values, each at 0.0012. Most haplogroups demonstrated high haplotype polymorphisms, as reflected by elevated Hd values. In contrast, haplogroup M8 displayed a comparatively lower Hd value. Interestingly, despite its reduced haplotype diversity, M8 exhibited relatively higher Pi and K values.
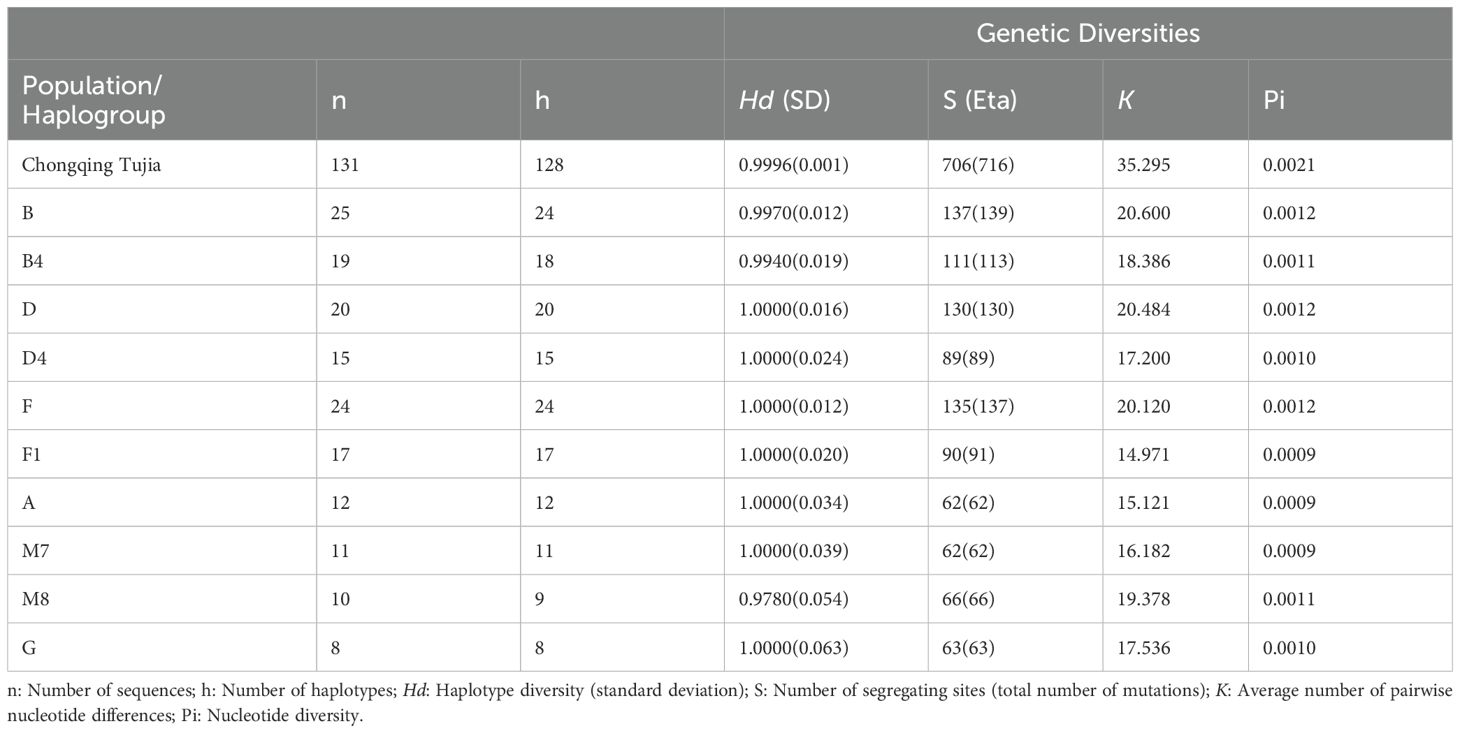
Table 1. Diversity indexes and neutrality tests for the studied Tujia group and its basic haplogroups based on the complete mitogenome.
The neutrality tests for the TJ group yielded significantly negative results, with Tajima’s D test returning a value of -2.4169 (P < 0.05) and Fu’s FS test yielding -23.9017 (P < 0.05). To investigate the population expansion history of the TJ group, a mismatch distribution analysis was performed. As illustrated in Supplementary Figure 2, the mismatch distribution exhibited a unimodal pattern. Furthermore, two model test statistics, SSD (0.0006, P = 0.58) and HRI (0.0005, P = 0.96), indicated no significant deviation from the expected population expansion model.
3.3 Bayesian skyline plot and phylogenetic tree analyses
To investigate the demographic history of the TJ group, we conducted the BSP analysis. As presented in Figure 1a, the population size of TJ initially increased from 50 to 35 kya followed by a prolonged period of constant population size. Furthermore, the BSP of TJ revealed two major population expansions after the Last Glacial Maximum (LGM; 26.5-19.0 kya) (Clark et al., 2009). The first occurred approximately 16–9 kya, with the highest growth rate at around 11.72 kya, and the second appeared around 4–0 kya. The BSP analyses based on the control region were presented in Supplementary Figure 3. To further clarify which mtDNA lineages are closely related to the TJ group expansion event, we conducted a Bayesian MCMC analysis. As shown in Figure 1b, during the period of 50–35 kya, the expansion of lineages was observed on large haplogroups such as F, B, and D. For the first population expansion after the LGM period, we observed the expansion of more mtDNA lineages, such as F (F1a, F1b1, F2 and F3a1), B4 (B4d, B4c1, B4h and B4a), B5a1, A5, D4, M10a1a, G2a, M7b1a1 and M8 (C7, M8a). During the last population expansion, the expansion of mtDNA lineages was observed in haplogroups such as F1a1, B4d1, B5a1c1a, A5b1b, D4b2b, Z3, and M7b1a1a3.
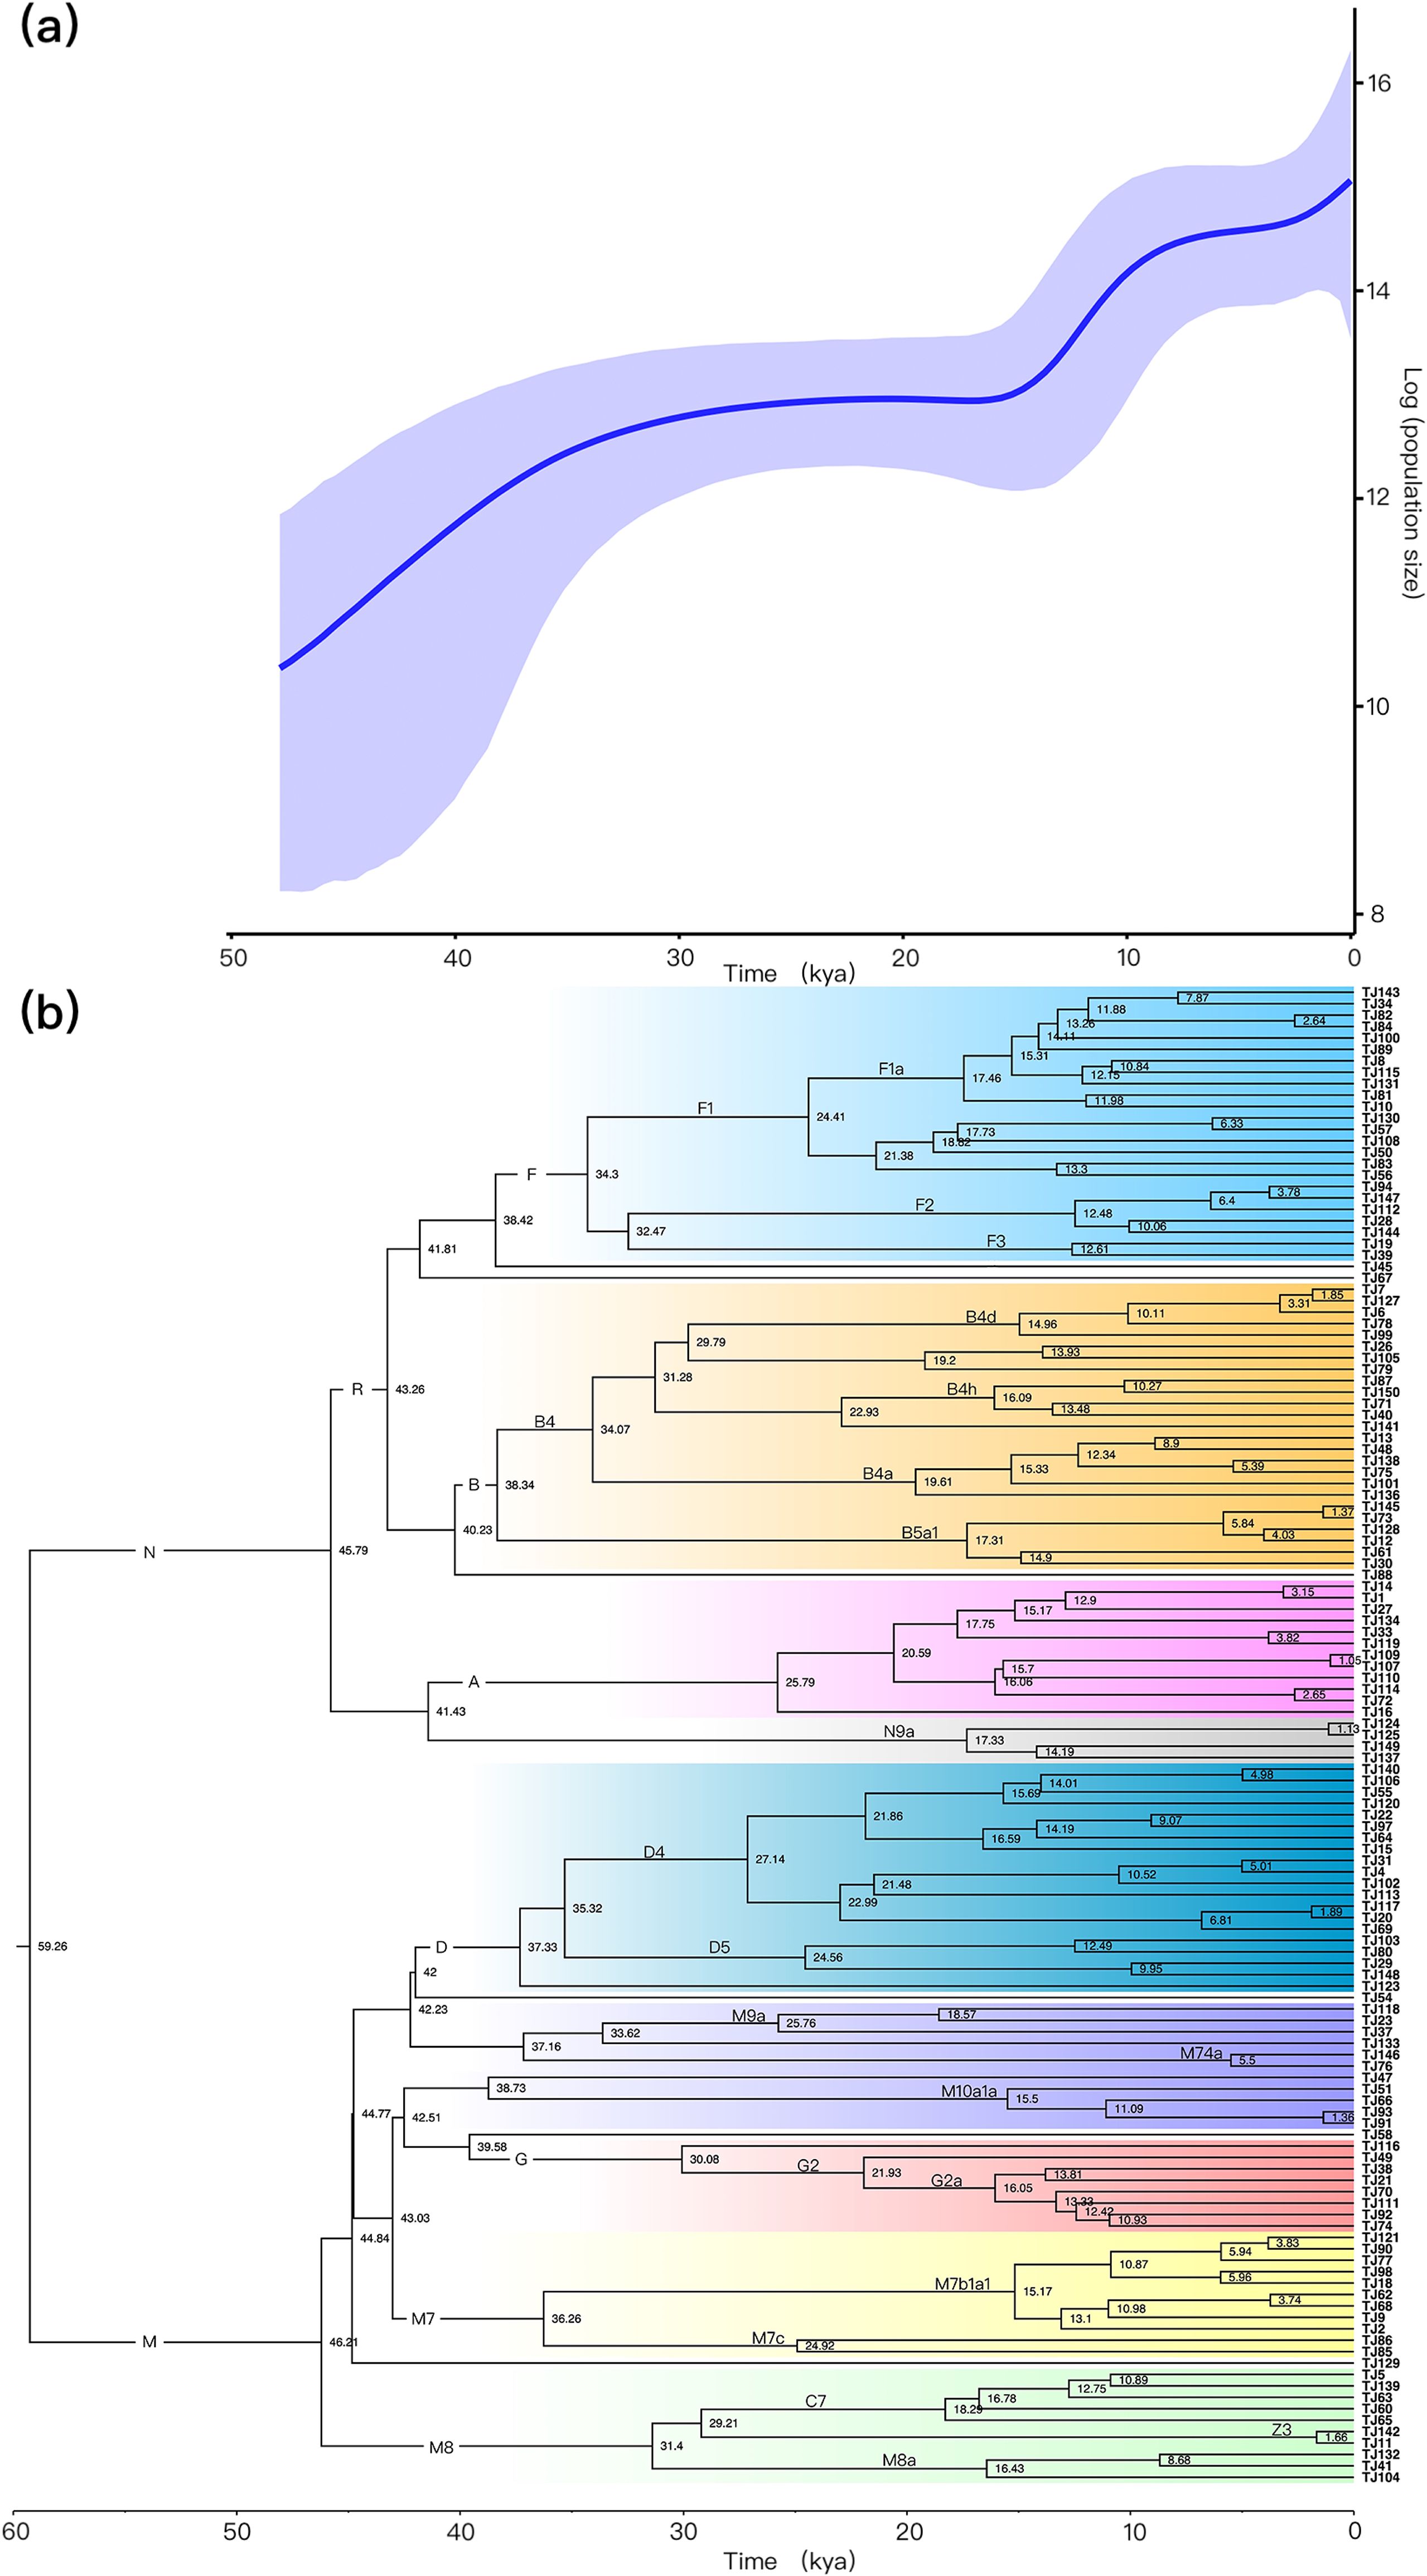
Figure 1. Bayesian skyline plot (BSP) analyzed by mitochondrial coding region to examine the population history of the TJ group (a). A schematic phylogenetic tree of the TJ haplogroups based on Bayesian MCMC analyses (b).
3.4 Genetic relationship analyses between TJ and modern worldwide populations
3.4.1 Analysis of molecular variance
To investigate the effect of various factors on the genetic structure formation of TJ group, we initially performed an AMOVA. As shown in Table 2, total 128 populations were divided into 16 and 9 groups according to linguistic and geographic factors, respectively. Regardless of linguistic or geographic factors, the majority of genetic variations were found within populations, with a percentage of over 90%. Smaller proportions were attributable to genetic differences between populations within the group, with geographic factors (4.06%) accounting for larger proportion than language factor (3.66%). The genetic variation among language groups (0.72%) represented a greater proportion than the geographical group (0.30%).
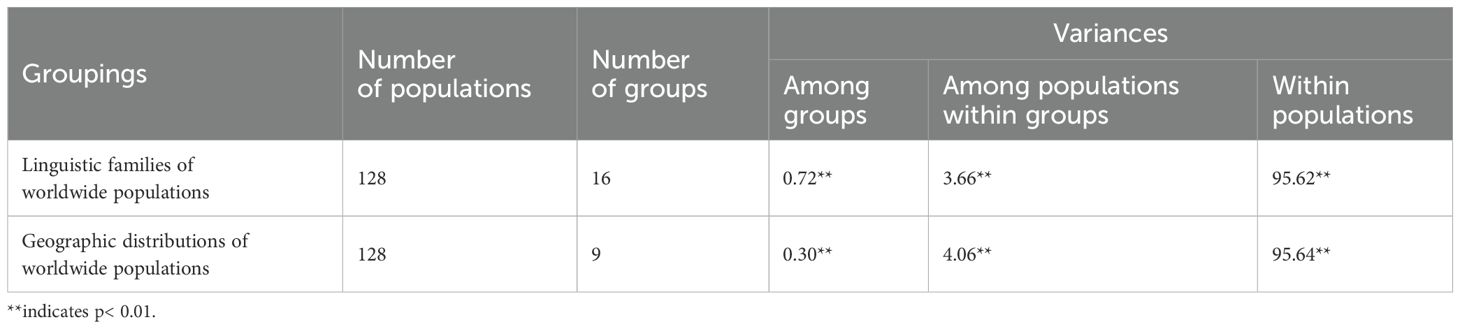
Table 2. Analysis of molecular variance (AMOVA) results for different groups across worldwide populations.
3.4.2 Principal component analyses
To visualize the genetic relationships between the TJ and worldwide populations, PCA plots were initially conducted based on 1987 mitochondrial haplotypes from 8992 individuals belonging to 128 populations (TJ and 127 reference populations). In Figure 2a, the TJ group appears to be surrounded by populations from the Sino-Tibetan (green), Tai-Kadai (blue), and Hmong-Mien (orange) linguistic families. From a geographic perspective, as shown in Figure 2b, the TJ group was located within a cluster of East Asian (green) and Southeast Asian (purple) populations. However, due to the retention of original mitochondrial haplotypes, a large number of eigenvalues were introduced during the PCA analysis. As a result, the first three principal components could merely explain 14.20% of the variance, partially leading to substantial overlap among populations with no clear grouping. To further clarify the genetic relationships between worldwide populations and verify the impact of haplogroup classification on population clustering, we compressed the 1987 original haplotypes into 408 haplogroups, which explained 21.32% of the variance. As illustrated in Supplementary Figures 4a b, the worldwide populations exhibited relatively clear clustering patterns based on linguistic family and geographic factors, respectively. The clustering observed between the TJ group and reference populations roughly mirrored the pattern seen in Figures 2a, b.
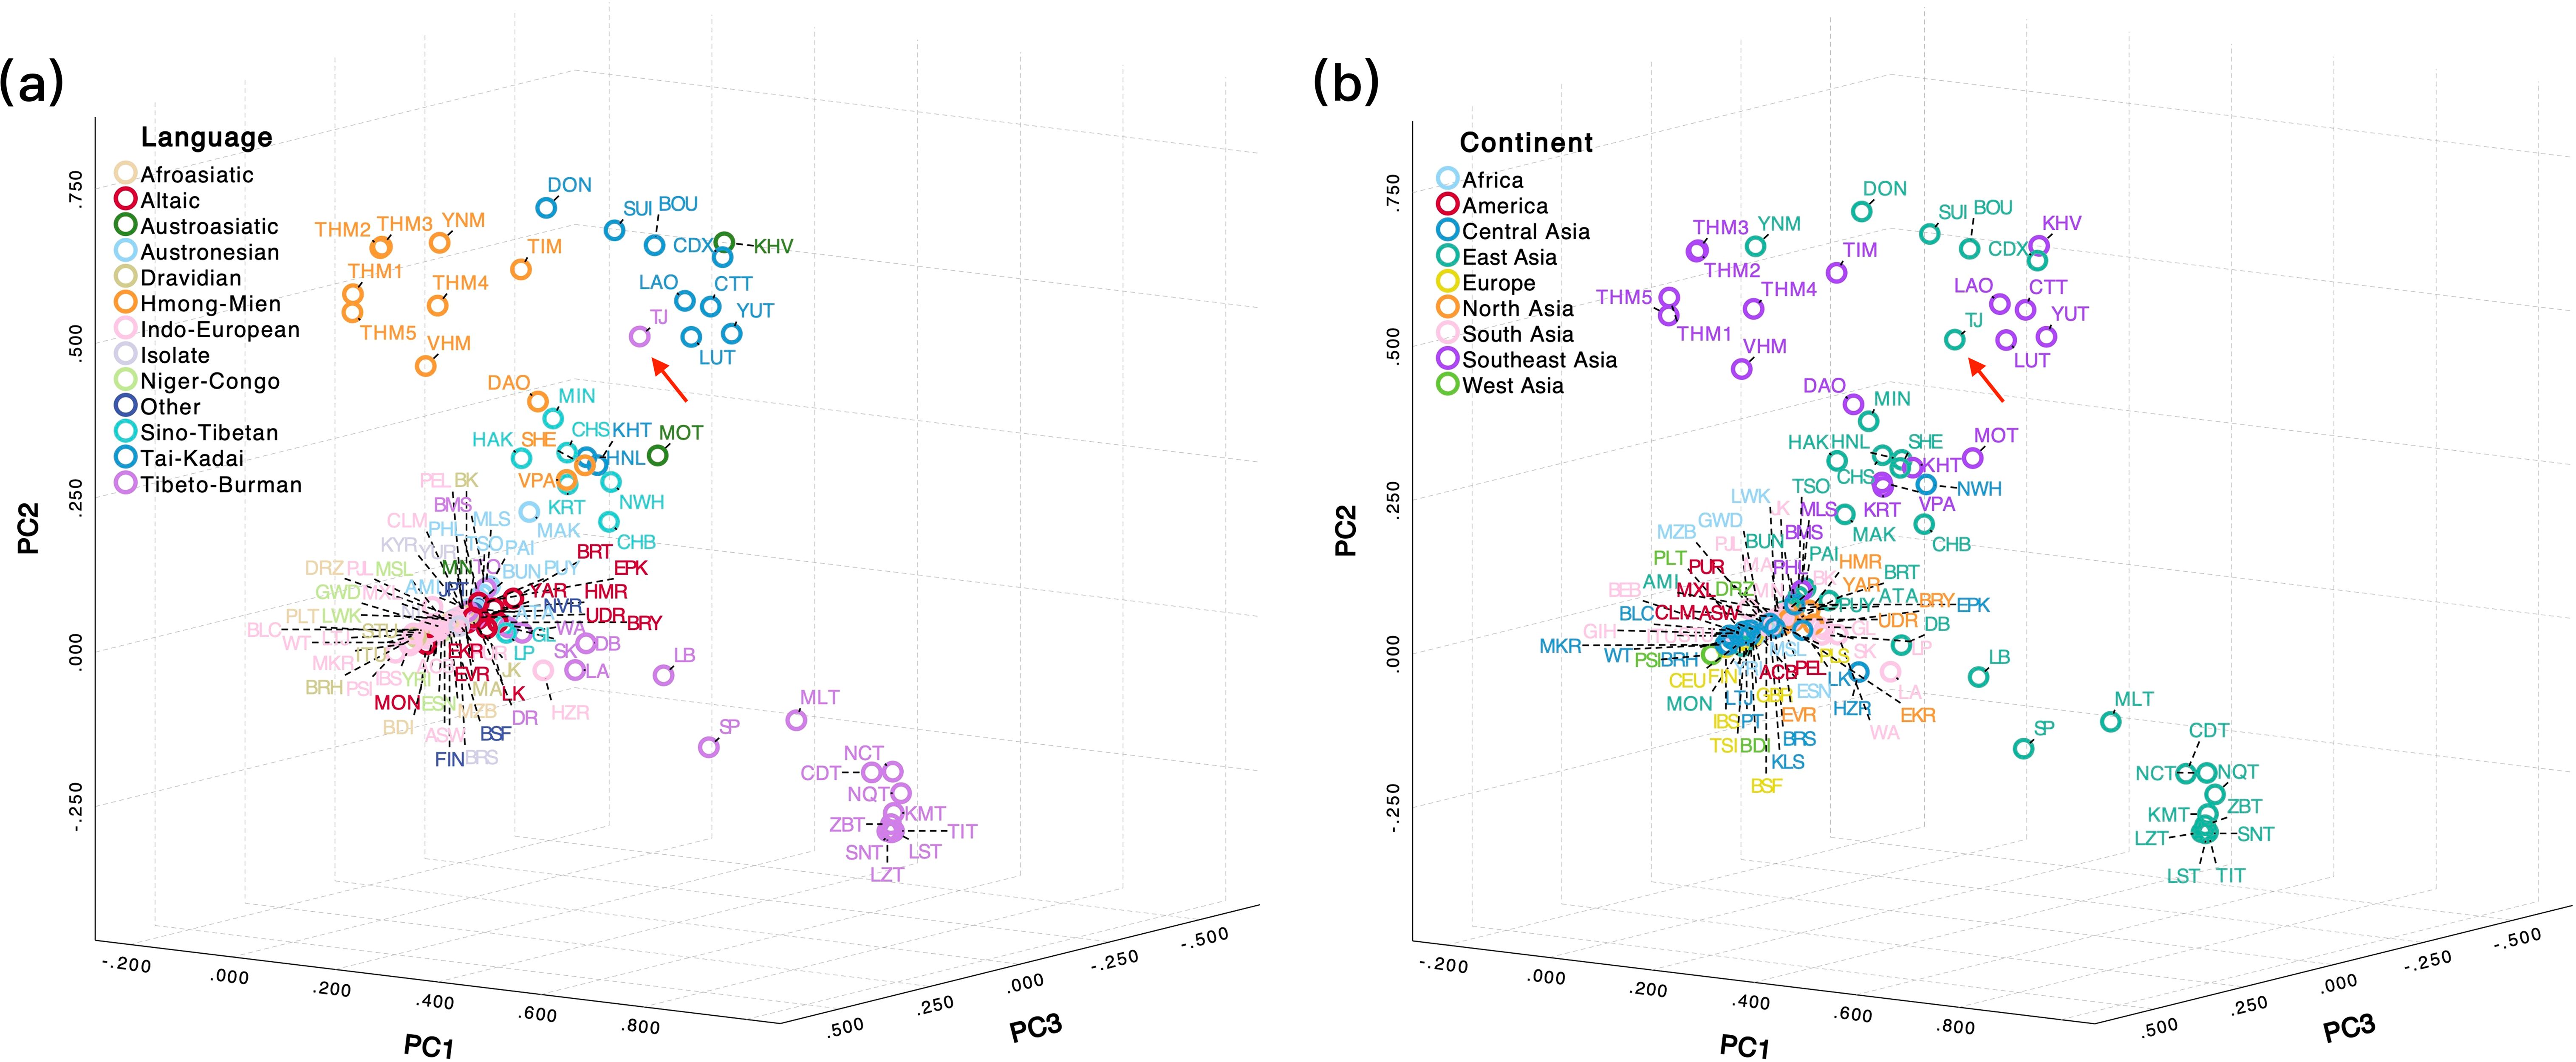
Figure 2. Principal component analysis (PCA) plots showing the genetic relationships among populations based on haplotype frequencies of 8,992 complete mitochondrial sequences from 128 worldwide populations, including Chongqing Tujia (TJ), and 127 reference populations. (a, b) were plotted based on 1987 haplotypes according to linguistic and continental classification, respectively.
3.4.3 Fixation index (FST) analyses
The FST calculations were performed based on 1987 mitochondrial haplotypes from 128 populations to assess genetic divergence among these populations. The FST values between the TJ and the reference populations ranged from 0.0003 to 0.2182, with 103 populations exhibiting FST values below 0.05 and 27 populations showing FST values below 0.01. As illustrated in Figure 3, the smaller the FST values between populations, the bluer it appears on the heatmap. Populations such as Southern Han (CHS), Beijing Han (CHB), and Northwest Hui (NWH) from the Sino-Tibetan linguistic family (in red), along with Dong (DON) and Bouyei (BOU) from the Tai-Kadai language family (in light orange), demonstrated smaller FST values, with the TJ marked by a red arrow. Specifically, the CHS population exhibited the smallest FST value of 0.0003 with the TJ group, followed by NWH at 0.0022, DON at 0.0026, CHB at 0.0029, BOU at 0.0034, Minnan Han (MIN) at 0.056, and Central Thai in Thailand (CTT) at 0.065, etc. The aforementioned populations predominantly belong to East Asia or Southeast Asia. The FST values were also calculated based on the 408 mtDNA haplogroups of 128 populations. The FST values between the TJ and reference populations ranged from 0.0001 to 0.2232. Seventy-four populations exhibited FST values below 0.05, and ten populations showed FST values below 0.01, including CHS = 0.0001, CHB = 0.0003, NWH = 0.0021, DON = 0.0029, MIN = 0.0033, BOU = 0.0060, Hakka Han (HAK) = 0.0065, Laos (LAO) = 0.0080, CTT = 0.0094, and Tokyo Japanese (JPT) = 0.0099. As presented in Supplementary Figure 5, the TJ group apparently displayed relatively lower FST values, with populations from the Sino-Tibetan linguistic family in red and those from the Tai-Kadai linguistic family in light orange.
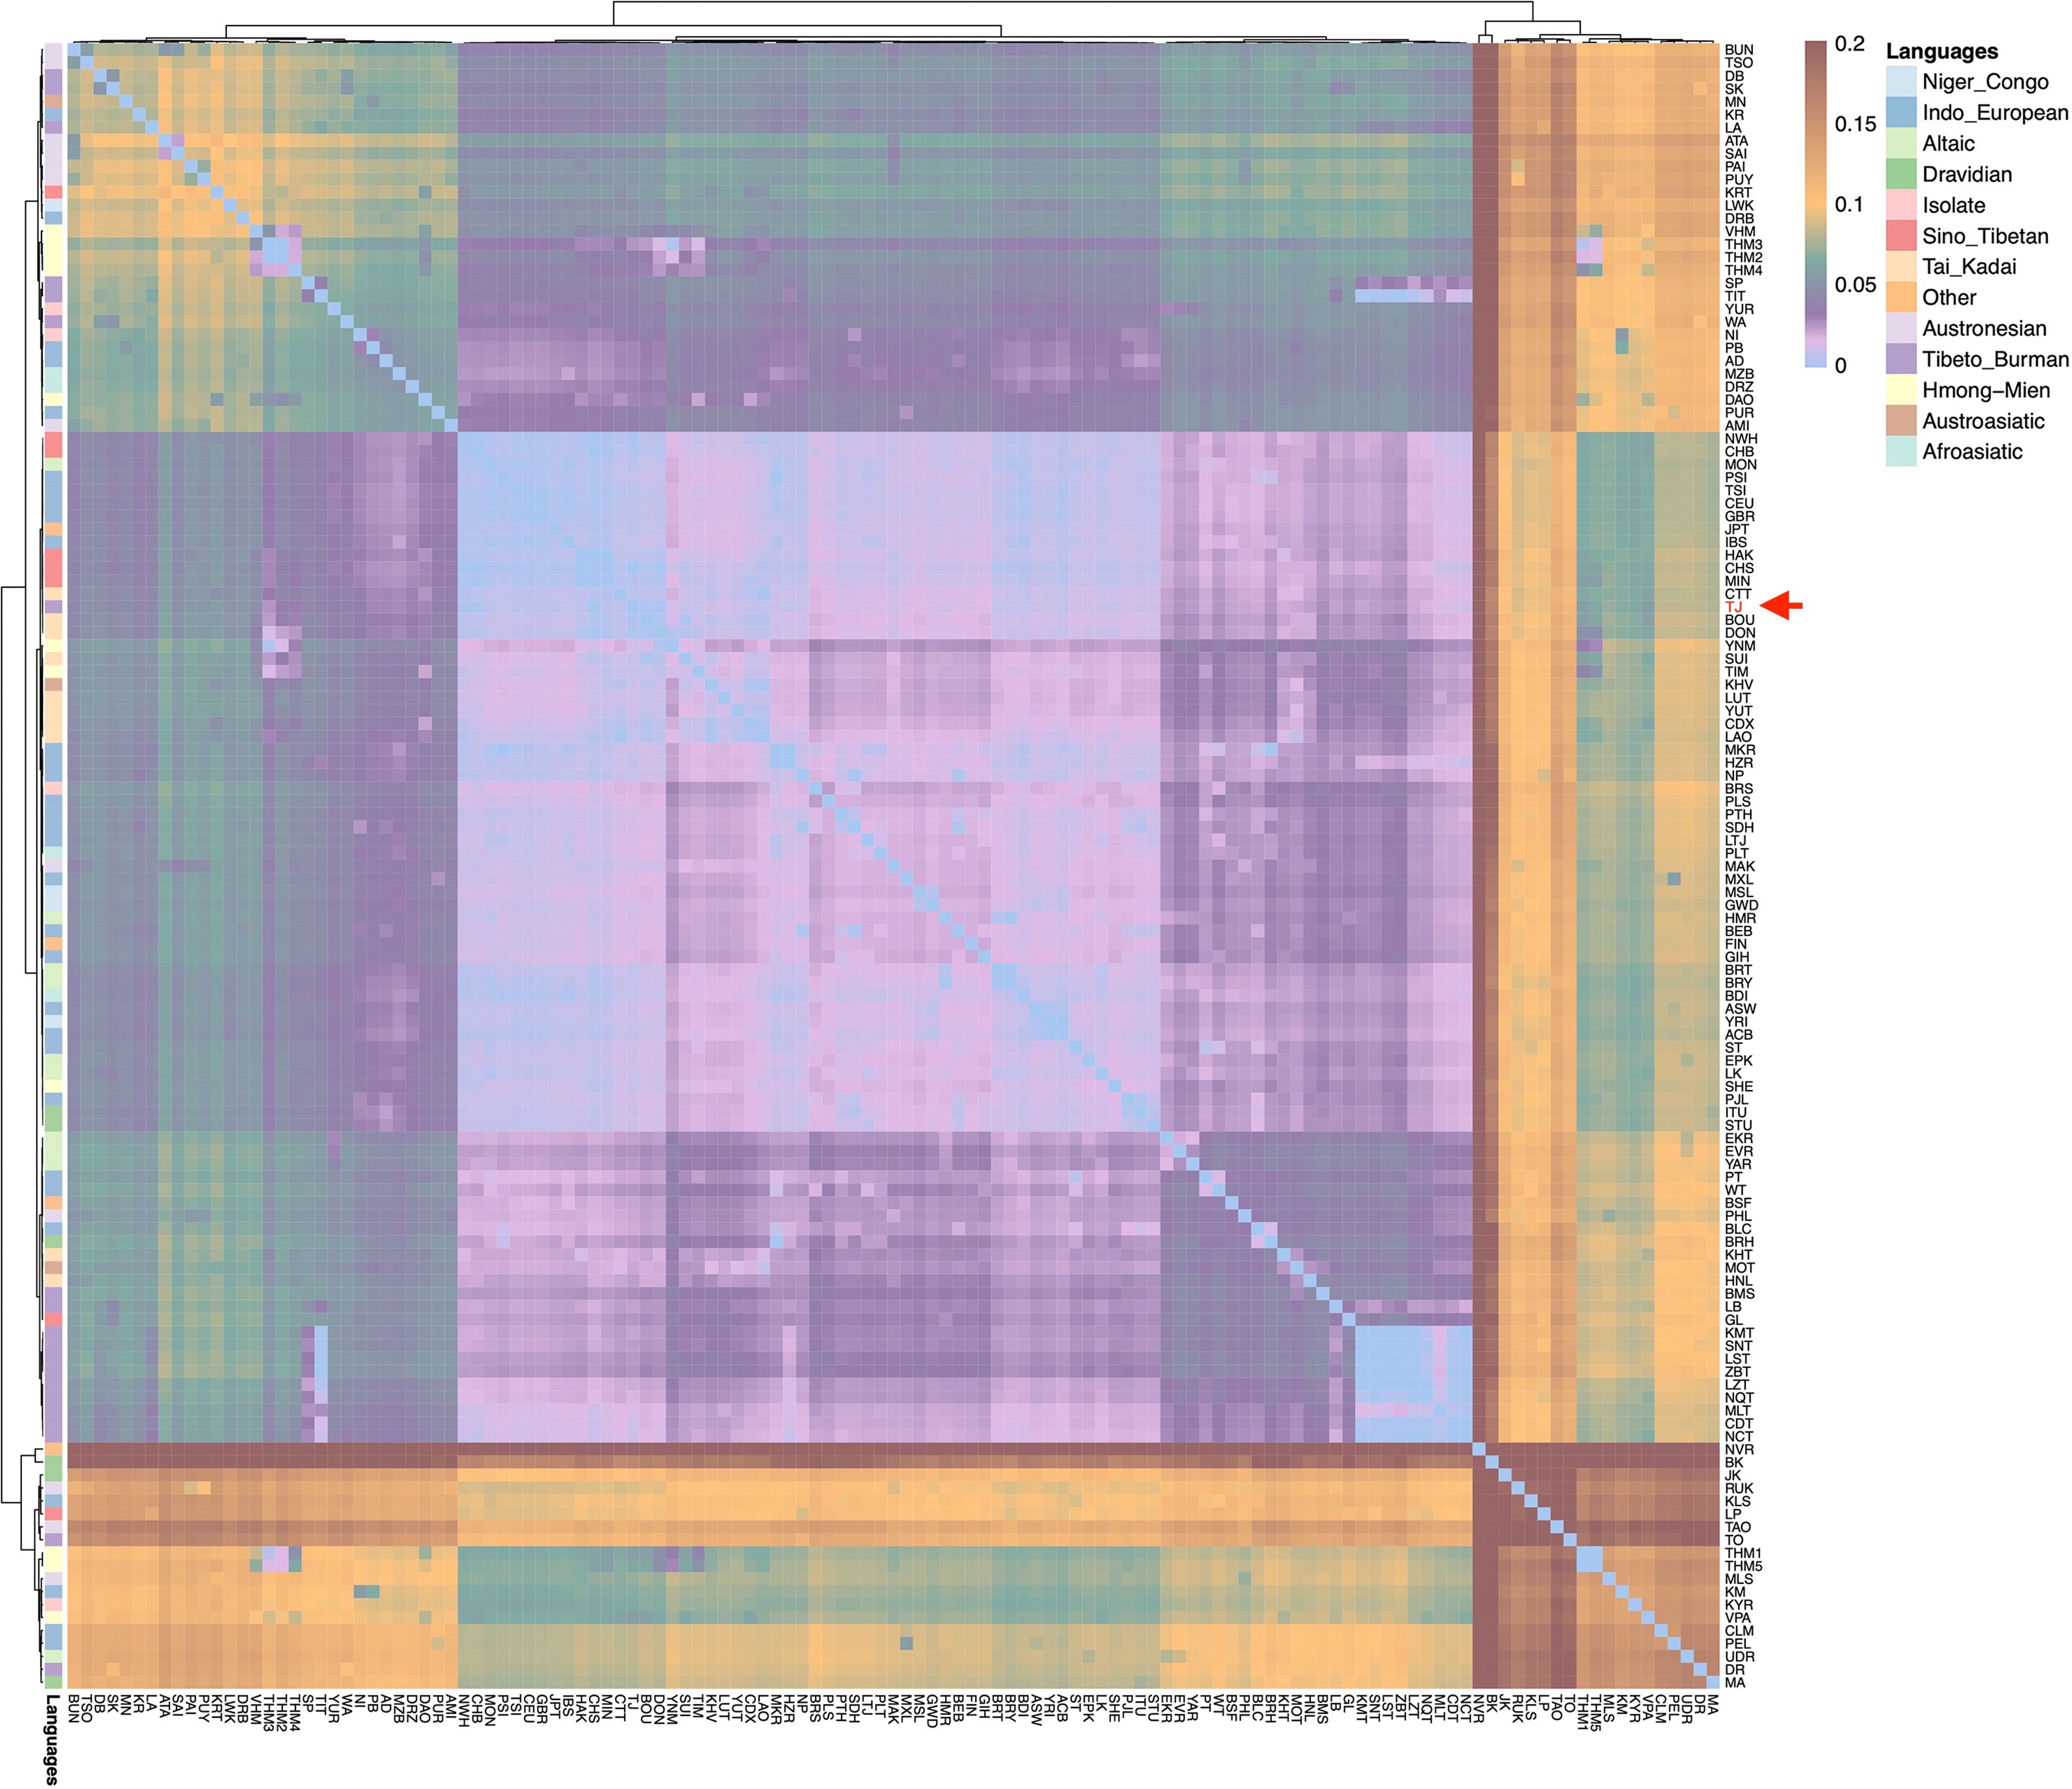
Figure 3. The heatmaps of pairwise FST values between TJ and 127 worldwide populations based on the 1,987 haplotypes.
3.4.4 The haplotype or haplogroup sharing of TJ and reference populations
To further investigate the underlying factors contributing to the PCA and FST results, we conducted extensive analyses of the shared haplotypes between the TJ group and various linguistic populations. Haplotype sharing was depicted using chord diagrams, with the primary shared haplogroups highlighted in red. As illustrated in Figure 4, the TJ group exhibited obvious haplotype sharing with populations of the Sino-Tibetan, Tai-Kadai, Hmong-Mien, and Tibeto-Burman language families based on 1987 mitochondrial haplotypes. In Figure 4a, the mtDNA haplotype clusters of the TJ group and Sino-Tibetan populations were evenly distributed across various haplotypes, including A, C7a, D4, D5a2a1, F1a1, F1a1c, F1d, M7b1a1, and M7b1a1a3. In Figure 4b, the Tai-Kadai populations primarily shared haplotypes with the TJ group at A, B5a1, B5a1c1a, C7a, D4e1a3, F1a1, F1a1a1, F3a1, M74a, M7b1a1, M7b1a1a3, and M8a2a1, etc. Further, as shown in Figure 4c, the TJ group predominantly shared haplotypes with Hmong-Mien populations at A, B5a1c1a, B5a1c1a1, C7a, D4e1a3, F1a1, F1g1, F2a, F3a1, M74a, M7b1a1, M7b1a1a3, and Z3. As depicted in Figure 4f, the common haplotypes between the TJ and Tibeto-Burman populations were mainly concentrated in the A, A15a, A17, D4b2b, D5a2a1, F1d, F1d1, G2a1, and M13a1b haplotypes. The TJ group also shared certain haplotypes with the Altaic and Austroasiatic linguistic families. In detail, the TJ group disclosed haplotype sharing with the KHV population from the Austroasiatic language family (Figure 4d), and the clustering between them was primarily concentrated in haplotypes such as M7b1a1. In Figure 4g, Altaic populations mainly shared A, F1b1b, and G2 (G2a, G2a1, and G2a2) with the TJ group. Finally, TJ shared relatively few haplotypes with Austronesian and Indo-European populations, as shown in Figures 4e, h, respectively.
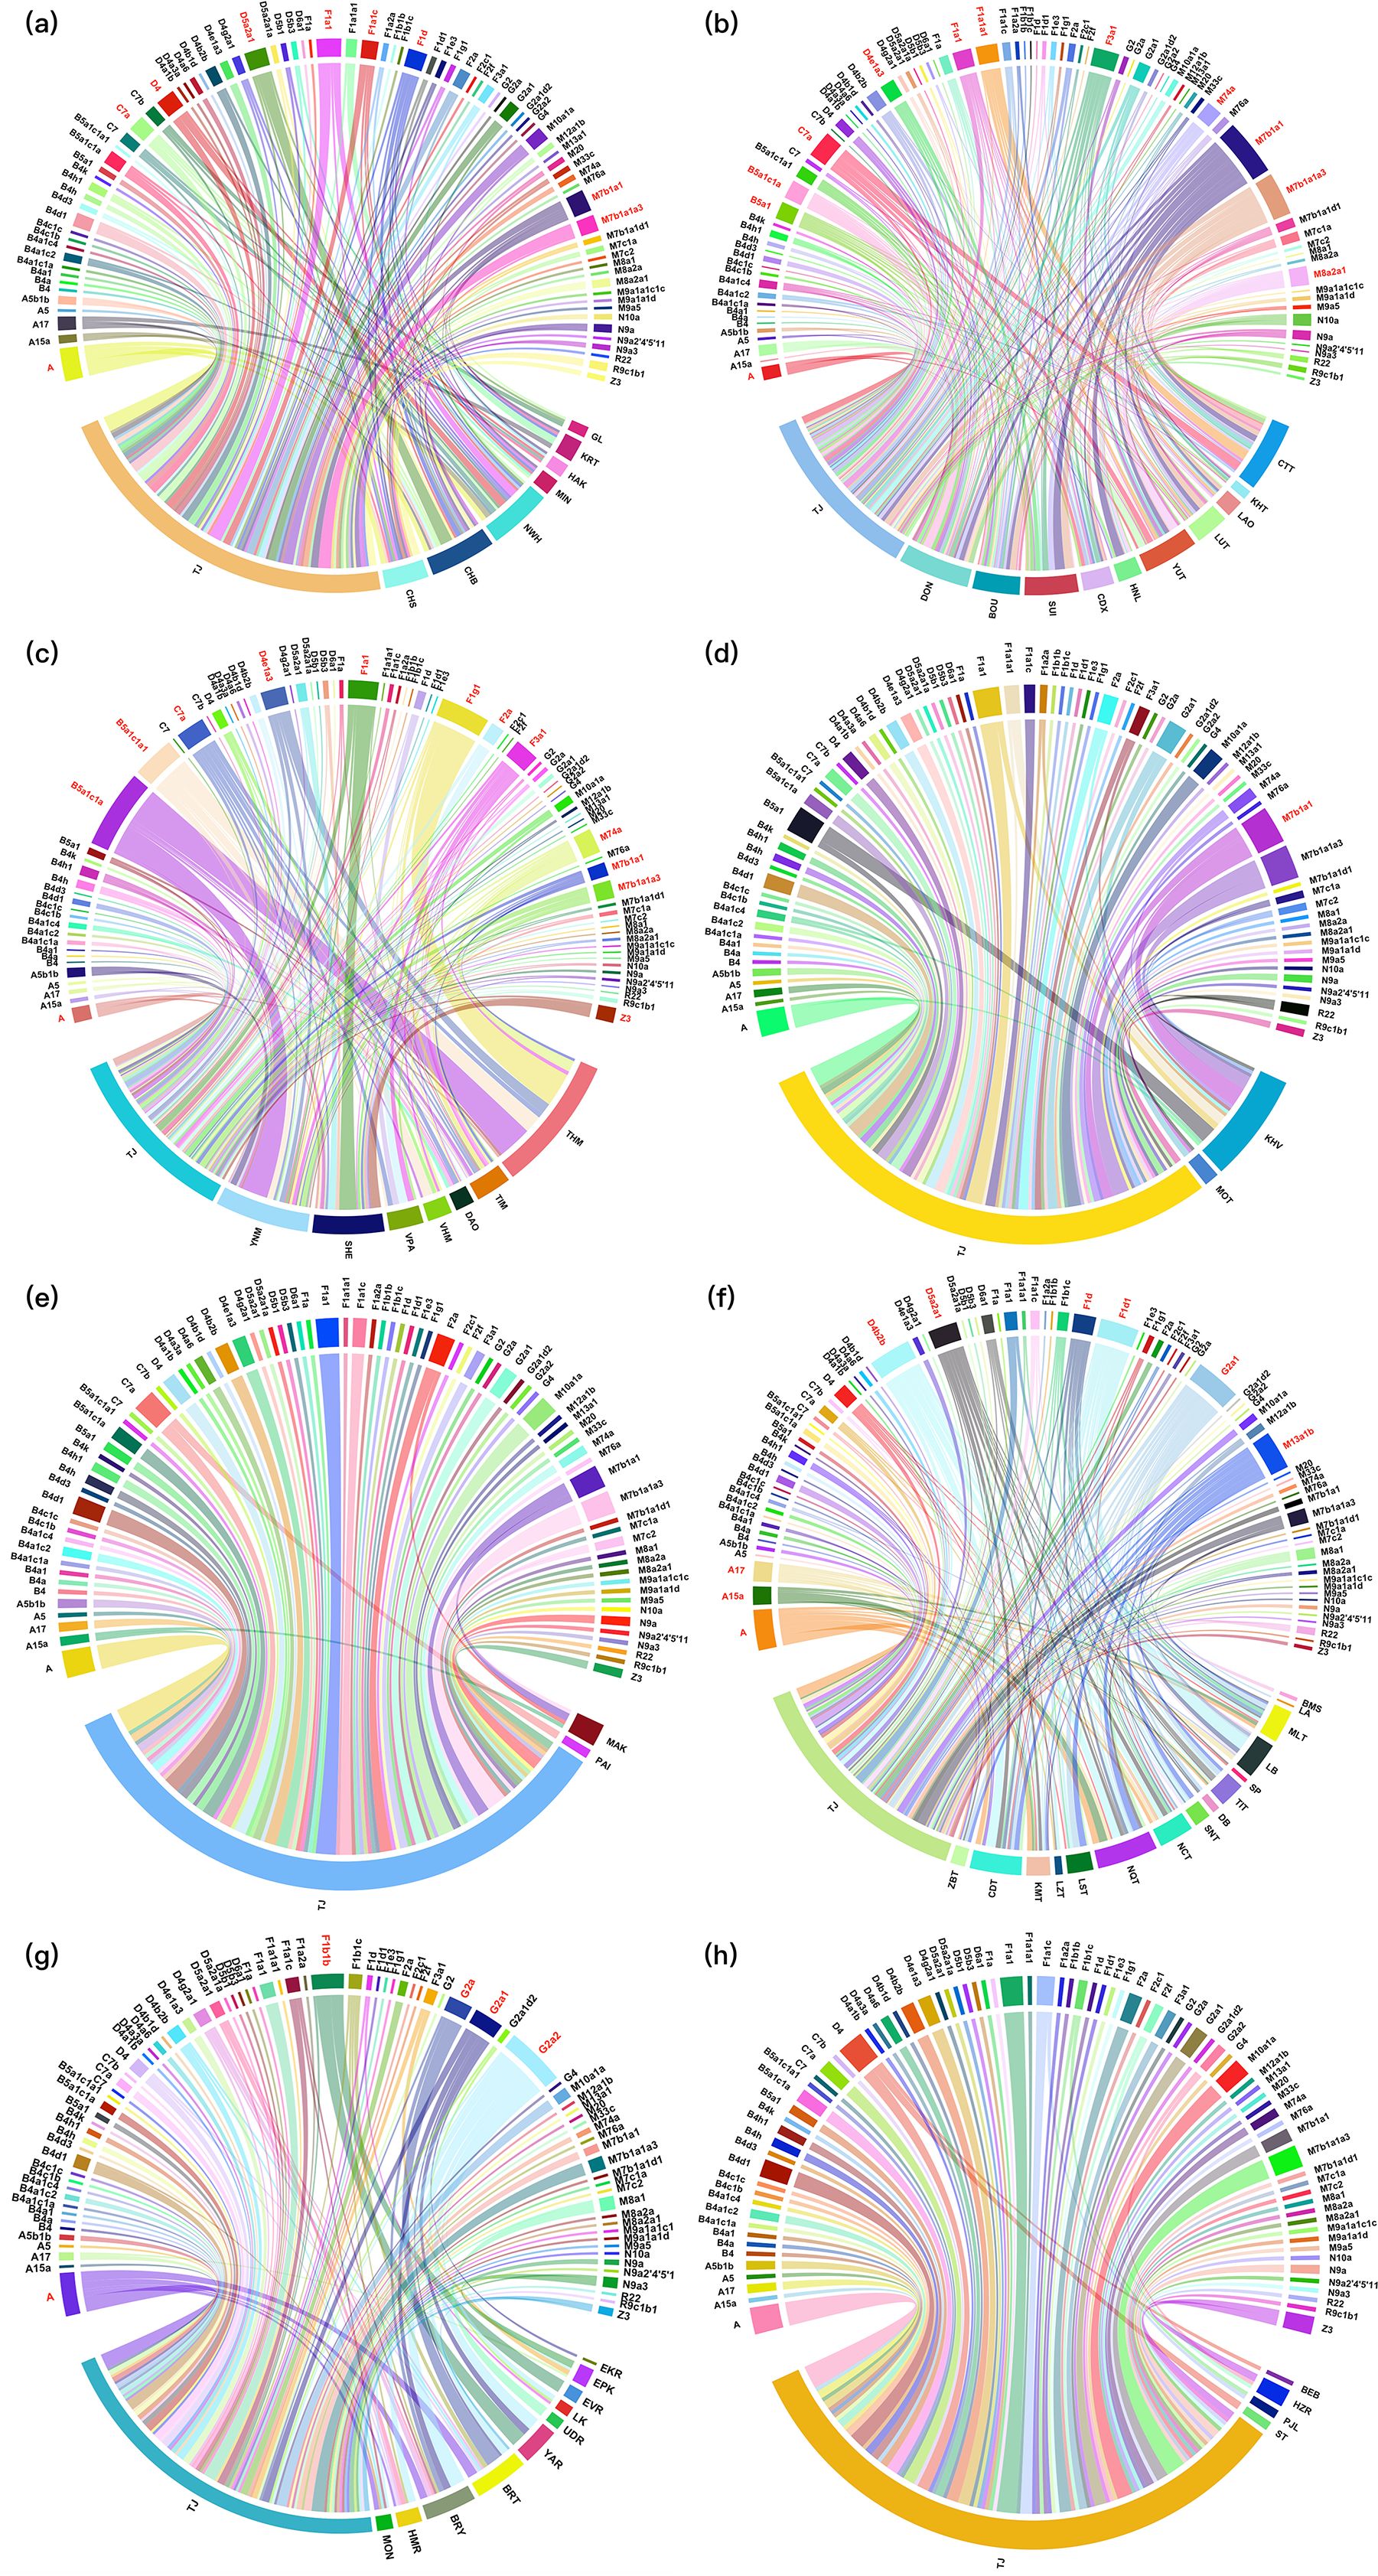
Figure 4. The chord diagrams of the haplotype sharing between the TJ group and the Sino-Tibetan (a), Tai-Kadai (b), Hmong-Mien (c), Austroasiatic (d), Austronesian (e), Tibeto-Burman (f), Altaic (g) and Indo-European (h) populations, respectively. The relatively major sharing haplotypes are indicated in red.
As presented in Supplementary Figure 6, the chord diagrams were also conducted based on 408 haplogroups for the TJ group and the aforementioned linguistic populations. More interestingly, as shown in Supplementary Figure 6e, there was a clear sharing of haplogroups between the TJ group and the Austronesian language populations, including haplogroups B4a1, B4c1, D5b1, D5b3, M7b1a1, and R9c, which differed significantly from the results observed based on 1,987 haplotypes in Figure 4e.
3.4.5 Network analyses
To further investigate the maternal genetic relationships between the TJ group and worldwide populations, and to explore potential population evolution dynamics of the TJ people through different haplotypes, we selected 2161 sequences closely associated with the haplotype distribution of TJ individuals from a total of 8,861 complete mitochondrial sequences. We then categorized these 2292 sequences into different haplogroups for Network analyses.
Network analyses could elucidate the origins and dispersal of haplotypes, providing insights into genetic exchanges between populations. We presented several representative Network lineages here, including haplogroups F and B4. In detail, Figures 5a, b, c display the Network for the F haplogroup in lineage, geographic, and linguistic contexts, respectively. TJ individuals were widely distributed in sub-haplogroups such as F1a, F1b, F1d, F1e, F1g, F2, and F3, which were predominantly composed of individuals from East Asia and Southeast Asia. Interestingly, the F1g sub-haplogroup is primarily composed of individuals from the Tibeto-Burman language family (green), while its sub-haplotype F1g1 is predominantly occupied by individuals from the Hmong-Mien language family, as well as TJ individuals. Figures 5d, e, f Illustrate the Network analyses for the B4 haplogroup under lineage, geographic, and linguistic contexts, respectively. In Figures 5d, e, the TJ individuals were primarily grouped together with individuals from East Asia (green) and Southeast Asia (yellow), which were prevalent across various sub-branches of the B4 haplogroup, predominantly encompassing haplotypes like B4a, B4c, B4d, B4h, and B4k. The network diagrams of other haplogroups were shown in Supplementary Figure 7. We further observed that TJ individuals shared the same haplotypes with Tibeto-Burman individuals in the M13a1, with haplotypes being almost exclusively distributed in the Tibeto-Burman populations. To validate the maternal relationship of TJ and Tibeto-Burman populations, we extracted mtDNA sequences belonging to haplogroups F1g and M13a1 from all populations to construct phylogenetic trees using the Bayesian method. As depicted in Supplementary Figure 8, the clustering patterns between the TJ and Tibeto-Burman populations in the phylogenetic trees were similar to those in the networks.
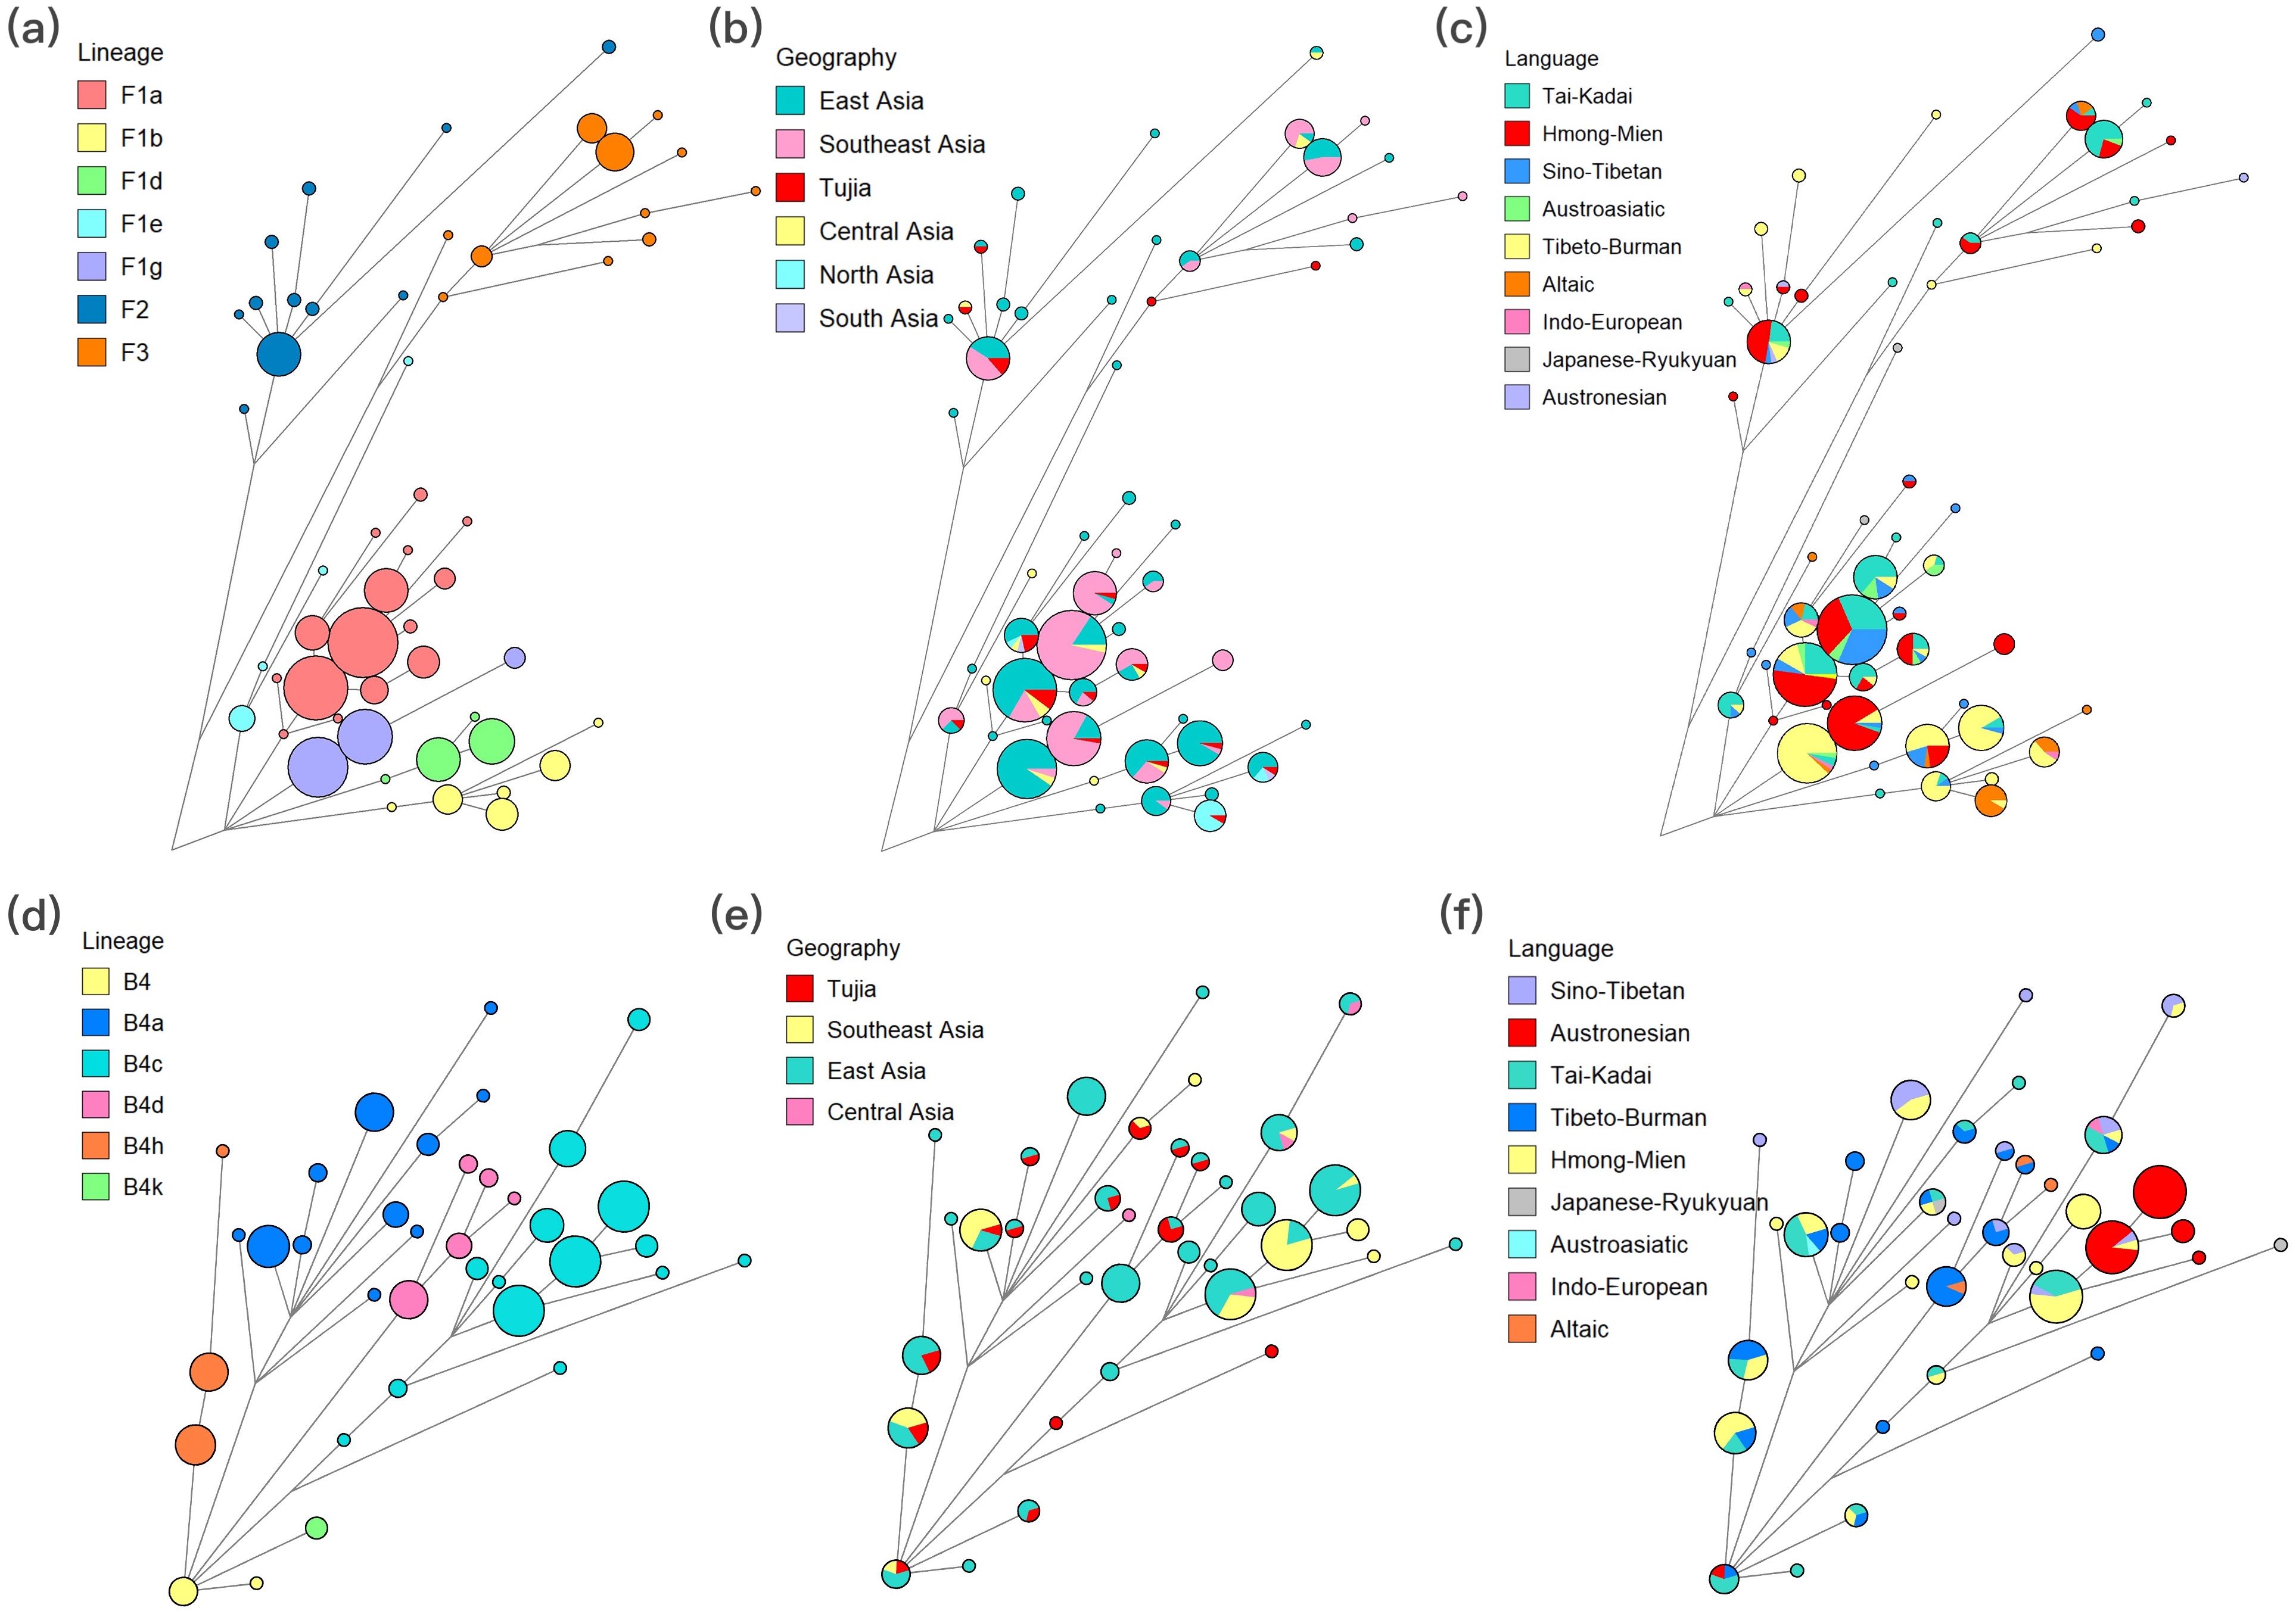
Figure 5. The median networks of the two most frequent haplogroups, including F and B4 haplogroups. (a), (b) and (c) for F haplogroup based on lineages, geographic origins and language families, respectively. (d), (e) and (f) for B4 haplogroup based on lineages, geographic origins and language families, respectively. The size of nodes and the length of the branches are proportional to the number of individuals and mutations, respectively.
Moreover, we conducted a statistical analysis of the clustering between the TJ group and reference populations based on the Network results. From the perspective of geographic distribution, 69.46% of TJ individuals were clustered with East Asian individuals, accounting for the highest proportion. A total of 43.51% of TJ individuals clustered with Southeast Asian populations. Additionally, 22.90% of TJ individuals were found to share haplotypes with Central Asian populations, predominantly from the NWH group. Furthermore, 13.74% of TJ individuals grouped with North Asian populations. Linguistically, 54.20% and 47.32% of TJ individuals exhibited genetic affinities with those from the Tai-Kadai and Sino-Tibetan language families, respectively. Haplotype sharing with the Hmong-Mien language family was observed in 41.98% of TJ individuals. Total 34.35% of TJ individuals clustered with Tibeto-Burman populations. Furthermore, 24.43% of TJ individuals were found to be aligned with Austroasiatic populations. We also conducted a preliminary statistical analysis of clustering at the population level (greater than 20%). In terms of East Asian populations, 35.11% of TJ individuals shared clustering relationships with Han individuals (CHS and CHB) belonging to Sino-Tibetan in haplogroups A (A, A17, A5b1b), B4d (B4d1, B4d3), C7a, D (D4g2a1, D5a2a1, D5a2a1a), F (F1a1c, F1d, F1d1, F1e3, F2a), M7b1a1 (M7b1a1, M7b1a1a3, M7b1a1d1), M8a (M8a2a, M8a2a1), N9 (N9a, N9a3), and R9c1b1. Further, 29.77% of TJ individuals shared haplogroups with DON individuals (Tai-Kadai) in haplogroups A, B4 (B4a1c1a, B4a1c4, B4h1, B4k), C7a, D (D4e1a3, D5a2a1), F (F1a1, F1a1c, F1g1, F2a), M (M12a1b, M7b1a1, M7b1a1a3), and N10a. The SHE individuals (Hmong-Mien) clustered with 28.24% of TJ individuals in haplogroups A (A, A5), B4 (B4h1, B4k), C7a, D5 (D5a2a1, D5b3), F (F1a1, F2a), M7 (M7b1a1, M7b1a1a3, M7c1a), N9a, and Z3. Approximately 24.43% of TJ individuals shared the same haplogroups with BOU individuals (Tai-Kadai), specifically haplogroups A, D4 (D4, D4e1a3), F (F1a, F1a1, F1a1c, F1d1, F2a), and M7b (M7b1a1, M7b1a1a3). Yunnan Miao (YNM) individuals (Hmong-Mien) and 22.90% of TJ individuals clustered together in haplogroups A, B4 (B4a1c1a, B4h), D4e1a3, F (F1a, F1a1, F1a2a, F1g1), M12a1b, M7b (M7b1a1, M7b1a1a3, M7b1a1d1), and R9c1b1. Finally, 20.61% of TJ individuals shared haplogroups A (A, A17), C7 (C7, C7a), D (D5a2a1, D6a1), F (F1a1a1, F1b1c, F1d, F1d1, F1g1), G2a1, and M (M13a1, M7b1a1a3) with Nyingtri Tibetan (NCT) individuals (Tibeto-Burman). Some Southeast Asian populations also demonstrated notable clustering relationships with TJ individuals. The Thailand Yuan (YUT, Tai-Kadai), Ho Chi Minh Kinh (KHV, Austroasiatic), CTT (Tai-Kadai), Thailand Iu Mien (TIM, Hmong-Mien), and Thailand Lue (LUT, Tai-Kadai) populations clustered with 25.95%, 22.14%, 21.37%, and 20.61% of TJ individuals, respectively. These clusters were primarily found in haplogroups such as B4a1c, C7a, F1a (F1a, F1a1, F1a1a1, F1a2a), M7 (M7b1a1, M7b1a1a3, M7b1a1d1, M7c1a, and M7c2), G2 (G2, G2a, and G2a1), and M74a.
3.5 Genetic analyses between TJ and ancient populations
To further elucidate the maternal genetic background of the TJ group, we incorporated 23 ancient populations into our population genetic analyses. As illustrated in Figure 6a, the TJ group, represented in orange in the upper right corner of the PCA plot, was predominantly clustered with the ancient populations from the Yellow River Basin indicated in blue, including Shaanxi (SAX), Shanxi (SXC), Henan (HNC), and Gansu (GSC) population, as well as ancient Yunnan population (YNC) in orange from the Yangtze River Basin. In the heatmap shown in Figure 6b, blue corresponds to smaller FST values, while pink indicates larger FST values. The TJ group predominantly clusters with populations from the Yellow River Basin, as evidenced by the deep blue regions. To further elucidate the maternal genetic factors contributing to the clustering of the TJ group with the aforementioned populations, we conducted maternal haplotype sharing analyses on the TJ group and ancient populations from the Yangtze and Yellow River Basins, and visualized the results using chord diagrams. Figure 6c demonstrated that the TJ group shares several common haplotypes with the Qinghai (QHC) and YNC populations from the Yangtze River Basin, including A, A17, D4, B4, D4b2b, D5a2a1, F1a1, F1a1c, G2a1, and M20. These ancient individuals predominantly date back to the Middle Bronze Age to the Han era. Meanwhile, populations from the Yellow River Basin exhibited shared haplotypes with the TJ group, as shown in Figure 6d, including A, B4d1, D4, D4b2b, D4g2a1, D5a2a1, F1a1, F1a1c, F2a, G2a1, and Z3, which were primarily distributed from the Late Neolithic to the Early Bronze Age. In order to further verify the relationship between the TJ group and ancient Tibeto-Burman populations, we conducted a shared haplotype analysis between them. As shown in Supplementary Figure 9, the TJ group widely shared haplotypes such as B4d1, D4b2b, F1d1, and G2a1 with the ancient Tibetans.
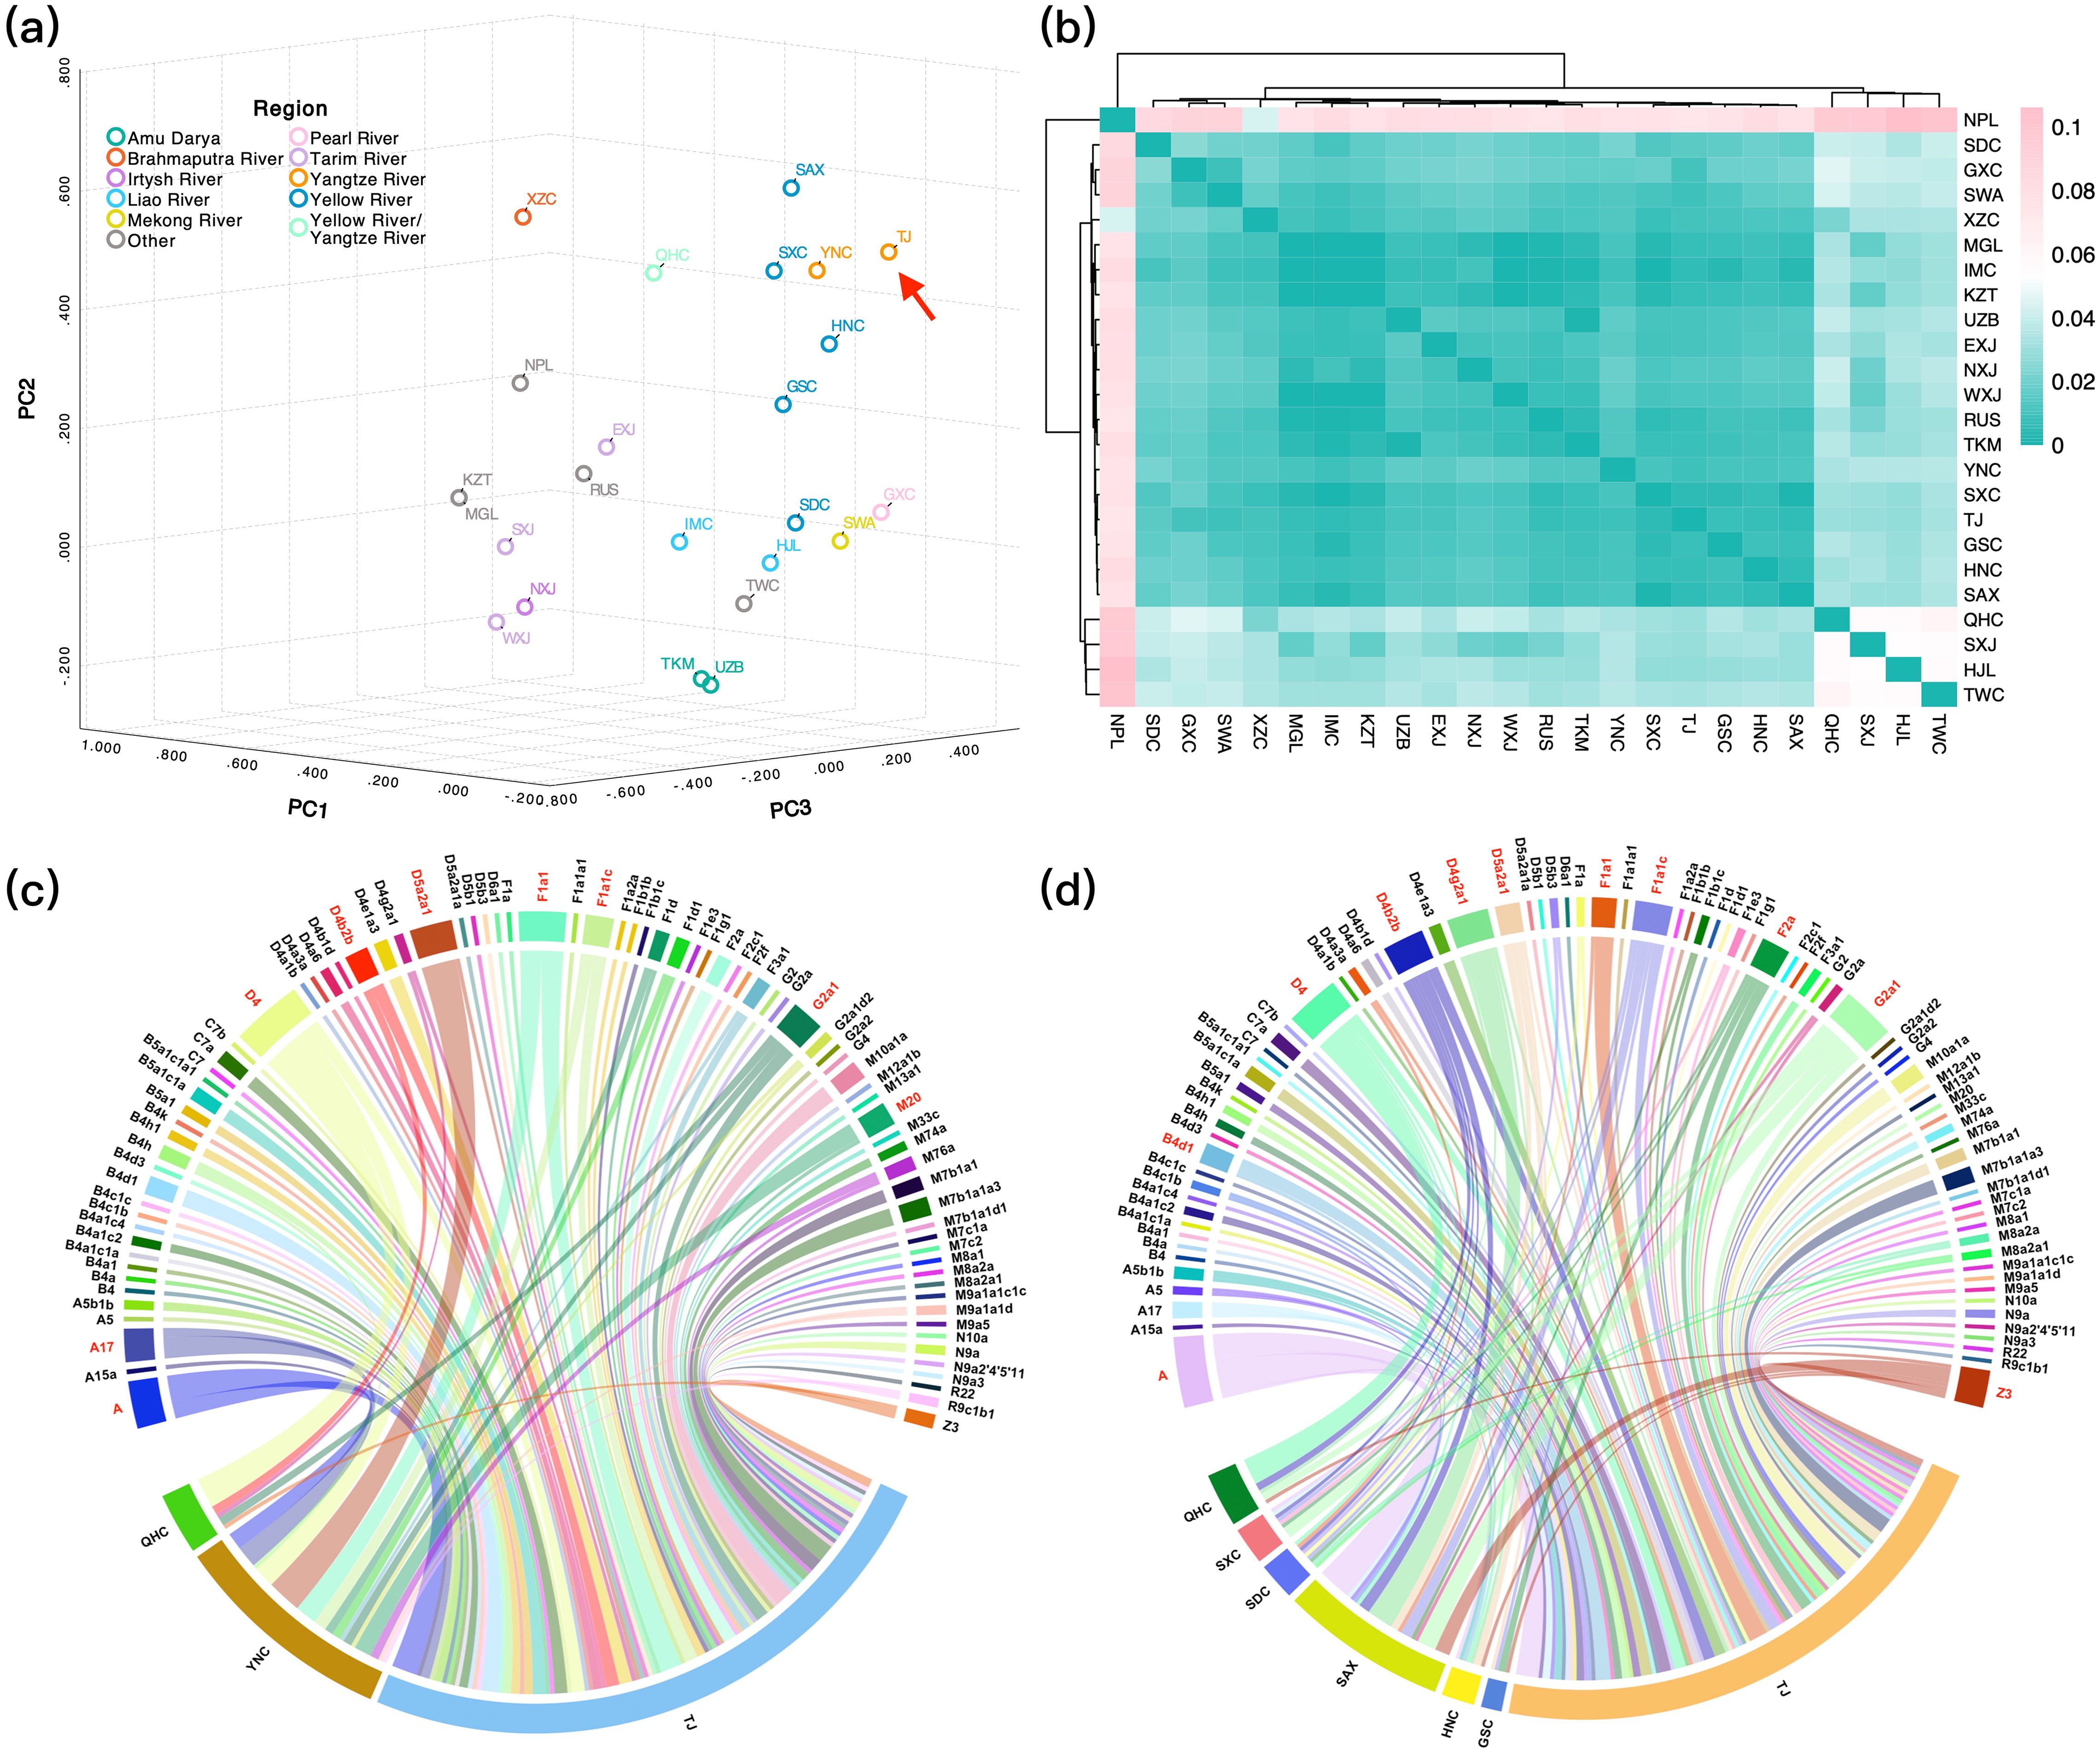
Figure 6. The PCA (a) and FSTheatmap (b) between TJ group and ancient populations based on 1,635 haplotypes. The chord diagrams illustrating haplotype sharing between the TJ group and ancient populations from the Yangtze River Basin (c) or the Yellow River Basin (d).
4 Discussion
4.1 Sequencing depth and haplotype allocation
The analysis of complete mitochondrial genomes of the TJ group reveals significant insights into their maternal haplogroup distribution and underlying genetic implications. Firstly, the TJ group exhibited a high level of genetic diversity, with 128 distinct haplotypes identified among 131 individuals, indicating a complex maternal genetic background. The haplogroups identified from TJ group were predominantly classified under East Asian-specific lineages, highlighting the group’s regional genetic characteristics. The mtDNA haplogroups of the TJ group were predominantly aligned with those prevalent in southern East Asia, accounting for approximately 54.96% (like B, F, M7, M9 and N9a) (Wen et al., 2004; Li et al., 2007b; Kong et al., 2010; Zhou et al., 2014). Additionally, approximately 38.17% of the haplogroups belonged to northern East Asian-dominating lineages, such as A, D, G, and M8 (Wen et al., 2004; Zhou et al., 2014). A similar maternal haplogroup distribution was observed among the Tujia group in Guizhou, based on a partial mtDNA fragment (Li et al., 2007a). This haplotype distribution likely reflected the complex evolutionary history and maternal genetic structure of the TJ group.
4.2 Descriptive statistical indexes
According to the Hd, S and K values, the TJ group exhibited exceptionally high genetic diversity. High haplotype diversity often indicates historical admixture and a large effective population size, contributing to genetic variability (Nei and Roychoudhury, 1974; Rosenberg et al., 2002; Gautier and Vitalis, 2013; Miró-Herrans and Mulligan, 2013). The most prevalent haplogroups in the TJ group are B, F, and D, with B4, F1, and D4 being the most significant sub-haplogroups. The S and K values for these haplogroups suggested high nucleotide diversity, possibly reflecting accumulated genetic variation over time. Interestingly, the M8 haplogroup, despite having a relatively lower Hd value, exhibited high K and Pi values, indicating significant genetic differentiation within this haplogroup. This suggested that while M8 might be less diverse overall, certain lineages within it had accumulated substantial genetic variation (Ingman et al., 2000), such as C7 haplogroup. The significantly negative values of Tajima’s D and Fu’s FS indicated recent population expansion or selective sweeps, implying rapid population growth or significant selection pressures in the TJ group (Tajima, 1989). The unimodal pattern observed in the mismatch distribution analysis of the Tujia was characteristic of a population that has undergone recent expansion. The SSD and HRI values indicated no significant deviation from the expected population expansion model, reinforcing the hypothesis of recent demographic growth (Rogers and Harpending, 1992).
4.3 Bayesian skyline plot and phylogenetic tree analyses
The BSP analysis of the TJ group provides valuable insights into its demographic history. Phylogenetic tree analysis revealed mtDNA lineages associated with the TJ group expansion event, providing detailed insights into human population dynamics. Initially, the TJ group’s population size increased during ~50 to ~35 kya. Large haplogroups, such as F, B, and D, experienced expansions, likely driven by favorable climatic and environmental conditions that enabled human populations to thrive and disperse. These findings align with the hypothesis that anatomically modern humans migrated to East Asia around 60–50 kya (Mellars, 2006; López et al., 2015). Following the initial increase, the TJ group experienced a prolonged period of relative stability in population size, spanning ~35 to 20 kya. This stability likely reflected a period of environmental and ecological equilibrium during the Late Pleistocene, as populations adapted to local environments and resources without significant changes in size (Sánchez Goñi, 2022). Furthermore, the period of initial expansion (~16 to ~9 kya) following the LGM was marked by notable diversification of mtDNA lineages, including subgroups such as F1a, B4d, and D4, among others. This expansion might correspond to the Holocene climatic amelioration, which provided more hospitable conditions for human populations, leading to expansions in many parts of the world (Richerson et al., 2001). The peak growth rate occurred around 11 to 12 kya, suggesting a significant population increase, likely due to improved environmental conditions and the development of new technologies and subsistence strategies, such as those seen in the subsequent Neolithic period (Bellwood and Oxenham, 2008). Finally, the last expansion period, ~4 kya, exhibited sporadic expansion of mtDNA lineages, suggesting localized events possibly driven by complex social or environmental factors within the TJ group. Historically, the policies implemented by the regime also had a profound impact on the development and expansion of the TJ group (Jiang and Luan, 2014; Zhu, 2023). Moreover, the dispersal of rice farming from the Yangtze River Basins played a critical role in shaping the genetic landscape of southern East Asian populations, including the TJ group (Fuller, 2012; D’Alpoim Guedes and Butler, 2014; He et al., 2024b; Wang et al., 2024).
4.4 Genetic relationship analyses between TJ and worldwide modern populations
We initially performed AMOVA to analyze genetic variation within and among populations. The PCA and FSTwere subsequently conducted to assess the genetic relationships between TJ group and worldwide populations. The shared haplotype analyses were further performed to investigate the genetic factors underlying population clustering. The abovementioned analyses were conducted on 1,987 haplotypes and 408 compressed haplogroups to assess the impact of two genetic levels on the population clustering patterns. Finally, we performed networks and phylogenetic tree analyses at the individual level to gain a comprehensive understanding of the maternal genetic relationships between the TJ group and worldwide populations.
The AMOVA on the TJ group and worldwide populations highlighted the intricate relationships between genetic structure and factors such as geography and linguistics. Interestingly, the genetic variation among language groups was higher than among geographic groups, indicating that language might play a significant role in influencing genetic diversity. It has been reported that language can serve as a proxy for cultural identity, influencing mating patterns and social interactions, which in turn shape genetic structures (Cavalli-Sforza, 1997; Greenhill, 2021).
Whether based on 1,987 mitochondrial haplotypes or 408 compressed haplogroups, both PCA and FST results highlighted the clustering between the TJ group and Sino-Tibetan populations, suggesting shared genetic ancestry or historical gene flow among these populations. The low differentiation is particularly notable in populations such as CHS and CHB (Wright, 1984), indicating extensive historical gene flow or a shared evolutionary history. Although the total number of individuals in the Sino-Tibetan populations was relatively small, the polymorphism of shared haplotypes distribution was higher and evenly dispersed, indicating relatively similar maternal haplotype distribution patterns between the TJ group and the Sino-Tibetan populations. The clustering results based on the Networks revealed that the TJ group and Han populations had closer maternal genetic relationships, which was basically consistent with the results of PCA and FST. The intimate genetic relationships between the TJ group and Han populations were supported by several studies using different types of genetic markers. For instance, He et al. identified significant genetic admixture between Tujia and central Han Chinese populations based on 600K SNPs, with both groups sharing ancestry from northern and southern East Asian populations (He et al., 2021). Zhang et al. reinforced these findings based on 23 STR loci, revealing high genetic similarity between the Tujia and Han populations in Hunan and Hubei, which could be attributed to shared ancestry or genetic communication in adjacent areas (Zhang et al., 2021). Luo et al. (2020) and Lan et al. (2023) also emphasized genetic homogeneity between Tujia and Han populations through genetic analyses of 19 X-STRs and 57 autosomal InDel loci. The intimate paternal relationship between the Tujia and Han populations was demonstrated by Y-STR analyses (Yang et al., 2014; Liu et al., 2019). Correspondingly, the PCA and FST analyses revealed obvious clustering between the TJ and Tai-Kadai populations based on 1,987 haplotypes and 408 haplogroups, implying the occurrence of historical genetic exchange between these populations. Particularly, some Tai-Kadai populations exhibited low genetic differentiation with the TJ group (Wright, 1984), including DON, BOU, CTT, and LAO. According to the haplotypes sharing results, several particular haplogroups tended to dominate, such as F1a1, M7b1a1 and M7b1a1a3 between the TJ and Tai-Kadai populations (Feng et al., 2022). The network results also indicated that a significant number of TJ individuals were clustered with those from the Tai-Kadai language family, particularly DON and BOU from China, and YUT, CTT, and LUT from Southeast Asia. This clustering pattern basically aligned with the results obtained from PCA and FST. Relatively intimate genetic relationships between Tujia and some Tai-Kadai populations (Chinese Gelao and Dong group) have been reported based on various genetic markers, including partial mtDNA regions (Li et al., 2007a), X-STRs (Luo et al., 2020), and autosomal STRs (Li et al., 2023a). Previous studies also suggested that the genetic structure of the Tujia people might include southern ancestral components from the Tai-Kadai language family (He et al., 2021). Interestingly, the ancestors of these Tai-Kadai populations can be traced back to the ancient Bai-Yue tribe (Diller et al., 2008). A previous study also indicated that the Tujia group in Guizhou may have absorbed the genes of the ancient Bai-Yue tribes during their early migration and settlement (Li et al., 2007a). Additionally, the TJ group also demonstrated relatively close clustering relationships with Hmong-Mien populations in PCA. Particularly, certain Hmong-Mien populations exhibited low genetic divergence with the TJ group, such as YNM, SHE, and TIM, while others showed moderate genetic differentiation, such as VPA and THM (Wright, 1984). The TJ group shared numerous haplotypes with the Hmong-Mien populations, some of which were specific to the Hmong-Mien population, such as the haplotypes B5a1c1a, B5a1c1a1, and D4e1a3 (Chen et al., 2024a), indicating a certain historical gene flow between the TJ and Hmong-Mien populations. Genetic evidences from autosomal STRs (Sun et al., 2016; Li et al., 2023a), X-STRs (Luo et al., 2020; Yang et al., 2022), and Y-STRs (Yang et al., 2014; Feng et al., 2020) indicated relatively close genetic relationships between Tujia and Hmong-Mien populations, predominantly Chinese Miao group. Historically, during the late Qing Dynasty, the emperor abolished the Tusi system and initiated the policy of “Gaituguiliu (change-local-restore-mainstream),” which led to an influx of Han and Miao people into the Tujia regions (Tian, 2000; Zhu, 2002). The reform of “ Gaituguiliu “ brought more drastic and irreversible changes to the Tujia region, which entailed not only political reform but also cultural and linguistic shifts, further diluting the Tujia matrilineal gene pool (Tian, 2000). Currently, the Miao and Tujia groups are primarily geographically adjacent to each other in China, which may have facilitated genetic exchange between them to some extent.
However, genetic analyses based on 1,987 haplotypes and 408 compressed haplogroups also presented inconsistencies, such as those observed between the TJ group and the Austronesian populations. For example, compared with 1,987 haplotypes, the PCA based on 408 compressed haplogroups showed a closer clustering between the TJ group and Austronesian populations. Interestingly, we also found that the TJ group and Austronesian populations shared significantly more haplogroups (Supplementary Figure 6e). Yet, the number of shared haplotypes was notably limited (Figure 4e). Historical records indicated that the ancestors of the Tai-Kadai and Austronesian language family could be traced back to Bai-Yue tribe (Li, 2004). The TJ group might have absorbed genetic contributions from the ancient Bai-Yue during its early migration and settlement (Li et al., 2007a). Thus, we hypothesized that early maternal gene flow might occur between the TJ group and the Austronesian populations, followed by subsequent population development, which contributed to the emergence of distinct haplotypes.
Although the TJ group belongs to the Tibeto-Burman language family (Grimes and Grimes, 2000), we did not observe obvious population clustering between the TJ group and Tibeto-Burman populations in the PCA and FST analyses, indicating that the maternal genetic structures between them might be relatively distant. However, haplotype sharing analyses revealed that the TJ group still shared a substantial number of haplotypes with Tibeto-Burman populations, such as F1d1 and M13a1b, which were further confirmed in the network analyses. Specifically, it was reported that Haplogroup M13a is a specific maternal lineage of Tibetans, and its sub-lineage M13a1 may have de novo origins within Tibetans (Zhao et al., 2009; Li et al., 2023b). The phylogenetic tree further confirmed the clustering pattern of the TJ and the Tibeto-Burman individuals within the M13a haplogroup in Supplementary Figure 8. Therefore, we speculated that the TJ group might still retain maternal imprints or have a certain amount of gene flow from Tibeto-Burman populations. Previous studies utilizing various genetic markers corroborated this hypothesis. For instance, Tan et al. examined genome-wide SNP loci and identified that some ancestors of the Tujia people may have had a close genetic affiliation with contemporary Tibetans (Tan et al., 2022).
Overall, the genetic analysis of the TJ group reveals intricate relationships with diverse worldwide populations. It was worth mentioning that the FST values between the TJ group and the intercontinental reference populations were generally low, probably indicating that the genetic diversity within the TJ group was high. Relatively high genetic diversity within populations might reduce genetic differentiation from reference populations, likely reflecting a complex population history with multiple migration events and population interactions (Patterson et al., 2006). The close geographical proximity might lead to maternal genetic exchanges. The shared maternal haplotypes between the TJ and individuals of the surrounding populations, such as Han and Hmong-Mien, suggested that modern population mixing might influence the maternal genetic diversity of TJ group to some extent. Previous research indicated that the Tujia had extensive contact and horizontal migration with surrounding Chinese, Hmong-Mien, and Tai-Kadai languages (He et al., 2021). Genetic imprints may also play a crucial role in shaping the matrilineal genetic landscape of the studied TJ group, similar to that of the TJ group and Tibeto-Burman populations (Tan et al., 2022).
4.5 Genetic analyses between TJ and ancient populations
An intriguing aspect of this study is the clustering of the TJ group from the Yangtze River Basin with ancient populations from the Yellow River Basin. These ancient populations, dating from the Neolithic to the Early Bronze Age, overlap with the Yangshao and Miaozigou cultures of the Yellow River Basin. Archaeological evidence supports the “Northern origin hypothesis” of the Sino-Tibetan language family, linking its expansion to the Yangshao and Miaozigou cultures in northern China (Zhang et al., 2019; Wang et al., 2021; He et al., 2023; Li et al., 2024; Sun et al., 2024a, b). The Tibeto-Burman language family, a major branch of the Sino-Tibetan language family, traces its origins to these Neolithic farmers from the Yellow River Basin, who are considered the ancestors of modern Tibeto-Burman speakers (Sun et al., 2024b). This evidence may partially explain why the TJ group clustered with ancient populations from the Yellow River Basin in this study. Furthermore, the TJ group occupies a unique position within the Tibeto-Burman family. In our population genetic analyses of PCA and FST, the TJ group did not cluster with other Tibeto-Burman groups, potentially due to significant differences in geographical environment and cultural background, which likely contributed to distinct maternal genetic structures. Nevertheless, Individual-based analyses revealed that the TJ group retains numerous common haplotypes with both modern and ancient Tibeto-Burman populations, including D4b2b, F1d1, and G2a1, etc.
5 Conclusion
In this study, the intricate maternal genetic structure of the Tujia people was unveiled by sequencing the complete mitochondrial genome of individuals from Chongqing Municipality. The findings disclosed a notable presence of maternal haplotypes prevalent in both southern and northern East Asia, particularly in southern East Asia, indicating a diverse genetic background for the Tujia group. BSP analysis revealed significant population expansion events across different historical periods, and phylogenetic tree evaluations pinpointed specific mtDNA lineages linked to these phases of population expansion. Population analyses suggested that recent population admixture or ancient common genetic origins might play significant roles in shaping the observed genetic diversity patterns of studied TJ group, like Sino-Tibetan and Hmong-Mien linguistic families. Particularly, Tujia exhibited significant overlap in haplogroups with the Tai-Kadai and Austronesian populations, possibly supporting the hypothesis that the Tujia might have absorbed maternal genes from the ancient Bai-Yue tribe. Further, a potential contribution of Tibetan ancestors to the maternal heritage of the studied TJ might occur. The Yangshao or Miaozigou cultures of the Yellow River Basin might have contributed to the development of matrilineal structure of the TJ group, or possibly influenced its formation. Moreover, given the intricate maternal genetic architecture of the Tujia, it is necessary to procure additional samples from diverse regions across China, which is crucial for obtaining a more thorough comprehension of their maternal genetic composition and elucidating the nuances of their population history dynamics.
Data availability statement
The original contributions presented in the study are included in the article/Supplementary Material. Further inquiries can be directed to the corresponding author.
Ethics statement
The studies involving humans were approved by Ethics Committee of Chongqing Medical University. The studies were conducted in accordance with the local legislation and institutional requirements. The participants provided their written informed consent to participate in this study.
Author contributions
CC: Data curation, Formal analysis, Resources, Writing – original draft, Conceptualization, Investigation, Funding acquisition, Writing – review & editing, Validation, Methodology. MC: Formal analysis, Writing – review & editing, Methodology, Investigation, Validation, Data curation. LLu: Methodology, Resources, Investigation, Writing – review & editing, Project administration. YZ: Visualization, Data curation, Resources, Validation, Writing – review & editing, Methodology. HC: Resources, Conceptualization, Writing – review & editing, Investigation, Formal analysis, Visualization. MZ: Formal analysis, Data curation, Writing – review & editing, Conceptualization, Investigation. YC: Writing – review & editing, Software, Methodology, Data curation, Investigation. YL: Formal analysis, Data curation, Writing – review & editing, Methodology, Investigation. LLa: Conceptualization, Data curation, Methodology, Writing – review & editing, Investigation. CS: Conceptualization, Project administration, Writing – review & editing, Supervision, Resources, Visualization. JL: Supervision, Project administration, Visualization, Formal analysis, Writing – review & editing, Resources.
Funding
The author(s) declare that financial support was received for the research and/or publication of this article. This study was funded by the Chongqing post-doctoral Science Foundation (CSTB2023NSCQ-BHX0161) and the Major Program of the National Natural Science Foundation of China (82471917).
Acknowledgments
Gratitude is expressed to Professor Chunmei Shen and Jianbo Li for their invaluable guidance throughout this study. Appreciation is also extended to Man Chen from the Shanghai Key Laboratory of Forensic Medicine for her continuous support and assistance. The contributions and unwavering support of colleagues from Chongqing Medical University in advancing this research are also deeply appreciated.
Conflict of interest
The authors declare that the research was conducted in the absence of any commercial or financial relationships that could be construed as a potential conflict of interest.
Generative AI statement
The author(s) declare that no Generative AI was used in the creation of this manuscript.
Publisher’s note
All claims expressed in this article are solely those of the authors and do not necessarily represent those of their affiliated organizations, or those of the publisher, the editors and the reviewers. Any product that may be evaluated in this article, or claim that may be made by its manufacturer, is not guaranteed or endorsed by the publisher.
Supplementary material
The Supplementary Material for this article can be found online at: https://www.frontiersin.org/articles/10.3389/fevo.2025.1636099/full#supplementary-material
References
Andrews R. M., Kubacka I., Chinnery P. F., Lightowlers R. N., Turnbull D. M., and Howell N. (1999). Reanalysis and revision of the cambridge reference sequence for human mitochondrial DNA. Nat. Genet. 23, 147–147. doi: 10.1038/13779
Association WM (2013). World medical association declaration of helsinki: Ethical principles for medical research involving human subjects. JAMA 310, 2191–2194. doi: 10.1001/jama.2013.281053
Bellwood P. and Oxenham M. (2008). “The expansions of farming societies and the role of the neolithic demographic transition,” in The neolithic demographic transition and its consequences. Eds. : Bocquet-Appel J.-P. and Bar-Yosef O. (Springer Netherlands, Dordrecht), 13–34.
Bergstrom A., McCarthy S. A., Hui R., Almarri M. A., Ayub Q., Danecek P., et al. (2020). Insights into human genetic variation and population history from 929 diverse genomes. Science 367, 1339. doi: 10.1126/science.aay5012
Cavalli-Sforza L. L. (1997). Genes, peoples, and languages. Proc. Natl. Acad. Sci. 94, 7719–7724. doi: 10.1073/pnas.94.15.7719
Chen C., Guo Y., Fang Y., Shi J., Meng H., Qu L., et al. (2024a). The maternal phylogenetic insights of yunnan miao group revealed by complete mitogenomes. Gene 901, 148046. doi: 10.1016/j.gene.2023.148046
Chen C., Li Y., Tao R., Jin X., Guo Y., Cui W., et al. (2020). The genetic structure of chinese hui ethnic group revealed by complete mitochondrial genome analyses using massively parallel sequencing. Genes (Basel) 11, 1352. doi: 10.3390/genes11111352
Chen J., Wang M., Duan S., Yang Q., Liu Y., Zhao M., et al. (2024b). Genetic history and biological adaptive landscape of the tujia people inferred from shared haplotypes and alleles. Hum. Genomics 18, 104. doi: 10.1186/s40246-024-00672-y
Clark P. U., Dyke A. S., Shakun J. D., Carlson A. E., Clark J., Wohlfarth B., et al (2009). The Last Glacial Maximum. Science 325, 710–714. doi: 10.1126/science.1172873
D’Alpoim Guedes J. and Butler E. E. (2014). Modeling constraints on the spread of agriculture to southwest China with thermal niche models. Quaternary Int. 349, 29–41. doi: 10.1016/j.quaint.2014.08.003
Drummond A. J. and Rambaut A. (2007). Beast: Bayesian evolutionary analysis by sampling trees. BMC Evolutionary Biol. 7, 214. doi: 10.1186/1471-2148-7-214
Excoffier L. and Lischer H. E. (2010). Arlequin suite ver 3.5: A new series of programs to perform population genetics analyses under linux and windows. Mol. Ecol. Resour 10, 564–567. doi: 10.1111/j.1755-0998.2010.02847.x
Feng Y., Zhang H., Wang Q., Jin X., Le C., Liu Y., et al. (2022). Whole mitochondrial genome analysis of tai-kadai-speaking populations in southwest China. Front. Ecol. Evol. 10. doi: 10.3389/fevo.2022.1000493
Feng R., Zhao Y., Chen S., Li Q., Fu Y., Zhao L., et al. (2020). Genetic analysis of 50 y-str loci in dong, miao, tujia, and yao populations from hunan. Int. J. Legal Med. 134, 981–983. doi: 10.1007/s00414-019-02115-z
Fuller D. (2012). Pathways to asian civilizations: Tracing the origins and spread of rice and rice cultures. Rice 4, 78–92. doi: 10.1007/s12284-011-9078-7
Gautier M. and Vitalis R. (2013). Inferring population histories using genome-wide allele frequency data. Mol. Biol. Evol. 30, 654–668. doi: 10.1093/molbev/mss257
GenomeAsia K. C. (2019). The genomeasia 100k project enables genetic discoveries across asia. Nature 576, 106–111. doi: 10.1038/s41586-019-1793-z
Gignoux C. R., Henn B. M., and Mountain J. L. (2011). Rapid, global demographic expansions after the origins of agriculture. Proc. Natl. Acad. Sci. 108, 6044–6049. doi: 10.1073/pnas.0914274108
Greenhill S. J. (2021). Do languages and genes share cultural evolutionary history? Sci. Adv. 7, eabm2472. doi: 10.1126/sciadv.abm2472
Grimes B. F. and Grimes J. E. (2000). Ethnologue: Languages of the world (Dallas: SIL International), 867.
He G.-L., Li Y.-X., Wang M.-G., Zou X., Yeh H.-Y., Yang X.-M., et al. (2021). Fine-scale genetic structure of tujia and central han chinese revealing massive genetic admixture under language borrowing. J. Systematics Evol. 59, 1–20. doi: 10.1111/jse.12670
He G., Wang P., Chen J., Liu Y., Sun Y., Hu R., et al. (2024b). Differentiated genomic footprints suggest isolation and long-distance migration of hmong-mien populations. BMC Biol. 22, 18. doi: 10.1186/s12915-024-01828-x
He G., Wang M., Luo L., Sun Q., Yuan H., Lv H., et al. (2024a). Population genomics of central asian peoples unveil ancient trans-eurasian genetic admixture and cultural exchanges. hLife 2, 554–562. doi: 10.1016/j.hlife.2024.06.006
He G., Wang M., Miao L., Chen J., Zhao J., Sun Q., et al. (2023). Multiple founding paternal lineages inferred from the newly-developed 639-plex y-snp panel suggested the complex admixture and migration history of chinese people. Hum. Genomics 17, 29. doi: 10.1186/s40246-023-00476-6
He G., Yao H., Duan S., Luo L., Sun Q., Tang R., et al. (2025). Pilot work of the 10k chinese people genomic diversity project along the silk road suggests a complex east-west admixture landscape and biological adaptations. Sci. China Life Sci. 68, 914–933. doi: 10.1007/s11427-024-2748-4
Ingman M., Kaessmann H., Pääbo S., and Gyllensten U. (2000). Mitochondrial genome variation and the origin of modern humans. Nature 408, 708–713. doi: 10.1038/35047064
Jiang M. and Luan C. (2014). Policy changes and reason analysis of bureaucratization of native officers in Guizhou in Qing Dynasty. Stud. Soc. Sci. 5, 125. doi: 10.3968/5990
Kong Q.-P., Sun C., Wang H.-W., Zhao M., Wang W.-Z., Zhong L., et al. (2010). Large-scale mtdna screening reveals a surprising matrilineal complexity in east asia and its implications to the peopling of the region. Mol. Biol. Evol. 28, 513–522. doi: 10.1093/molbev/msq219
Kutanan W., Kampuansai J., Srikummool M., Kangwanpong D., Ghirotto S., Brunelli A., et al. (2017). Complete mitochondrial genomes of thai and lao populations indicate an ancient origin of austroasiatic groups and demic diffusion in the spread of tai-kadai languages. Hum. Genet. 136, 85–98. doi: 10.1007/s00439-016-1742-y
Lan J., Zhang X., Cui W., Mei S., Xu J., and Zhu B. (2023). Genetic polymorphisms and population genetic analyses of 57 autosomal indel loci in hubei tujia group. Front. Genet. 14. doi: 10.3389/fgene.2023.1066655
Li H. (2004). Yellow washed Brown down: A Tale of Modern Human in Far East. J. at. Dr Sun Yat-sen Memorial Hall 164–180.
Li H., Cai X., Winograd-Cort E. R., Wen B., Cheng X., Qin Z., et al. (2007b). Mitochondrial DNA diversity and population differentiation in southern east asia. Am. J. Phys. Anthropol 134, 481–488. doi: 10.1002/ajpa.20690
Li S., Chai S., Yu L., Zhang T., Liu Z., Lei Y., et al. (2023a). Genetic diversity of 23 str loci of the guizhou tujia ethnic minority and the phylogenetic relationships with 22 other populations. Ann. Hum. Biol. 50, 345–350. doi: 10.1080/03014460.2023.2224971
Li Y. C., Gao Z. L., Liu K. J., Tian J. Y., Yang B. Y., Rahman Z. U., et al. (2023c). Mitogenome evidence shows two radiation events and dispersals of matrilineal ancestry from northern coastal China to the americas and Japan. Cell Rep. 42, 112413. doi: 10.1016/j.celrep.2023.112413
Li X., Wang M., Su H., Duan S., Sun Y., Chen H., et al. (2024). Evolutionary history and biological adaptation of han chinese people on the Mongolian plateau. hLife 2, 296–313. doi: 10.1016/j.hlife.2024.04.005
Li X., Zhang X., Yu T., Ye L., Huang T., Chen Y., et al. (2023b). Whole mitochondrial genome analysis in highland tibetans: Further matrilineal genetic structure exploration. Front. Genet. 14. doi: 10.3389/fgene.2023.1221388
Li B., Zhong F., Yi H., Wang X., Li L., Wang L., et al. (2007a). Genetic polymorphism of mitochondrial DNA in dong, gelao, tujia, and yi ethnic populations from guizhou, China. J. Genet. Genomics 34, 800–811. doi: 10.1016/S1673-8527(07)60091-5
Librado P. and Rozas J. (2009). Dnasp v5: A software for comprehensive analysis of DNA polymorphism data. Bioinformatics 25, 1451–1452. doi: 10.1093/bioinformatics/btp187
Liu Y., Mao J., Zhu C., Li X., and Shi M. (2019). Genetic polymorphisms of 27 y-str loci in tujia and hui population and the cluster analysis of 13 ethnic groups. Basic Clin. Med. 39, 314–320. doi: 10.16352/j.issn.1001-6325.2023.08.1322
López S., van Dorp L., and Hellenthal G. (2015). Human dispersal out of africa: A lasting debate. Evol. Bioinform. Online 11, 57–68. doi: 10.4137/EBO.S33489
Luo L., Gao H., Yao L., Long F., Zhang H., Zhang L., et al. (2020). Genetic diversity, forensic feature, and phylogenetic analysis of guizhou tujia population via 19 x-strs. Mol. Genet. Genomic Med. 8, e1473. doi: 10.1002/mgg3.1473
Luo L., Wang M., Liu Y., Li J., Bu F., Yuan H., et al. (2025). Sequencing and characterizing human mitochondrial genomes in the biobank-based genomic research paradigm. Sci. China Life Sci. 68, 1610–1625. doi: 10.1007/s11427-024-2736-7
Mellars P. (2006). Why did modern human populations disperse from africa ca. 60,000 years ago? A new model. Proc. Natl. Acad. Sci. 103, 9381–9386. doi: 10.1073/pnas.0510792103
Miró-Herrans A. T. and Mulligan C. J. (2013). Human demographic processes and genetic variation as revealed by mtdna simulations. Mol. Biol. Evol. 30, 244–252. doi: 10.1093/molbev/mss230
Nei M. and Roychoudhury A. K. (1974). Sampling variances of heterozygosity and genetic distance. Genetics 76, 379–390. doi: 10.1093/genetics/76.2.379
Patterson N., Price A. L., and Reich D. (2006). Population structure and eigenanalysis. PloS Genet. 2, e190. doi: 10.1371/journal.pgen.0020190
Richerson P. J., Boyd R., and Bettinger R. L. (2001). Was agriculture impossible during the pleistocene but mandatory during the holocene? A climate change hypothesis. Am. Antiquity 66, 387–411. doi: 10.2307/2694241
Rogers A. R. and Harpending H. (1992). Population growth makes waves in the distribution of pairwise genetic differences. Mol. Biol. Evol. 9, 552–569. doi: 10.1093/oxfordjournals.molbev.a040727
Rosenberg N. A., Pritchard J. K., Weber J. L., Cann H. M., Kidd K. K., Zhivotovsky L. A., et al. (2002). Genetic structure of human populations. Science 298, 2381–2385. doi: 10.1126/science.1078311
Sagart L., Jacques G., Lai Y., Ryder R. J., Thouzeau V., Greenhill S. J., et al. (2019). Dated language phylogenies shed light on the ancestry of sino-tibetan. Proc. Natl. Acad. Sci. U.S.A. 116, 10317–10322. doi: 10.1073/pnas.1817972116
Sánchez Goñi M. F. (2022). “The climatic and environmental context of the late pleistocene,” in Updating neanderthals. Eds. Romagnoli F., Rivals F., and Benazzi S. (Amsterdam: Elsevier), 17–38.
Soares P., Ermini L., Thomson N., Mormina M., Rito T., Röhl A., et al. (2009). Correcting for purifying selection: An improved human mitochondrial molecular clock. Am. J. Hum. Genet. 84, 740–759. doi: 10.1016/j.ajhg.2009.05.001
Sun Q., Wang M., Lu T., Duan S., Liu Y., Chen J., et al. (2024a). Differentiated adaptative genetic architecture and language-related demographical history in south China inferred from 619 genomes from 56 populations. BMC Biol. 22, 55. doi: 10.1186/s12915-024-01854-9
Sun Y., Wang M., Sun Q., Liu Y., Duan S., Wang Z., et al. (2024b). Distinguished biological adaptation architecture aggravated population differentiation of tibeto-burman-speaking people. J. Genet. Genomics 51, 517–530. doi: 10.1016/j.jgg.2023.10.002
Sun H., Xu S., Long F., Luo J., Lin X., Jin L., et al. (2016). Forensic and population genetic analysis of han, miao, tujia and gelao populations from zunyi (southwest China) on 15 autosomal short tandem repeat loci. Forensic Sci. International: Genet. 25, e20–e21. doi: 10.1016/j.fsigen.2016.08.007
Tajima F. (1989). Statistical method for testing the neutral mutation hypothesis by DNA polymorphism. Genetics 123, 585–595. doi: 10.1093/genetics/123.3.585
Taliun D., Harris D. N., Kessler M. D., Carlson J., Szpiech Z. A., Torres R., et al. (2021). Sequencing of 53,831 diverse genomes from the nhlbi topmed program. Nature 590, 290–299. doi: 10.1038/s41586-021-03205-y
Tan H., Wang R., and Wang C.-C. (2022). Fine-scale genetic profile and admixture history of two hmong-mien–speaking miao tribes from southwest China inferred from genome-wide data. Hum. Biol. 93, 179–199. doi: 10.1353/hub.2021.0010
Wang M., Duan S., Li X., Yang J., Yuan H., Liu C., et al. (2025a). Genome-driven chinese precision medicine: Biobank-scale genomic research as a new paradigm. Innovation Life 3, 100131. doi: 10.59717/j.xinn-life.2025.100131
Wang M., Huang Y., Liu K., Wang Z., Zhang M., Yuan H., et al. (2024). Multiple human population movements and cultural dispersal events shaped the landscape of chinese paternal heritage. Mol. Biol. Evol. 41, msae122. doi: 10.1093/molbev/msae122
Wang Z., Liu K., Yuan H., Duan S., Liu Y., Luo L., et al. (2025d). Yanhuang paternal genomic resource suggested a weakly-differentiated multi-source admixture model for the formation of han’s founding ancestral lineages. Genomics Proteomics Bioinf. qzaf049. doi: 10.1093/gpbjnl/qzaf049
Wang M., Luo L., Yeh H.-Y., Wang C.-C., Yuan H., Liu C., et al. (2025b). Mighty oaks from little acorns: High-quality genomes of underrepresented populations enhance health equity in precision medicine. hLife. 1–5. doi: 10.1016/j.hlife.2025.05.014
Wang M., Sun Q., Feng Y., Wei L. H., Liu K., Luo L., et al. (2025c). Paleolithic divergence and multiple neolithic expansions of ancestral nomadic emperor-related paternal lineages. J. Genet. Genomics 52, 502–512. doi: 10.1016/j.jgg.2024.11.012
Wang C. C., Yeh H. Y., Popov A. N., Zhang H. Q., Matsumura H., Sirak K., et al. (2021). Genomic insights into the formation of human populations in east asia. Nature 591, 413–419. doi: 10.1038/s41586-021-03336-2
Wang Y., Zou X., Wang M., Yuan D., Yang L., Zeng Y., et al. (2022). The genomic history of southwestern chinese populations demonstrated massive population migration and admixture among proto-hmong-mien speakers and incoming migrants. Mol. Genet. Genomics 297, 241–262. doi: 10.1007/s00438-021-01837-3
Wen B., Li H., Lu D., Song X., Zhang F., He Y., et al. (2004). Genetic evidence supports demic diffusion of han culture. Nature 431, 302–305. doi: 10.1038/nature02878
Wright S. (1984). Variability within and among natural populations. In Evolution and the genetics of populations (Chicago: University of Chicago press), 590.
Yang Y. R., Jing Y. T., Zhang G. D., Fang X. D., and Yan J. W. (2014). Genetic analysis of 17 y-chromosomal str loci of chinese tujia ethnic group residing in youyang region of southern China. Leg Med. (Tokyo) 16, 173–175. doi: 10.1016/j.legalmed.2014.01.010
Yang Q., Sun Y., Duan S., Nie S., Liu C., Deng H., et al. (2025). High-quality population-specific haplotype-resolved reference panel in the genomic and pangenomic eras. Genomics Proteomics Bioinf. qzaf022. doi: 10.1093/gpbjnl/qzaf022
Yang M., Zhang R., Jin X., Ren Z., Wang Q., Luo W., et al. (2022). Forensic characteristic of 19 x-strs in chuanqing, tujia and yi groups from guizhou province and their genetic relationships with other reference populations. Gene Rep. 27, 101553. doi: 10.1016/j.genrep.2022.101553
Zhang M., Yan S., Pan W., and Jin L. (2019). Phylogenetic evidence for sino-tibetan origin in northern China in the late neolithic. Nature 569, 112–115. doi: 10.1038/s41586-019-1153-z
Zhang L., Yang F., Bai X., Yao Y., and Li J. (2021). Genetic polymorphism analysis of 23 str loci in the tujia population from chongqing, southwest China. Int. J. Legal Med. 135, 761–763. doi: 10.1007/s00414-020-02287-z
Zhao M., Kong Q.-P., Wang H.-W., Peng M.-S., Xie X.-D., Wang W.-Z., et al. (2009). Mitochondrial genome evidence reveals successful late paleolithic settlement on the tibetan plateau. Proc. Natl. Acad. Sci. 106, 21230–21235. doi: 10.1073/pnas.0907844106
Zhou H. Y., Wang H. W., Tan S. N., Chen Y., Wang W. L., Tao H. X., et al. (2014). Genetic affinities of central China populations. Genet. Mol. Res. 13, 616–625. doi: 10.4238/2014.January.28.7
Zhu S. (2002). Distribution and transition of ethnic groups in tujia area during ming and qing dynasties. Collections Essays Chin. Historical Geogr. 17, 142–148.
Keywords: Tujia, Tibeto‐Burman, complete mitochondrial genome, population genetics, phylogenetics, MPS
Citation: Chen C, Chen M, Luo L, Zhu Y, Chen H, Zhao M, Cao Y, Li Y, Lan L, Shen C and Li J (2025) Decoding maternal genetic background of Chinese Tujia people through extensive mitochondrial genome analyses. Front. Ecol. Evol. 13:1636099. doi: 10.3389/fevo.2025.1636099
Received: 27 May 2025; Accepted: 30 June 2025;
Published: 22 July 2025.
Edited by:
Guanglin He, Sichuan University, ChinaReviewed by:
Yuhang Feng, Sichuan University, ChinaYu-Chun Li, Chinese Academy of Sciences (CAS), China
Copyright © 2025 Chen, Chen, Luo, Zhu, Chen, Zhao, Cao, Li, Lan, Shen and Li. This is an open-access article distributed under the terms of the Creative Commons Attribution License (CC BY). The use, distribution or reproduction in other forums is permitted, provided the original author(s) and the copyright owner(s) are credited and that the original publication in this journal is cited, in accordance with accepted academic practice. No use, distribution or reproduction is permitted which does not comply with these terms.
*Correspondence: Chunmei Shen, Y21zaGVuMjAwNEAxMjYuY29t; Jianbo Li, MTAwMzkwQGNxbXUuZWR1LmNu