 Hao Yang
 Qiang Zhang1*†
 Songlin Zhang
 Xufeng Wang
- 1Gansu Provincial Environmental Monitoring Station, Lanzhou, China
- 2School of Geography and Environmental Sciences, Northwest Normal University, Lanzhou, China
- 3Northwest Institute of Eco-Environment and Resources, Chinese Academy of Sciences, Lanzhou, China
- 4School of Civil Engineering, Hexi University, Zhangye, China
The spatiotemporal heterogeneity of urban vegetation phenology (UVP) has intensified due to coupled urban expansion and climate change, yet the systematic understanding of UVP responses along urban-rural gradients across diverse climatic contexts and urban expansion remains limited. Therefore, this study selected 31 Chinese cities across diverse climate zones and city sizes using multi-source remote sensing data (2001-2020) to quantify the synergistic effects of urban expansion and climate change on urban-rural UVP differences (ΔUVP). First, UVP in China exhibited advanced start of growing season (SOS), delayed end of growing season (EOS), and extended length of growing season (GSL), with more pronounced shifts in southeastern regions compared to northwestern zones. Furthermore, the magnitudes of SOS advancement, EOS delay, and GSL extension gradually decreased along the urban-rural gradient. ΔUVP in large cities was smaller than that in other city sizes, whereas arid and semi-arid zones exhibited significantly greater ΔUVP than humid and semi-humid zones. Second, ΔSOS, ΔEOS, and ΔGSL demonstrated predominantly negative, positive, and positive correlations with both urban heat island intensity (ΔLST) and urban expansion intensity (ΔISP), respectively. Medium cities demonstrated the maximum response magnitudes of ΔUVP to ΔLST compared to other city sizes, whereas small towns demonstrated the maximum response magnitudes of ΔUVP to ΔISP. The response magnitudes of ΔUVP to both ΔLST and ΔISP were significantly greater in arid and semi-arid zones than in humid and semi-humid zones. Finally, principal component analysis confirmed that urban factors predominantly drive ΔUVP variations, with ΔISP identified as the primary regulatory factor. These findings provide critical insights into urban vegetation dynamics under rapid expansion and climate change.
1 Introduction
Vegetation phenology, as a biological rhythm indicator formed by plants adapted to periodic environmental changes, serves as a sensitive indicator of ecosystem responses to climate change (Shen et al., 2018; Gong et al., 2024). Current research indicates that global warming has caused significant shifts in the spatiotemporal patterns of UVP (Liang et al., 2024; Mo et al., 2024; Chen and Zhang, 2023). Furthermore, widespread urban expansion globally has intensified the complexity of this process through modifications in the land-use patterns and the local urban climate (e.g., heat island effects) (Liu et al., 2023). Specifically, anthropogenic activities serve as the primary drivers through which urban expansion influences the spatiotemporal patterns of vegetation phenology. Practices such as land-use conversion, anthropogenic heat emissions, artificial irrigation, and fertilization can all alter vegetation phenological processes in and around urban areas. In contrast, the impact of climate change on vegetation phenology is a coupled process of nature and human activities. For instance, the increase in greenhouse gas concentrations, global warming, and changes in precipitation patterns can also affect the phenological processes of vegetation on a regional or even global scale. Although the driving pathways of urban expansion and climate change on vegetation phenology are different, they also interact with each other to jointly regulate vegetation phenology. Firstly, the synergistic effect of the urban heat island (UHI) and global warming leads to increased urban temperatures, which may significantly alter the spatiotemporal differentiation patterns of UVP (Cheval et al., 2024). Secondly, the influences of climate change and urban expansion on vegetation phenology may also exhibit antagonistic effects. For instance, decreased precipitation frequency may lead to an earlier EOS of vegetation in the Northern Hemisphere (Zhang et al., 2025), whereas urban vegetation, sustained by artificial irrigation that maintains soil moisture and promotes carbohydrate accumulation, may experience a delayed EOS (Bühler et al., 2006). In summary, urban expansion and climate change interact through different mechanistic pathways to co-regulate vegetation phenology. Meanwhile, changes in vegetation phenology can, in turn, affect the urban ecological environment. Studies have shown that the ecosystem services provided by vegetation (e.g., thermal regulation) can significantly enhance urban resilience and serve as effective solutions to mitigate environmental issues like UHI effects (Tan et al., 2021). For instance, a 16% reduction in vegetation coverage in Guangzhou’s urban area increased land surface temperature by 2.5°C (Hu and Jia, 2010), while vegetation in London reduced summer nighttime UHI intensity by 1.1°C (Doick et al., 2014). Although cities occupy only 3%-5% of the global land surface, research on UVP changes can better capture the impacts of urban development on the natural vegetated environment, providing early signals of future changes in the natural biosphere. Additionally, despite being insular ecosystems, urban areas are intricately connected to the global biosphere through flows of materials, energy, and species. The stability of UVP directly influences the integrity of regional ecological networks and can progressively affect larger regions, even the global ecological sphere (Yang et al., 2023b). Therefore, investigating UVP variations induced by multi-scale climate drivers and urban expansion is crucial for developing climate-resilient urban ecological management frameworks (Qiu et al., 2020).
Conventional urban vegetation phenology studies primarily rely on ground-based manual phenological observations, yet the uneven spatial distribution and low density of urban phenological stations impose significant limitations on observational accuracy (Li et al., 2021). In contrast, satellite-based phenological monitoring offers substantial potential for quantifying vegetation phenological changes across local-to-global scales due to its spatiotemporal continuity (Kato et al., 2021; Zeng et al., 2020).Within the current context of rapid global urban expansion and climate warming, numerous studies utilizing long-term satellite data have identified the spatiotemporal differentiation patterns of UVP and their multi-scale driving mechanisms.
First, previous studies have identified vegetation SOS and EOS as the phenological parameters most sensitive to environmental changes, primarily manifested as SOS advancement and EOS delay (Liu et al., 2016). For instance, climate change has caused significant SOS advancement in 11.5% of global vegetation and extended GSL in 12.6% of vegetation (Fang et al., 2023). Additionally, climatic factors (e.g., temperature, precipitation) have been confirmed as the primary drivers of long-term phenological changes due to their fundamental roles in plant morphological and physiological adaptations (Gao and Zhao, 2022; Ranjan and Gorai, 2022). It is noteworthy that previous studies have extensively confirmed that in mid- to high-latitude or temperate regions, when ambient temperature is below the species-specific optimal growth threshold, rising temperatures promote an earlier SOS and a later EOS. However, when temperature exceeds the thermal threshold, elevated temperatures inhibit the activity of photosynthetic enzymes and exacerbate water loss through transpiration, consequently leading to a delayed SOS or an advanced EOS (Liu et al., 2024). Furthermore, this temperature-driven phenological response is additionally modulated by water stress in arid and semi-arid regions. Relevant studies indicate that the arid regions of Northwest China, being highly sensitive to global climate change, exhibit vegetation phenology that is co-controlled by the dual factors of temperature and water, with the regulatory effect of moisture often surpassing that of temperature (Wang et al., 2021). For instance, in areas of the Loess Plateau in Gansu Province with relatively sufficient precipitation, rising temperatures can still promote an earlier SOS and a later EOS. In contrast, in other regions where precipitation is insufficient, vegetation subjected to water stress exhibits a delayed SOS and an advanced EOS in response to temperature increases (Zhou et al., 2025). In arid and semi-arid regions, however, artificial irrigation contributes to maintaining the stability of urban vegetation phenological rhythms by partially alleviating water stress. Meanwhile, spatial variations in climate and vegetation types across latitudinal, longitudinal, and altitudinal gradients further modulate UVP (Gao et al., 2020). However, these studies predominantly focus on macroclimatic effects while overlooking localized climatic alterations induced by urban expansion (e.g., urban expansion intensity, heat island intensity) that drive phenological divergence between urban and non-urban vegetation. Secondly, current UVP research exhibits methodological limitations in spatial representation. Most studies concentrate on intra-urban phenological variations by taking the entire city as a single entity or using a simplistic urban-rural dichotomy. For example, 51% of 196 selected mid-latitude Northern Hemisphere cities demonstrated urban vegetation SOS advancement during post-urban expansion periods compared to pre-urban expansion phases, with 53% exhibiting EOS delays. And climate change remains the dominant driver of interannual UVP variations (Qiu et al., 2020). An urban-rural dichotomy analysis revealed that urban warming induced SOS advancement in 78% of urban backgrounds and 73% of rural backgrounds across 292 Chinese cities, with urban areas exhibiting significantly higher SOS advancement rates than rural counterparts (Wang et al., 2022). Nevertheless, the high intra-urban heterogeneity renders simplistic city-scale approaches or urban-rural dichotomies inadequate for characterizing continuous phenological responses along urban expansion gradients. Finally, some studies have adopted refined urban zoning strategies to investigate phenological variations across urban-rural gradients. These approaches typically partition cities into urban core, suburban, and rural areas, quantifying spatiotemporal differences in vegetation phenology along impervious surface percentage (ISP) gradients. Analysis of over 4500 U.S. urban clusters demonstrated distinct phenological responses to urbanization across gradient regions, with urban cores exhibiting earlier SOS, later EOS, and thus longer GSL compared to peripheral areas. A tenfold increase in city size was correlated with SOS advancement (~1.3 days), EOS delay (~2.4 days), and GSL extension (~3.6 days), indicating scale-dependent phenological response magnitudes to urbanization (Li et al., 2017). In over 1500 Chinese cities, SOS advancement and EOS delay along urban-rural gradients followed unimodal curves peaking in new urban districts (ΔSOS = -12.4 ± 18.5 days, ΔEOS = 3.8 ± 9.9 days). Climate change predominated over urbanization in driving interannual UVP variations across all urban zones (Ji et al., 2023). Despite adopting gradient-based zoning strategies, these studies still treated individual zones as discrete entities rather than continuous spatial gradients.
In summary, although current studies on UVP variations and their driving factors are relatively comprehensive and have confirmed that UVP is co-regulated by local urban expansion intensity and background climate change (Jin et al., 2019; Luo et al., 2020; Zhang et al., 2022), critical issues remain unresolved. Firstly, due to the significant heterogeneity of local landscapes within a city, the intensity of urban expansion varies considerably across different zones. Simply treating the city as a single entity or employing a simplistic urban-rural dichotomy to investigate intra-urban phenological changes may fail to accurately assess the relationship between driving factors and vegetation phenology. Concurrently, the peri-urban transitional zones (e.g., the urban-rural fringe) are areas where vegetation phenology responds most sensitively. Merging or overlooking these areas in an analysis could also lead to significant errors in the assessment results. Secondly, while previous studies have optimized urban zoning strategies, they have primarily focused on the interannual variations of UVP across different gradients while overlooking its continuity along the urban-rural gradient. This oversight leads to a failure in characterizing the impact of local climate changes induced by urban expansion on vegetation phenology. Consequently, such an approach may underestimate the contribution of urban expansion to UVP changes. Therefore, in this study, we established multiple buffers and formulated a zoning strategy based on the vegetation phenological changes within these different buffers to mitigate errors associated with urban transitional zones. Simultaneously, we assessed the continuous response of vegetation phenology to changes in urban expansion intensity along the urban-rural gradient, thereby enabling a more accurate characterization of the influence of local climate changes, driven by urban expansion, on vegetation phenology. In summary, a systematic understanding remains lacking regarding whether the response mechanisms of vegetation phenology to urban expansion along urban-rural gradients differ across city sizes and climatic contexts. Moreover, empirical evidence is still required to elucidate the gradient evolution of UVP and its dynamic response mechanisms to different urban expansion phases during prolonged urbanization processes. Therefore, this study employs continuous remote sensing data from the Moderate Resolution Imaging Spectroradiometer (MODIS) to quantitatively analyze the spatiotemporal differentiation patterns of ΔUVP and its response mechanisms to urban expansion under varying city sizes and climatic backgrounds. By integrating multi-source urban expansion indicators (urban population density, urban expansion intensity, and urban heat island intensity) with climatic factors (temperature, precipitation, and radiation), we specifically dissect the synergistic mechanisms of urban and climatic factors on ΔUVP along urban-rural gradients.
2 Materials and methods
2.1 Study area
China is situated at the convergence zone between eastern Eurasia and the western Pacific Rim (73°E–135°E, 19°N–55°N), characterized by a three-step topographic ladder descending from western highlands to eastern lowlands. The climate exhibits complex diversity, spanning tropical to cold-temperate zones from south to north, and transitioning from humid to arid zones east to west. Temperature decreases latitudinally while precipitation diminishes longitudinally from southeastern coasts to northwestern inland, forming distinct latitudinal and longitudinal climatic gradients. Vegetation distribution demonstrates latitudinal zonality and vertical zonality patterns, dominated by grassland, forest, cropland, and bare land ecosystems (as shown in Figure 1a). Additionally, rapid urban expansion over recent decades has significantly increased built-up areas and intensified urban heat island effects (Peng et al., 2018). By 2020, China’s urban population reached 1.41 billion, with its GDP reaching 103.49 trillion yuan. The country’s diverse climatic settings and accelerated urbanization provide an ideal laboratory for investigating long-term UVP dynamics and their response mechanisms. Therefore, this study selected 31 major Chinese cities (including 27 provincial capitals and 4 municipalities) and their surrounding regions (Figure 1b). These cities are distributed across distinct climate zones with divergent urbanization trajectories.
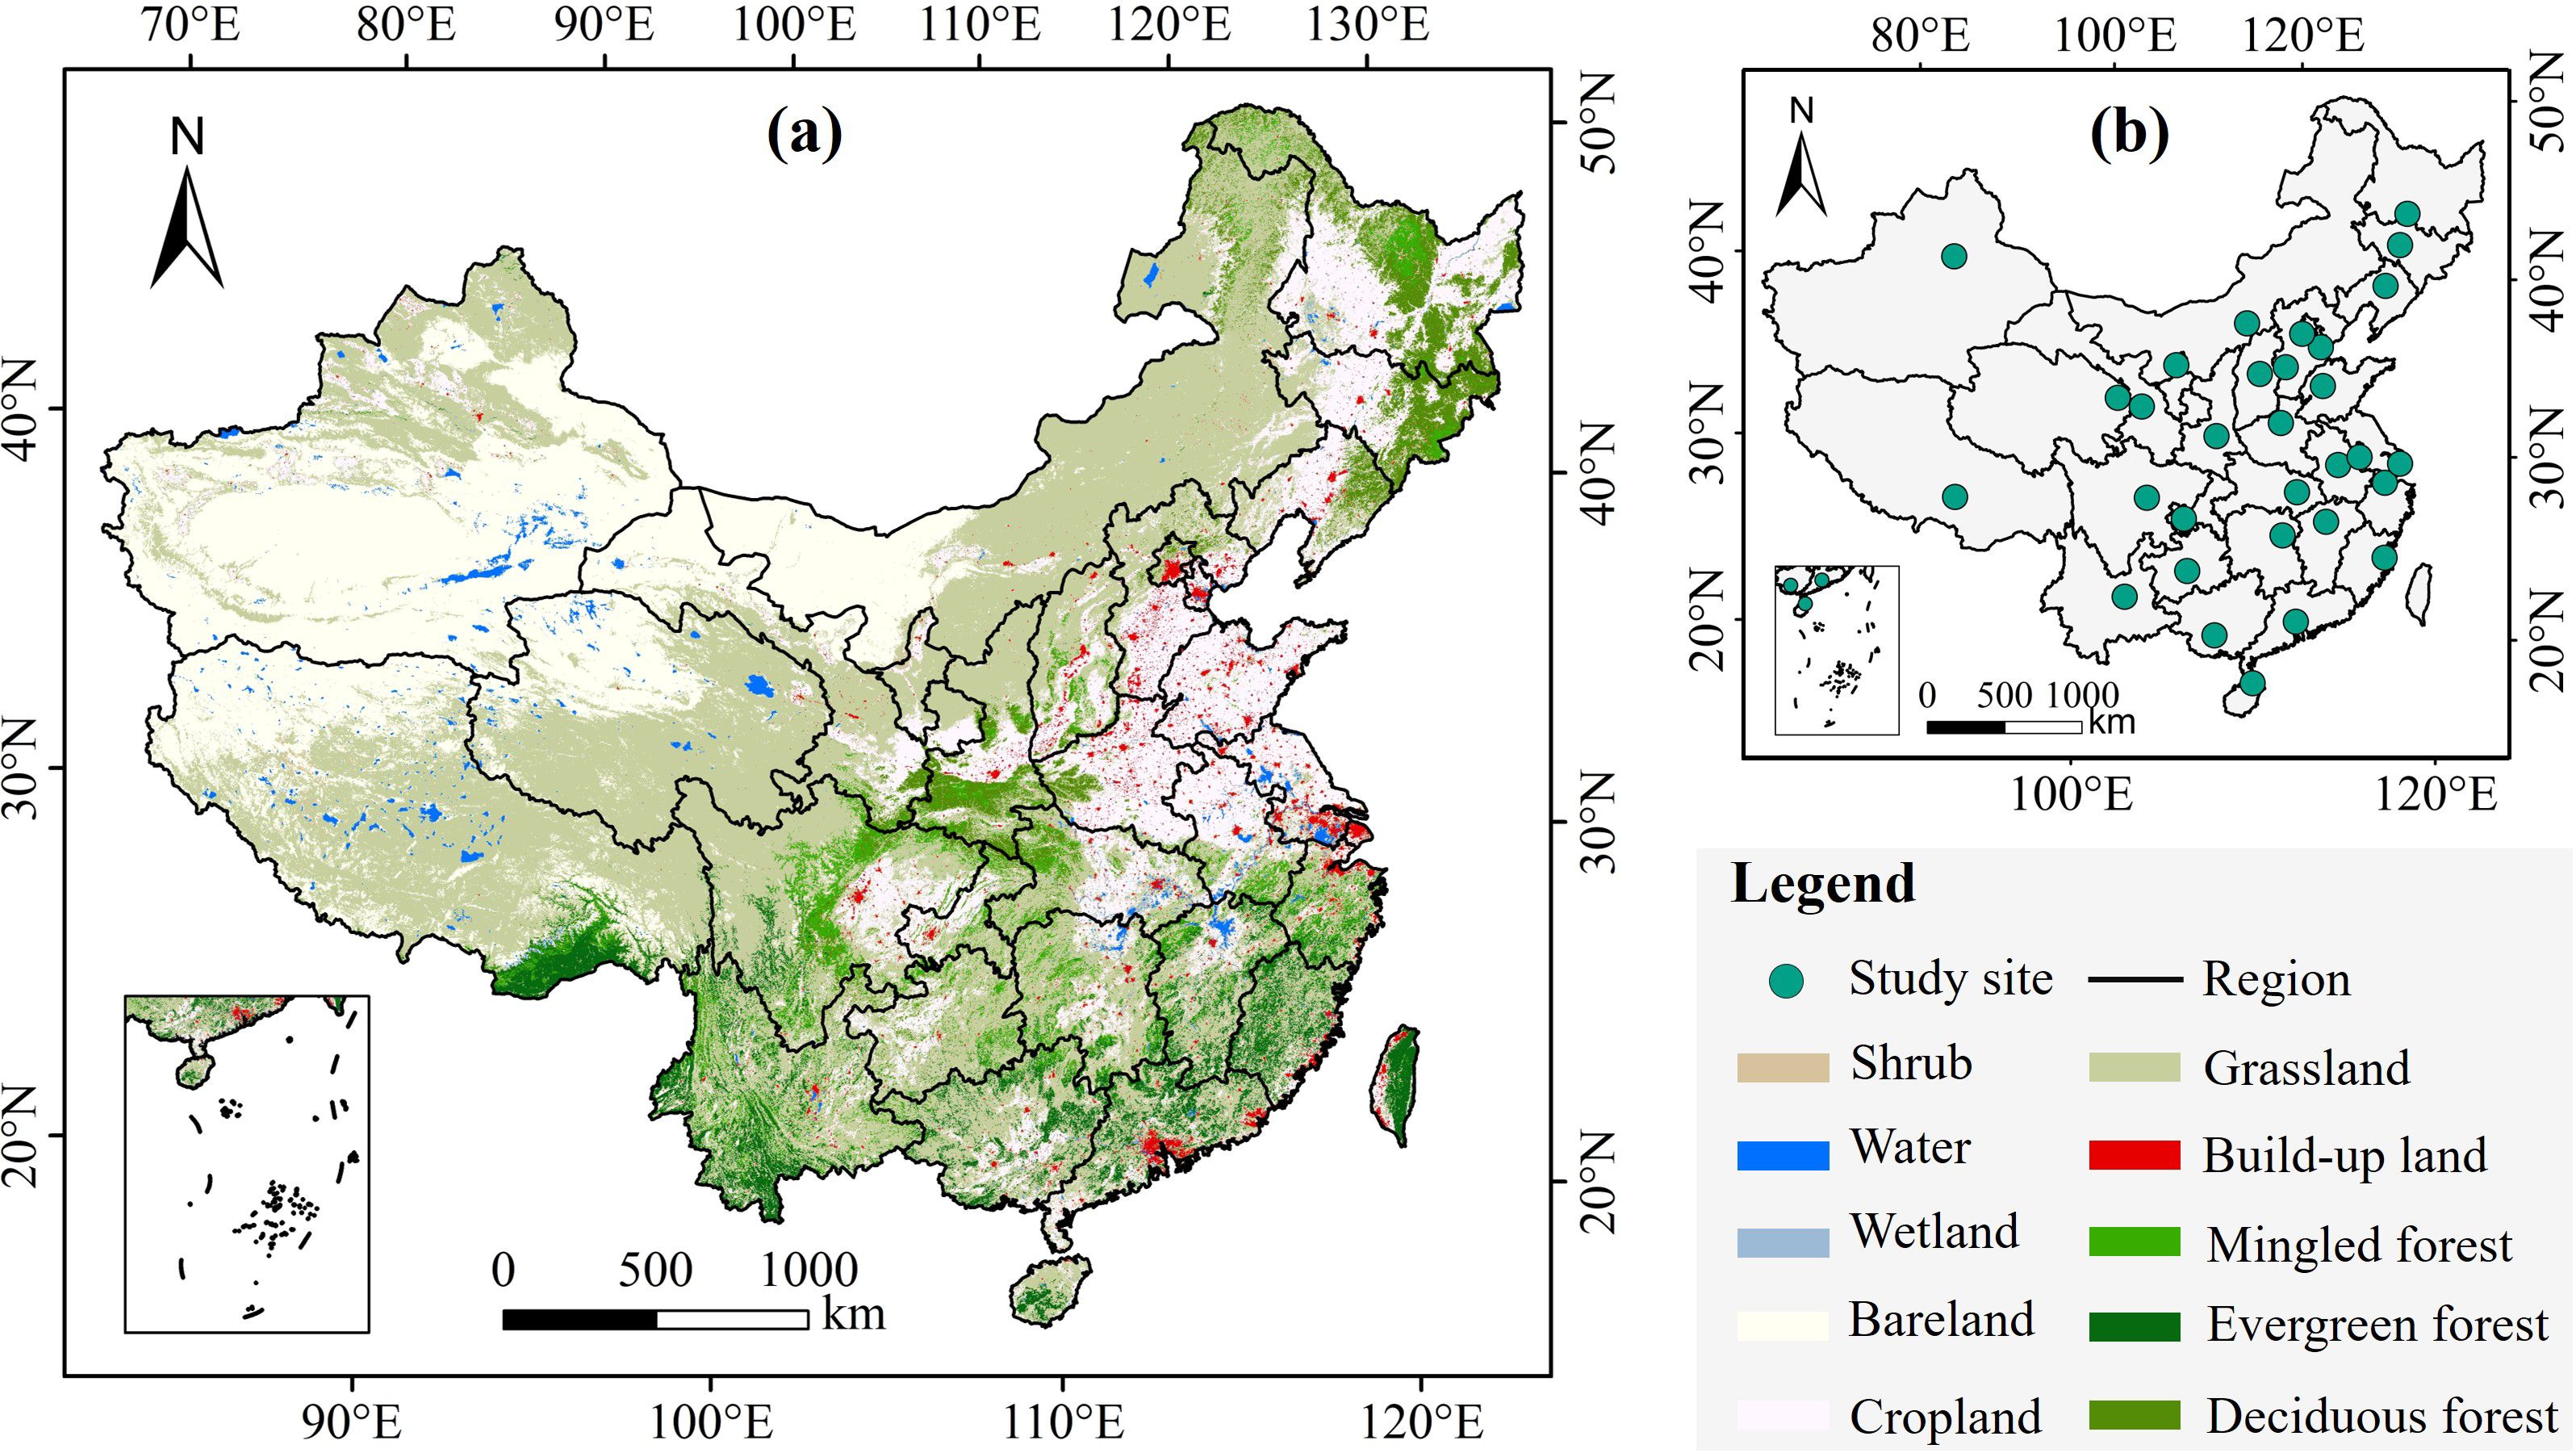
Figure 1. The distribution of (a) different vegetation types in China and (b) the locations of the 31 major cities. The land cover map was based on the MODIS Land Cover Type product (MCD12Q1) at 500 m resolution in 2020.
2.2 Data source
This study utilized multi-source remote sensing data, including Moderate Resolution Imaging Spectroradiometer (MODIS) data, reanalysis data, and auxiliary datasets (Table 1). Specifically, vegetation phenology data from 2001 to 2020 were obtained from the MODIS Land Cover Dynamics Yearly product (MCD12Q2 v6) at 500 m spatial resolution (https://lpdaac.usgs.gov/), which captures phenological metrics using the dynamic threshold method based on the MODIS Enhanced Vegetation Index (EVI). Since EVI reduces the effects of atmospheric and canopy background and exhibits higher sensitivity to minor variations in vegetation activity (Ishtiaque et al., 2016), it is a plausible source for monitoring urban vegetation dynamics with sparse vegetation (Dallimer et al., 2011; Yao et al., 2019). The land cover type data was derived from MODIS Land Cover data (MCD12Q1 v6) at 500 m spatial resolution over the same period with phenological information (https://search.earthdata.nasa.gov/search/). The University of Maryland (UMD) classification scheme was applied to exclude pixels categorized as cropland. Land surface temperature (LST) data from 2001 to 2020 were obtained from NASA’s Terra satellite MODIS product (MOD11A2). This dataset provides 8-day composite averages of clear-sky LST at 1 km spatial resolution. The LST data were used to quantify surface urban heat island intensity and investigate the impacts of urban drivers on urban vegetation phenology (https://earthdata.nasa.gov/).
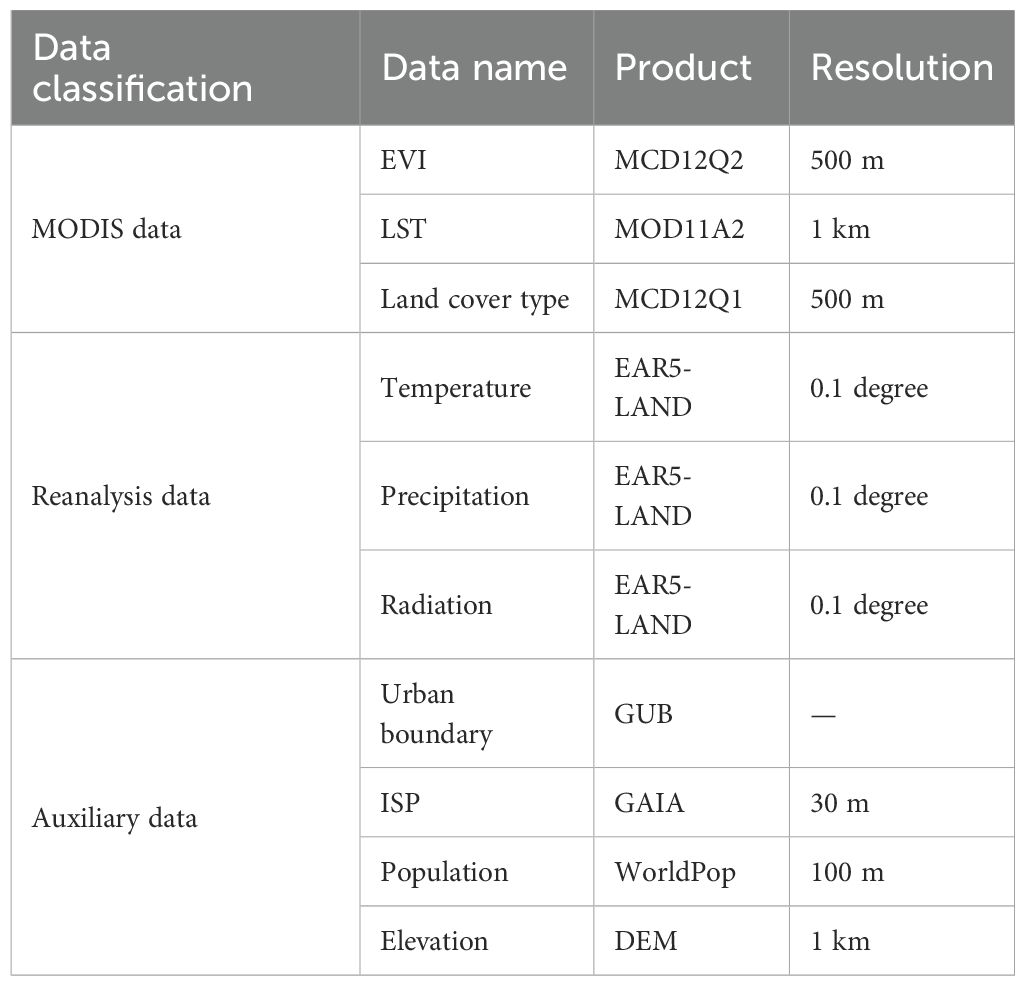
Table 1. Data details used in this study.
The reanalysis data, including temperature, precipitation, and radiation data from 2001 to 2020, were obtained from the ERA5-Land Monthly Averaged product. This product integrates numerous observations worldwide into a global dataset with strong integrity and consistency, with a spatial resolution of 0.1 degrees (approximately 11 km). These data were used to quantify climate factors including temperature, precipitation and radiation, and to investigate the impacts of climate change on UVP (https://cds.climate.copernicus.eu/).
The auxiliary datasets include urban boundaries, impervious surface area (ISA), population density, and elevation data. Urban boundaries were derived from the Global Urban Boundary (GUB) dataset (http://data.ess.tsinghua.edu.cn/), which extracts vectorized urban boundaries based on 30 m resolution global artificial impervious surface data. Compared with manual interpretation, the GUB dataset demonstrates superior capability in capturing urban fringe morphology (Li et al., 2020). The 2001–2020 ISA data were generated through time-series analysis of 30 m resolution Landsat optical imagery combined with supplementary datasets (VIIRS nighttime light data and Sentinel-1 SAR data) (https://www.x-mol.com/groups/li_xuecao/dongtaizhitu). This 30 m resolution dataset, characterized by relatively high overall accuracy, was utilized to characterize urban impervious surface increase dynamics (Gong et al., 2020). Population density data (2001–2020) were obtained from the WorldPop 100-m gridded population distribution dataset (https://www.worldpop.org/), which integrates census data with multi-source remote sensing observations. These data supported the analysis of urban factors’ impacts on vegetation phenology. Digital Elevation Model (DEM) data (1 km resolution) acquired from the Resource and Environment Science and Data Center (https://www.resdc.cn) were employed to mitigate elevation-induced biases in urban heat island intensity estimation and vegetation phenological parameter extraction.
All raster data were resampled to 500 m using the nearest neighbor method to match the spatial resolution of the EVI data.
2.3 Methods
2.3.1 Vegetation phenology parameters
The MODIS Land Cover Dynamics Yearly Product (MCD12Q2) was employed to extract vegetation phenological parameters from 2001 to 2020, featuring 500 m spatial resolution and annual temporal resolution. Vegetation transition dates were identified through curvature extremum points derived from a segmented logistic function fitted to the MODIS two-band Enhanced Vegetation Index (EVI2) time series. In this study three environmentally sensitive phenological parameters were selected: SOS, EOS, and GSL. SOS and EOS represent the day of year (DOY) counted from January 1st to respective phenophase transitions, while GSL is defined as the duration between EOS and SOS. The MCD12Q2 dataset defines the data when EVI2 first crossed 15% of the segment EVI2 amplitude as Greenup and the date when EVI2 last crossed 15% of the segment EVI2 amplitude as Dormancy, which corresponds the pixel values of SOS and EOS, respectively. The pixel values of GSL were calculated by subtracting SOS from EOS (Chen et al., 2023; Zhou et al., 2014a). According to the previous research, pixels with SOS (DOY < 50 or DOY > 180), and EOS (DOY < 240 or DOY > 330) were excluded as outliers to mitigate uncertainties induced by urban landscape complexity (Peng et al., 2024; Yang et al., 2020). Additionally, agricultural pixels were masked using contemporaneous MODIS Land Cover Type data (MCD12Q1) to minimize anthropogenic vegetation interference (Yin et al., 2023). And pixels exceeding 50 m above the maximum urban areas elevation were removed through DEM data to control for altitudinal effects on phenological variations (Zhou et al., 2016). The Theil-Sen estimator was applied to quantify interannual trends (2001-2020) in SOS, EOS, and GSL due to its non-parametric nature and robustness against outliers, with trend significance assessed using the Mann-Kendall test (Miu et al., 2024). Furthermore, this methodology was consistently applied to analyze trends in LST and ISP. The Theil-Sen slope formula is as follows:
In the formula, xj and xi represent time-series data. β > 0 indicates a delayed trend in phenological phases, β < 0 signifies an advanced trend in phenological phases.
The Mann-Kendall trend test formula is as follows:
In the formula, S is the trend statistic, and xi, xj are the i-th and j-th observations (j > i). n is the length of the time series and sgn (xj-xi) is the signed function. Taking the significance level α = 0.05, when | Zc | > | Z(1-α)/2 |, the null hypothesis is rejected, indicating a significant changing trend.
2.3.2 Assess the response mechanisms of UVP to urban expansion and climate change along the urban-rural gradient
To quantify the gradient effects of urban expansion on vegetation phenology, we developed a detailed zoning strategy. First, based on quintennial GUB data spanning 2000-2020 (i.e., 2000, 2005, 2010, 2015, and 2020), we aligned urban boundaries to the latest available GUB year. The largest urban patch within each city’s administrative boundary was selected as the core urban area, excluding relatively small or densely distributed patches (Mo et al., 2024; Zhou et al., 2014b). Previous studies suggest that the average urban influence footprint on vegetation phenology extends less than 30 km from urban peripheries (Zhang et al., 2004; Zhou et al., 2015, 2016; Yang et al., 2019). And treating non-urban areas as homogeneous while neglecting suburban transitional zones may underestimate urban impacts on vegetation phenology. We therefore established 8 buffer zones (0–5 km, 5–10 km, 10–15 km, 15–20 km, 20–25 km, 25–30 km, 30-35km, 35-40km) from urban area boundaries. As shown in Figure 2, vegetation phenology parameters gradually stabilize beyond 20 km. To ensure sufficient observations per zone, we designated the 20–25 km and 25–30 km buffers as non-urban (rural) areas. The remaining buffers were consistently categorized into suburban areas (0–5 km, 5–10 km) and exurban arears (10–15 km, 15–20 km). Finally, univariate linear regression was employed to assess gradient differences in UVP, LST, and ISP along the urban-rural continuum and to assess vegetation phenology’s responsiveness to urban and climatic factors. The urban-rural gradient differences in LST were respectively used to characterize urban heat island intensity (ΔLST). The percentage of impervious surface area is often used to represent the level of urbanization. Therefore, we use the urban-rural gradient differences in ISP to characterize the intensity of urban expansion (ΔISP). The univariate linear regression formula is as follows:
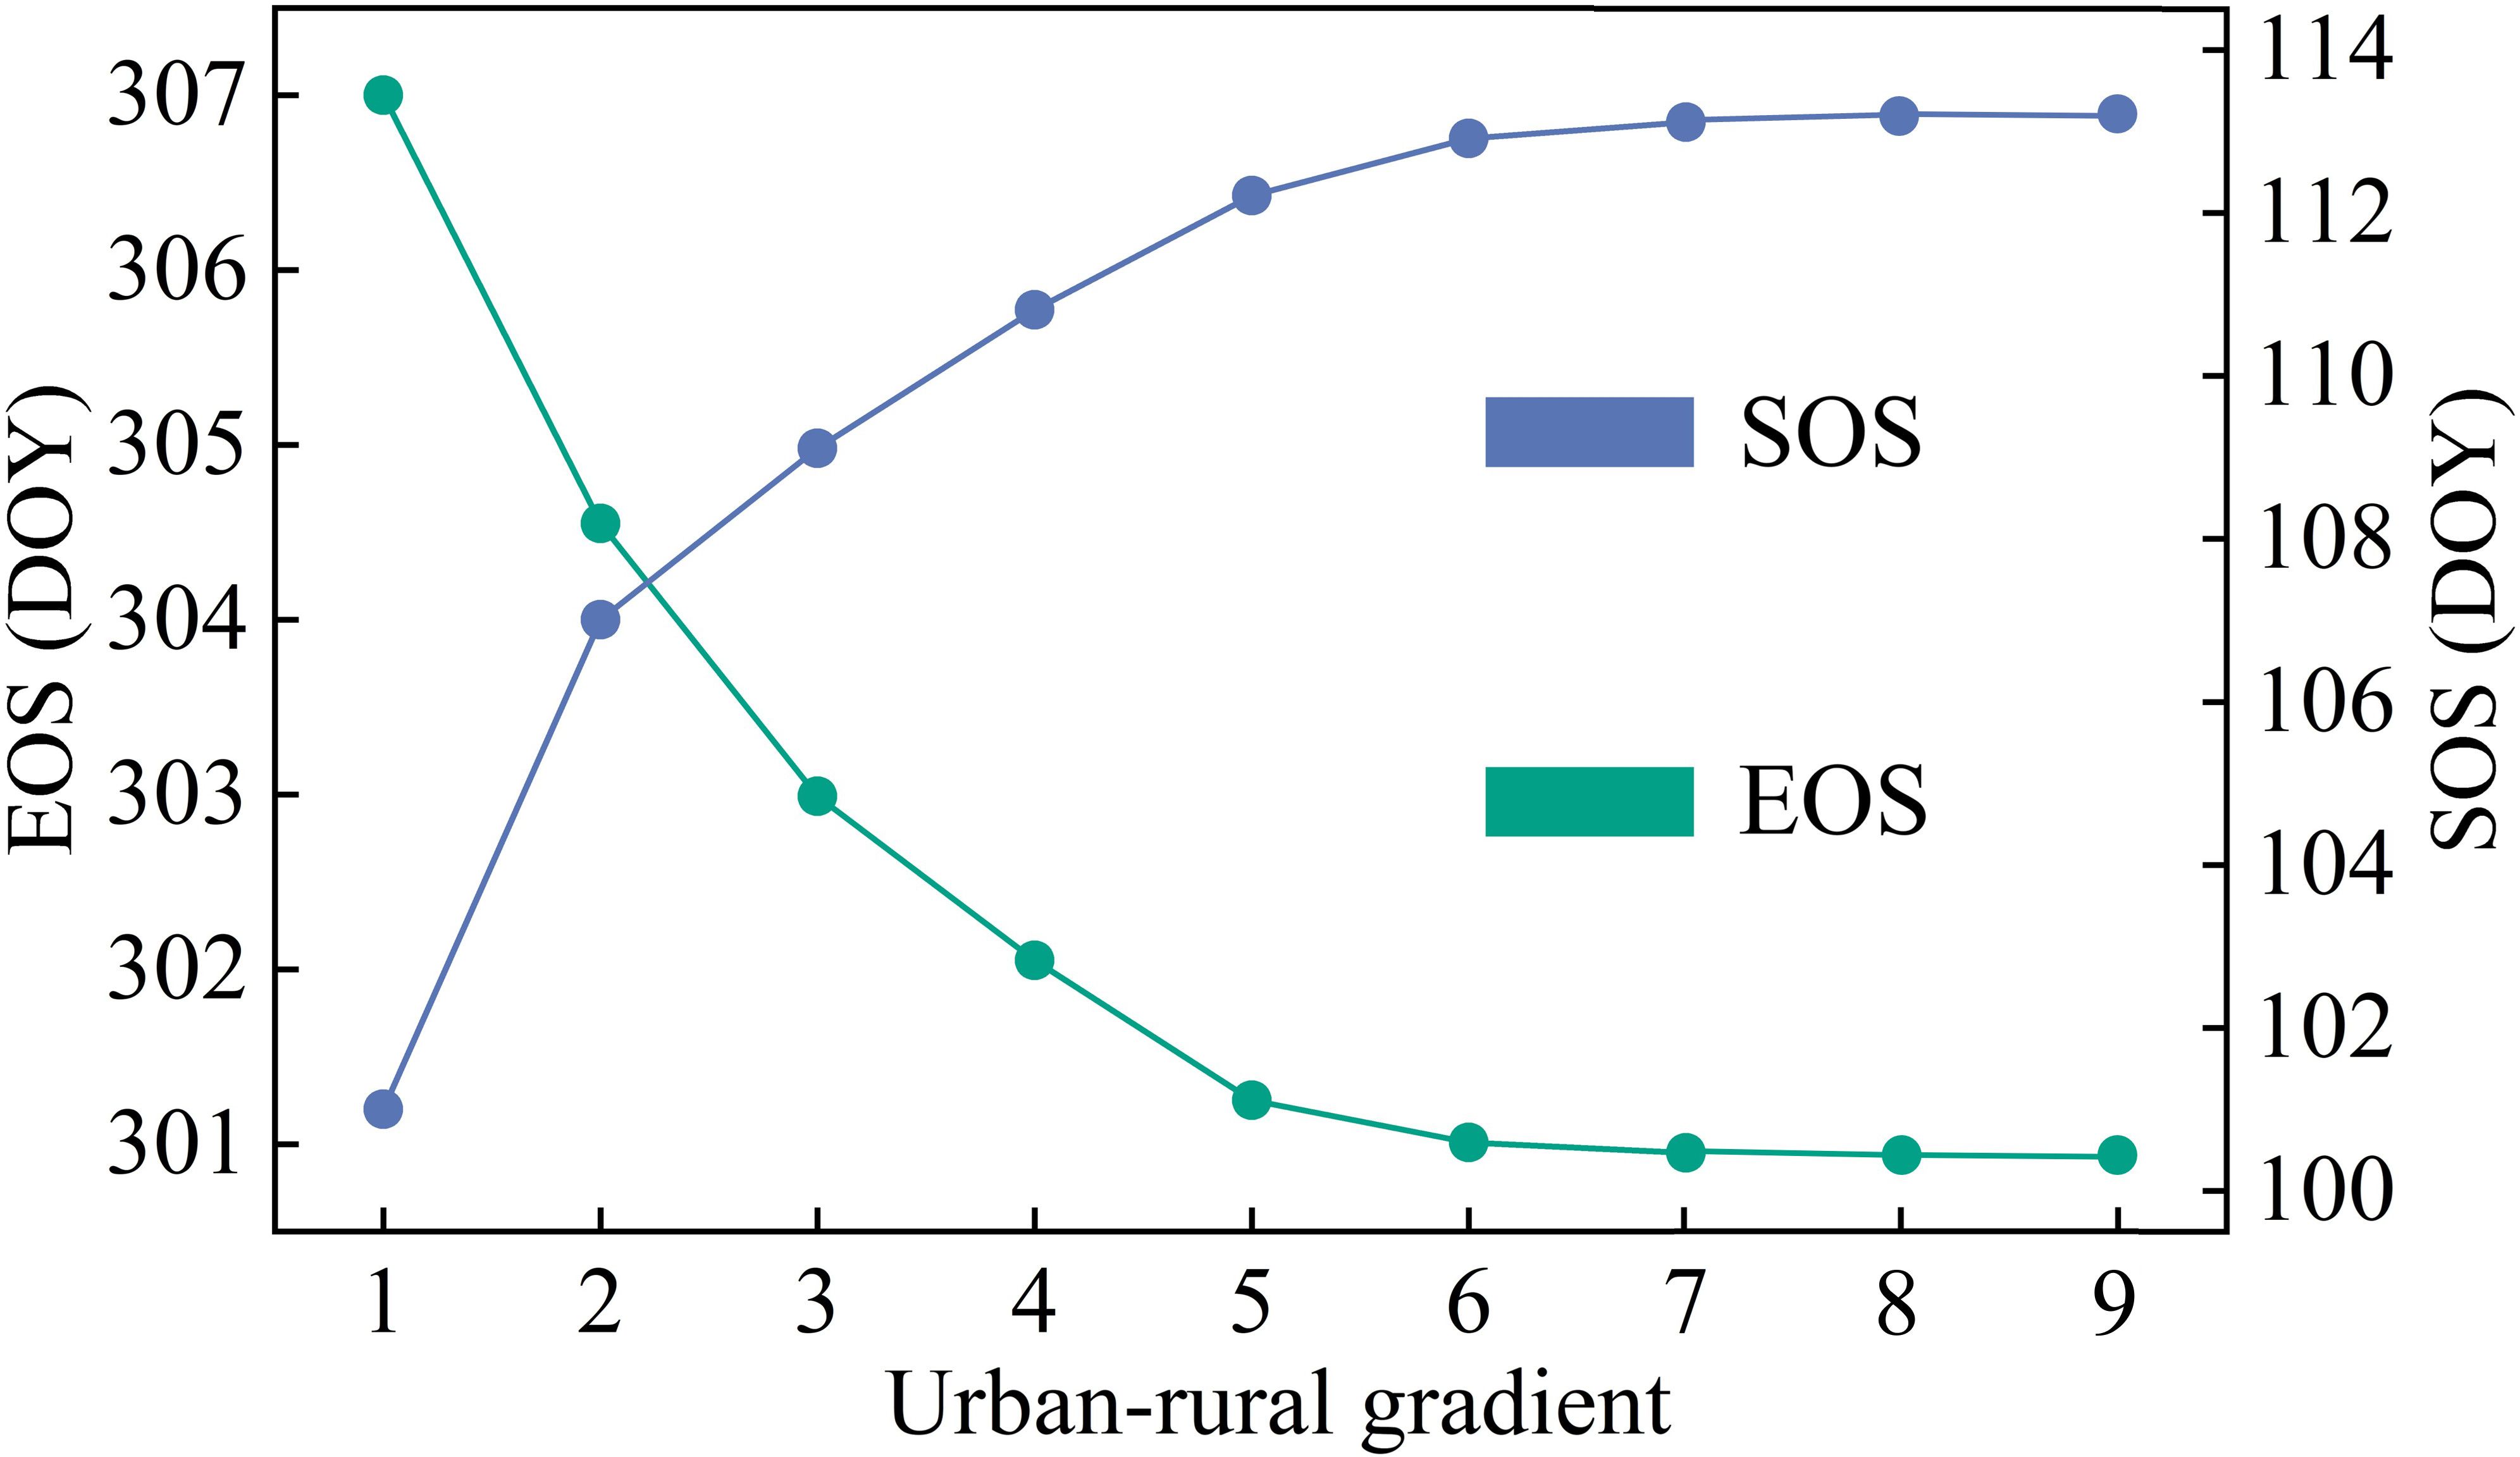
Figure 2. The average values of vegetation phenology in urban areas and buffer zones of 31 cities. 1 represent the urban area and others represent the buffer zones extending outward.
In the formula, x denotes the urban-rural gradient or other temporal sequence data as the independent variable, while y represents the corresponding dependent variable time series. The parameter b is defined as the intercept term, and k quantifies the slope coefficient. When assessing the response of vegetation phenology to urban factors, the parameter k represents the number of days by which vegetation phenology advances or delays for each 1% increase in the percentage of impervious surface or each 1°C increase in the land surface temperature, with units of d/% or d/°C.
2.3.3 Classification of city sizes and climate backgrounds based on the Jenks natural breaks classification method
The Jenks natural breaks classification method identifies inherent natural groupings within datasets by optimally partitioning values into classes with maximized inter-class variance. This algorithm establishes class boundaries at positions where significant data value discontinuities occur (Li and Xu, 2020). We therefore applied this method to categorize China’s 31 cities into four city size based on mean annual permanent urban population, and four climatic contexts according to mean annual precipitation, as detailed in Tables 2, 3.
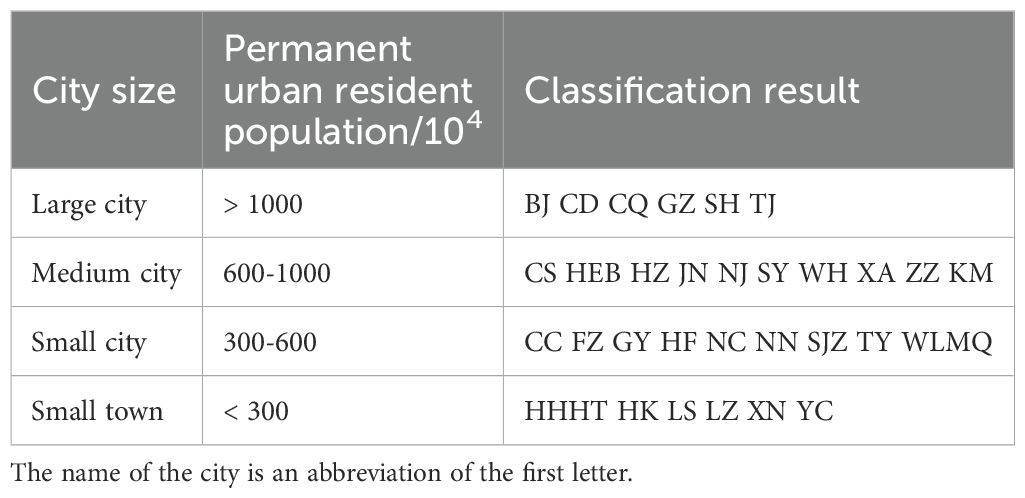
Table 2. The classification results of the city sizes.
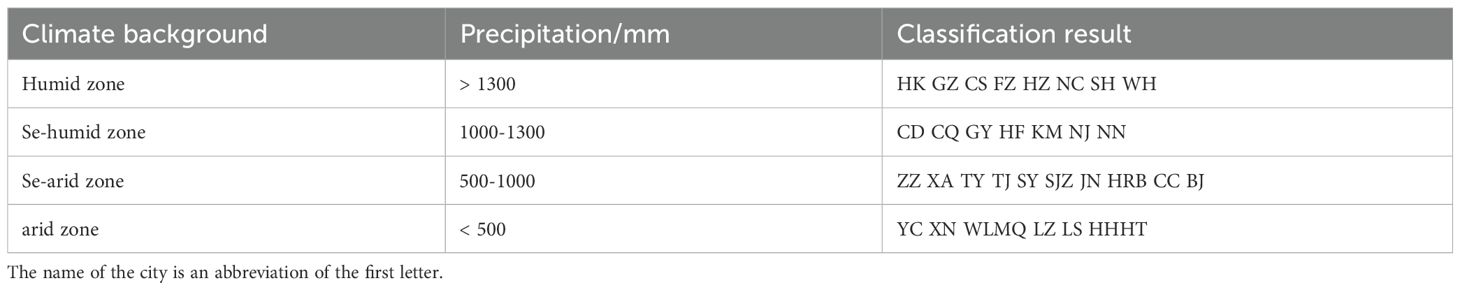
Table 3. The classification results of the climate backgrounds.
2.3.4 Assess the contributions of urban and climatic factors to ΔUVP on the urban-rural gradient
As ΔUVP is co-regulated by local urban expansion intensity and background climate change, we selected six relevant factors to investigate their contributions to ΔUVP. These factors comprise three urban factors (urban heat island intensity, urban expansion intensity, and urban population density) and three climatic factors (temperature, precipitation, and radiation). However, collinearity frequently exists among urban and climatic factors influencing ΔUVP, and conventional correlation analysis cannot adequately disentangle their combined effects. Therefore, we employed partial correlation analysis to differentiate the relative contributions of these 6 factors (Wang et al., 2019). Furthermore, to ensure result robustness, we implemented Random Forest modeling to assess the relative importance of each factor in driving ΔUVP. The complete dataset was partitioned into training and testing subsets at an 8:2 ratio. To optimize model performance and prevent overfitting, we employed 5-fold cross-validation with grid search to tune hyperparameters using R² as the evaluation metric. The optimal combination was identified as 100 decision trees with a maximum depth of 10. This configuration achieved a R² score of 0.82 on the test set, demonstrating strong predictive performance and generalizability of the model.
3 Results
3.1 Spatio-temporal patterns and trends of UVP based on urban-rural gradient
3.1.1 The spatial distribution characteristics of annual mean of UVP
Using MCD12Q2 EVI phenological data, we analyzed the spatial distribution characteristics of annual mean vegetation phenology across 31 Chinese cities from 2001 to 2020. Across urban-rural gradients (Figures 3a-l), the GSL of vegetation in the 31 cities ranged between 161–233 days, exhibiting a spatial pattern of “longer in southern regions and shorter in northern areas”. The vegetation SOS and EOS primarily occurred between 76–169 DOY, 289–322 DOY, respectively. Cities in relatively humid southeastern regions with lower latitudes and elevations demonstrated earlier SOS and slightly later EOS, whereas cities in arid northwestern regions with higher latitudes and elevations exhibited later SOS and marginally earlier EOS.

Figure 3. The spatial distribution characteristics of annual average values of (a-d) SOS, (e-h) EOS and (i-l) GSL on different urban-rural gradients in 31 cities of China.
Overall analysis (Figures 4a-c) revealed that urban areas exhibited the earliest vegetation SOS (SOS = 101), followed by suburban areas (SOS = 109) and exurban areas (SOS = 111), with rural areas showing the latest SOS (SOS = 113). The vegetation SOS of urban areas occurred 12 days earlier than that in rural areas. Urban areas demonstrated the latest vegetation EOS (EOS = 307), followed by suburban areas (EOS = 303) and exurban areas (EOS = 302), while rural areas showed the earliest EOS (EOS = 301). The vegetation EOS of urban areas was delayed by 6 days compared to rural areas. Urban areas displayed the longest vegetation GSL (GSL = 206 d), followed by suburban areas (GSL = 194 d) and exurban areas (GSL = 191 d), with rural areas showing the shortest GSL (GSL = 188 d). The vegetation GSL of urban areas was prolonged by 18 days compared to rural areas. Furthermore, the SOS, EOS, and GSL distributions in urban areas of these 31 cities exhibited the lowest dispersion compared to other zones, indicating a relative consistency in vegetation phenology responses to urban expansion.
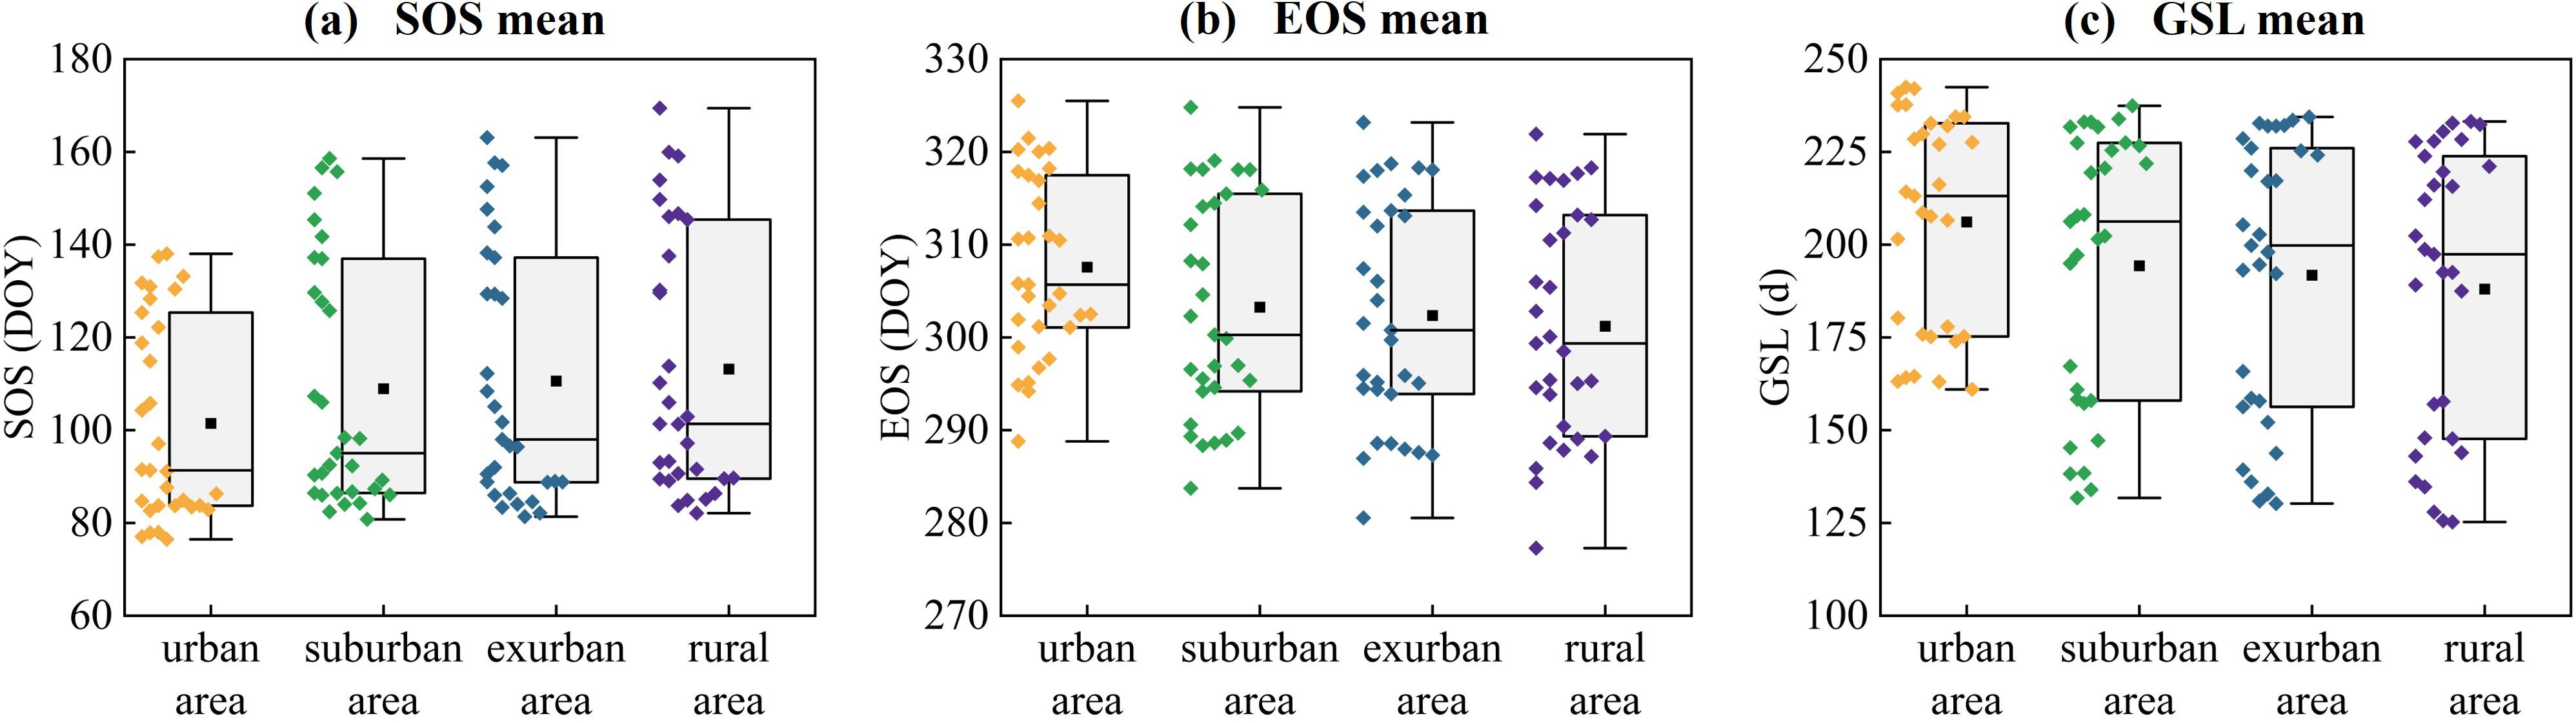
Figure 4. The annual average values of vegetation (a) SOS, (b) EOS and (c) GSL on different urban-rural gradients.
3.1.2 The interannual variation of UVP and its trend spatial distribution
The Theil-Sen slope estimator and Mann-Kendall test were applied to quantify interannual vegetation phenology trends along urban-rural gradients in 31 Chinese cities (2001–2020). Figures 5a-c presents the spatiotemporal patterns of vegetation SOS, EOS, and GSL across four zones (urban areas, suburban areas, exurban areas, and rural areas). Nationwide, urban vegetation exhibited an advanced SOS, a delayed EOS, and a prolonged GSL.The vegetation SOS advanced significantly (P < 0.05) at 0.77 d/a (urban areas), 0.46 d/a (suburban areas), 0.33 d/a (exurban areas), and 0.32 d/a (rural areas); EOS delayed significantly (P < 0.05) at 0.72 d/a, 0.45 d/a, 0.38 d/a, and 0.36 d/a respectively; GSL prolonged significantly (P < 0.05) at 1.50 d/a, 0.88 d/a, 0.72 d/a, and 0.69 d/a correspondingly. This demonstrates a gradual attenuation in vegetation phenology change rates with increasing distance from urban cores.
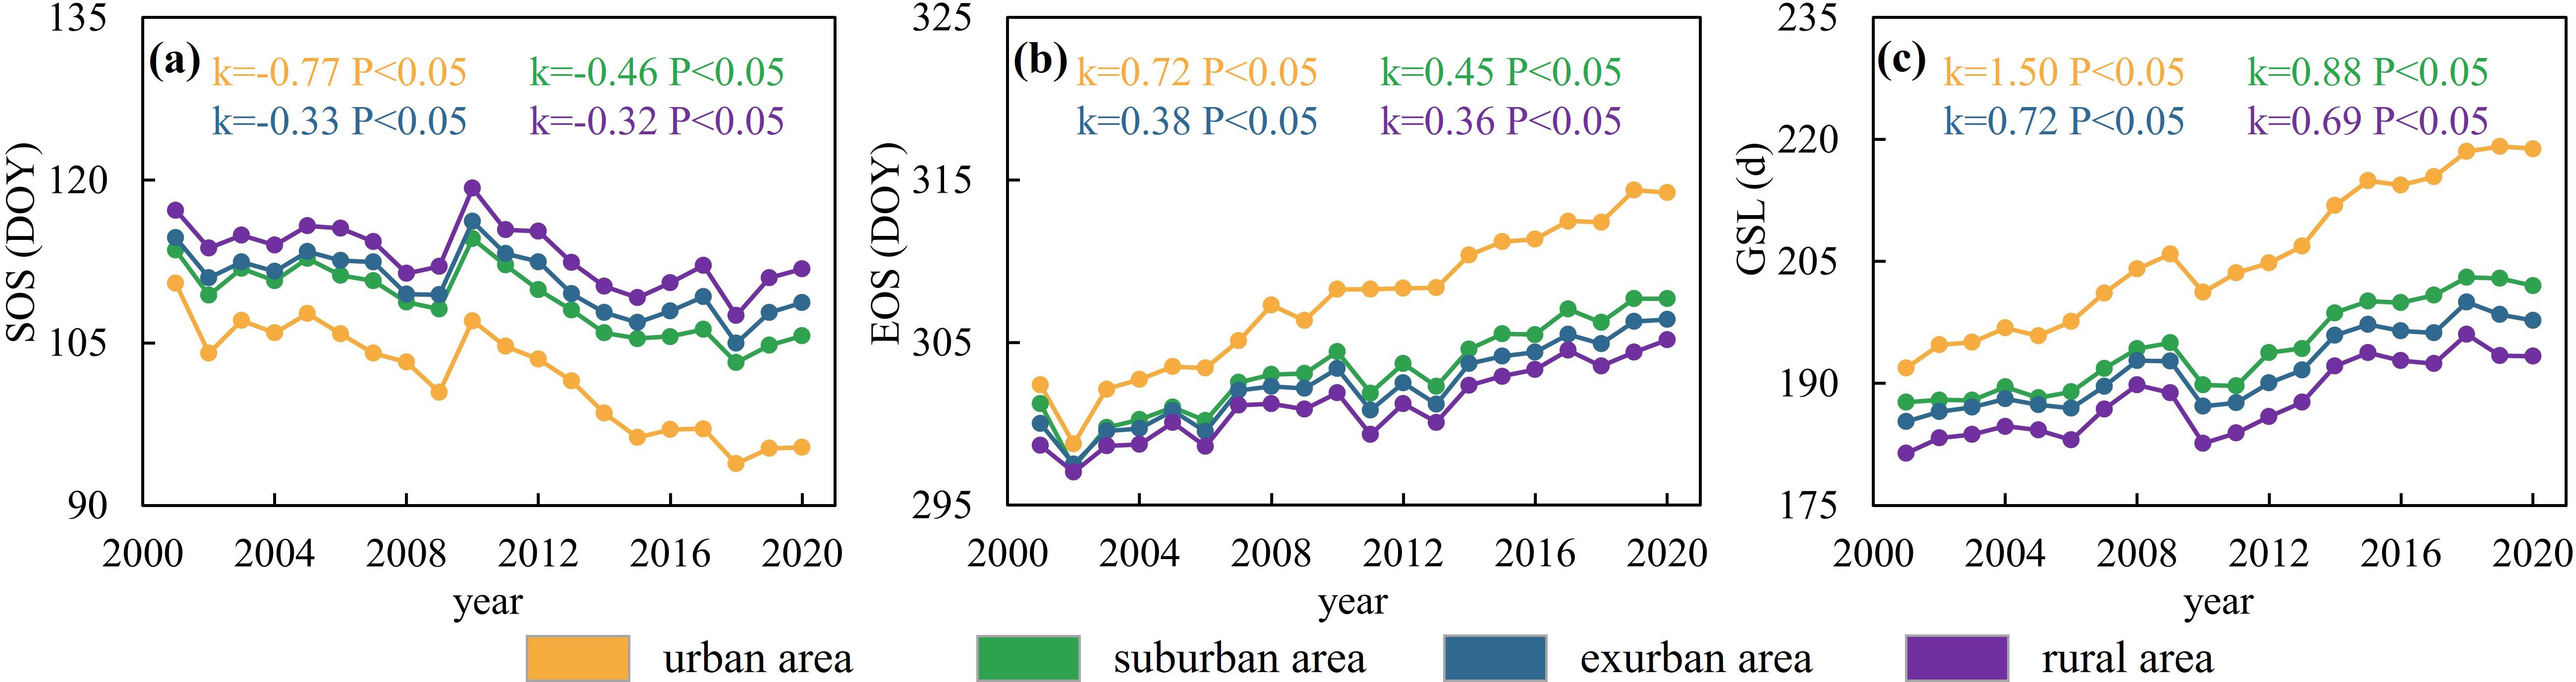
Figure 5. The interannual variation trend of (a) SOS, (b) EOS and (c) GSL on different urban-rural gradients.
The spatial distribution of vegetation phenology trends across 31 cities showed no distinct north-south regional divergence (Figures 6a-l). However, cities exhibiting delayed SOS, advanced EOS, and shortened GSL were predominantly clustered in the humid southeastern coastal region and the Tibetan Plateau. Furthermore (Figures 7a-c), the proportion of cities with significantly advanced SOS progressively decreased along the urban-rural gradient from urban zones (71%), while cities showing non-significant advancement, significant delay, and non-significant delay gradually increased. Cities with significantly delayed EOS declined gradientally from urban zones (87%), accompanied by increasing proportions of non-significantly delayed, significantly advanced, and non-significantly advanced cases. The percentage of cities with significantly prolonged GSL decreased from urban zones (90%) along the urban-rural gradient, while those with non-significant prolongation, significant shortening, and non-significant shortening showed incremental trends. This indicates diminishing urban influence on vegetation phenology with increasing distance from urban zones.
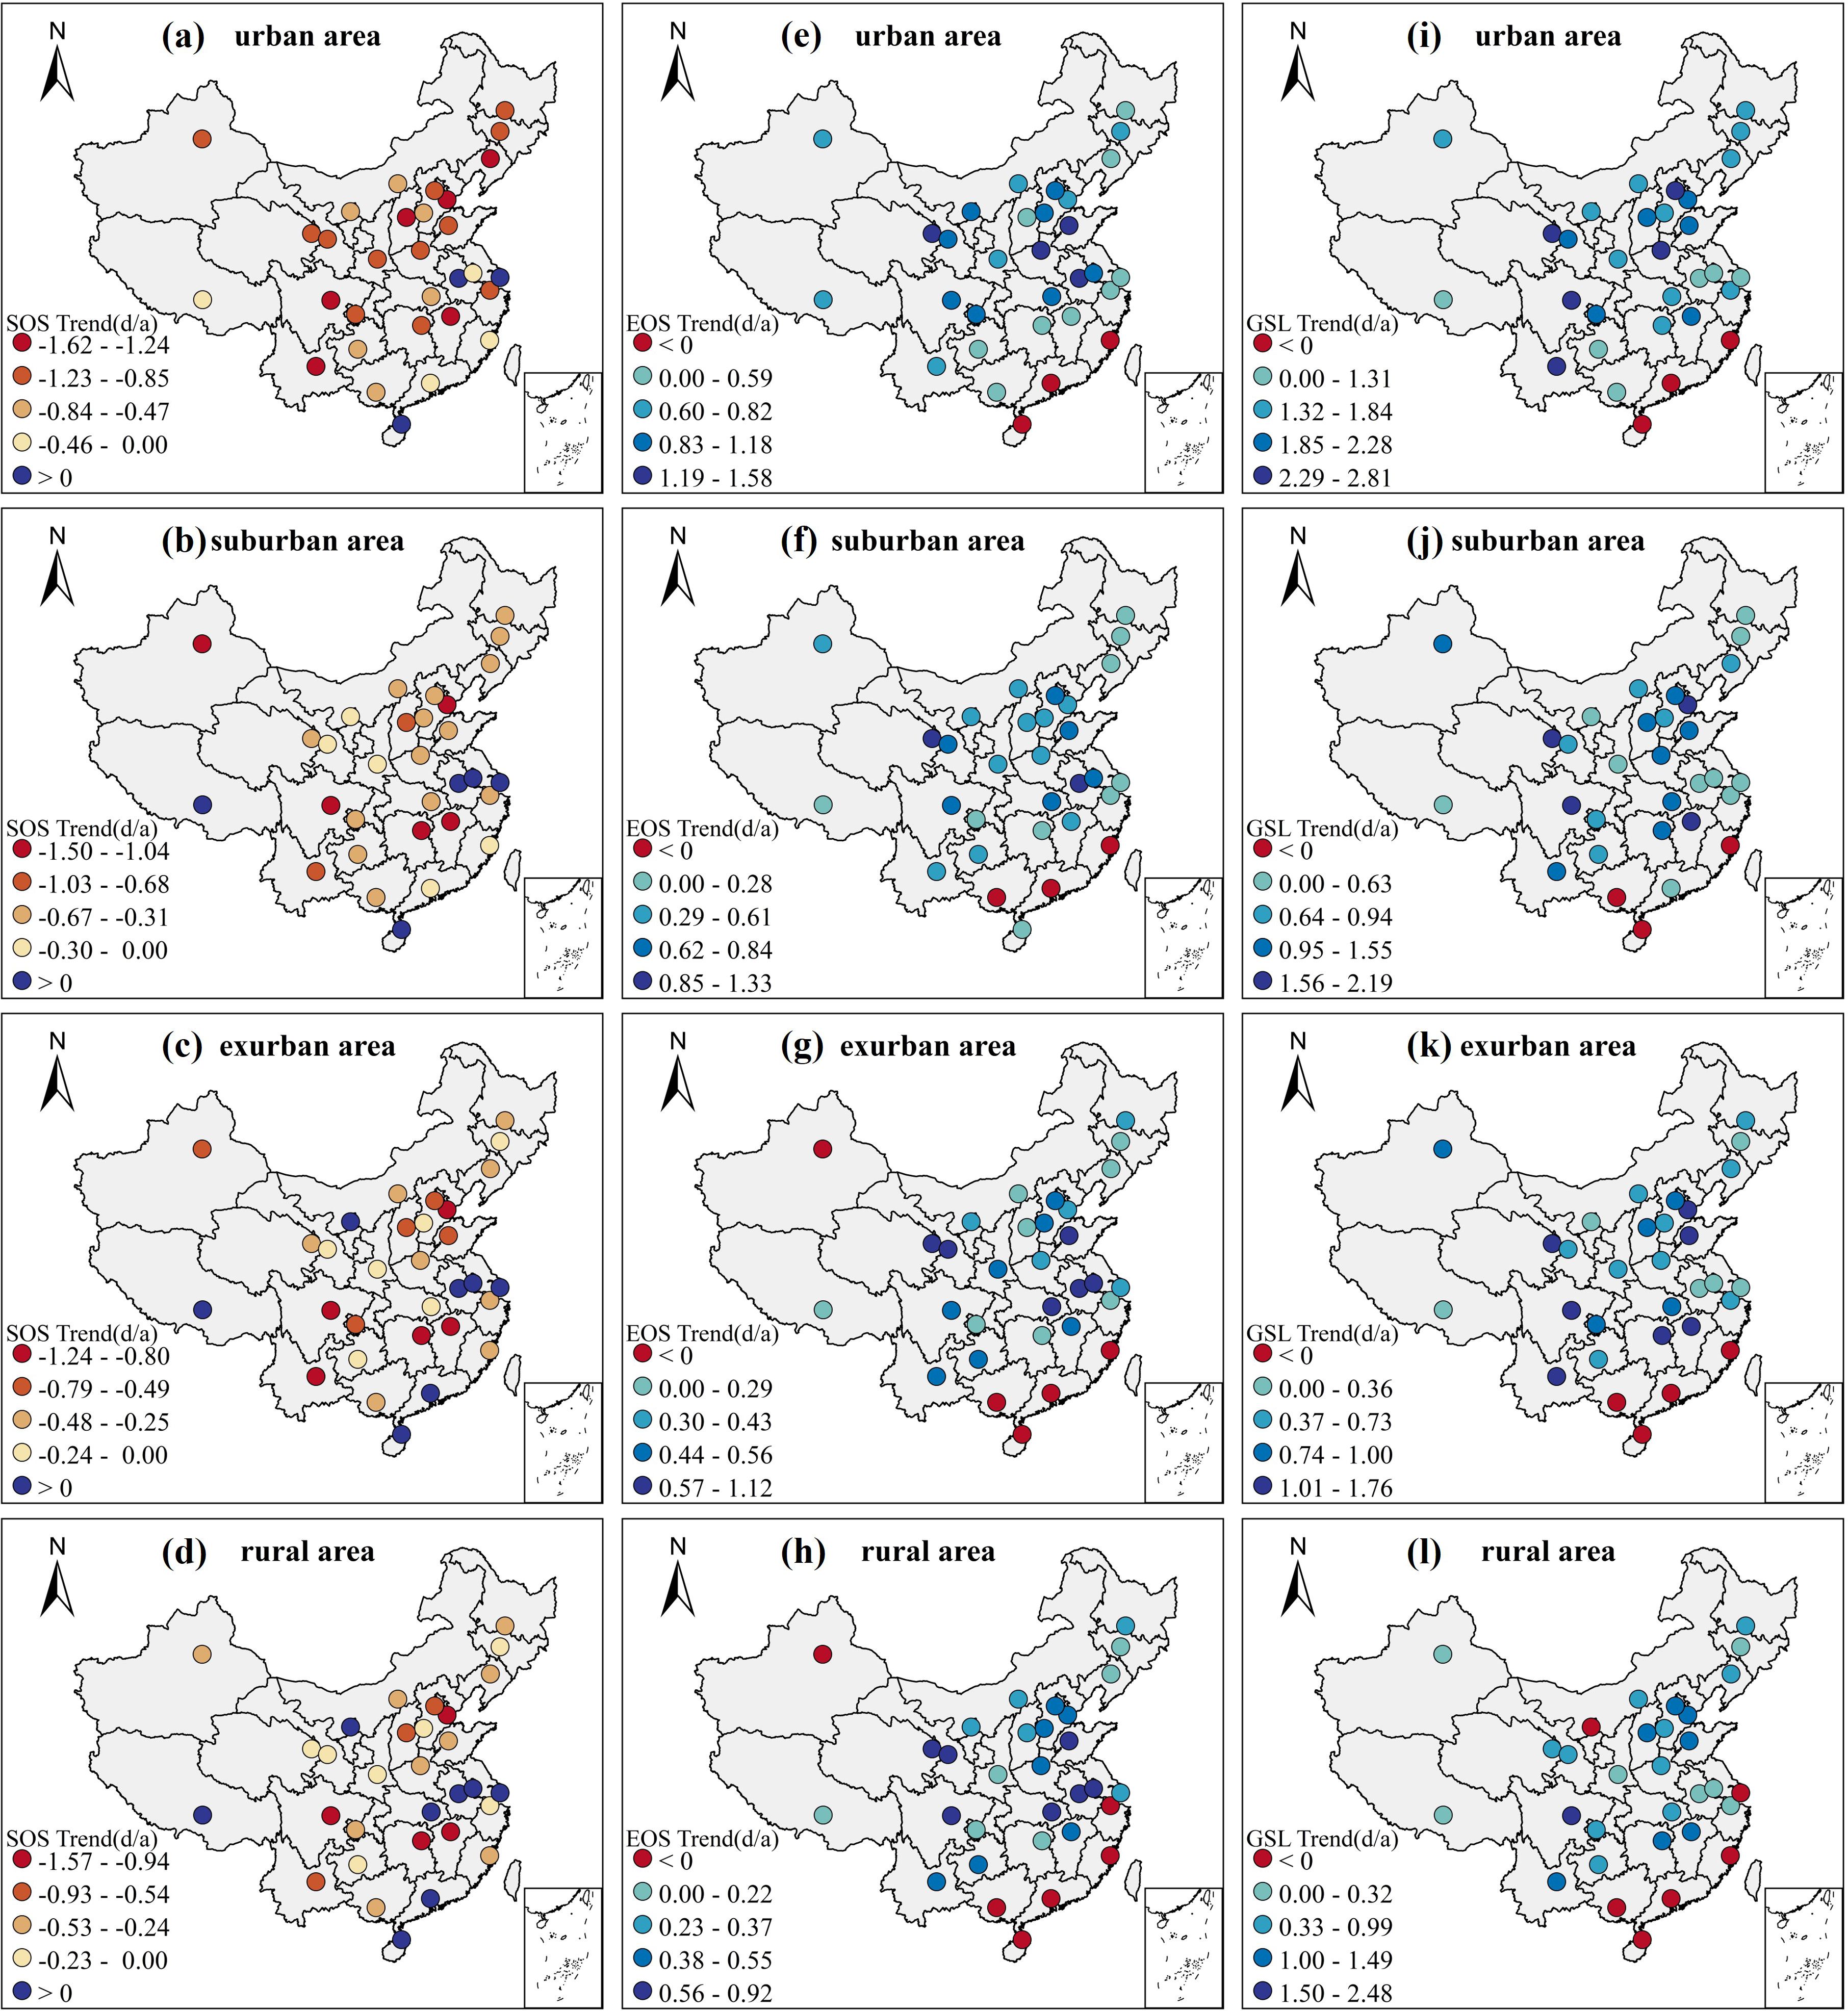
Figure 6. The spatial distribution characteristics of interannual variation trend of (a-d) SOS, (e-h) EOS and (i-l) GSL on different urban-rural gradients in 31 cities of China.

Figure 7. The significance of the interannual variation trend of (a) SOS, (b) EOS and (c) GSL on different urban-rural gradients.
3.1.3 The spatial distribution of ΔUVP along the urban-rural gradient
The urban vegetation phenology (ΔSOSM/T, ΔEOSM/T, and ΔGSLM/T) along urban-rural gradients across 31 Chinese cities from 2001 to 2020 exhibited pronounced spatial heterogeneity. Overall analysis (Figures 8a-c) indicates that except for a few coastal humid cities where vegetation SOS in urban areas was delayed (Guangzhou and Fuzhou), EOS advanced (Haikou and Guangzhou), and GSL shortened (Haikou and Guangzhou) compared to rural areas, the majority of cities demonstrated earlier SOS, delayed EOS, and prolonged GSL in urban areas relative to rural areas. Concurrently, the vegetation ΔSOSM, ΔEOSM, and ΔGSLM values in relatively arid northern regions were generally larger than those in relatively humid southern regions.

Figure 8. The spatial distribution characteristics of (a) ΔSOSM, (b) ΔEOSM and (c) ΔGSLM along urban-rural gradient in 31 cities of China.
The urban vegetation phenology differences (ΔUVPM) varied under different city sizes and climatic backgrounds (Figures 9a-f). Specifically, maximum vegetation ΔSOSM (5.2 d) and ΔGSLM (-8.3 d) were observed in small towns, followed by medium cities (ΔSOSM = 4.3 d, ΔGSLM = -5.9 d) and small cities (ΔSOSM = 3.3 d, ΔGSLM = -5.2 d), with large cities exhibiting the minimum values (ΔSOSM = 2.0 d, ΔGSLM = -3.4 d). The vegetation ΔEOSM peaked in small towns (-3.2 d), followed by small cities (-2.0 d) and medium cities (-1.7 d), while large cities showed the smallest ΔEOSM (-1.5 d). Furthermore, maximum vegetation ΔSOSM (6.0 d), ΔEOSM (-3.8 d), and ΔGSLM (-9.8 d) occurred in arid zones, followed by semi-arid zones (ΔSOSM = 4.8 d, ΔEOSM = -2.2 d, ΔGSLM = -7.0 d) and semi-humid zones (ΔSOSM = 2.7 d, ΔEOSM = -1.4 d, ΔGSLM = -4.1 d), with the lowest values in humid zones (ΔSOSM = 1.5 d, ΔEOSM = -1.0 d, ΔGSLM = -2.4 d).
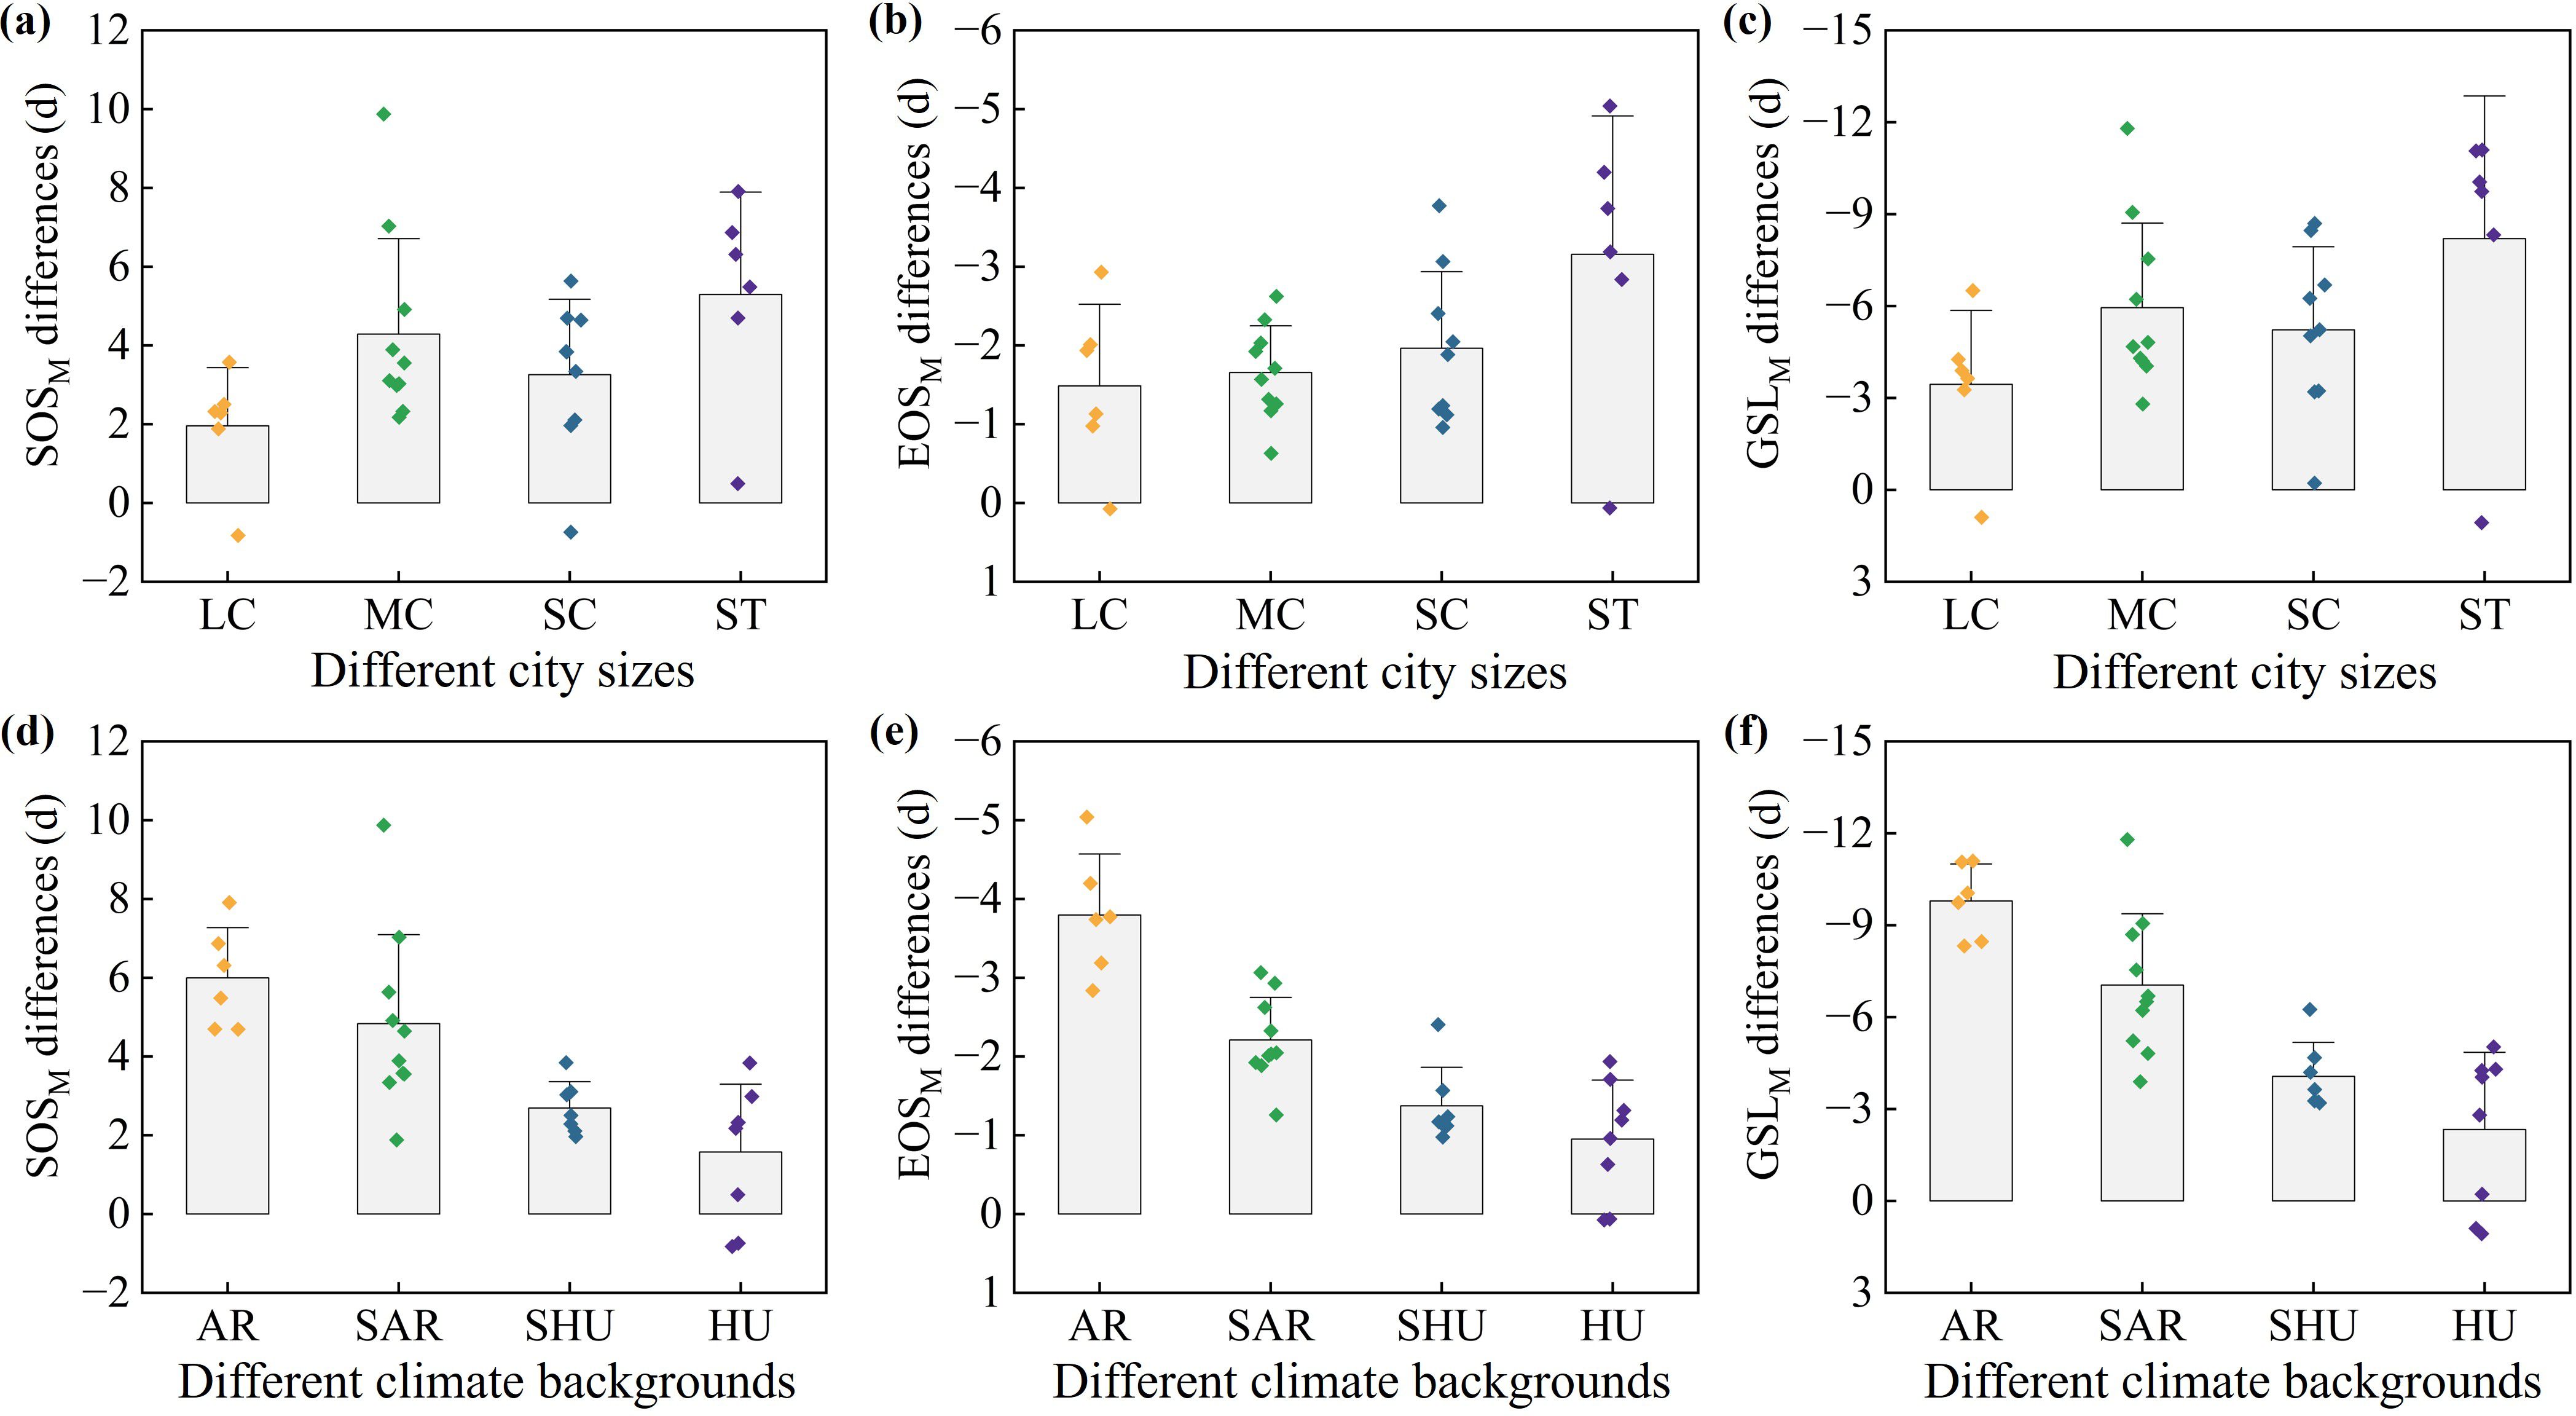
Figure 9. The distribution of (a, d) ΔSOSM, (b, e) ΔEOSM and (c, f) ΔGSLM under different city sizes and climatic zones in 31 cities of China.
Among all studied cities, 29 exhibited positive ΔSOS_Trend, negative ΔEOS_Trend, and negative ΔGSL_Trend values (Figures 10a-c), indicating that urban areas generally experienced faster rates of SOS advancement, EOS delay, and GSL extension compared to rural areas. The urban vegetation phenology trends (ΔUPV_Trend) also varied across city sizes and climatic contexts (Figures 11a-f). Specifically, the maximum ΔSOS_Trend (0.21 d), ΔEOS_Trend (-0.15 d), and ΔGSL_Trend (-0.35 d) were observed in small towns, followed by medium cities (ΔSOS_Trend = 0.20 d, ΔEOS_Trend = -0.11 d, ΔGSL_Trend = -0.33 d) and small cities (ΔSOS_Trend = 0.17 d, ΔEOS_Trend = -0.11 d, ΔGSL_Trend = -0.26 d), with large cities showing the smallest values (ΔSOS_Trend = 0.10 d, ΔEOS_Trend = -0.09 d, ΔGSL_Trend = -0.21 d). Additionally, the ΔSOS_Trend, ΔEOS_Trend, and ΔGSL_Trend were greater in arid zones (ΔSOS_Trend = 0.24 d, ΔEOS_Trend = -0.21 d, ΔGSL_Trend = -0.43 d) and semi-arid zones (ΔSOS_Trend = 0.21 d, ΔEOS_Trend = -0.13 d, ΔGSL_Trend = -0.36 d) compared to semi-humid zones (ΔSOS_Trend = 0.16 d, ΔEOS_Trend = -0.12 d, ΔGSL_Trend = -0.27 d) and humid zones (ΔSOS_Trend = 0.09 d, ΔEOS_Trend = -0.04 d, ΔGSL_Trend = -0.13 d).
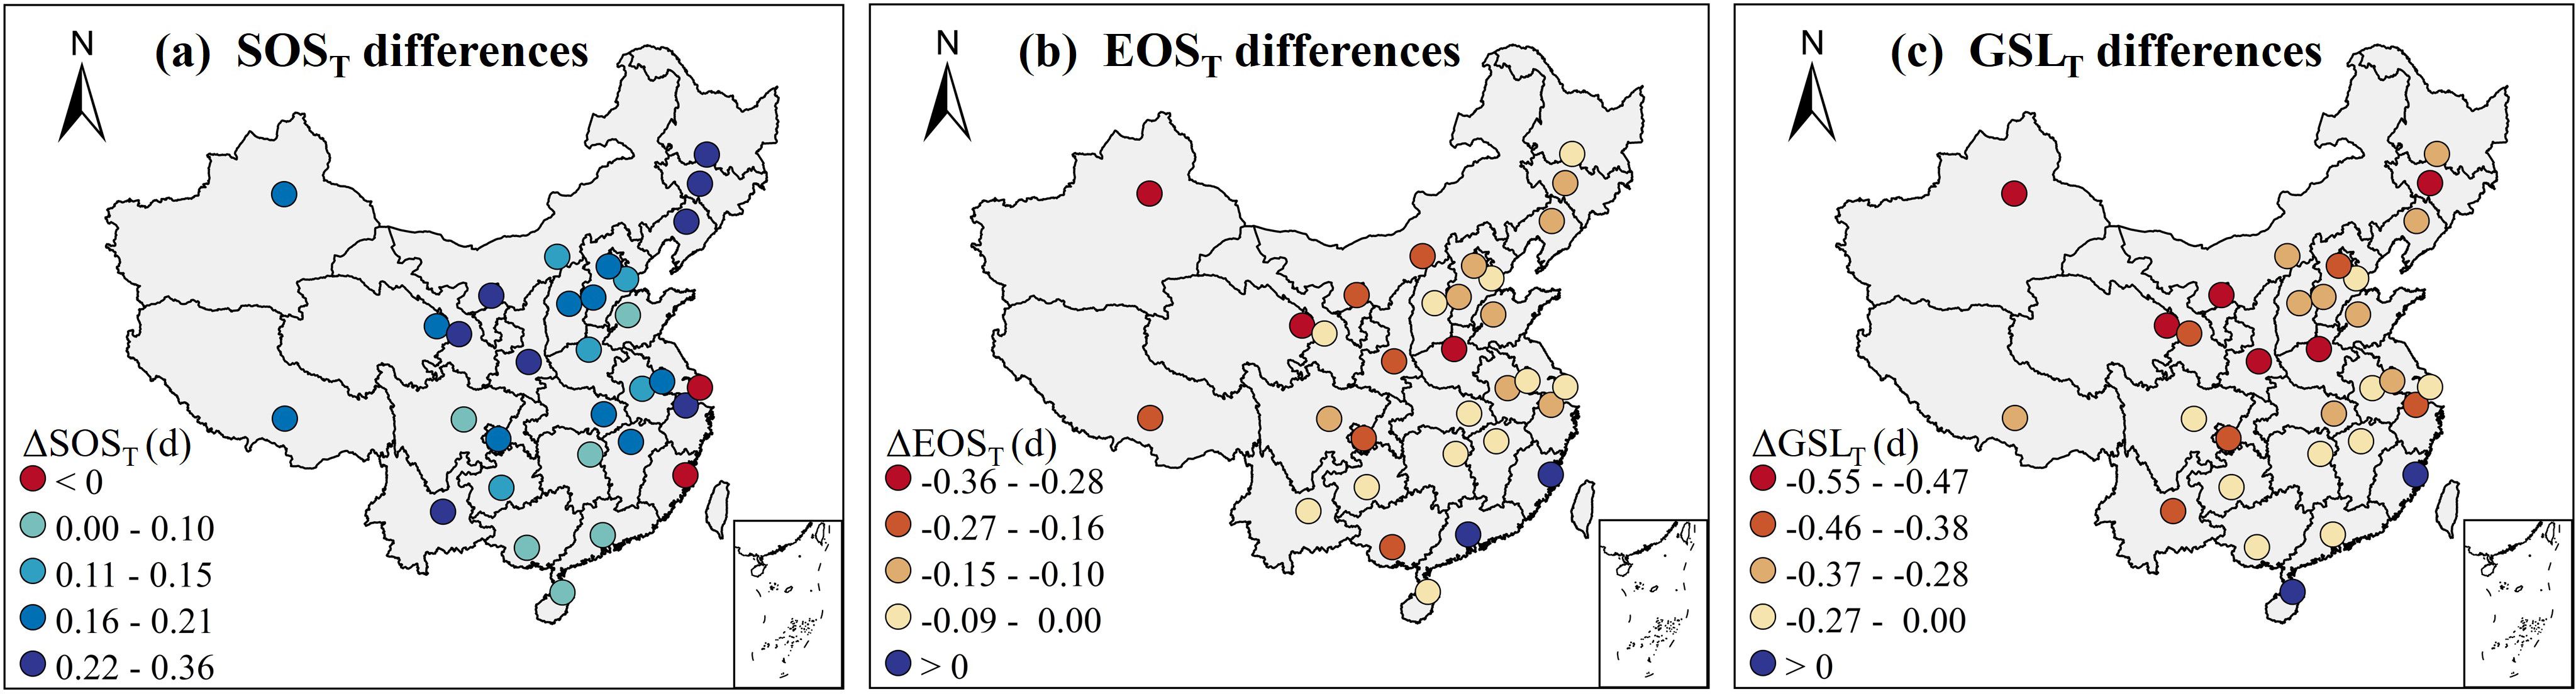
Figure 10. The spatial distribution characteristics of (a) ΔSOST, (b) ΔEOST and (c) ΔGSLT along urban-rural gradient in 31 cities of China.
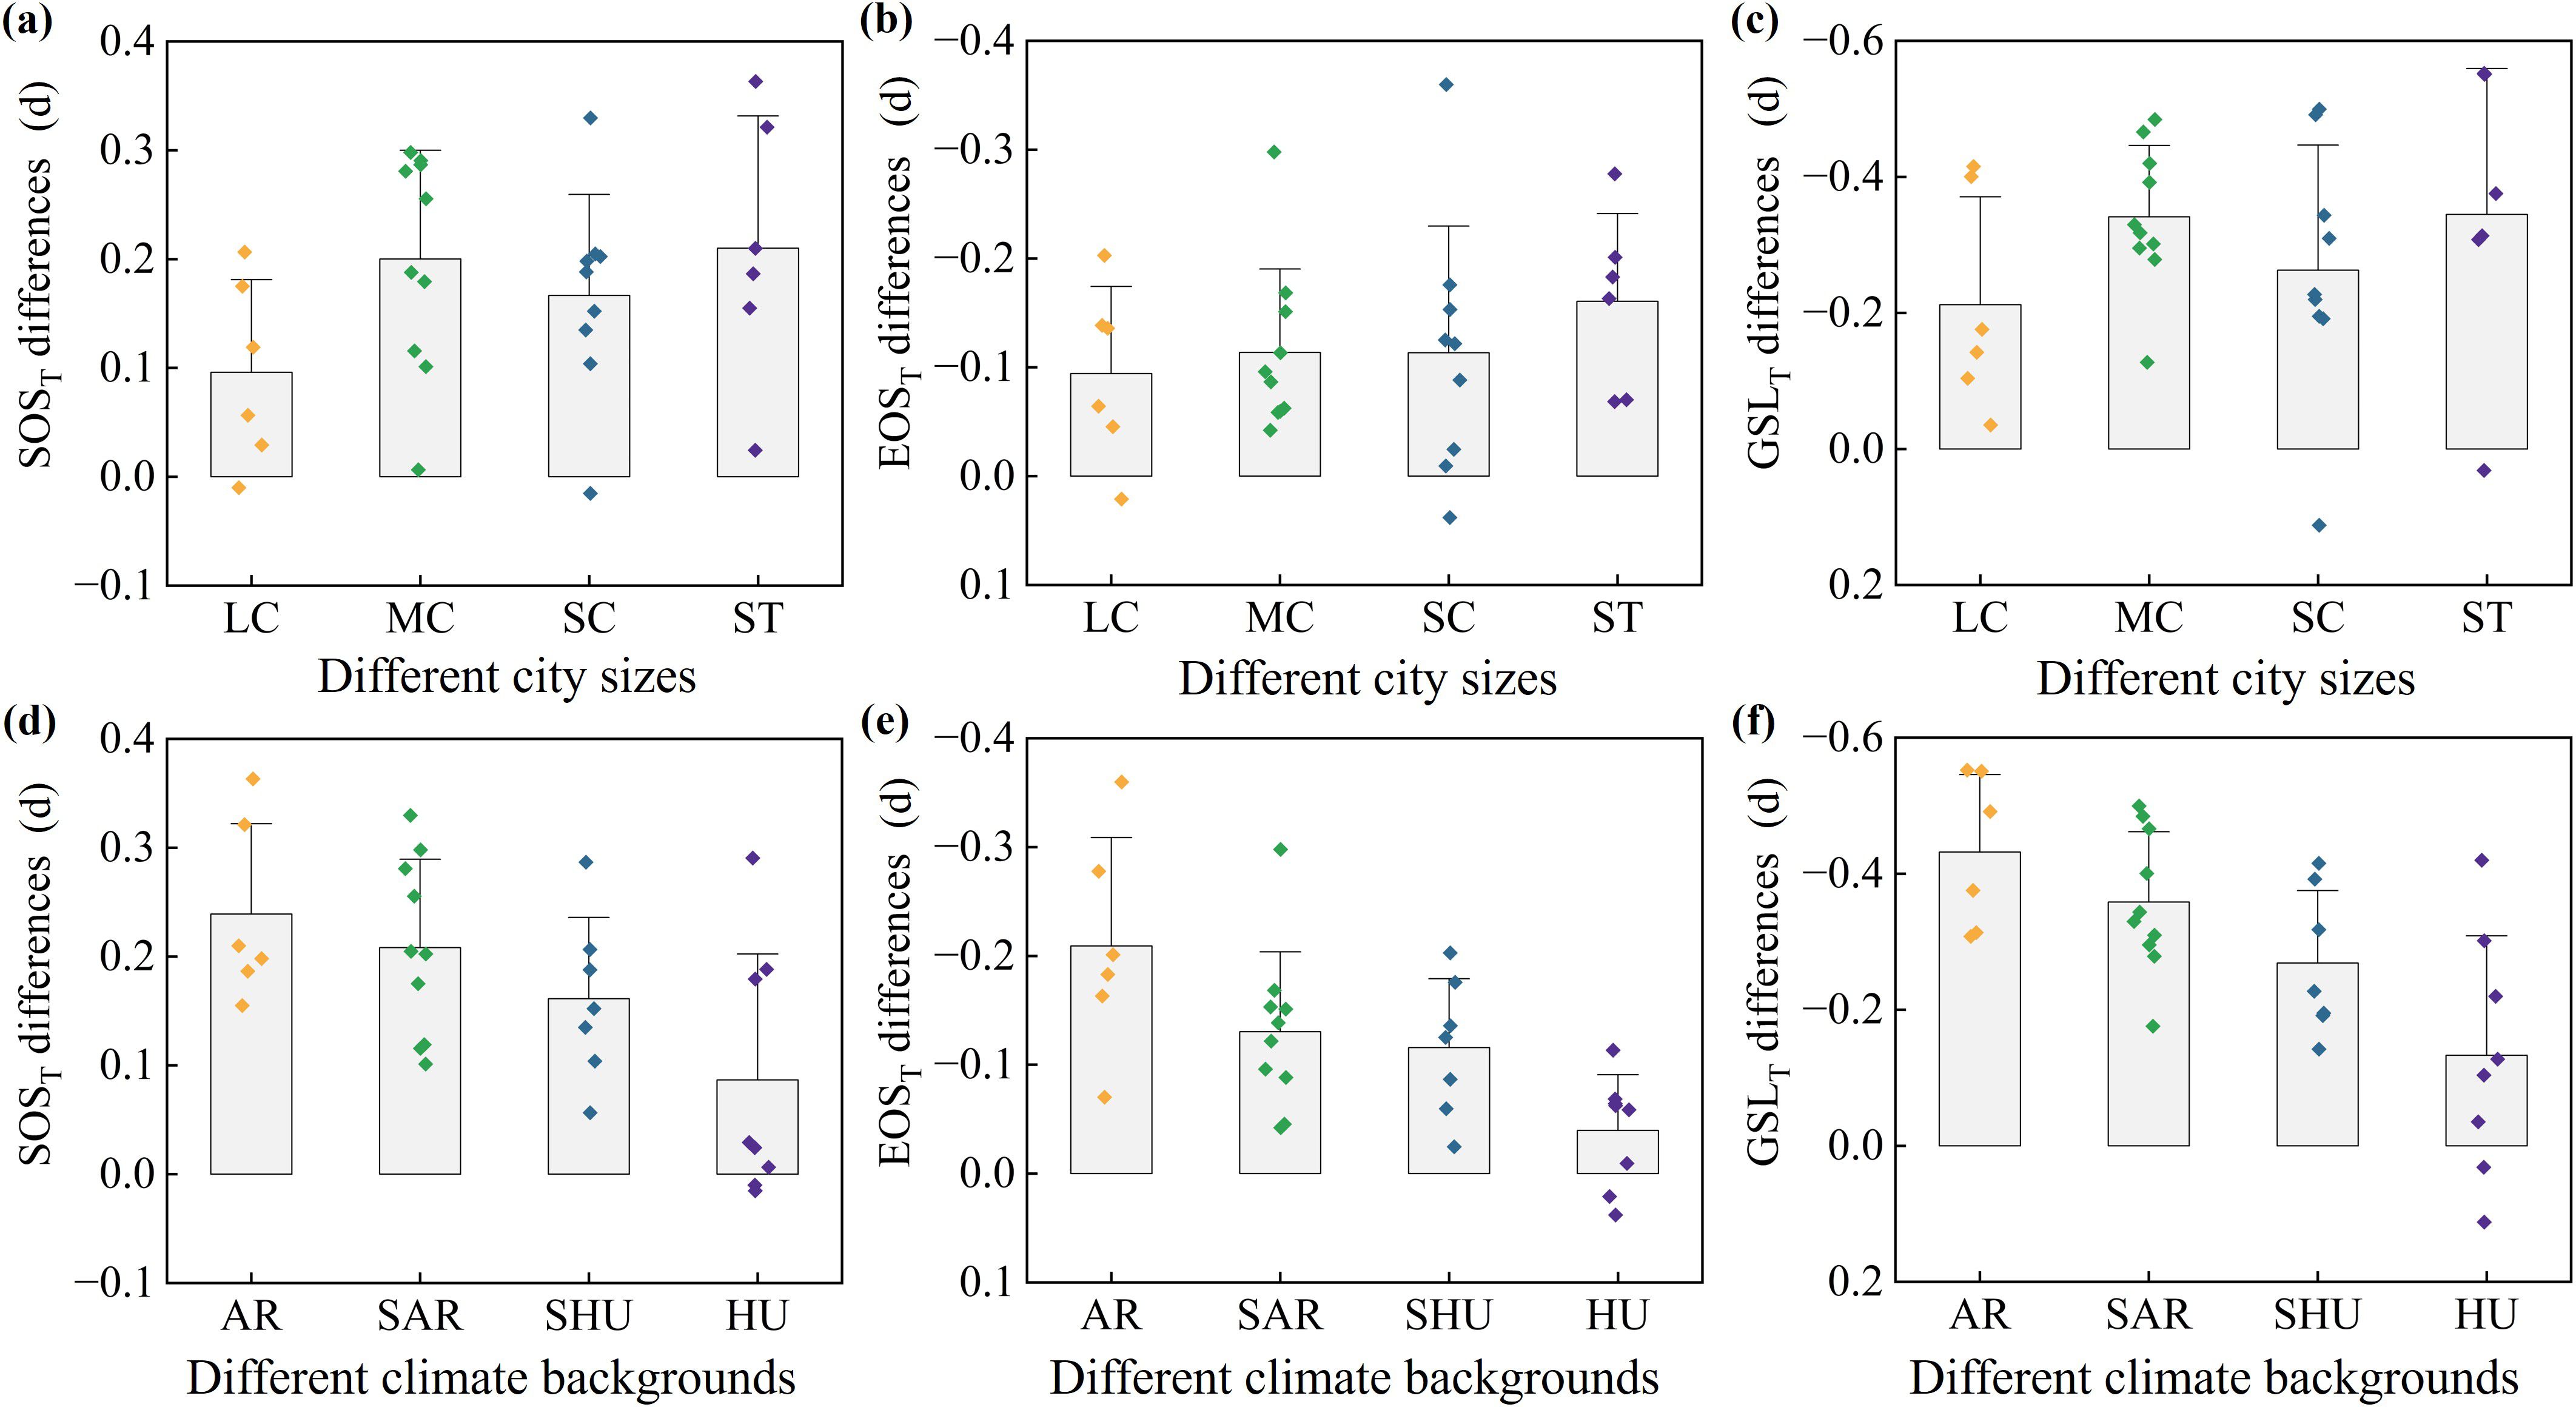
Figure 11. The distribution of (a, d) ΔSOST, (b, e) ΔEOST and (c, f) ΔGSLT under different city sizes and climatic zones in 31 cities of China.
3.2 Response of ΔUVP to urban expansion in different climatic contexts
3.2.1 The spatial distribution of ΔLST and ΔISP along the urban-rural gradient
To quantify the impact of urban expansion on vegetation phenology along urban-rural gradients, we assessed the spatial distribution characteristics of urban factors including urban expansion intensity (ΔISP) and urban heat island intensity (ΔLST). As shown in Figures 12a-l, ΔLSTM/T and ΔISPM/T values in all 31 cities were negative, indicating higher LST and ISP in urban areas compared to rural zones, along with faster warming and expansion rates.

Figure 12. The spatial distribution characteristics of (a, d) ΔLSTM/T and (g, j) ΔISPM/T along urban-rural gradient in 31 cities of China. The distribution of (b, c, e, f) ΔLSTM/T and (h, i, k, l) ΔISPM/T under different city sizes and climatic zones in 31 cities of China.
Specifically, ΔLSTM reached the highest magnitude in large cities (ΔLSTM = -0.58°C), followed by small towns (ΔLSTM = -0.51°C) and small cities (ΔLSTM = -0.45°C), with medium cities showing the lowest value (ΔLSTM = -0.44°C). Specifically, ΔLSTM reached the highest magnitude in arid zones (ΔLSTM = -0.52°C), followed by semi-humid zones (ΔLSTM = -0.49°C) and semi-arid zones (ΔLSTM = -0.47°C), with humid zones showing the lowest value (ΔLSTM = -0.46°C). For ΔLSTT, the highest values occurred in large cities (ΔLSTT = -0.017°C), followed by small towns (ΔLSTT = -0.015°C) and medium cities (ΔLSTT = -0.012°C), with small cities showing the lowest values (ΔLSTT = -0.011°C). ΔLSTT showed minor variations across climatic contexts: arid zones (ΔLSTT = -0.0138°C), semi-arid zones (ΔLSTT = -0.0127°C), semi-humid zones (ΔLSTT = -0.0128°C), and humid zones (ΔLSTT = -0.0133°C).
Furthermore, urban expansion intensity peaked in small towns (ΔISPM = -17.1%), followed by small cities (ΔISPM = -15.5%) and medium cities (ΔISPM = -13.3%), with large cities exhibiting the lowest values (ΔISPM = -10.8%). ΔISPM reached maximum values in arid zones (ΔISPM = -18.8%), followed by semi-arid zones (ΔISPM = -14.9%) and semi-humid zones (ΔISPM = -13.0%), with the minimum in humid zones (ΔISPM = -10.9%). ΔISPT was highest in small towns (ΔISPT = -0.87%), followed by small cities (ΔISPT = -0.75%) and medium cities (ΔISPT = -0.73%), with large cities showing the lowest values (ΔISPT = -0.56%). ΔISPT peaked in arid zones (ΔISPT = -0.85%), followed by semi-humid zones (ΔISPT = -0.76%) and semi-arid zones (ΔISPT = -0.70%), with the minimum in humid zones (ΔISPT = -0.66%).
3.2.2 Effect of ΔLST on vegetation phenology along urban-rural gradient
To assess the response mechanisms of ΔUVP to urban expansion, we quantify the response amplitude of ΔUVP to urban heat island intensity and urban expansion intensity across 31 cities under varying city sizes and climatic contexts along urban-rural gradient.
As shown in Figures 13a-i, the responses of ΔSOSM, ΔEOSM, and ΔGSLM to urban heat island intensity exhibited spatial heterogeneity across the 31 cities. Vegetation ΔSOSM demonstrated positive correlations with heat island intensity in individual cities (Guangzhou, Fuzhou), whereas negative correlations predominated in most cities. For vegetation ΔEOSM and ΔGSLM, positive correlations with heat island intensity prevailed across all cities except Guangzhou and Haikou. Integrated analysis revealed that per 1°C increase in ΔLSTM along the urban-rural gradient, vegetation ΔSOSM advanced by 7.5 days, ΔEOSM delayed by 4.3 days, and ΔGSLM prolonged by 12.0 days. Medium cities exhibited the maximum ΔUVP response amplitude, with ΔSOSM advancement of 8.9 days, ΔEOSM delay of 4.9 days, and ΔGSLM extension of 14.0 days per 1°C ΔLSTM increase. Secondary responses occurred in small towns (k1 = -8.3 d/°C, k2 = 4.6 d/°C, k3 = 13.0 d/°C) and small cities (k1 = -7.0 d/°C, k2 = 4.1 d/°C, k3 = 11.2 d/°C), whereas large cities showed minimal response amplitude (k1 = -4.7 d/°C, k2 = 3.5 d/°C, k3 = 8.3 d/°C). Additionally, across cities with distinct climatic contexts, semi-arid zones (k1 = -11.0 d/°C, k2 = 6.0 d/°C, k3 = 17.1 d/°C) and arid zones (k1 = -9.6 d/°C, k2 = 5.9 d/°C, k3 = 15.6 d/°C) exhibited greater response magnitudes compared to semi-humid zones (k1 = -5.3 d/°C, k2 = 3.7 d/°C, k3 = 9.1 d/°C) and humid zones (k1 = -3.4 d/°C, k2 = 1.6 d/°C, k3 = 5.1 d/°C).

Figure 13. The spatial distribution characteristics of the response amplitudes of (a) ΔSOSM, (d) ΔEOSM, (g) ΔSOSM to ΔLSTM in 31 cities of China. The distribution of the response amplitudes of (b, c) ΔSOSM, (e, f) ΔEOSM, (h, i) ΔSOSM to ΔLSTM under different city sizes and climatic zones in 31 cities of China.
Comparatively, the response mechanisms of ΔUVPT to urban heat island intensity remained fundamentally consistent with ΔUVPM across city sizes and climatic contexts (Figures 14a-i). The response magnitudes of vegetation ΔSOS_Trend, ΔEOS_Trend, and ΔGSL_Trend to urban heat island intensity were most pronounced in medium cities, with ΔSOS_Trend advanced by 13.3 days, ΔEOS_Trend delayed by 10.1 days, and ΔGSL_Trend prolonged by 23.5 days per 1°C increase in ΔLSTT. Small towns (k1 = -12.9 d/°C, k2 = 8.3 d/°C, k3 = 21.1 d/°C) and small cities (k1 = -11.6 d/°C, k2 = 7.4 d/°C, k3 = 19.0 d/°C) showed secondary responses, while large cities (k1 = -5.3 d/°C, k2 = 3.9 d/°C, k3 = 9.3 d/°C) exhibited the smallest. Additionally, for cities with different climatic backgrounds, semi-arid zones (k1 = -14.8 d/°C, k2 = 10.9 d/°C, k3 = 25.5 d/°C) and arid zones (k1= -13.7 d/°C, k2 = 9.8 d/°C, k3 = 23.7 d/°C) exhibited significantly greater magnitudes of vegetation ΔSOS_Trend, ΔEOS_Trend, and ΔGSL_Trend responses to urban heat island intensity compared to semi-humid zones (k1 = -10.9 d/°C, k2 = 7.9 d/°C, k3 = 18.8 d/°C) and humid zones (k1 = -5.3 d/°C, k2 = 2.1 d/°C, k3 = 7.5 d/°C).
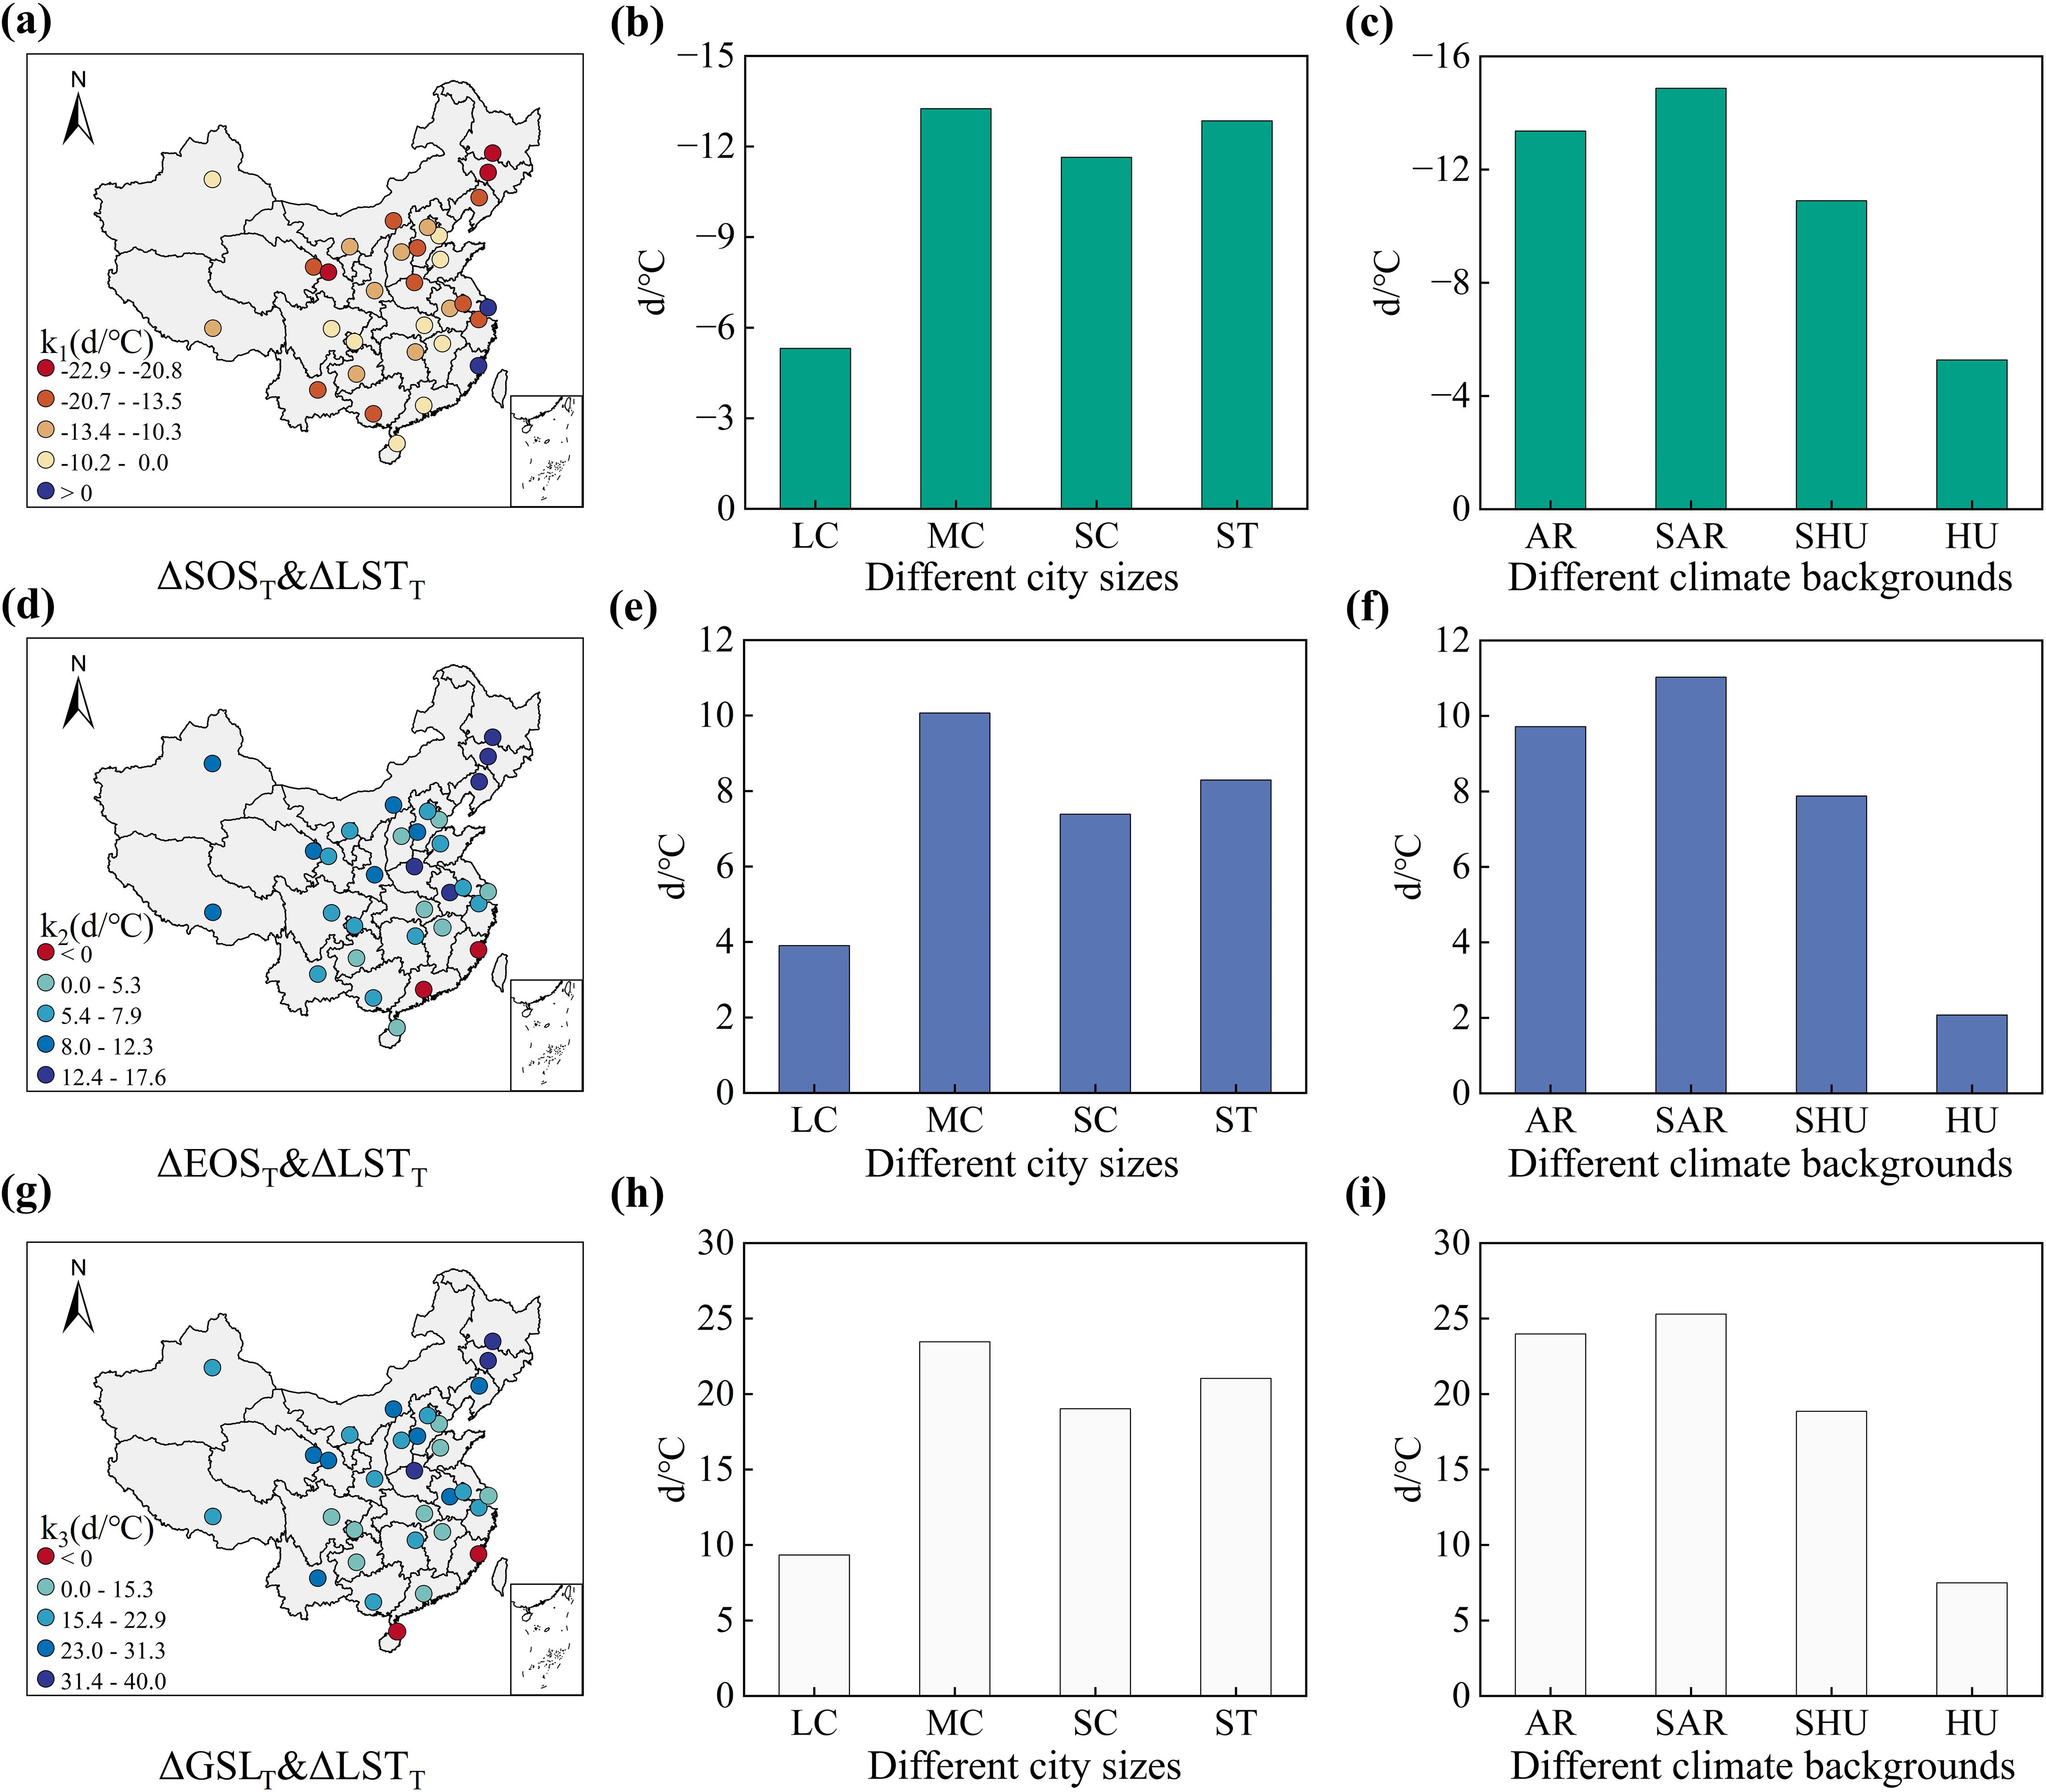
Figure 14. The spatial distribution characteristics of the response amplitudes of (a) ΔSOST, (d) ΔEOST, (g) ΔSOST to ΔLSTT in 31 cities of China. The distribution of the response amplitudes of (b, c) ΔSOST, (e, f) ΔEOST, (h, i) ΔSOST to ΔLSTT under different city sizes and climatic zones in 31 cities of China.
3.2.3 Effect of ΔISP on vegetation phenology along urban-rural gradient
Comparatively, the response mechanisms of ΔUVPM to urban expansion intensity showed variations across 31 cities with different city sizes and climatic zones (Figures 15a-i). Vegetation ΔSOSM showed positive correlations with urban expansion intensity in specific cities (Guangzhou, Fuzhou), while negative correlations prevailed in most cities. Vegetation ΔEOSM and ΔGSLM exhibited positive correlations in all cities except Guangzhou and Haikou. Overall, along the urban-rural gradient, each 1% increase in ΔISPM advanced vegetation ΔSOSM by 0.19 days, delayed ΔEOSM by 0.11 days, and prolonged ΔGSLM by 0.30 days across the 31 cities.
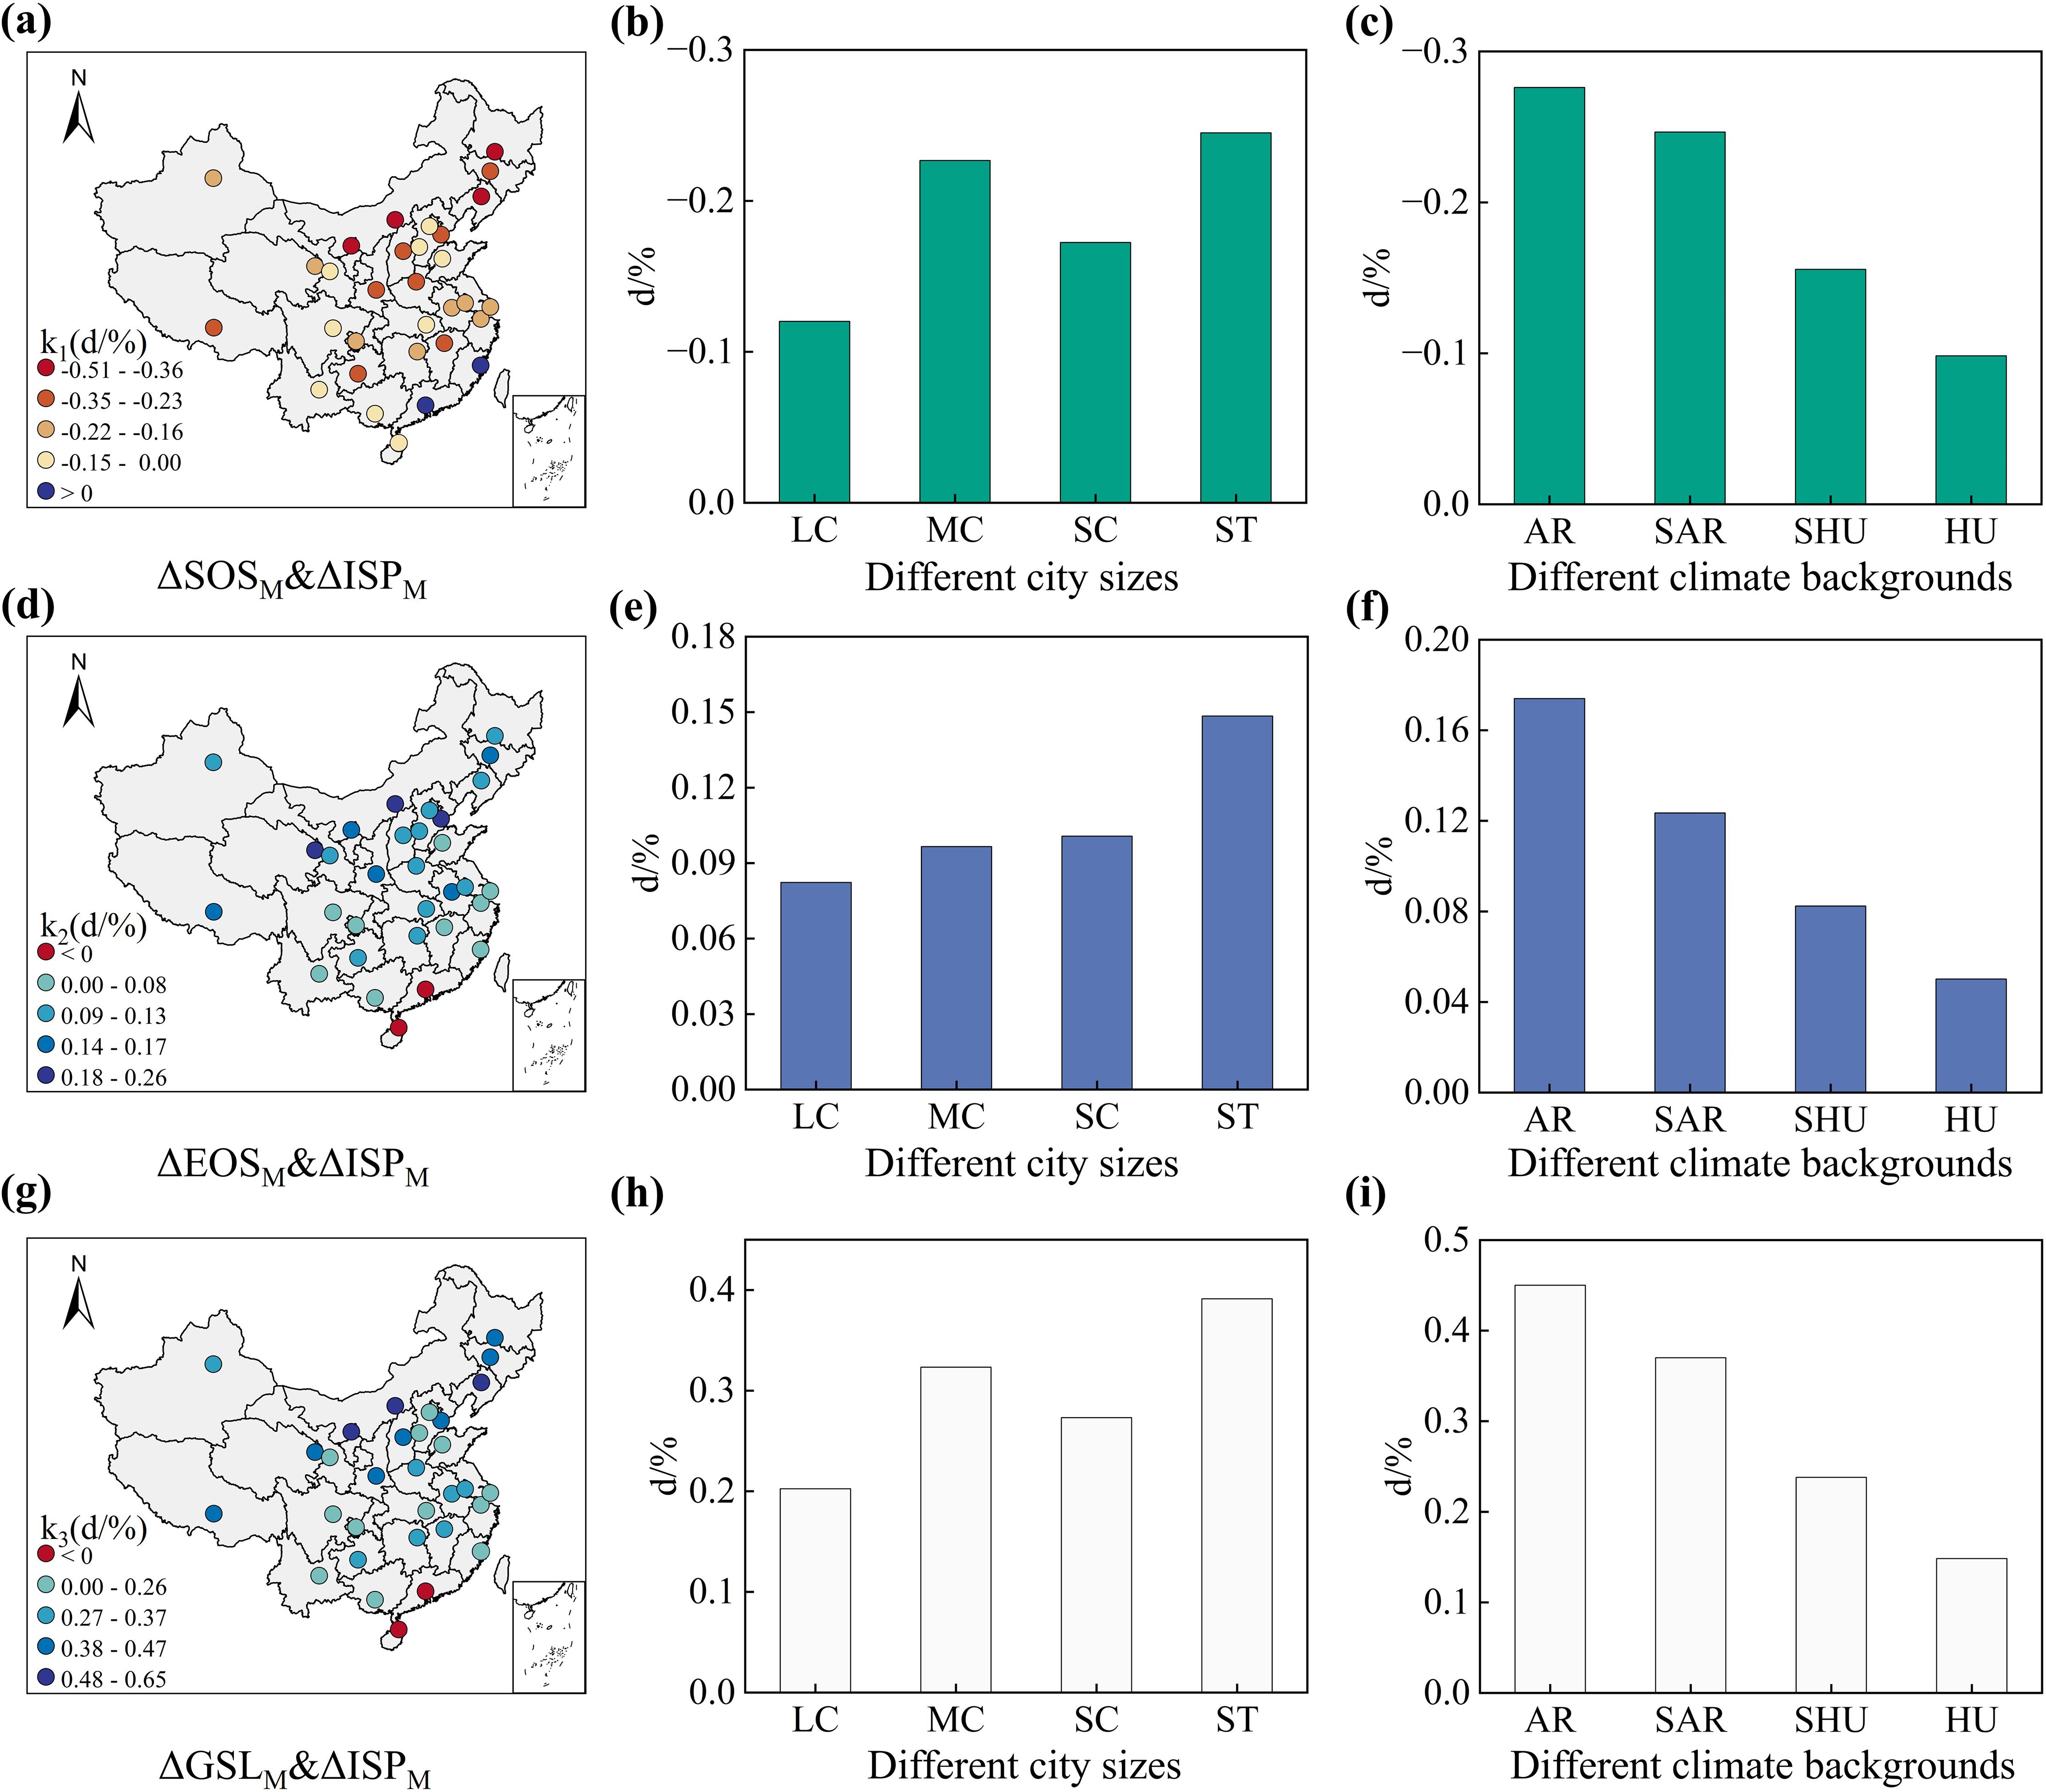
Figure 15. The spatial distribution characteristics of the response amplitudes of (a) ΔSOSM, (d) ΔEOSM, (g) ΔSOSM to ΔISPM in 31 cities of China. The distribution of the response amplitudes of (b, c) ΔSOSM, (e, f) ΔEOSM, (h, i) ΔSOSM to ΔISPM under different city sizes and climatic zones in 31 cities of China.
The response of ΔUVPM to urban expansion intensity among different city sizes, the response amplitudes of ΔSOSM and ΔGSLM of vegetation in small towns to urban expansion intensity are the largest. For every 1% increase in ΔISPM, vegetation ΔSOSM advanced by 0.25 days and ΔGSLM prolonged by 0.39 days. Medium cities (k1 = -0.23 d/%, k3 = 0.32 d/%) and small cities (k1 = -0.17 d/%, k3 = 0.27 d/%) exhibited moderate responses, with large cities (k1 = -0.12 d/%, k3 = 0.20 d/%) demonstrating the smallest. The vegetation ΔEOSM response peaked in small towns (0.15 days advancement per 1% ΔISPM increase), followed by small (k2 = 0.10 d/%) and medium cities (k2 = 0.10 d/%), while large cities showed minimal response (k2 = 0.08 d/%). Additionally, arid zones (k1 = -0.28 d/%, k2 = 0.17 d/%, k3 = 0.45 d/%) and semi-arid zones (k1 = -0.25 d/%, k2 = 0.12 d/%, k3 = 0.37 d/%) demonstrated significantly stronger ΔSOSM, ΔEOSM, and ΔGSLM responses than semi-humid zones (k1 = -0.16 d/%, k2 = 0.08 d/%, k3 = 0.24 d/%) and humid zones (k1 = -0.10 d/%, k2 = 0.05 d/%, k3 = -0.15 d/%).
For ΔUVPT (Figures 16a-i), small towns demonstrated the maximum response amplitude of ΔSOS_Trend and ΔGSL_Trend to urban expansion intensity, with vegetation ΔSOS_Trend advancing 0.28 days and ΔGSL_Trend prolonging 0.45 days per 1% ISPT increase. Moderate responses were observed in medium cities (k1 = -0.25 d/%, k3 = 0.37 d/%) and small cities (k1 = -0.19 d/%, k3 = 0.32 d/%), whereas large cities exhibited the smallest responses (k1 = -0.15 d/%, k3 = 0.27 d/%). Regarding ΔEOS_Trend responses, small towns showed maximum sensitivity with 0.16 days advancement per 1% ISPT increase, followed by small cities (k2 = 0.13 d/%) and medium cities (k2 = 0.111 d/%), while large cities displayed minimal responses (k2 = 0.11 d/%). Additionally, cities in arid zones (k1 = -0.29 d/%, k2 = 0.22 d/%, k3 = 0.52 d/%) and semi-arid zones (k1 = -0.27 d/%, k2 = 0.14 d/%, k3 = 0.42 d/%) exhibited stronger ΔSOS_Trend, ΔEOS_Trend, and ΔGSL_Trend responses to expansion intensity compared to those in semi-humid zones (k1 = -0.20 d/%, k2 = 0.13 d/%, k3 = 0.33 d/%) and humid zones (k1 = -0.12 d/%, k2 = 0.03 d/%, k3 = 0.16 d/%).

Figure 16. The spatial distribution characteristics of the response amplitudes of (a) ΔSOST, (d) ΔEOST, (g) ΔSOST to ΔISPT in 31 cities of China. The distribution of the response amplitudes of (b, c) ΔSOST, (e, f) ΔEOST, (h, i) ΔSOST to ΔISPT under different city sizes and climatic zones in 31 cities of China.
3.2.4 The contribution of urban and climatic factors to ΔUVP
To assess the contributions of urban and climatic factors to ΔUVP along the urban-rural gradient, three urban factors (ΔLST, ΔISP, ΔPOP) and three climatic factors (ΔTEM, ΔPRE, ΔRAD) were selected. Partial correlation analysis revealed negative correlations between ΔLST, ΔISP, ΔPRE, ΔRAD, and vegetation ΔSOS, while positive correlations were observed for ΔPOP and ΔTEM (Figures 17a-c). ΔLST, ΔISP, ΔPRE, and ΔRAD showed positive correlations with vegetation ΔEOS and ΔGSL, whereas ΔPOP and ΔTEM exhibited negative correlations. ΔISP demonstrated the most significant effects on vegetation ΔSOS (r = -0.32, P < 0.05), ΔEOS (r = 0.23, P < 0.05), and ΔGSL (r = -0.38, P < 0.05). Urban factors overall showed stronger correlations with urban vegetation phenology than climatic factors along the urban-rural gradients.

Figure 17. The partial correlation coefficient between (a) ΔSOS, (b) ΔEOS, (c) ΔGSL and 6 factors (ΔLST, ΔISP, ΔPOP, ΔTEM, ΔPRE and ΔRAD). * represents P < 0.05.
Furthermore, this study utilized a random forest model to assess the relative importance of urban and climatic factors on ΔUVP. As shown in Figures 18a-c, among the six factors, ΔISP contributed the most to vegetation ΔSOS, while ΔRAD contributed the least. Urban factors collectively accounted for 69% of the contribution to vegetation ΔSOS along the urban-rural gradient, compared to 31% from climatic factors. For vegetation ΔEOS, ΔLST showed the highest contribution among the six factors, with ΔRAD exhibiting the lowest contribution. Urban factors accounted for 77% of the contribution to vegetation ΔEOS across the urban-rural gradient, whereas climatic factors contributed only 23%. Regarding urban vegetation ΔGSL, ΔISP demonstrated the maximum contribution among the six factors, and ΔPRE showed the minimum contribution. Along the urban-rural gradient, urban factors contributed 78% to urban vegetation ΔGSL, contrasting with 22% from climatic factors. The results indicate that although climate change has significant impacts on vegetation phenology at large scales, but localized climate changes induced by urban expansion along the urban-rural gradient may be the primary cause of urban-rural differences in vegetation phenology. Additionally, urban vegetation ΔSOS exhibited relatively higher sensitivity to climate change compared to other phenological parameters.

Figure 18. The relative importance between (a) ΔSOS, (b) ΔEOS, (c) ΔGSL and 6 factors (ΔLST, ΔISP, ΔPOP, ΔTEM, ΔPRE and ΔRAD).
4 Discussion
4.1 The synergistic regulatory effect of urban expansion and climate change on urban vegetation phenology
This study employed MCD12Q2 EVI phenology data to analyze spatiotemporal patterns of vegetation phenology across urban-rural gradients in 31 Chinese cities from 2001 to 2020. The vegetation SOS, EOS, and GSL exhibited significant spatial heterogeneity along urban-rural gradients in all 31 cities. Cities in more humid zones showed earlier SOS, later EOS, compared to more arid zones. And the vegetation GSL shows a spatial pattern of “longer in the south and shorter in the north”. These findings align with previous vegetation phenology studies in China (Ji et al., 2023; Ge et al., 2016; Fu et al., 2022), indicating significant climatic regulation on phenological processes.
Notably, some cities (e.g., Guangzhou, Haikou, Xinjiang) exhibited reversed vegetation phenology trends compared to others. Previous studies indicate that rising temperatures can interfere with the cold chilling process of vegetation during winter, excessively high temperatures reduce the accumulated cold chilling required for vegetation to enter dormancy, that may result in delayed SOS (Cannell and Smith, 1983; Okie and Blackburn, 2011). Consequently, when temperatures rise beyond a certain threshold, the advancing effect of temperature on vegetation SOS may diminish or even reverse. For instance, the relatively high and gradually increasing average temperatures during winter and spring in the three provinces of South China may be a key factor leading to the delayed SOS of substantial vegetation (Ma et al., 2023). And Guangzhou, designated as a “National Garden City,” experiences a significantly higher intensity of anthropogenic intervention compared to other cities. The combined effects of rising temperatures and frequent artificial pruning may directly reverse vegetation phenological rhythms. Furthermore, in subtropical coastal cities such as Haikou and Guangzhou, typhoon-induced disturbances to vegetation are also likely to disrupt local vegetation phenology. Besides, water stress in extremely arid zones diminishes vegetation’s light and heat utilization efficiency, potentially delaying SOS and advancing EOS (He et al., 2018). Additionally, urban areas demonstrated more pronounced phenological changes than other regions. This might be because human activities in urban areas are more frequent and the degree of urban expansion is higher, resulting in a more significant urban heat island effect and transformation of surface cover types (Yang et al., 2023a). Meanwhile, suburban and exurban areas within urban expansion spheres showed moderate phenological impacts, though weaker than urban areas. Specifically, SOS advancement days, EOS delay days, and GSL extension days decreased in peri-urban areas compared to urban cores, with impacts diminishing with distance from city centers. This indicates urban vegetation phenology is regulated by both climate change and urban expansion.
The gradient responses of UVP exhibited significant variations across city sizes and climatic backgrounds. Small towns demonstrated significantly greater vegetation ΔSOS, ΔEOS, and ΔGSL compared to other city types, potentially associated with distinct urban expansion patterns. Divergent urban expansion intensities revealed that small towns predominantly expanded in urban areas with higher ISP values, resulting in higher ΔISP magnitudes. In contrast, large cities displayed relatively smaller ΔISP values due to their advanced urbanization stages characterized by peripheral expansion. Previous studies confirm that urban expansion intensity significantly modulates phenological changes (Li et al., 2017; Peng et al., 2024) explaining the more pronounced ΔUVP in small towns. Additionally, cities in arid and semi-arid zones exhibited substantially greater ΔUVP magnitudes than those in humid and semi-humid zones. This disparity may originate from precipitation constraints suppressing vegetation growth in arid zones, while urban irrigation alleviates water stress, amplifying phenological differentiation.
Across China’s 31 cities, ΔLST showed negative correlations with urban vegetation ΔSOS but positive correlations with ΔEOS and ΔGSL along urban-rural gradients, consistent with prior findings (Zhang et al., 2024; Kabano et al., 2021). Significant differences emerged in ΔUVP responses to ΔLST across city sizes and climatic contexts along the gradient. Medium cities displayed the most pronounced vegetation responses (ΔSOS, ΔEOS, ΔGSL) to ΔLST variations. Notably, large cities exhibited attenuated phenological responses to ΔLST compared to other city types. Previous research suggests that enhanced green infrastructure implementation during large city development mitigates urbanization impacts, despite their advanced urbanization levels (Qiu et al., 2021). Although we excluded agricultural pixels during the extraction of vegetation phenological parameters to minimize interference from managed vegetation, both urban agriculture (primarily seasonal short-term crops) and urban green spaces (with relatively stable phenological rhythms) may still influence the extracted parameters. Moreover, the cooling effect generated by the high proportion and quality of artificial green spaces in large cities could result in vegetation experiencing lower temperatures than the overall LST, leading to variations in the derived phenological parameters (as shown in Figure 19). Simultaneously, artificial water supplementation systems, such as green space irrigation and municipal watering, may reduce the responsiveness of vegetation phenology to changes in LST. Consequently, large cities demonstrate reduced ΔUVP sensitivity to ΔLST compared to smaller cities. It is important to note, however, that the scattered distribution and relatively small-scale nature of urban agriculture and green spaces makes accurate differentiation challenging with the land use product employed in this study. While higher-resolution land use products (e.g., the 10-m GlobeLand30) could identify these features, their available time series are often insufficient to meet our study’s requirements, and significant scale discrepancies exist when matching them with the 500-m phenological data. Besides, our analysis revealed stronger ΔUVP responses to ΔLST in arid and semi-arid zones than in humid and semi-humid zones. This is likely because water availability acts as the primary limiting factor for vegetation growth in arid and semi-arid regions. Moreover, artificial irrigation systems and other water supplementation measures in cities may also be a contributing factor to the stronger response of ΔUVP to ΔLST in arid regions. In arid and semi-arid areas, vegetation under water stress exhibits reduced sensitivity of phenology to land surface temperature. Artificial irrigation significantly alleviates this stressor. For example, in cities like Lanzhou, the core urban areas have a much higher irrigation coverage compared to the peripheral zones. This leads to a considerably greater magnitude of phenological change in the urban core vegetation than in the surrounding areas, thereby amplifying the response magnitude of ΔUVP to ΔLST. Meanwhile, the response amplitude of ΔUVP to ΔLST in arid areas is slightly lower than that in semi-arid areas. This implies that while aridity enhances temperature sensitivity, extreme drought conditions may constrain ΔUVP responses to ΔLST. Moreover, vegetation ΔSOS showed negative correlations with ΔISP along the gradient, whereas ΔEOS and ΔGSL maintained positive correlations. These patterns align with findings from previous studies where increasing ISP correlated with advanced SOS, delayed EOS, and prolonged GSL in urban vegetation (Zhang et al., 2022; Yuan et al., 2022). Furthermore, large cities demonstrated significantly weaker phenological responses to ΔISP variations along the gradient compared to other city types.
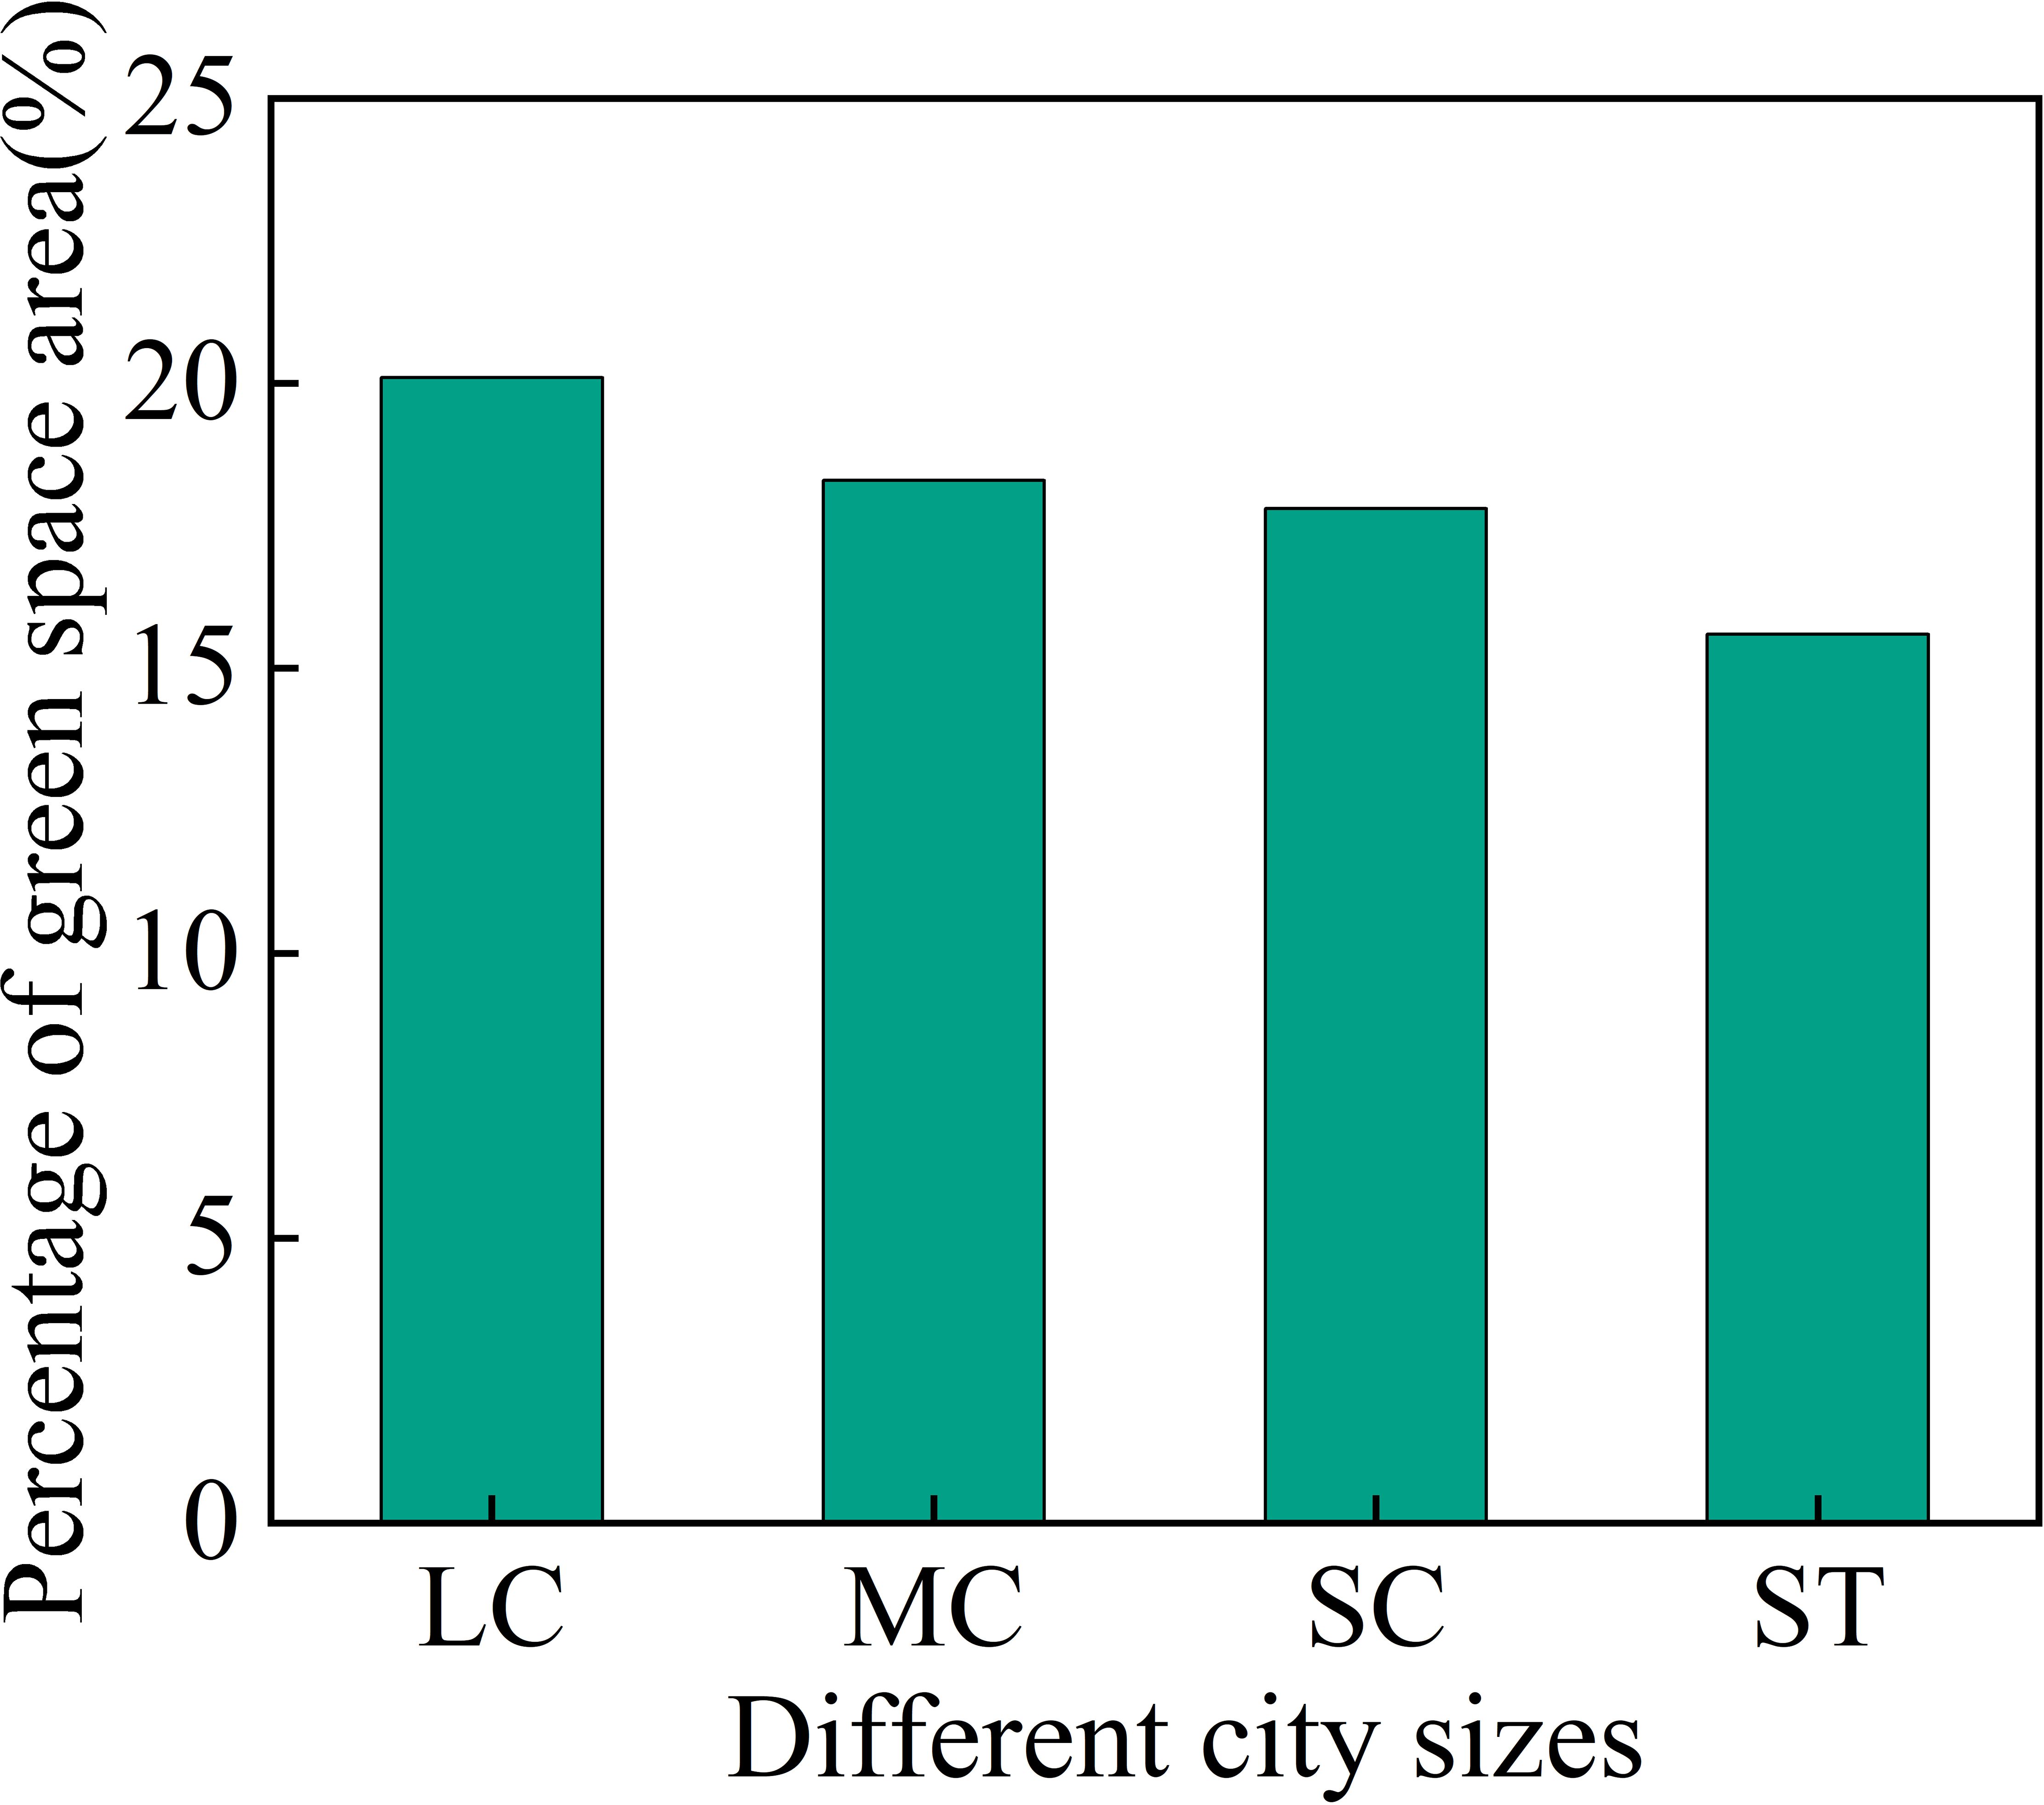
Figure 19. The percentage of green space area under different city sizes.
Analysis of influencing factors on urban vegetation phenology along the urban-rural gradient revealed differential impacts of urban and climatic drivers. Partial correlation analysis identified ΔISP as the dominant urban factor affecting ΔSOS, ΔEOS, and ΔGSL, while other factors showed parameter-specific influences. Beyond ΔISP regulation, ΔLST and ΔPOP exhibited substantial contributions to vegetation ΔSOS variations. For vegetation ΔEOS, significant modulation by ΔLST and ΔTEM was observed, whereas most factors demonstrated comparable contributions to ΔGSL. These findings align with previous studies suggesting that urban expansion primarily drives ΔUVP through localized climatic modifications (Wang et al., 2019). Random forest modeling confirmed this conclusion through quantitative importance assessment of ΔUVP determinants. Divergently, ΔISP showed peak contributions to ΔSOS and ΔGSL, whereas ΔLST dominated ΔEOS variations. Consistently, urban factors constituted the principal determinants of ΔUVP patterns along the urban-rural gradients. Furthermore, Climatic factors exerted stronger influences on ΔSOS than on ΔEOS and ΔGSL, indicating heightened climate sensitivity of vegetation SOS, consistent with established research. Conversely, the study by Ji et al. suggested that the interannual trends of vegetation phenology across discrete urban zones follow a unimodal pattern, peaking in newly urbanized areas. They concluded that climate change, rather than urbanization, plays the dominant role in driving interannual UVP variations across all urban zones—a finding that diverges from our results. This discrepancy arises because Ji et al.’s research quantitatively analyzed interannual vegetation phenology trends within areas of differing urban expansion intensity. In contrast, our study focuses on quantitatively assessing how vegetation phenology changes along an urban-rural gradient in response to spatial variations in urban expansion intensity. Specifically, we investigate how the impact of urban expansion on vegetation phenology varies with increasing distance from the city center as the intensity of urban expansion changes.
4.2 Limitations and uncertainties
Our study may be subject to the following uncertainties. The vegetation indices derived from moderate spatial resolution remote sensing imagery cannot capture high-precision details of urban vegetation growth dynamics. Meanwhile, the dynamic threshold method with 15% threshold for phenology extraction lacks validation due to insufficient ground-based phenological observations in Chinese cities, potentially introducing errors in remote sensing-derived phenological parameters. Our focus on large-scale phenological variations overlooks region-specific species characteristics, which may contribute to uncertainties. Finally, although agricultural pixels were excluded, extensive artificial green space construction in large cities and arid zones may influence ΔUVP assessments. Furthermore, the meteorological data selected for this study were obtained from the ERA5-LAND monthly average product. It is important to note that its relatively coarse spatial resolution (0.1 degrees, approximately 11 km) may limit the accurate differentiation of intra-urban variations. However, due to the sparse distribution of ground-based meteorological observation stations and frequent data gaps in the arid regions of Northwest China, the ERA5-LAND dataset was selected for its continuous, gap-free spatiotemporal records since 2001, offering superior temporal continuity and spatial coverage compared to alternative data sources. Although we resampled the data to a 500m resolution to mitigate associated errors, we acknowledge that this process may still introduce certain inaccuracies. Therefore, we recommend that future studies employ integrated techniques such as “machine learning-based downscaling combined with multi-source data assimilation” to fuse ERA5 reanalysis data with high-resolution remote sensing products and ground-based station observations, thereby generating high-resolution meteorological datasets for more precise research outcomes.
5 Conclusions
This study systematically revealed the spatiotemporal differentiation patterns of UVP along urban-rural gradients and their response mechanisms to urban expansion in 31 Chinese cities using multi-source remote sensing data (2001-2020). And the synergistic regulatory effects of urban expansion and climate change on ΔUVP along urban-rural gradients were further investigated. The main conclusions are as follows:
1. Across 31 Chinese cities, vegetation SOS showed systematic advancement, EOS exhibited delayed occurrence, and GSL demonstrated extension, with phenological variation magnitudes diminishing along the urban-rural gradient. Concurrently, cities in humid southeastern regions displayed earlier SOS, later EOS, and longer GSL compared to arid northwestern counterparts. This spatial pattern suggests synergistic regulation of UVP by urban expansion and climate change, with urbanization impacts attenuating with increasing distance from urban cores.
2. Under varying city sizes and climatic contexts, large cities exhibited smaller ΔSOS, ΔEOS, and ΔGSL magnitudes compared to medium cities, small cities, and small towns. And the vegetation ΔSOS, ΔEOS and ΔGSL in small towns were the largest. Arid and semi-arid zones showed significantly greater ΔSOS, ΔEOS, and ΔGSL than humid and semi-humid zones. Additionally, negative ΔLSTM/T and ΔISPM/T values across all 31 cities indicated the LST and ISP in the urban area are higher than those in the surrounding areas, and the warming and expansion rates are faster. Therefore, small towns and cities should strictly control their expansion intensity and patterns, prioritizing the protection of native vegetation patches to maintain natural phenological rhythms. For large cities, it is imperative to construct multi-tiered green space networks to enhance connectivity and prevent habitat fragmentation, which can lead to compromised ecological functionality. In arid and semi-arid regions, urban areas should improve fundamental irrigation infrastructure to stabilize vegetation phenological rhythms across both urban and peri-urban areas.
3. Vegetation ΔSOS was negatively correlated with ΔLST on the urban-rural gradient in 94% of the cities, ΔEOS was positively correlated with ΔLST, and ΔGSL was positively correlated with ΔLST. Medium cities displayed maximum response magnitudes, followed by small towns and small cities, with large cities showing minimal sensitivity. The response amplitudes of vegetation ΔSOS, ΔEOS and ΔGSL to ΔLST in arid and semi-arid areas were significantly greater than those in humid and semi-humid areas. Furthermore, vegetation ΔSOS was negatively correlated with ΔISP on the urban-rural gradient in 94% of the cities, ΔEOS was positively correlated with ΔLST, and ΔGSL was positively correlated with ΔLST. And the response amplitude of large cities is significantly smaller than that of small towns, small cities and medium cities. The response amplitudes of vegetation ΔSOS, ΔEOS and ΔGSL to ΔISP in arid and semi-arid areas are significantly greater than those in humid and semi-humid areas.
4. Among urban and climatic factors, ΔISP was identified as the principal regulator of ΔUVP. Additionally, Urban factors collectively accounted for 69% of the contribution to vegetation ΔSOS, 77% to ΔEOS, and 78% to ΔGSL variations along the urban-rural gradient. Climatic factors contributed 31% to ΔSOS, 23% to ΔEOS, and 22% to ΔGSL variability across the gradient. The vegetation ΔSOS, ΔEOS, and ΔGSL in all 31 cities were predominantly influenced by urban factors along the urban-rural gradient. Comparatively, vegetation ΔSOS was more sensitive to climate change than ΔEOS and ΔGSL.
Data availability statement
The original contributions presented in the study are included in the article/supplementary material. Further inquiries can be directed to the corresponding author.
Author contributions
HY: Conceptualization, Writing – review & editing, Writing – original draft, Methodology, Validation. QZ: Methodology, Validation, Conceptualization, Writing – original draft, Writing – review & editing. SZ: Conceptualization, Validation, Methodology, Writing – original draft, Writing – review & editing. XW: Methodology, Conceptualization, Validation, Funding acquisition, Writing – original draft, Writing – review & editing. HYY: Validation, Methodology, Funding acquisition, Conceptualization, Writing – review & editing, Writing – original draft.
Funding
The author(s) declare financial support was received for the research and/or publication of this article. This research was supported by the Major Science and Technology Project of Gansu Province (Grant No. 24ZD13FA003) and the Natural Science Foundation of Gansu Province (Grant No. 23JRRG0015).
Acknowledgments
The anonymous reviewers of the editorial department of the Journal and the editor of the editorial department provided valuable suggestions for the improvement of this article.
Conflict of interest
The authors declare that the research was conducted in the absence of any commercial or financial relationships that could be construed as a potential conflict of interest.
Generative AI statement
The author(s) declare that no Generative AI was used in the creation of this manuscript.
Any alternative text (alt text) provided alongside figures in this article has been generated by Frontiers with the support of artificial intelligence and reasonable efforts have been made to ensure accuracy, including review by the authors wherever possible. If you identify any issues, please contact us.
Publisher’s note
All claims expressed in this article are solely those of the authors and do not necessarily represent those of their affiliated organizations, or those of the publisher, the editors and the reviewers. Any product that may be evaluated in this article, or claim that may be made by its manufacturer, is not guaranteed or endorsed by the publisher.
References
Bühler O., Nielsen C., and Kristoffersen P. (2006). Growth and phenology of established tilia cordata street trees in response to different irrigation regimes. Int. Soc. Arboriculture. 31, 3–9. doi: 10.48044/jauf.2006.001
Cannell M. G. R. and Smith R. I. (1983). Thermal time, chill days and prediction of budburst in picea sitchensis. J. Appl. Ecology. 20, 951. doi: 10.2307/2403139
Chen Y., Lin M., Lin T., Zhang J., Jones L., Yao X., et al. (2023). Spatial heterogeneity of vegetation phenology caused by urbanization in China based on remote sensing. Ecol. Indic. 153, 110448. doi: 10.1016/j.ecolind.2023.110448
Chen X. and Zhang Y. (2023). The impact of vegetation phenology changes on the relationship between climate and net primary productivity in yunnan, China, under global warming. Front. Plant Sci. 14. doi: 10.3389/fpls.2023.1248482, PMID: 37799554
Cheval S., Amihăesei V.-A., Chitu Z., Dumitrescu A., Falcescu V., Iraşoc A., et al. (2024). A systematic review of urban heat island and heat waves research, (1991–2022). Clim. Risk Manage. 44, 100603. doi: 10.1016/j.crm.2024.100603
Dallimer M., Tang Z., Bibby P. R., Brindley P., Gaston K. J., and Davies Z. G. (2011). Temporal changes in greenspace in a highly urbanized region. Biol. Lett. 7, 763–766. doi: 10.1098/rsbl.2011.0025, PMID: 21429910
Doick K. J., Peace A., and Hutchings T. R. (2014). The role of one large greenspace in mitigating london’s nocturnal urban heat island. Sci. Total Environ. 493, 662–671. doi: 10.1016/j.scitotenv.2014.06.048, PMID: 24995636
Fang H., Sha M., Xie Y., Lin W., Qiu D., Tu J., et al. (2023). Shifted global vegetation phenology in response to climate changes and its feedback on vegetation carbon uptake. Remote Sens. 15, 2288. doi: 10.3390/rs15092288
Fu Y., Zhang J., Wu Z., and Chen S. (2022). Review of vegetation phenology trends in China in a changing climate. Prog. Phys. Geogr. Earth Environ. 46 (6), 829–845. doi: 10.12202/j.0476-0301.2022170
Gao M., Wang X., Meng F., Liu Q., Li X., Zhang Y., et al. (2020). Three-dimensional change in temperature sensitivity of northern vegetation phenology. Global Change Biol. 26, 5189–5201. doi: 10.1111/gcb.15200, PMID: 32475002
Gao X. and Zhao D. (2022). Impacts of climate change on vegetation phenology over the great lakes region of central asia from 1982 to 2014. Sci. Total Environ. 845, 157227. doi: 10.1016/j.scitotenv.2022.157227, PMID: 35809736
Ge Q., Dai J., Cui H., and Wang H. (2016). Spatiotemporal variability in start and end of growing season in China related to climate variability. Remote Sens. 8, 433. doi: 10.3390/rs8050433
Gong Z., Ge W., Guo J., and Liu J. (2024). Satellite remote sensing of vegetation phenology: progress, challenges, and opportunities. ISPRS J. Photogramm. Remote Sens. 217, 149–164. doi: 10.1016/j.isprsjprs.2024.08.011
Gong P., Li X., Wang J., Bai Y., Chen B., Hu T., et al. (2020). Annual maps of global artificial impervious area (GAIA) between 1985 and 2018. Remote Sens. Environ. 236, 111510. doi: 10.1016/j.rse.2019.111510
He B., Ding J., Li H., Liu B., and Chen W. (2018). Spatiotemporal variation of vegetation phenology in xinjiang from 2001 to 2016. Acta Ecologica Sinica. 38, 2139–2155. doi: 10.5846/stxb201701140115
Hu Y. and Jia G. (2010). Influence of land use change on urban heat island derived from multi-sensor data. Int. J. Climatol. 30, 1382–1395. doi: 10.1002/joc.1984
Ishtiaque A., Myint S. W., and Wang C. (2016). Examining the ecosystem health and sustainability of the world’s largest mangrove forest using multi-temporal MODIS products. Sci. Total Environ. 569–570, 1241–1254. doi: 10.1016/j.scitotenv.2016.06.200, PMID: 27387809
Ji Y., Zhan W., Du H., Wang S., Li L., Xiao J., et al. (2023). Urban-rural gradient in vegetation phenology changes of over 1500 cities across China jointly regulated by urbanization and climate change. ISPRS J. Photogramm. Remote Sens. 205, 367–384. doi: 10.1016/j.isprsjprs.2023.10.015
Jin H., Jönsson A. M., Olsson C., Lindström J., Jönsson P., and Eklundh L. (2019). New satellite-based estimates show significant trends in spring phenology and complex sensitivities to temperature and precipitation at northern european latitudes. Int. J. Biometeorol. 63, 763–775. doi: 10.1007/s00484-019-01690-5, PMID: 30805728
Kabano P., Lindley S., and Harris A. (2021). Evidence of urban heat island impacts on the vegetation growing season length in a tropical city. Landscape Urban Plann. 206, 103989. doi: 10.1016/j.landurbplan.2020.103989
Kato A., Carlson K. M., and Miura T. (2021). Assessing the inter-annual variability of vegetation phenological events observed from satellite vegetation index time series in dryland sites. Ecol. Indic. 130, 108042. doi: 10.1016/j.ecolind.2021.108042
Li X., Fu Y. H., Chen S., Xiao J., Yin G., Li X., et al. (2021). Increasing importance of precipitation in spring phenology with decreasing latitudes in subtropical forest area in China. Agric. For. Meteorol. 304–305, 108427. doi: 10.1016/j.agrformet.2021.108427
Li X., Gong P., Zhou Y., Wang J., Bai Y., Chen B., et al. (2020). Mapping global urban boundaries from the global artificial impervious area (GAIA) data. Environ. Res. Lett. 15, 94044. doi: 10.1088/1748-9326/ab9be3
Li N. and Xu G. (2020). Grid-based analysis of land use data based on natural discontinuity point classification method. Bull. Surv. Mapp. 4, 106–110 + 156. doi: 10.13474/j.cnki.11-2246.2020.0121
Li X., Zhou Y., Asrar G. R., Mao J., Li X., and Li W. (2017). Response of vegetation phenology to urbanization in the conterminous United States. Global Change Biol. 23, 2818–2830. doi: 10.1111/gcb.13562, PMID: 27988975
Liang H., Zhao H., Cheng W., Lu Y., Chen Y., Li M., et al. (2024). Accelerating urban warming effects on the spring phenology in cold cities but decelerating in warm cities. Urban For. Urban Greening 102, 128585. doi: 10.1016/j.ufug.2024.128585
Liu Q., Fu Y. H., Zhu Z., Liu Y., Liu Z., Huang M., et al. (2016). Delayed autumn phenology in the northern hemisphere is related to change in both climate and spring phenology. Global Change Biol. 22, 3702–3711. doi: 10.1111/gcb.13311, PMID: 27061925
Liu D., Zhang J., Zhao L., Zhao S., and Cui G. (2024). The positive impact of extreme heat on vegetation growth in Northeast Asia. Agric. For. Meteorology. 347, 109918. doi: 10.1016/j.agrformet.2024.109918
Liu Z., Zhou Y., and Feng Z. (2023). Response of vegetation phenology to urbanization in urban agglomeration areas: a dynamic urban–rural gradient perspective. Sci. Total Environ. 864, 161109. doi: 10.1016/j.scitotenv.2022.161109, PMID: 36566859
Luo X., Zhang Y., and Sun D. (2020). Response patterns of vegetation phenology along urban-rural gradients in urban areas of different sizes. Sfi. S. Sci. C. 2020, 1–11. doi: 10.1155/2020/7607936
Ma H., Wang H., and Zhang F. (2023). Spatio-temporal changes of vegetation phenology in three South China provinces (autonomous regions) from 2001 to 2020. J. Trop. Subtropical Botany. 32, 330–338. doi: 10.11926/jtsb.4751
Miu L., Yu Z., He Y., and Zhang Y. (2024). Phenological changes of urban vegetation in China and their responses to surface temperature. Acta Ecol. Sin. 44, 2479–2494. doi: 10.20103/j.stxb.202304070698
Mo Y., Chen S., Wu Z., Tang J., and Fu Y. (2024). The advancement in spring vegetation phenology in the northern hemisphere will reverse after 2060 under future moderate warming scenarios. Earth’s Future 12, e2023EF003788. doi: 10.1029/2023EF003788
Okie W. R. and Blackburn B. (2011). Increasing chilling reduces heat requirement for floral budbreak in peach. Hortscience 46, 245–252. doi: 10.21273/hortsci.46.2.245
Peng Z., Jiang D., Li W., Mu Q., Li X., Cao W., et al. (2024). Impacts of the scale effect on quantifying the response of spring vegetation phenology to urban intensity. Remote Sens. Environ. 315, 114485. doi: 10.1016/j.rse.2024.114485
Peng J., Ma J., Liu Q., Liu Y., Hu Y., Li Y., et al. (2018). Spatial-temporal change of land surface temperature across 285 cities in China: an urban-rural contrast perspective. Sci. Total Environ. 635, 487–497. doi: 10.1016/j.scitotenv.2018.04.105, PMID: 29677674
Qiu T., Song C., Zhang Y., Liu H., and Vose J. M. (2020). Urbanization and climate change jointly shift land surface phenology in the northern mid-latitude large cities. Remote Sens. Environ. 236, 111477. doi: 10.1016/j.rse.2019.111477
Qiu K., Zhang H., Gao J., Pei W., and Zhang B. (2021). Urban-Rural gradient changes of cold island effect in urban forest patches in Shanghai. Chin. J. Ecol. 40, 1409–1418. doi: 10.13292/j.1000-4890.202105.018
Ranjan A. K. and Gorai A. K. (2022). Evaluating phenological trends of different vegetation types in response to climate change over the rajmahal hills in India during 2001-2019. Remote Sens. Lett. 13, 898–911. doi: 10.1080/2150704X.2022.2106455
Shen X., Liu B., Henderson M., Wang L., Wu Z., Wu H., et al. (2018). Asymmetric effects of daytime and nighttime warming on spring phenology in the temperate grasslands of China. Agric. For. Meteorol. 259, 240–249. doi: 10.1016/j.agrformet.2018.05.006
Tan J. K. N., Belcher R. N., Tan H. T. W., Menz S., and Schroepfer T. (2021). The urban heat island mitigation potential of vegetation depends on local surface type and shade. Urban For. Urban Greening 62, 127128. doi: 10.1016/j.ufug.2021.127128
Wang L., De Boeck H. J., Chen L., Song C., Chen Z., McNulty S., et al. (2022). Urban warming increases the temperature sensitivity of spring vegetation phenology at 292 cities across China. Sci. Total Environ. 834, 155154. doi: 10.1016/j.scitotenv.2022.155154, PMID: 35413347
Wang S., Ju W., Peñuelas J., Cescatti A., Zhou Y., Fu Y., et al. (2019). Urban–rural gradients reveal joint control of elevated CO2 and temperature on extended photosynthetic seasons. Nat. Ecol. Evol. 3, 1076–1085. doi: 10.1038/s41559-019-0931-1, PMID: 31235928
Wang S., Liu Q., and Huang C. (2021). Vegetation change and its response to climate extremes in the arid region of Northwest China. Remote Sens. 13, 1230. doi: 10.3390/rs13071230
Yang Q., Huang X., and Tang Q. (2019). The footprint of urban heat island effect in 302 chinese cities: temporal trends and associated factors. Sci. Total Environ. 655, 652–662. doi: 10.1016/j.scitotenv.2018.11.171, PMID: 30476846
Yang J., Luo X., Jin C., Xiao X., and Xia J. (2020). Spatiotemporal patterns of vegetation phenology along the urban–rural gradient in coastal dalian, China. Urban Forestry Urban Greening 54, 126784. doi: 10.1016/j.ufug.2020.126784
Yang Y., Qiu X., Yang L., and Lee D. (2023b). Impacts of thermal differences in surfacing urban heat islands on vegetation phenology. Remote Sens. 15, 5133. doi: 10.3390/rs15215133
Yang Q., Xu Y., Tong X., Hu T., Liu Y., Chakraborty T. C., et al. (2023a). Influence of urban extent discrepancy on the estimation of surface urban heat island intensity: a global-scale assessment in 892 cities. J. Cleaner Prod. 426, 139032. doi: 10.1016/j.jclepro.2023.139032
Yao R., Cao J., Wang L., Zhang W., and Wu X. (2019). Urbanization effects on vegetation cover in major african cities during 2001-2017. Int. J. Appl. Earth Obs. Geoinf. 75, 44–53. doi: 10.1016/j.jag.2018.10.011
Yin P., Li X., Mao J., Johnson B. A., Wang B., and Huang J. (2023). A comprehensive analysis of the crop effect on the urban-rural differences in land surface phenology. Sci. Total Environ. 861, 160604. doi: 10.1016/j.scitotenv.2022.160604, PMID: 36464037
Yuan Z., Yin S., Sa C., and Chi Y. (2022). The influence of urbanization on vegetation phenology in Hohhot in the past 20 years. Arid Land Geogr. 45, 1890–1898. doi: 10.12118/j.issn.1000−6060.2022.076
Zeng L., Wardlow B. D., Xiang D., Hu S., and Li D. (2020). A review of vegetation phenological metrics extraction using time-series, multispectral satellite data. Remote Sens. Environ. 237, 111511. doi: 10.1016/j.rse.2019.111511
Zhang X., Alimujiang K., Wei B., Yimuranzi A., and Han F. (2024). Analysis of the relationship between vegetation phenology and the surface thermal environment based on the downscaling of land surface temperature. Geogr. Res. 43, 1891–1910. doi: 10.11821/dlyj020230874
Zhang X., Friedl M. A., Schaaf C. B., Strahler A. H., and Schneider A. (2004). The footprint of urban climates on vegetation phenology. Geophys. Res. Lett. 31, 2004GL020137. doi: 10.1029/2004GL020137
Zhang X., Wang X., Zohner C., Li Y., Wu X., and Zhang Y. (2025). Declining precipitation frequency may drive earlier leaf senescence by intensifying drought stress and enhancing drought acclimation. Nat. Commun. 16, 910. doi: 10.1038/s41467-025-56159-4, PMID: 39837832
Zhang Y., Yin P., Li X., Niu Q., Wang Y., Cao W., et al. (2022). The divergent response of vegetation phenology to urbanization: A case study of beijing city, China. Sci. Total Environ. 803, 150079. doi: 10.1016/j.scitotenv.2021.150079, PMID: 34525721
Zhou X., Niu Q., Zhu D., Shao D., and Chen X. (2025). Vegetation phenological changes and Influencing factors in the Loess Plateau area of Gansu province. J. Soil Water Conserv. 39, 118–128 + 137. doi: 10.13870/j.cnki.stbcxb.2025.04.013
Zhou D., Zhao S., Liu S., and Zhang L. (2014a). Spatiotemporal trends of terrestrial vegetation activity along the urban development intensity gradient in China’s 32 major cities. Sci. Total Environ. 488–489, 136–145. doi: 10.1016/j.scitotenv.2014.04.080, PMID: 24829041
Zhou D., Zhao S., Liu S., Zhang L., and Zhu C. (2014b). Surface urban heat island in China’s 32 major cities: spatial patterns and drivers. Remote Sens. Environ. 152, 51–61. doi: 10.1016/j.rse.2014.05.017
Zhou D., Zhao S., Zhang L., and Liu S. (2016). Remotely sensed assessment of urbanization effects on vegetation phenology in China’s 32 major cities. Remote Sens. Environ. 176, 272–281. doi: 10.1016/j.rse.2016.02.010
Keywords: urban vegetation phenology, urban expansion, urban heat island, climate change, urban-rural gradient
Citation: Yang H, Zhang Q, Zhang S, Wang X and Yu H (2025) Joint control of urban expansion and climate change on urban-rural vegetation phenology gradient in 31 cities of China. Front. Ecol. Evol. 13:1637210. doi: 10.3389/fevo.2025.1637210
Received: 28 May 2025; Accepted: 06 October 2025;
Published: 16 October 2025.
Edited by:
Xing Hanfa, South China Normal University, ChinaReviewed by:
Xue Liu, East China Normal University, ChinaChante Jian Ding, University of Malaya, Malaysia
Copyright © 2025 Yang, Zhang, Zhang, Wang and Yu. This is an open-access article distributed under the terms of the Creative Commons Attribution License (CC BY). The use, distribution or reproduction in other forums is permitted, provided the original author(s) and the copyright owner(s) are credited and that the original publication in this journal is cited, in accordance with accepted academic practice. No use, distribution or reproduction is permitted which does not comply with these terms.
*Correspondence: Qiang Zhang, NDA4OTU0MDAwQHFxLmNvbQ==
†These authors have contributed equally to this work and share first authorship