 Martha Charitonidou1*
 Sofoklis Mouratidis1
 Kalliopi Stara1
 Konstantinos Kougioumoutzis2
 Richard M. Bateman3
 Kevin J. Walker4
 John M. Halley1*
- 1Laboratory of Ecology, Department of Biological Applications & Technology, University of Ioannina, Ioannina, Greece
- 2Laboratory of Botany, Department of Biology, University of Patras, Patras, Greece
- 3Jodrell Laboratory, Royal Botanic Gardens Kew, Richmond, United Kingdom
- 4Botanical Society of Britain and Ireland, Harrogate, United Kingdom
Introduction: Fifty-seven orchid species have been so far reported to occur naturally in Great Britain and Ireland, some of which are known to have declined over the last century, primarily due to land use changes. In this paper, we examine changes in distribution at the hectad scale (10 × 10 km) from 1930 to 2019.
Methods: We use hypothesis tests for trends in occupancy for each orchid species, asking if there is significant evidence of change that cannot be attributed to natural processes. We use 1/f-noise as a background variability to allow for the effect of temporal autocorrelation that models the effects of natural long-term changes. In our data analysis, we also apply Frequency Scaling Local Occupancy (Frescalo) to correct for variation in recording effort. We also investigate distribution centroid shifts and changes in orchid hotspots.
Results: Analysing a subset of 51 species in Great Britain, 13 show significant (at the 5% level) trends in occupancy, five positive and eight negative. In Ireland, five (out of 31) show significant trends, of which four are positive. There is no prevailing directional shift of orchid distributions. When patterns are averaged across the family, orchids appear to have moved northwards in Great Britain but south-westwards in Ireland. Since recording began, the number of high diversity hotspots (SR ≥16 species) has decreased in Great Britain (from 107 to 41) and increased in Ireland (up to 6 from none), though many hotspots remain stable.
Discussion: Although there is not a prevailing decline, the absence of significant change in hectad occupancy overall cannot be accepted as proof that all is well with orchids in the British Isles, since examination on finer scales could reveal significant declines at the population level. There have also been redistributions of diversity on small and large spatial scales, emphasizing a major role for processes operating across a range of scales in spatial as well as temporal variability.
1 Introduction
The systematic recording of orchids in Britain and Ireland has largely been undertaken by recorders of the Botanical Society of Britain and Ireland (hereafter BSBI) within irregularly bordered vice-counties (Watson, 1852) and, from the 1950s, in regular grid squares of the Ordnance Survey National Grid. The first grid-based Atlas was published by the BSBI in 1962 (Perring and Walters, 1962), although systematic monitoring of local floras has been in progress since the early 1800s (reviewed by Stroh et al., 2023). These national grid-based surveys of the British and Irish flora have been repeated for the periods 1987 – 1999 (Preston et al., 2002) and 2000 – 2019 (Stroh et al., 2023).
Fifty-seven species of orchids have been considered native to Great Britain and Ireland (GB: 56 species; IR: 31 species), although this number is something of a ‘moving target’ due to frequent taxonomic changes and, more recently, multiple immigration events (Bateman, 2022). Diversity is greatest on calcareous substrates in south-southern and south-east England, northern England and western Ireland. In terms of habitat choice, 27 species prefer grasslands, 13 species prefer woodlands, five species are equally at home in grasslands and woodlands, and 12 species prefer wetlands (e.g. Stroh et al., 2023). Rarer species are distributed among these habitat types more-or-less proportionally. Some species are known to have suffered significant declines over the last century, especially due to human activities (e.g. Farrell, 1985; Foley, 1990, 2004). Great Britain is one of the most highly populated and developed regions of Europe, especially in areas where orchid diversity is highest in southern and south-eastern England. The complexity of orchid life history and dependence on other organisms makes them vulnerable to environmental changes (Fay et al., 2015a; Kull et al., 2016; Seaton et al., 2010), especially habitat loss and modification as a result of large-scale land use changes (Shefferson et al., 2020; Wraith and Pickering, 2018, 2019). Since the 1940s, much of the British countryside has been heavily modified by agricultural changes, mainly the intensification of production, which led to the large-scale loss of semi-natural habitat and increasing nutrient inputs on the fragments that survived (Burns et al., 2016; Montràs-Janer et al., 2024; Taheri et al., 2021), while it has also increased the vulnerability of certain species to climatic change (Fay, 2018; Suggitt et al., 2023). Semi-natural grasslands have faced the greatest losses since the 1930s, declining by up to 39% between 1932 and 1984, with inorganic fertilizers affecting 85% of all grassland habitats (Fuller, 1987). The resulting fragmentation caused connectivity between fragments to fall by up to 98% (Hooftman and Bullock, 2012). Research using digitized historical maps has revealed a loss of over half (> 3000 km²) of the semi-natural grasslands in Great Britain over the last 75 years (Suggitt et al., 2023).
In this paper we focus on changes in the distribution of orchids in Great Britain and Ireland over the period covered by the BSBI atlases. Given the extent of the losses of natural grassland, and the fact that half of the orchid species native to Britain and Ireland are restricted to open, semi-natural grasslands, in conjunction with the expected climatic alterations, it seems natural to anticipate significant loss of orchid populations over this period. Several studies have attempted to investigate this question in the past, notably Kull and Hutchings (2006), who compared the changes in the orchid floras of the UK and Estonia, concluding that most species had declined in range over the last century in both countries. Damgaard et al. (2020) examined changes in the abundance of Danish orchids over 30 years by focusing on existing populations and found significant population declines. Vogt-Schilb et al. (2015) assessed the change of the distributions of 134 orchid taxa over 20 years in administrative units in France, Belgium and Luxembourg, based on the two editions of a book by the French Orchid Society (Bournérias et al., 1998; Bournérias and Prat, 2005). This work revealed declines of orchid species despite protection and found that most of these changes had more to do with land-use changes, such as urbanization, than climatic ones. Several studies in the UK came to different conclusions, either finding losses from randomly selected sample of historic populations of a few species (Walker et al., 2018) or mixtures of increases and decreases at the tetrad (2 × 2 km) scale (Braithwaite et al., 2006). Trudgill (2022, 2023) considered the BSBI data for Scottish and English orchids between 1950 and 2019, arguing that the failure to detect significant decline is because trends and changes in species occurrence through time are confounded by increasing sampling intensity. Trudgill (2022) used numbers of orchid tetrad records normalized to the corresponding total for all plant taxa, showing that with this metric, the frequency of orchids was decidedly downward for all species except the commonest Scottish orchid, Dactylorhiza maculata. However, an additional bias, possibly unique to the orchid family, is the very high recording effort dedicated to orchids across all time periods, which argues against using such a normalization. Considerable analysis is provided by the Atlas itself (Stroh et al., 2023), which explores trend patterns for various groups, such as native versus introduced species, or for species associated with specific land-types, though not for orchids specifically. The results are expressed diagrammatically as smoothed trends for individual species and for groups of species without assessing significance values (see also Pescott et al., 2022).
In this study, our interest is in trends of orchid distribution through the prism of hypotheses of significance. In particular, we test the hypothesis of significant change of hectad occupancy: how many species show evidence of change that cannot be attributed to natural processes, including the effect of temporal autocorrelation? Temporal autocorrelation of natural variability is a critical factor for interpreting the significance of environmental trends, since it may change p-values by orders of magnitude. Our study has several advantages over previous ones. Firstly, for all orchid species, it covers a longer timeframe (90 years) and considers temporal autocorrelation as well as the possibility of uneven sampling intensity. Also, spatially, we include all the British Isles. Moreover, while many previous studies in Europe consider only existing orchid-rich areas (Damgaard et al., 2020; Walker et al., 2018), our study includes all hectads, thus allowing for hotspots in the making.
A second question we address is the extent to which orchid distributions have shifted in response to climate change. Clearly, climatic variability is expected to affect the growth rates of orchid populations (Shefferson et al., 2020). Firstly, it is expected to affect orchids directly, through fluctuations in temperature and precipitation (Djordjević and Tsiftsis, 2022) or by reducing the availability of suitable habitat (Barman and Devadas, 2013). It could also interfere with interactions between mutualists, both above and below ground (Shefferson et al., 2020). Shifts of phenology patterns have already been observed in orchids (Molnár et al., 2012; Paušič et al., 2019; Robbirt et al., 2014). Several studies have argued that disruptions in the synchrony of orchid and pollinator phenology might arise from the changing climate (Hutchings et al., 2018; Robbirt et al., 2014; Willmer, 2014), though the likely consequences of such divergences continue to be debated (e.g. Bateman, 2025b). Climate models predict major increases in the variability of temperature and precipitation, and this is expected to lead to changes in species ranges (Charitonidou, 2022; Evans and Jacquemyn, 2022; Jacquemyn et al., 2024). Nevertheless, recent publications investigating range shifts in Britain, using atlases of the BSBI, did not find strong evidence for clear patterns of change in plant distributions (Groom, 2013; Montràs-Janer et al., 2024).
A third question concerns orchid hotspots of species richness. Do they occur in Great Britain and Ireland and, if so, have they changed in distribution through time? Biodiversity hotspots have been popular subjects of active research and conservation initiatives, since they constitute the best candidates to investigate the patterns of species diversity and extinction risk, as well as to design more targeted conservation strategies (Antonelli et al., 2023; Forest et al., 2007; Myers et al., 2000; Prendergast et al., 1993). Orchid hotspots have attracted special attention because of the great popularity of orchids and because they are among the most studied plants in the British and Irish flora (Bateman, 2022; Stroh et al., 2023). Although several orchid hotspots are widely recognized across the British Isles, we should attempt to determine whether these centers remained the same in richness and in position or alternatively changed significantly through time.
2 Materials and methods
2.1 Occurrence data and spatiotemporal resolution
The BSBI’s database of distribution (occurrence) records for British and Irish vascular plants is among the richest and most comprehensive collections of spatial data for plant taxa in the world; it currently comprises more than 50 million individual occurrence records at spatial scales ranging from 1 m2 to 10,000,000 m2. These data are continually updated and validated by volunteer recorders, as well as from other official sources, such as digitized herbarium specimens. One great asset of botanical recording in the British Isles is that it has long been based on square areas delimited by the Ordnance Survey’s national grid. The precision with which typical records are submitted to the BSBI database has increased through time. Early records were based on hectads (10 × 10 km squares), but from the 1970s onwards these began to be superseded by tetrads (2 × 2 km squares), then rapidly progressing through monads (1 × 1 km squares) to hectares (100 × 100 m, usually reported as six-figure grid references). Increasingly widespread use of GPS devices by field botanists from the late 1990s onwards further strengthened potential precision to at least eight-figure grid references, accurate to within 10 m. However, far coarser resolution has been used to summarize records when generating species distribution maps for publication – typically, tetrads or increasingly monads are used at a local level and hectads at a national level (Pescott et al., 2019; Stroh et al., 2023). Thus, the online BSBI database provides access to the observations at several spatial resolutions, with great flexibility regarding temporal filters.
For our analysis of changes of the British and Irish orchid flora, we compared the same periods used to analyze trends in Plant Atlas 2020 (Stroh et al., 2023; plantatlas2020.org), specifically (a) 1930–1969; (b) 1987 – 1999; (c) 2000 – 2009, and (d) 2010 – 2019. These subdivisions roughly correspond to the timespan of national recording periods used in successive national plant distribution atlases published by BSBI, though splitting in half the final 20-year phase of data collection. The period between the first and the second phases (1970 – 1986) has been omitted from comparisons, since there was no official national recording taking place. In our analyses, the spatial resolution used is the hectad (10 × 10 km) since this is the scale for which comprehensive data are available from 1930 onwards. This particular grid size has been broadly used in various similar studies across Europe (e.g. Kull and Hutchings, 2006; Tsiftsis and Tsiripidis, 2020; Stroh et al., 2023; Djordjević et al., 2025). For our analyses, Great Britain (plus the Isle of Man; GB) and Ireland (IR) are assessed independently, as two separate geographical entities. The Channel Islands are not included in the analysis, as in phytogeographical terms they are more appropriately grouped with continental Europe (Preston et al., 2013). For both Great Britain and Ireland, original hectad grids were clipped using georeferenced coastline shapefiles of each geographic entity (process applied in QGIS v.3.24 ‘Firenze’), in order to better represent the extent of species distributions (and avoid extending into the sea). After clipping, the British grid consisted of 2851 hectads and the Irish grid consisted of 1020 hectads.
At present, 57 orchid species are known to occur in Britain and Ireland (Bateman, 2022), including five formerly exclusively continental European orchids that have appeared in the British Isles only during the last few decades (Serapias parviflora; three occurrences, S. lingua; two, S. cordigera; two, S. vomeracea; one, and Himantoglossum robertianum; two). For these species, questions have understandably been raised regarding their mode of arrival, given increasing horticultural interest, but all species – and most of their occurrences – are actually credible as natural arrivals, their northward migration potentially encouraged by climate change (Bateman, 2022). Among the undoubted natives, Spiranthes aestivalis was extirpated from Britain in the late 1950s and Epipogium aphyllum has only been recorded twice since the late 1980s (the latest observation, of a single plant, was made in 2024). For our analysis we downloaded occurrence data from the online database of BSBI, for all validated orchid species present in Britain and Ireland (filtered as “accepted and unchecked” in the BSBI DDb) excluding any records of the DDb that are dubious or have been rejected, within the overall selected timeframe (1930 – 2019). Anacamptis laxiflora was excluded as it is restricted to the Channel Isles as a native. For our database query all infraspecific taxa were aggregated into species, while for Epipactis leptochila and Gymnadenia conopsea, we selected the sensu stricto species. For the latter, this means that we treated the three imperfectly mapped former subspecies of Gymnadenia as full species (Bateman et al., 2021). These decisions left 51 species for analyses in Great Britain and 31 in Ireland (Supplementary Table 1). Occurrence records were downloaded from the BSBI database (https://database.bsbi.org/- last accessed in February 2024) and then converted to presence/absence within hectads for each of the specified time-periods.
2.2 The ‘recorder effort problem’ and Frescalo correction
One of the main weaknesses of using datasets collected by volunteers during largely unstructured surveys is the so-called recorder effort problem, where the spatial and temporal effort is largely unknown. Thus, the dataset might not correspond to the actual underlying species distribution but is instead biased to due to variation in effort in different areas or periods, largely because of contrasts in the number of recorders taking part (Hill, 2012; Prendergast et al., 1993). This issue has been raised previously for the BSBI dataset (Pescott et al., 2019), especially for the earlier monitoring periods that correspond to the first published Atlas and its subsequent ‘critical supplement’ (Perring and Walters, 1962, 1968). One way of correcting for uneven effort, proposed by Hill (2012), utilizes ‘benchmark’ species to estimate recording effort for a species at a particular point in space and time. In this method, called Frequency Scaling Local Occupancy (‘FreScaLO’, hereafter ‘Frescalo’), benchmark species are selected based on their commonness and stability, so that they represent recording effort rather than ecological change, and then the local species frequency curves are all scaled to have the same shape before each site’s benchmark recording frequency is used to adjust species’ local frequencies (Hill, 2012; Pescott et al., 2019). The per-neighborhood result is a time-period specific of index of a species’ deviation from its all-time local frequency; this is assumed to represent ecological change conditional on the specification of the effort adjustment being correct. In our analysis, we applied the Frescalo correction to the hectad-scale orchid data in all four time-periods. Frescalo corrected trends were based on the methods and data used in Plant Atlas 2020 (hereafter PA2020). For some species this was not possible because of low occupancy. Specifically, Frescalo results are not given for species present in 15 hectads or fewer in Britain, and in 6 hectads or fewer in Ireland, because such species may not satisfy all of the assumptions of the Frescalo model (Stroh et al., 2023). Also, the Frescalo-corrected values were based on the analysis used in PA2020 in which some species were aggregated. For example, the three Gymnadenia species were aggregated in the Gymnadenia conopsea aggregate (Gymnadenia conopsea sensu lato). This led to a reduced subset of 42 species for Great Britain and 25 for Ireland. To test our suspicion that the long-standing attention paid to the orchid family confers greater coverage (Bateman, 2022, 2025a; Stroh et al., 2023), we compared the fitted slopes for both our curated orchid species dataset and the Frescalo-corrected dataset for both Great Britain and Ireland.
2.3 Estimating trends
We define as statistically significant a trend whose probability of occurrence, under the assumption of natural change, is less than a specified level, α (DeGroot and Schervish, 2012). This level is usually set at 5% but it can be made larger (e.g. 10%) in situations where we wish to reduce the chance of Type-II error, such as when applying the Precautionary Principle. Here we used 5% but results for 10% are given in Supplementary Materials. However, the natural environment exhibits autocorrelation over all timescales (Ariño and Pimm, 1995; Franzke et al., 2020; Huybers and Curry, 2006). Thus, it is harder to confirm a significant trend, since trends can arise within the stochastic process itself (Beran et al., 2013). For example, in the “attribution problem” of global warming, even though we see undeniable increases in global temperatures, arguments have been made that this increase is nothing more than natural variability (see Halley, 2009 for a discussion). Rebuttals of these arguments are possible by including a credible model of natural autocorrelated variability (Halley, 2009; Phillips et al., 2023). This applies also to the conservation context, where our concern is with declining trends. Thus, we need to control for the natural trends and cycles within the environment before we can decide whether a trend is indeed significant. The canonical stochastic process for autocorrelated variability is termed 1/f-noise (Halley, 1996), which describes well the fluctuations in real ecological populations and various proxies thereof (Inchausti and Halley, 2002).
For each species in the dataset, we counted the number of occupied hectads for each of the four time-periods. This yields a proxy for the species’ abundance as a function of time. We chose the median year of each time-period (1949.5, 1993, 2004.5, 2014.5) as the representative value of time. For each species, we calculate the trend via least-squares fitting at the four time-steps. For estimating the significance of the trend assuming 1/f-noise environmental variability, we used a Monte-Carlo method (Halley, 2009). We generated two contrasting stochastic models of environmental variability. The simplest stochastic process used in ecology is the white-noise model, where each value of population has a normal distribution of standard deviation about a fixed mean. 1/f-noise, also known as pink noise, is more complex than white, since it is strongly autocorrelated over all timescales (years, centuries, millennia, etc.). Each random perturbation consists of unpredictable stochastic events that occur at that time but also includes a memory of the events of previous years. Here, we follow the approach taken in Halley and Kunin (1999), which consists of approximating the process by a series of simpler autoregressive processes, one for each timescale τk (where τk=τ02k with k ∈ {…,-2,-1, 0, + 1,+2,…}). This model was used to generate many simulated trajectories of annual occupancy to compare with the observed series. Values of the 1/f-process were generated for each year and sampled at each of the four time-periods. Each trajectory generated by the model is rescaled so that its mean and variance are the same as for the observed time series. Least-squares fitting then finds the trend in the generated time-series. Each time-series is simulated many times, and the set of K = 100,000 simulations for each is completed by adding the trajectory of the real data. After this normalization process is complete, we count the number of trajectories for which the slope exceeds the one associated with the real population and divide by the number of replications to obtain the significance value. For comparison, in addition to regression using 1/f-noise as the background variability, we also calculate results of standard regression analysis (code available at: https://github.com/EcoLabBET/ExOrChiST.git).
2.4 Biodiversity centroids and extremes
For each of the selected time-periods, we calculated the geometric center (or center-of-mass; arithmetic mean of the points defining the polygon – hereafter termed the ‘centroid’) for each hectad where a given species is present, resulting in a set of points that can effectively capture the spatial extent (area and geometry) of each species’ distribution. Then, using these sets of points, we generated a ‘point-of-centrality’ for each species’ range per time-period, using three different approaches: (a) the centroid; (b) the median center, defined as the one-dimensional median over the first (abscissas) and second (ordinates) coordinates; (c) the geometric median, defined as the point that minimizes the sum of distances over all points in the set (Weber-Fermat point). All calculations were performed in Python 3.10.12, using ‘NumPy 1.25.2’ (Harris et al., 2020). To estimate the shift of each species distribution centroid across time, we calculated the distance (in km) and the bearing (in degrees) of a centroid’s movement on geographical space, employing Vicenty’s formula. In order to estimate the shift, we removed the species that are not present in all time-periods (GB: Epipogium aphyllum, Neotinea maculata, Serapias cordigera, S. lingua, S. parviflora, Spiranthes aestivalis; IR: Epipactis dunensis, Gymnadenia borealis). To minimize spatial errors, calculations were adapted to local ellipsoids using ‘PyGeodesy v.24.3.2’ (Brouwers, 2024). Centroid shifts were depicted in polar-rose plots (code available at: https://github.com/EcoLabBET/ExOrChiST.git).
2.5 Biodiversity hotspots
We examined whether known orchid hotspots in Britain and Ireland can be detected at all selected time-periods, based on the simplest diversity index, species richness (hereafter SR), and corrected weighted endemism (hereafter CWE), a range weighted biodiversity metric used to highlight important areas based on unique species (endemics/range-restricted species) (Crisp et al., 2001; Daru et al., 2020). For each of the two metrics, we created a matrix of values for each hectad, for Great Britain and Ireland separately, based on the presence of orchid species per given hectad, for all studied time-periods. We defined orchid hotspots as the 1% of hectads that had the highest proportion of each of the two metrics (SR and CWE) in each island per time-period, following the methodology of Kougioumoutzis et al. (2021). In cases where more than 1% of cells had the same value, all were kept (code available at: https://github.com/EcoLabBET/ExOrChiST.git). To investigate changes in SR and CWE through time in the orchid hotspots of Britain and Ireland, we created a list of all hectads included in the upper 1% of each of the two metrics for at least one time-period. All extracted orchid hotspots were then mapped in QGIS v.3.24 ‘Firenze’ (QGIS.org, 2022) for each time-period, before calculating aggregated values, in order to identify those hotspots that have persisted throughout the timespan covered by the three BSBI plant atlases.
3 Results
3.1 Orchid occupancy in Great Britain and Ireland has seen large spatial changes
In the most recent time-period, 97% of British and 92% of Irish hectads contained at least one species of orchid, while the mean occupancy by a single species was 301 (10.5%) hectads for Great Britain and 129 (12.6%) hectads for Ireland (Figure 1). The species with the maximum occupancy in both islands was Dactylorhiza fuchsii, which was reported from 64.9% of the British hectads (1,851/2,851) and 67.2% of the Irish hectads (685/1,020). Next came D. maculata [GB: 53.9% (1,536/2,851 hectads) and IR: 52.6% (536/1,020 hectads)] (Supplementary Table 2). In all time periods, the pre-eminence of these species, along with Orchis mascula and Neottia ovata, prevails for both islands. In Great Britain, the rarest species were Ophrys fuciflora, Orchis militaris, O. simia (all most recently occupying as native populations only three or four hectads) and Cephalanthera rubra (three hectads). Also, in the most recent time-period, Liparis loeselii has declined to four hectads from 14.
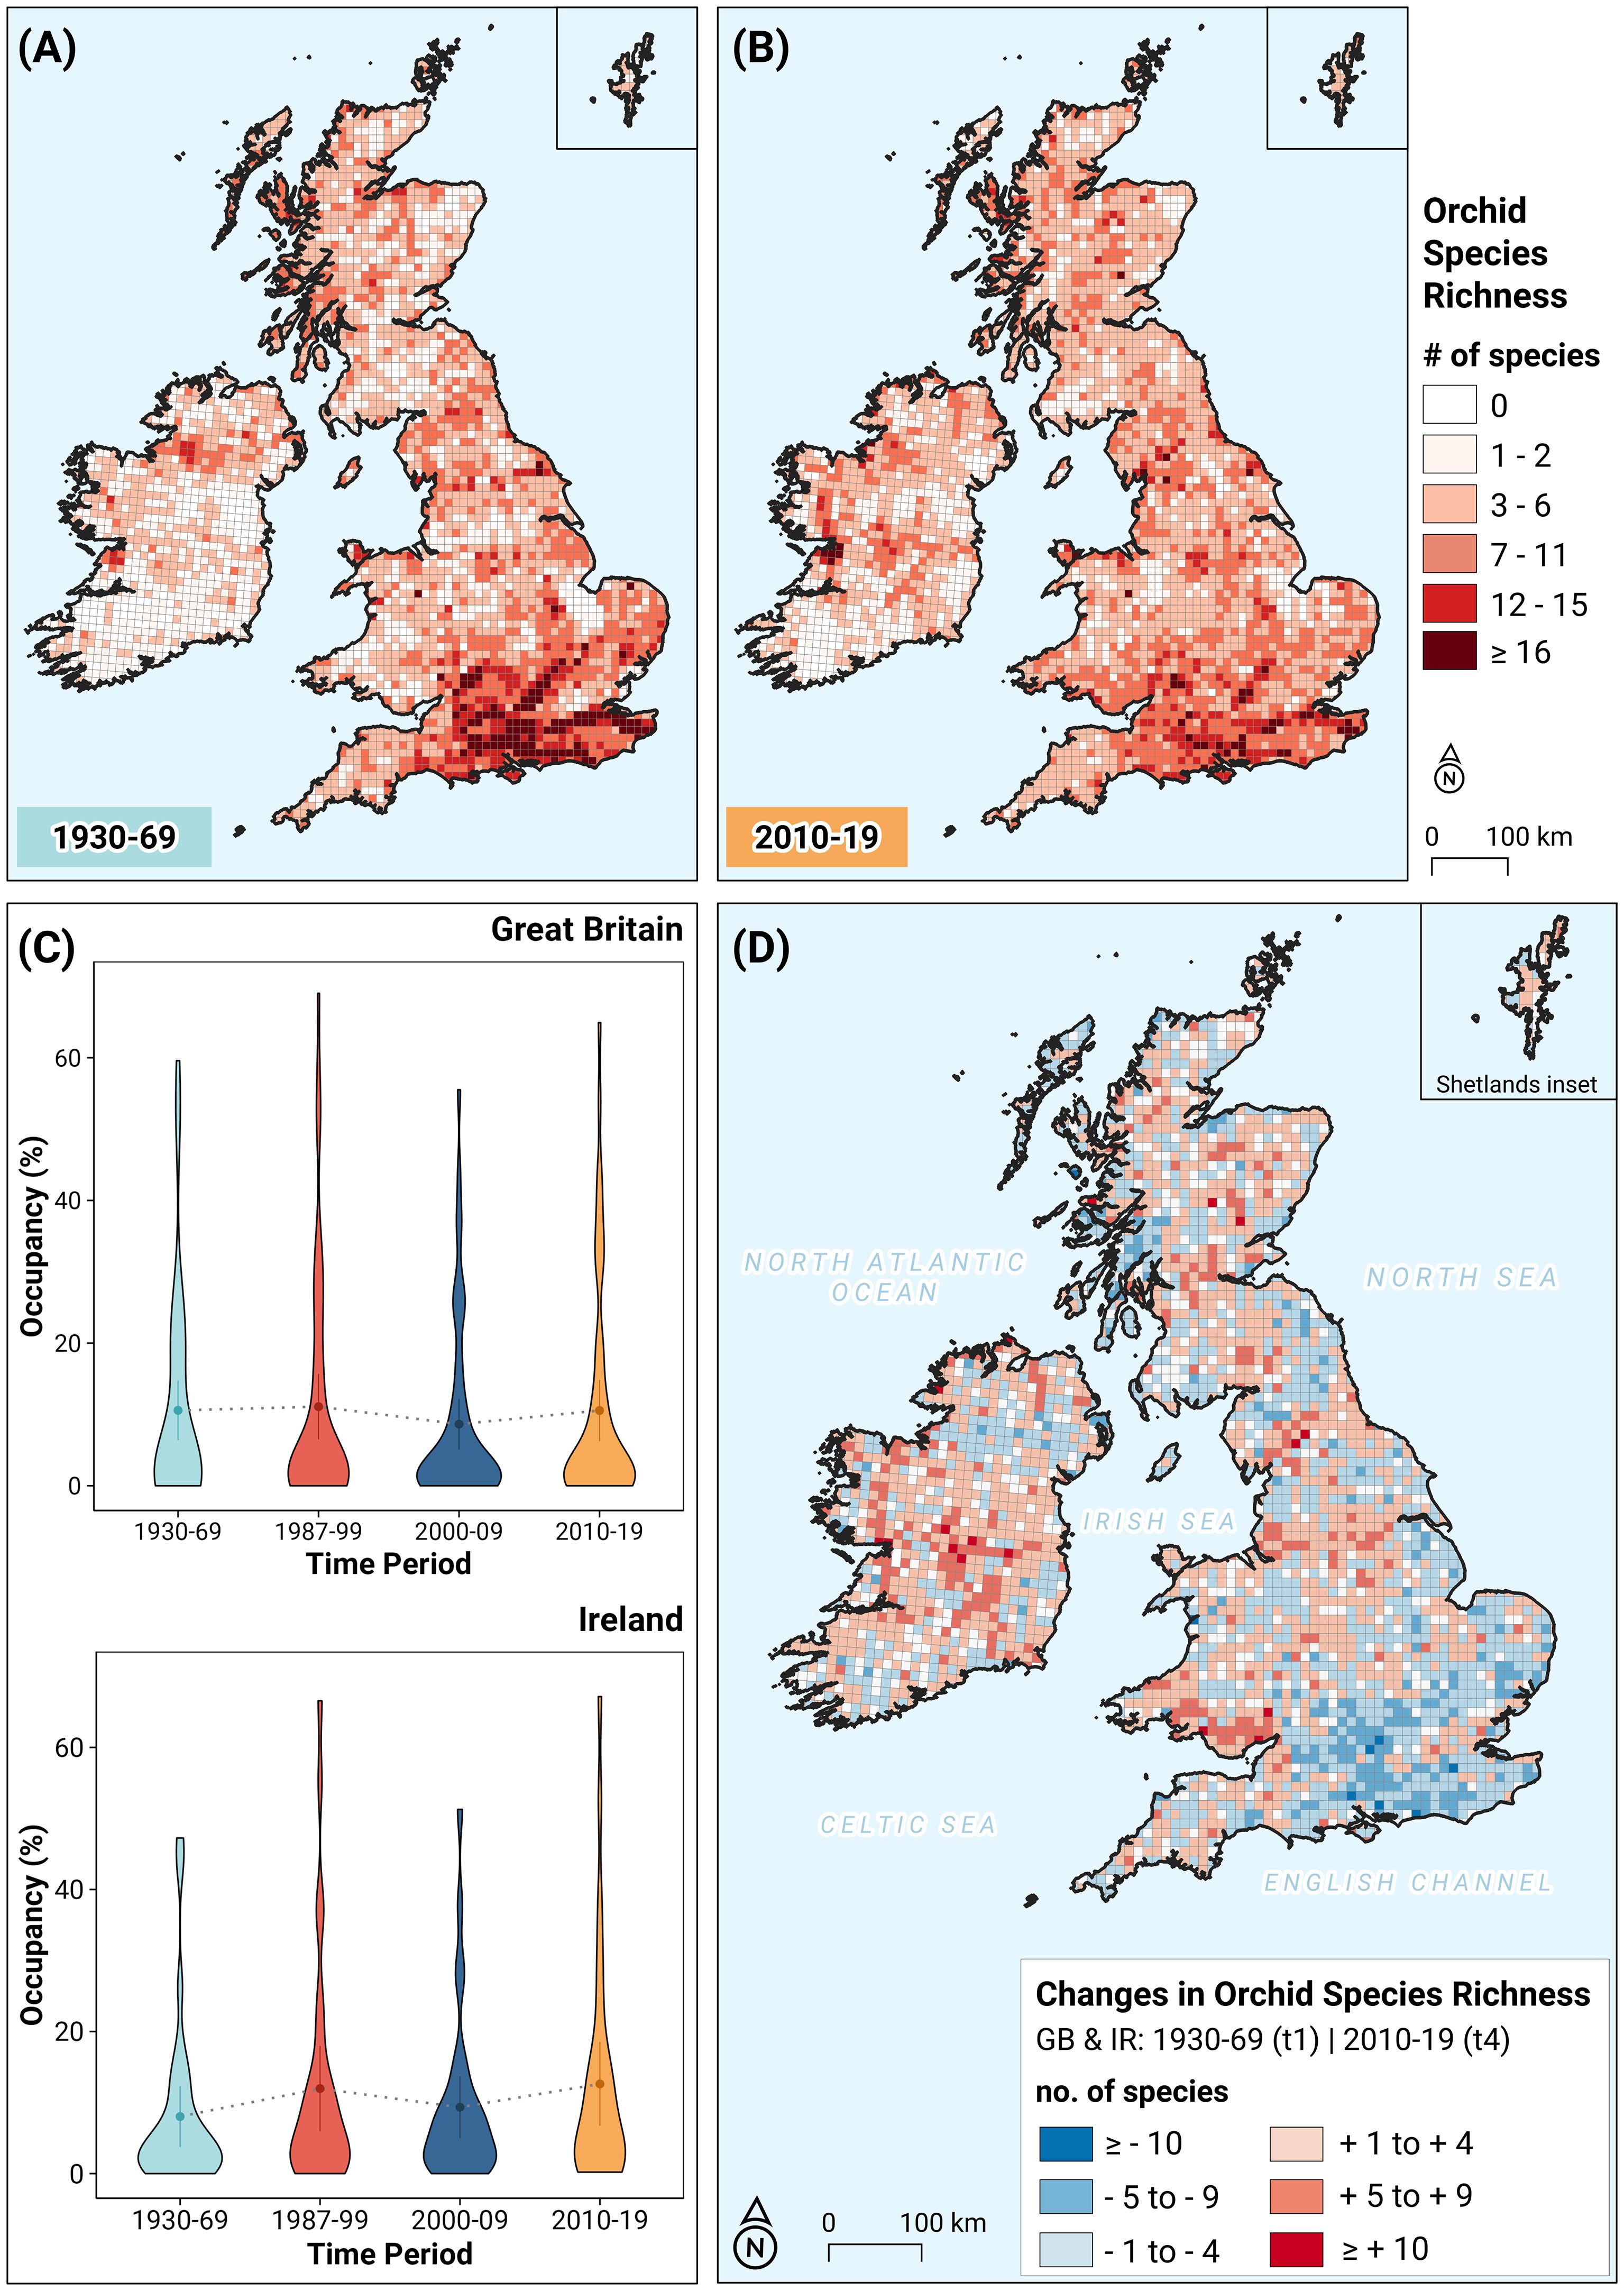
Figure 1. (A) Map showing the orchid species richness in Great Britain and Ireland for 1930–1969; (B) Map showing the orchid species richness in Great Britain and Ireland for 2010–2019; (C) Violin plots depicting the frequency distribution of occupied hectads (%) in Ireland (nIE = 31 species) and Great Britain (nGB = 53 species) for the selected time-periods. Summary statistics within each violin plot depict the mean and the upper and lower Gaussian confidence limits. Grey dotted lines across violin plots link mean values for successive time-periods; (D) Map showing the changes in orchid species richness between the 1950s (t1: 1930–1969) and 2010s (t4: 2010–2019) in Great Britain and Ireland. Cells with white color have a value of zero.
Figure 1 shows that there has been a clear redistribution of orchid biodiversity in Great Britain. Comparing panels 1(A) and 1(B), despite increased sampling effort (Stroh et al., 2023), there is a substantial decline in high species richness hectads in the traditional hotspot areas in south-eastern England. From a large mass of hectads with the highest orchid diversity in 1930 – 1969 (107 hectads with SR ≥ 16 spp.; Figure 1A), only a few remain in 2010 – 2019 (35 hectads plus six new additions; Figure 1B). In compensation, major occupancy gains are evident in South Wales, northern England and Scotland. This trend is clearly visible in Figure 1D, which shows visually the losses and gains of each region at the hectad level. Six hectads, all situated in southeastern GB, have lost ten or more species, whereas seven have gained ten or more: three in South Wales, two in northern England and two in Scotland. By contrast, in Ireland, several high species-richness hectads appear in the Irish Midlands in the last time period, without major losses elsewhere. Four of these hectads gain ten or more orchid species, while none have lost so many. Remarkably, in both Ireland and Great Britain, some of these biodiversity changes have occurred on large as well as small spatial scales (for example, in areas 4 × 4 hectads in extent). When we use the geographically weighted CWE index, the overall picture is quite similar; the CWE seems to be rather stable in Great Britain between the first and the last time period (Supplementary Figures 2A-C), with very few strong changes, all of which are located in the southeast of the country (Supplementary Figure 2D). In Ireland also there no overall loss or gain (a few gains around the Burren in the west and the Wicklow mountains in the east), despite the CWE showing relatively large fluctuations through time (Supplementary Figure 2C).
3.2 For most species, changes in occupancy exhibit low levels of statistical significance
When we fit trends to occupancy data, in Great Britain, 31 species out of 51 show a decline of hectad occupancy, whereas 20 show an increase (Table 1). In Ireland, the situation is reversed; the corresponding numbers are five declining and 26 increasing. Standard regression tests suggest that nine of the positive trends in Great Britain are significant (at the 5% level) and 11 significantly negative; a further 31 species showed no significant trend. If we use 1/f-noise as the background environmental variability to correct for natural trends (but without any Frescalo correction), the number of insignificant trends increases to 39, with only five being significantly positive and eight significantly negative (Supplementary Table 3). In our more restricted dataset of 42 species that used the Frescalo-corrected occupancies to carry out a regression test, together with 1/f-noise as environmental variability, we found six species in Great Britain had a significant negative trend. Note that for this reduced dataset, there is little difference in results with and without the Frescalo correction itself. The most significantly declining species were Ophrys insectifera, Neotinea ustulata and Herminium monorchis, all of which have fallen to less than half of their occupancy documented in the first atlas. Meanwhile, two species increased significantly: Ophrys apifera has increased by about 74%, and Dactylorhiza traunsteinerioides nearly tripled its occupancy from 14 to 44 hectads, in part reflecting improved ability of field botanists to identify this species. For 35 species (81%), the trend was not significant. In Ireland, where the rarest long-term species is Cephalanthera longifolia, the only significant loser is Spiranthes spiralis, which disappeared from 42% of its occupied area (Supplementary Table 2). Meanwhile, Epipactis helleborine has expanded from 54 to 144 hectads. Neither of the corrections affects these results (Table 1).
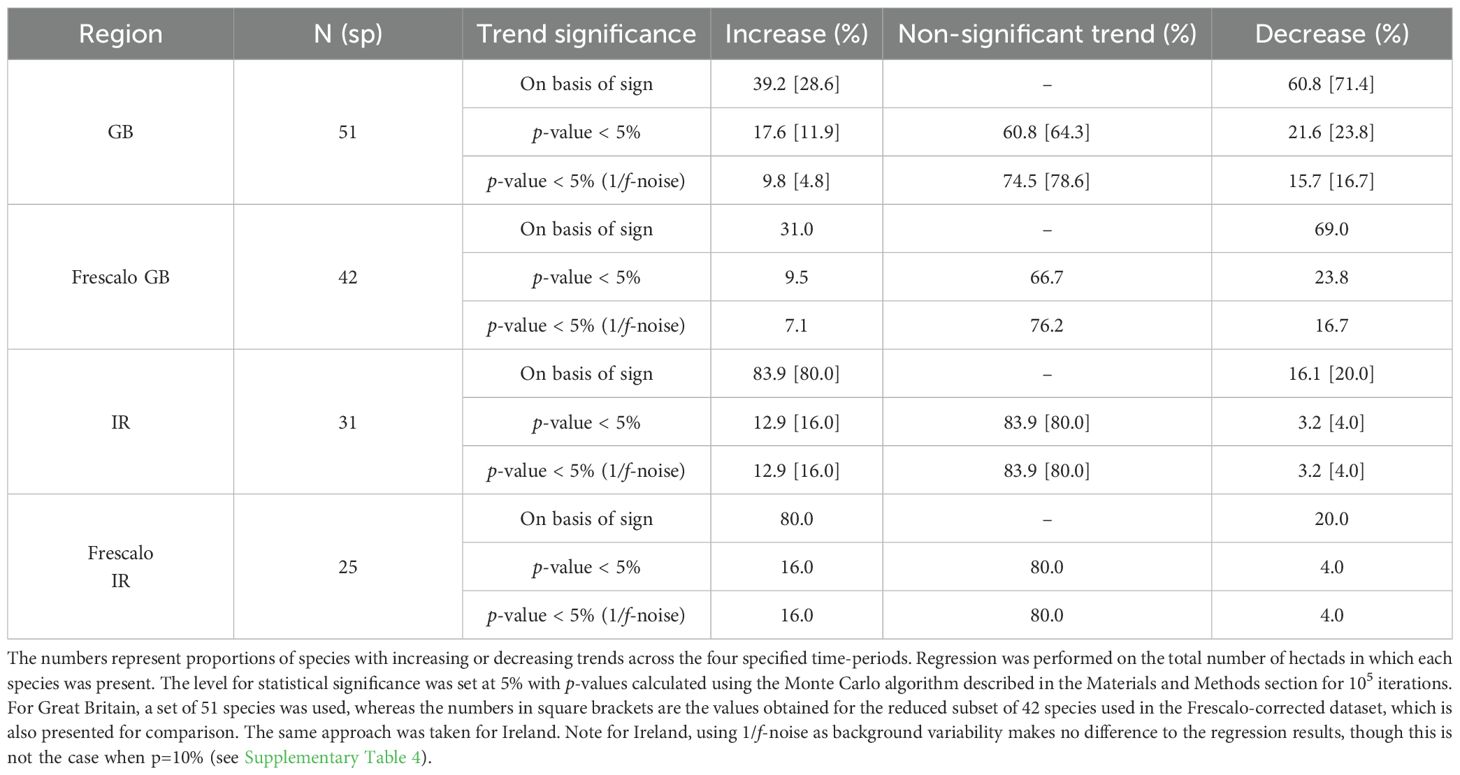
Table 1. Trend results based on a regression analysis.
3.3 Orchid distributions have shifted differently for Great Britain and Ireland during the last 90 years
During the selected timespan (1930 – 2019), most species in both islands have shown evidence of shifts. In Britain, orchid distributions have shifted mainly to the north and northwest (Figure 2, Supplementary Table 3), with an average distance of 50.6 km. On the other hand, orchids in Ireland have shifted mainly towards the southwest, with an average distance of 40.8 km (Figure 2, Supplementary Table 2).
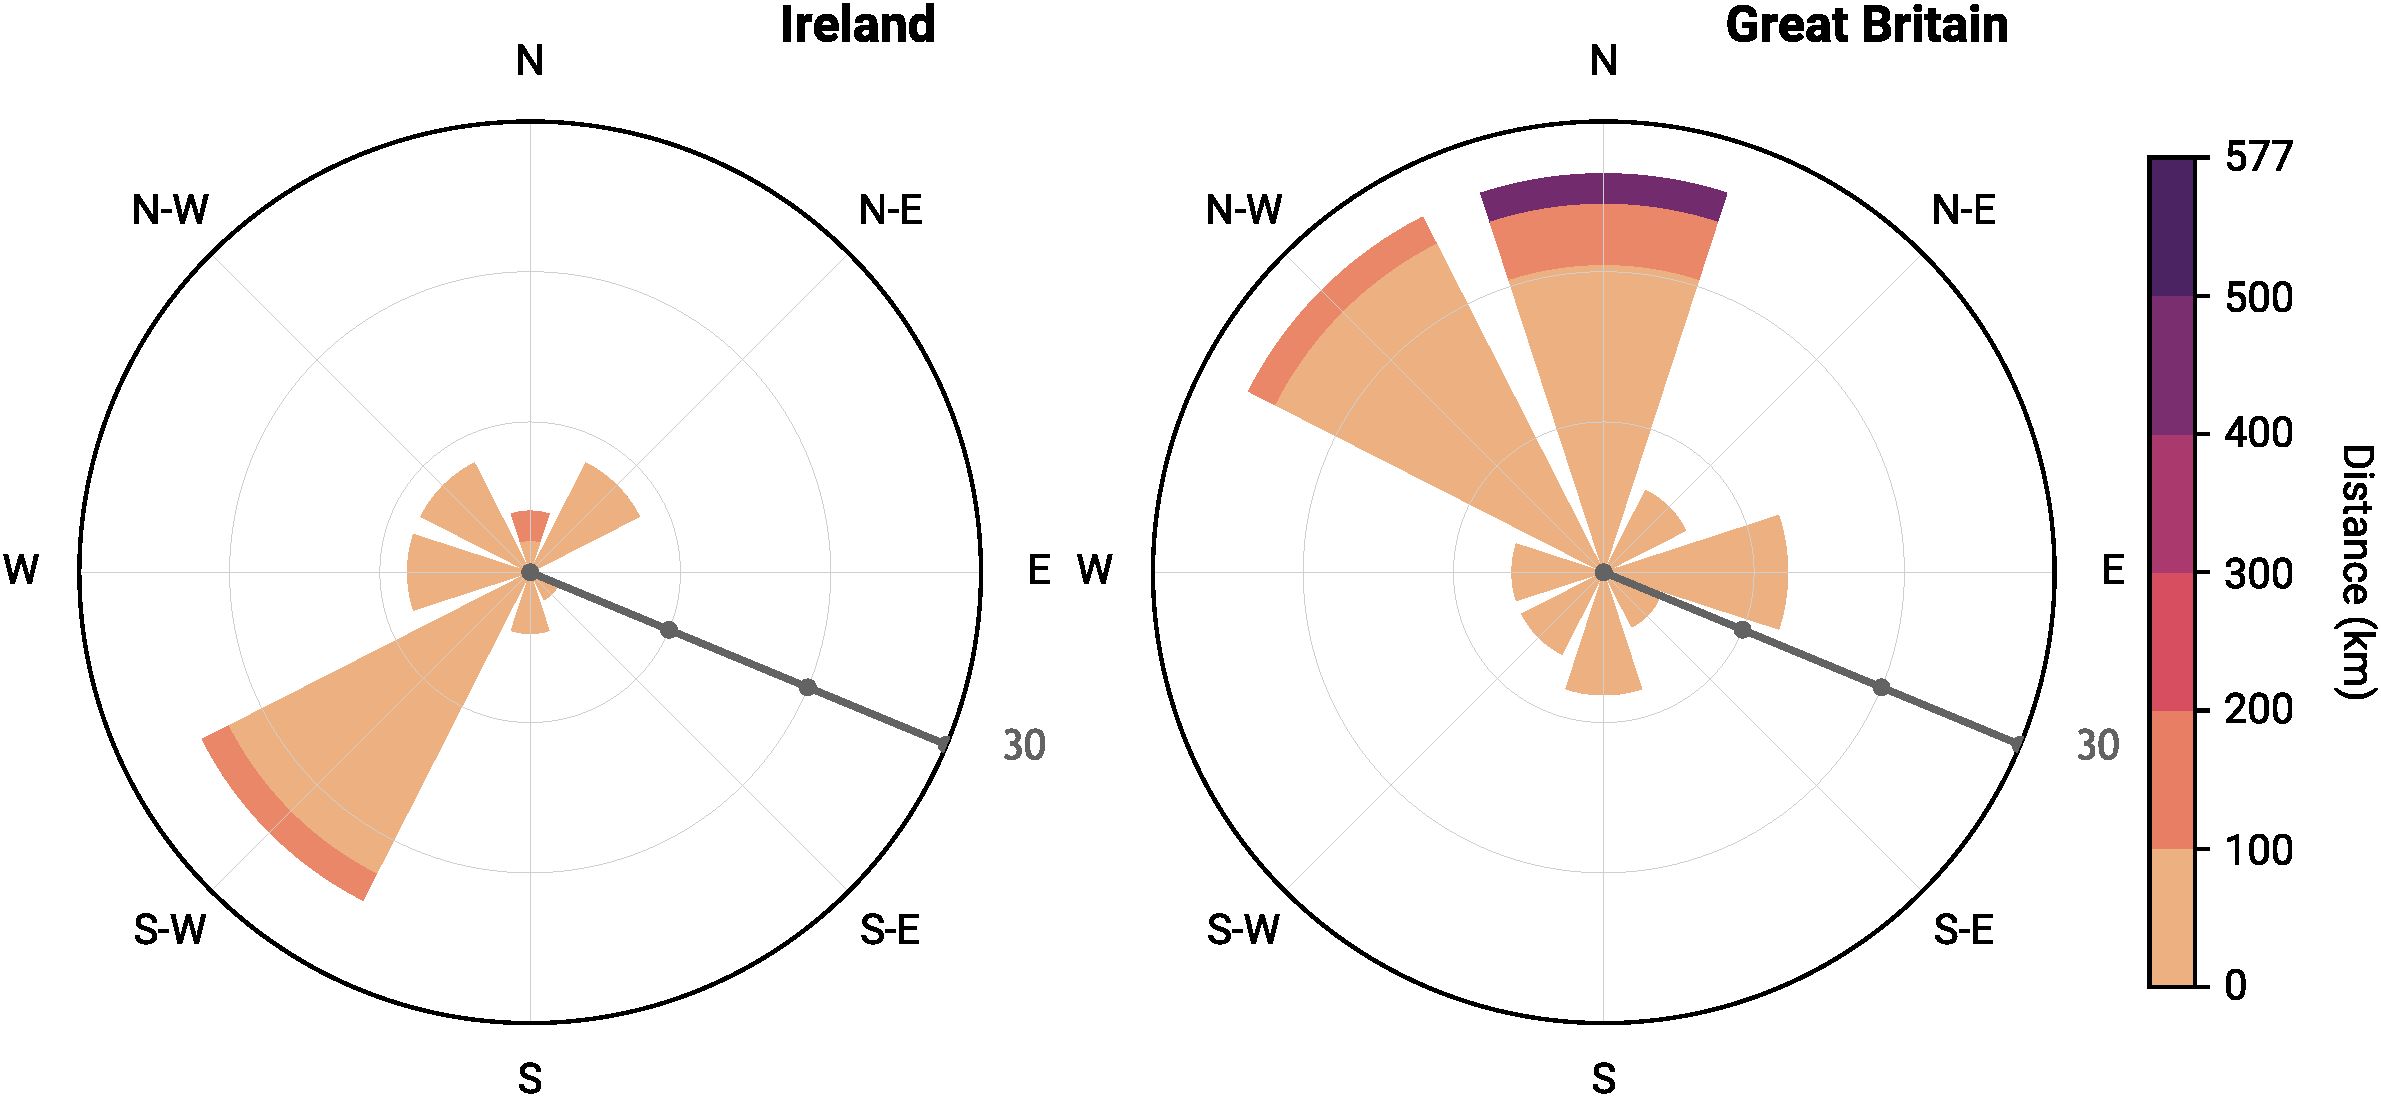
Figure 2. The distribution of bearings for the movement of the centroid of the range between the first time-period (1930–1969) and the last time-period (2010–2019) for Great Britain and Ireland. The data are presented in a normalized rose diagram encompassing all orchid species in a given country. The radii of circles (grey scale-bar) indicate percentage change up to 30%, while the color scheme represents the amplitude of changes (distance between centroids).
3.4 In Great Britain high diversity areas have expanded but many hotspots are remarkably persistent
Figure 3 shows a map of orchid hotspots of Great Britain and Ireland, following our analysis. This corresponds closely to areas in both Britain and Ireland that have long been known to possess high orchid richness (cf. Godfery, 1933; Harrap and Harrap, 2009; Summerhayes, 1968). As shown in the central map of Figure 3, the majority of orchid-rich areas of Britain are in southeastern England for all time-periods, including all 11 of the constant hotspots, which are concentrated in the Cretaceous chalk soils of the Chiltern Hills, North Downs (e.g. Box Hill), and South Downs – already well-known orchid-rich locations in Britain. There is also a small cluster on Carboniferous limestone soils to the north (eastern Cumbria and North-west Yorkshire), emerging after the second time-period. In the last time period these patterns were less pronounced, especially in southeastern England. The overall pattern is for the high diversity to be less concentrated in southeastern Britain, with the number of hotspots in the north increasing. In Ireland, two distinct aggregations of orchid hotspots can be seen: one around the Burren (the most famous place for botanizing in Ireland) and another to the north, centered on the Fermanagh Scarplands. Conversely, in Ireland, there is a modest net southward shift, as the large cluster near the Fermanagh Scarplands diminishes through time, whereas the southern aggregation of orchid-rich hectads around the Burren widens. A westward movement towards the coastline is also evident, especially in the north. Some orchid hotspots have proven remarkably stable. In Britain, 11 of the 73 high-richness hectads (and in Ireland, two out of 25) have been constant throughout all time periods. When we use the taxonomic geographically-weighted (CWE) variant, which gives greater emphasis to geographically limited or endemic species, the results are broadly similar. However, in Great Britain, the prominent ridge of high diversity, centered on the South Downs, is almost absent and that between the Surrey Hills and the Isle of Sheppey is much reduced. Meanwhile, clusters around the Chilterns, Kent Downs and Cotswolds are consolidated. In Ireland, according to the CWE, the Fermanagh Scarplands tend to have fewer endemic, geographically limited, species compared to the Burren (Supplementary Figure 3).
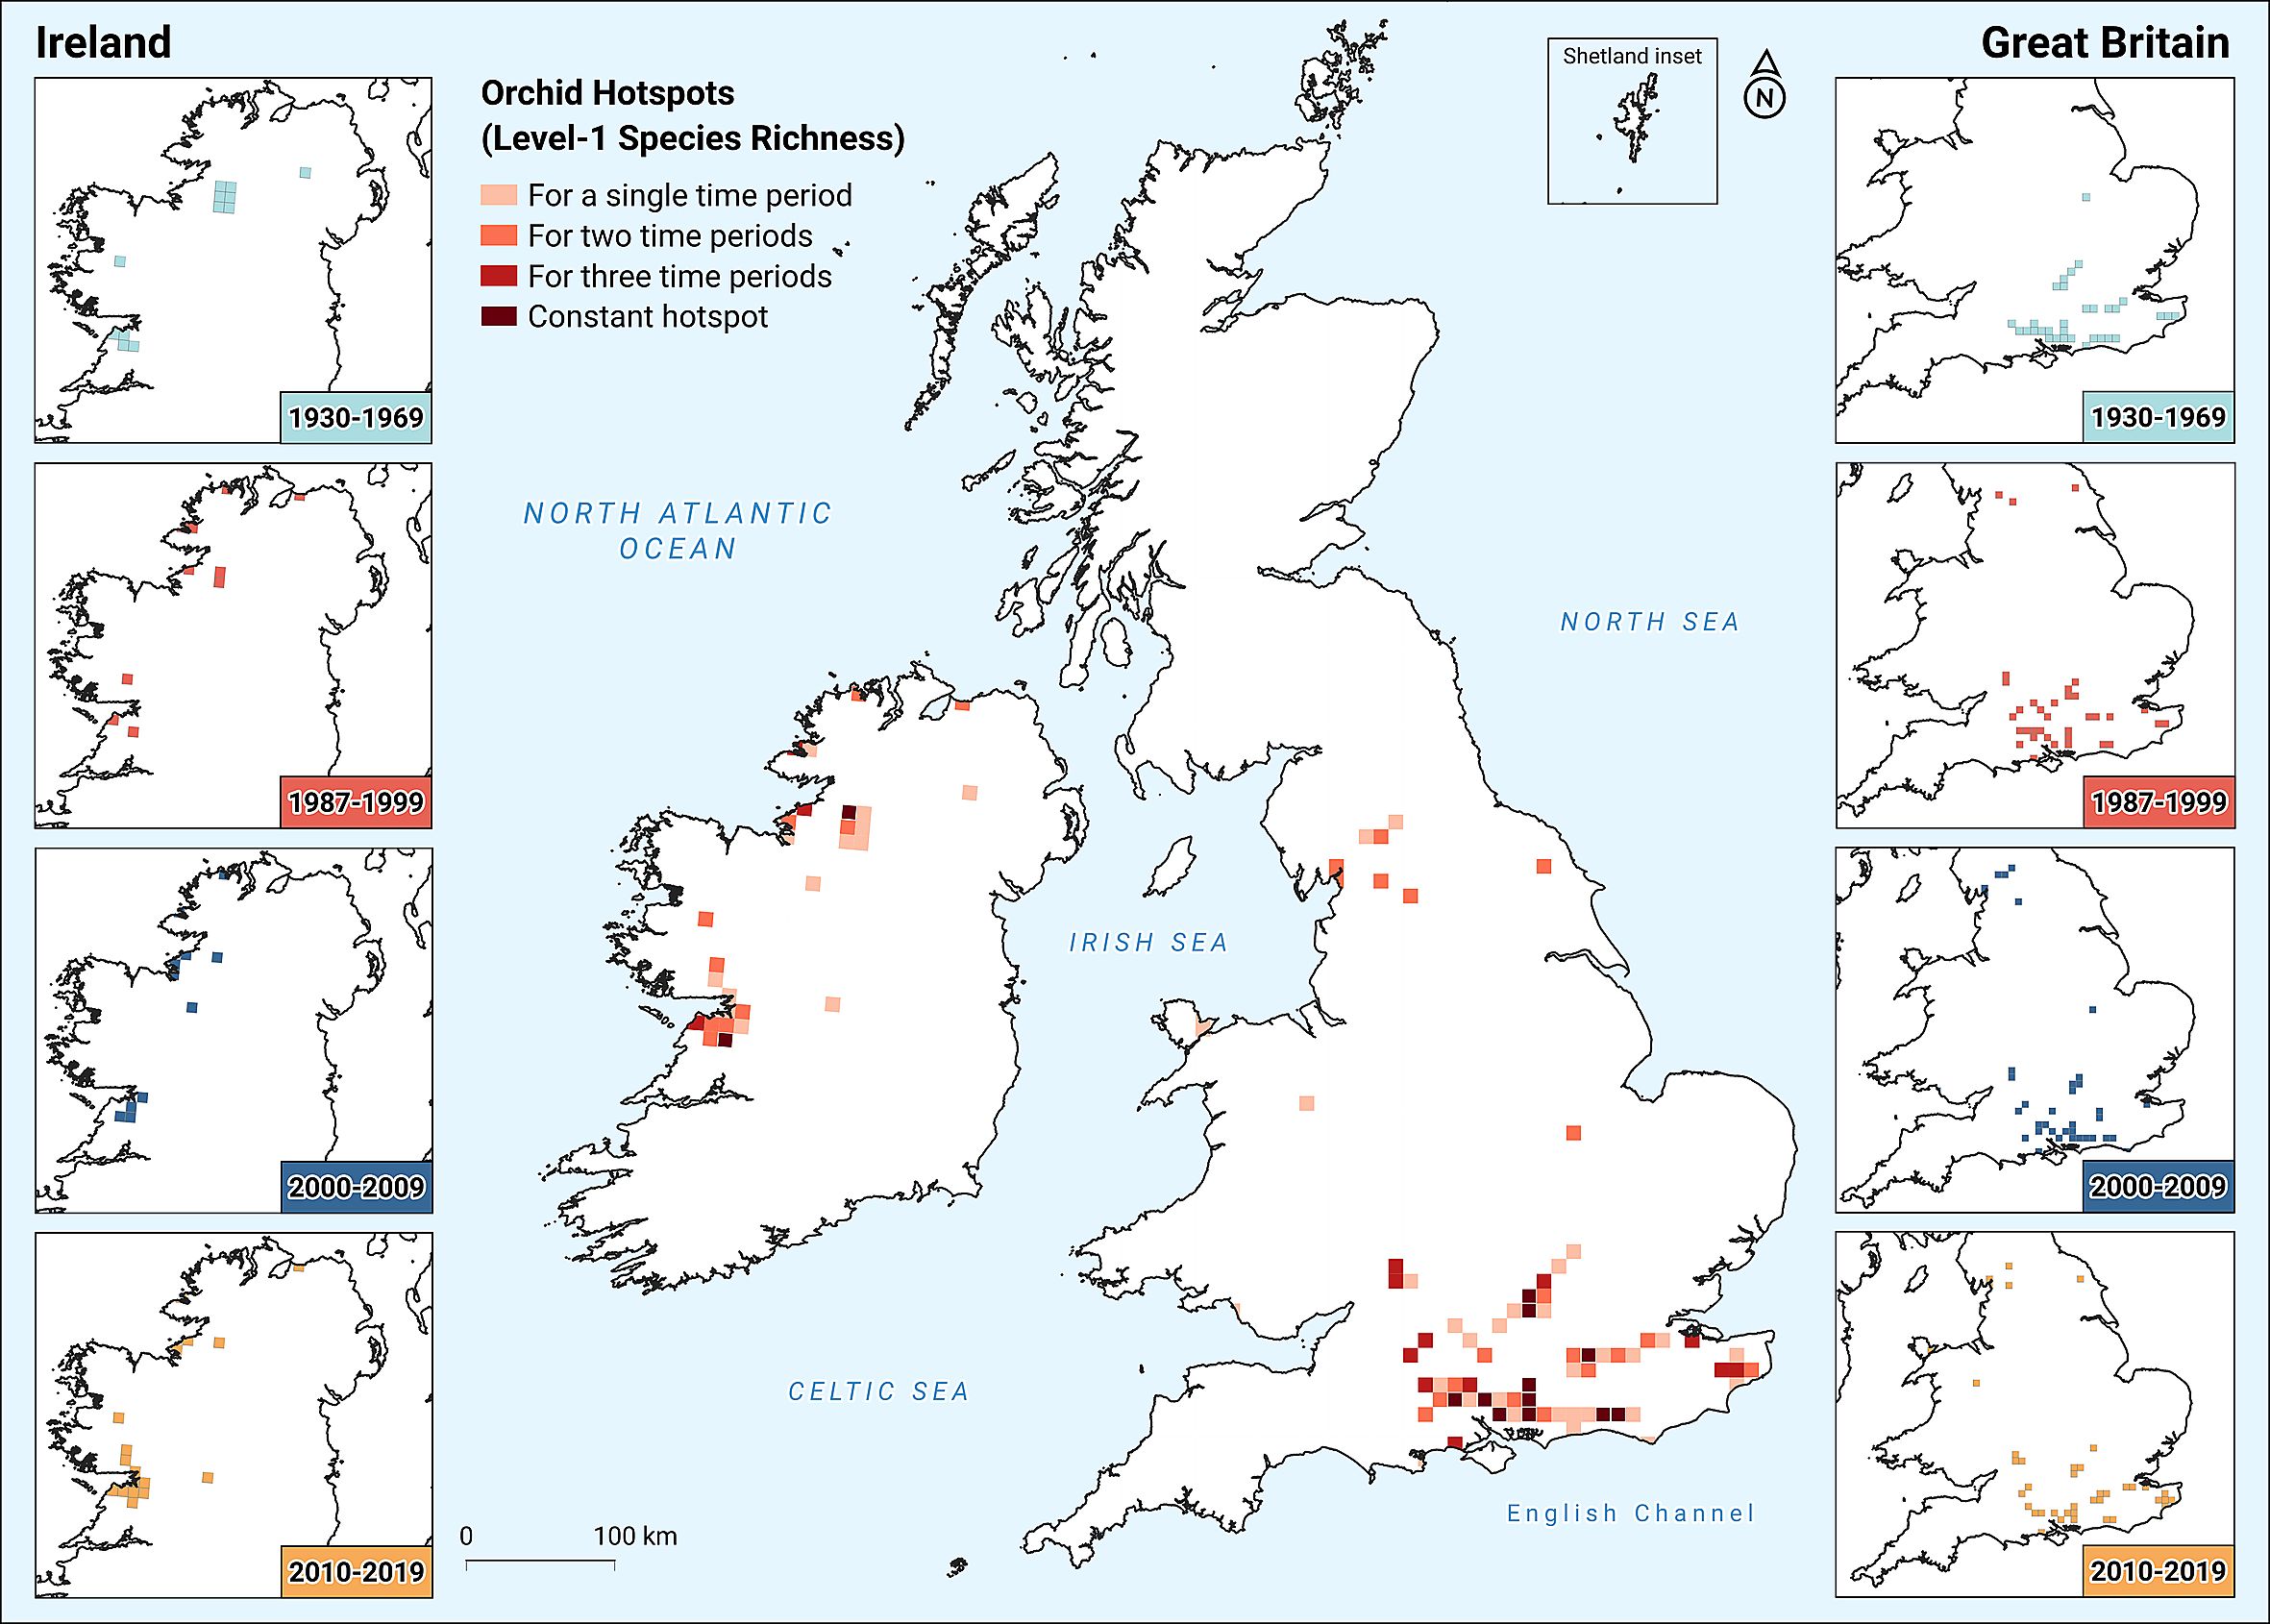
Figure 3. Orchid hotspots in Great Britain and Ireland. Side panels show upper 1% species richness hectads for each island per time-period. Centre panel is the combination of all side panels, showing the number of time-periods when a given hectad appears as an orchid hotspot.
4 Discussion
There is widespread concern about the health of orchid populations in Britain and Ireland, as well as in continental Europe (e.g. Bateman, 2022, 2025a; Fay, 2015; Fay and Calevo, 2024). There are many legitimate reasons for this concern, given the scale of earlier excessive collecting and of ongoing intensive agriculture and climatic or land-use change (e.g. Walker et al., 2023). Thus far, 17 native orchids spanning 12 genera have had their detailed ecological biographies published in the long-running Biological Flora of Britain and Ireland section of the Journal of Ecology (e.g. Rose, 1948; Farrell, 1985; Tatarenko et al., 2022), and each article expresses serious concern regarding the negative impact of habitat degradation. However, the scientific literature provides conflicting evidence. Our analysis focused on how the hectad occupancy of each species changed over a 90-year period (1930 – 2019). We also employed two important corrections: firstly, applying the Frescalo method to correct for incomplete or variable sampling intensity, and secondly, using 1/f-noise (rather than white noise) in order to account for the expected autocorrelation of occupancy levels.
In Great Britain, although we did not find a significant decline for orchids as a whole, more species declined than increased in their occupancy, and several of these were highly significant. As expected, employing 1/f-noise as a background model for natural environmental variability, which includes the possibility of sustained natural trends, reduced the number of significant trends. However, the Frescalo correction did not affect our results. This may be because orchids are historically relatively well-recorded relative to other plant groups, and potentially due to their charismatic nature that makes them a “recorder’s Holy Grail” and easily identifiable in the field (see Adamo et al., 2021). The Frescalo method depends on benchmark species truly reflecting effort, as incorrect assumptions about their stability or detectability can bias estimates. Frescalo performs best when there is sufficient data to reasonably estimate species’ relative frequencies across neighborhoods; thus, we expect the correction method to underperform in early periods where data are scarcer (Pescott et al., 2019). In Ireland, the trends in occupancy are mostly upward. However, recording effort in Ireland commenced at a much lower level than in Britain, so the increasing trends may be strongly influenced by greater effort in the later recording periods. In the European context, where several authors saw a dominant pattern of decline (Damgaard et al., 2020; Kull and Hutchings, 2006; Vogt-Schilb et al., 2015) our study found patterns to be more nuanced. While more species in Great Britain were declining than increasing, in Ireland distributions appear to have expanded: from zero high diversity hectads (SR ≥ 16 spp. in 1930 - 1969 to six in 2010 - 2019; Figure 1). There is a clear decline of orchid-rich hectads in Great Britain: between the first and the last time-period the number of hectads with over 16 species fell from 107 to 41.
Our analysis finds some northward movement of orchids in Great Britain, but Ireland’s orchids seem to be moving towards the southwest. A major topic of discussion has been migration lag; the fact that plant species experience delayed rather than immediate responses to temperature changes has become an issue for tree species (Veresoglou and Halley, 2018; Zhu et al., 2012). Many analyses and observations have been made of poleward shifts of species range, attributed to global climatic change. For plants in general, and for orchids in particular, the pattern is harder to see. To assess overall patterns of movement, north or otherwise, we carried out an analysis that was ultimately expressed with windrose diagrams, as in other similar publications (Lazarina et al., 2023). Our finding for orchids was essentially no different from earlier results, even with the new data from Plant Atlas 2020. An earlier analysis (Groom, 2013), including all plant species of Great Britain using the first two BSBI atlases, found that while there was evidence of poleward distributional shift in plants, this could not be tied unequivocally to climatic change. Much of the pattern of movement could more easily be related to other biotic or abiotic factors that are likely to affect movement, such as fungi/pollinator availability, habitat alterations, or competition (e.g. Fay and Calevo, 2024; Hutchings et al., 2018). For example, Ophrys insectifera is one of the “losers” in Great Britain (occupancy trend = -1.058, p = 0.001; see Supplementary Table S3). According to Fay et al. (2015b), this change can be – among others – attributed to alterations in its habitat (afforestation of sparse scrub margins) due to management changes, that also affect its reproductive success by limiting the availability of its specific pollinator. As well as climatic influences, some of the main shifts also reflect the greater losses of species in the most developed regions, notably southern and southeastern Britain and northeastern Ireland, so the center of mass moves away from these regions on each island. For example, for a common species such as Dactylorhiza fuchsii, greater losses took place in the south than the north. Its relative center of mass has moved north because more semi-natural grassland has survived outside the intensively managed south and southeast.
Are orchid populations declining in the British Isles? The analysis of linear trends undertaken here at the hectad level shows that several individual species are declining, although it does not reveal a significant overall decline of orchid occupancy either in Britain or in Ireland. This could be because of the limitation implied in using hectad occupancy as a proxy of abundance; that using occupied-or-not-occupied at the resolution of hectads is just too crude to detect major losses occurring at a much finer scale. Is it possible that the weak trends we observe, collectively indistinguishable from natural variability, cloak a disastrous loss of individuals at the level of, say, hectares or less, “hiding” under the lack of resolution? Several authors have argued that most orchids surveyed at the population level have shown substantial decreases (e.g. Bateman, 2022, 2025a; Braithwaite, 2024; Trudgill, 2022, 2023). What resolution is needed to resolve this issue? Would we need to improve resolution down to the level of hectares or even 10 m × 10 m plots or could monad-level resolution be adequate to define typical orchid clusters (Bateman, 2025a)? Whilst the recording of individuals by geotagging has been common practice for decades, especially for demographic studies (e.g. Hutchings, 1987a, b, 2010; Wells, 1967; Wells and Cox, 1989), the incorporation of such data into grid-based atlases and databases will bring additional challenges regarding not only storage but also issues with acquisition and organization of national-level asynchronous recordings of dynamic populations. In addition, Boyd et al. (2024) point out that if there is the potential for sampling bias, there will be a trade-off between spatial resolution and accuracy, since fine-scale estimates tend to be more biased under non-random sampling. Thus, in the presence of bias, finer resolution (if not handled carefully) could make things worse. Chasing ever-improving resolution may not be the best way to solve the problem.
While it is possible to argue that hectad level occupancy is much coarser than typical orchid clusters (Bateman, 2025a; Trudgill, 2022, 2023), and therefore that hectad-level results say nothing about the fate of the orchid populations, it is not so simple. Consider the two theoretical scenarios depicted in Figure 4 for the distribution of a single focal species’ population. In the first, a population is randomly and uniformly distributed over the region, in this case consisting of just three cells (A, B and C). The scale is much larger than individual plants, so the average density is the same in the three cells (Figure 4A, top row). In the other case, the population is randomly but non-uniformly distributed over the three cells (Figure 4B, top row). This could happen, for example, with linearly decaying habitat suitability, allowing greatest abundances in Cell A where conditions are more optimal and lowest in Cell C where conditions are poor. Now consider a regime of human interference that progressively reduces habitat quality everywhere and in the same way. This might be land-use change, where suitable habitat for the focal species is being steadily converted into non-habitat. As a result, in both scenarios, we expect the total population (measured in all three cells) to shrink with time, subject to some demographic variability, by a characteristic proportion (about 75% in the simulated example of Figure 4). This would mean that starting from 36 individuals, nine will remain after the first step, and then fewer than two after the second step.
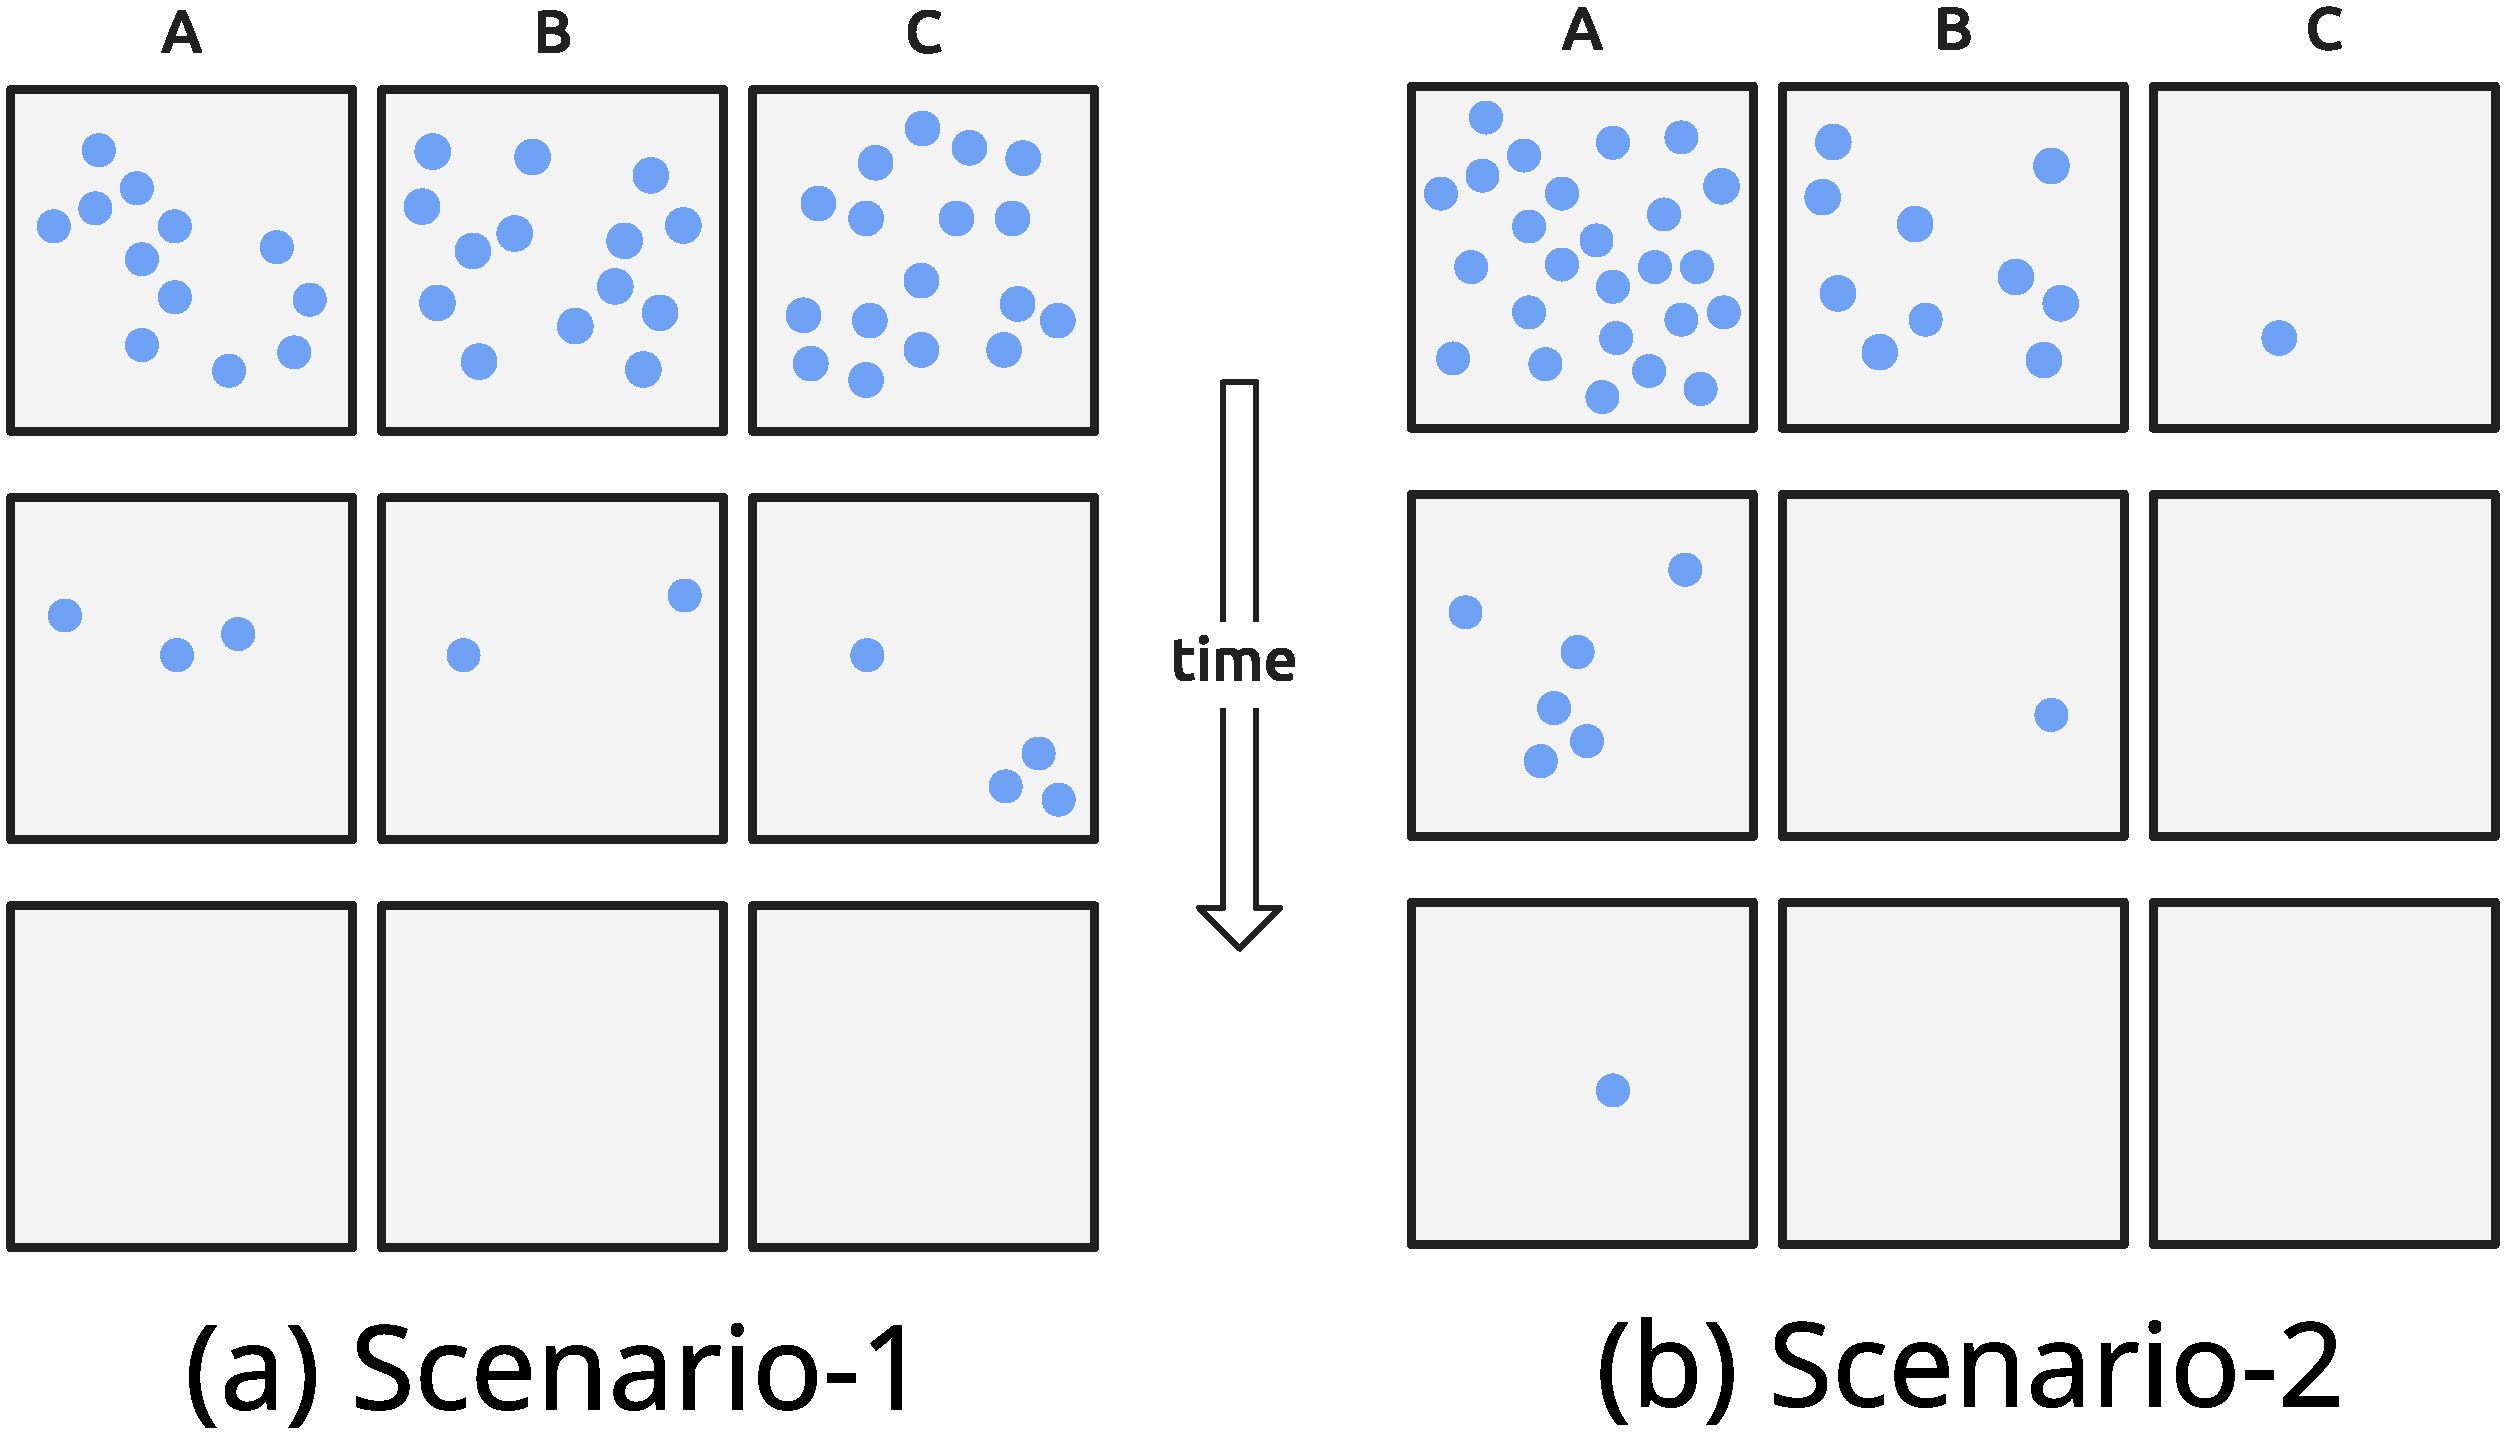
Figure 4. Two scenarios for the fate of three cells (A–C) suffering habitat deterioration through time, for a single species. Cells may represent hectads, monads or some other spatial denomination, while dots are individual plants. In both scenarios, the top row is the initial state of the three cells and the second and third rows the state at later times. The scenarios differ in the clustering: in Scenario 1 (a), all cells begin with similar numbers; in Scenario 2 (b), most individuals are in Cell A (A>>B>>C). The environment is assumed to be deteriorating at a constant rate, so that on the second row, in each cell only 25% of individuals survive (binomial trials, with survival probability 0.25) and in the third row only 25% survive from the second row.
In the uniform scenario (Figure 4A), the average population per cell is about 12 individuals, therefore a 75% drop leads to about three individuals in every cell, and a further 75% decrease leads to the extinction in all three cells. The measured occupancy would fall from all the cells being occupied to none (3:3:0), without any sign of loss. In this scenario, occupancy masks the decline that occurs at the finer scale, with occupancy reflecting the real abundances only when it is too late. By contrast, in the second scenario, the declining occupancy pattern (3:2:1) reveals information about the declining population. The intuition is that in this case, there is the successive extinction in the low-density marginal cells. Initially only cell C is marginal, so in the first wave of losses (going to row 2) the species is lost from C, leaving two cells occupied, with the population in B now becoming marginal. With the further loss, the species also goes extinct in cell B, leaving only A occupied. In other words, changes in occupancy capture the decline of the population due to the non-uniformity of the population density. These scenarios could also happen in reverse, with the expansion of a species being visible at the hectad level or not, depending on the distribution of abundance across multiple hectads (Fois et al., 2018).
More generally: when does measured occupancy reflect population abundance? This is a question of abundance–occupancy relationships, which have been widely addressed in literature (e.g. Bateman, 2025a; Gaston, 1996; Roney et al., 2015; Ten Caten et al., 2022; Tzortzaki et al., 2017). As in the case of the second scenario, changes in abundances may be at least partially inferred when looking at the occupancy, though not in situations like the uniform case. This overall pattern we expect to hold for any species and for combinations of species, provided that their spatial distributions are not heavily interdependent. Thus, while the stability of hectad occupancy might be “masking” massive reductions in population (if the density across hectads is similar) there are also reasons to believe that it could genuinely reflect stability in population (if there is a spread of densities at this resolution). Further work in this direction will allow us to draw more secure conclusions regarding the abundance of orchids in Britain and Ireland. In particular, more detailed spatial analysis is needed, especially estimates of characteristic density at different grid scales for each species, which is the subject of an ongoing study (in preparation from the same group). We also need a procedure that can translate changes at the hectad (or monad) level into actual population changes, or at least capture the trend, without the need to sample all of the 10 × 10 m squares constituting the British Isles. It is thus clear that information at a finer spatial scale can potentially reveal more compelling trends for positive and negative change, but a theoretical approach using a multi-scale or fractal analysis (Halley et al., 2004; Loke and Chisholm, 2022), as suggested above, could further help us gain a much better understanding of the trends of change at finer spatial scales.
Data availability statement
The data analyzed in this study is subject to the following licenses/restrictions: The data analyzed in this study were obtained from the Botanical Society of Britain and Ireland (BSBI) Distribution Database (https://database.bsbi.org). Data from the BSBI are subject to copyright and database rights described in the Data Access Policy (https://docs.bsbi.org/using-our-data/data-access-policy). Requests to access these datasets should be directed to BSBI Distribution Database-Data Team, ZGF0YWFjY2Vzc0Bic2JpLm9yZw==.
Author contributions
MC: Writing – review & editing, Software, Methodology, Funding acquisition, Investigation, Writing – original draft, Formal Analysis, Visualization, Data curation, Conceptualization, Validation. SM: Investigation, Software, Writing – review & editing, Visualization, Methodology, Validation, Data curation, Formal Analysis. KS: Writing – review & editing, Project administration. KK: Methodology, Software, Writing – review & editing, Funding acquisition, Conceptualization. RB: Writing – original draft, Supervision, Validation, Methodology, Writing – review & editing. KW: Data curation, Resources, Writing – review & editing. JH: Resources, Funding acquisition, Project administration, Formal Analysis, Writing – review & editing, Validation, Methodology, Writing – original draft, Conceptualization, Supervision, Investigation.
Funding
The author(s) declare financial support was received for the research and/or publication of this article. The research project was supported by the Hellenic Foundation for Research and Innovation (H.F.R.I.) under the “2nd Call for H.F.R.I. Research Projects to support Faculty Members & Researchers” (Project Number: 3972).
Acknowledgments
We would like to thank Dr O.L. Pescott for supplying the Frescalo-corrected data used in Atlas 2020, and also for helpful discussions on the manuscript. We would also like to acknowledge helpful suggestions from Dr P.C.D. Johnson, and we are grateful for the insightful comments from all three reviewers of the present manuscript.
Conflict of interest
The authors declare that the research was conducted in the absence of any commercial or financial relationships that could be construed as a potential conflict of interest.
The Reviewer MF declared a past co-authorship with the author KK.
The author(s) declared that they were an editorial board member of Frontiers, at the time of submission. This had no impact on the peer review process and the final decision.
Generative AI statement
The author(s) declare that no Generative AI was used in the creation of this manuscript.
Any alternative text (alt text) provided alongside figures in this article has been generated by Frontiers with the support of artificial intelligence and reasonable efforts have been made to ensure accuracy, including review by the authors wherever possible. If you identify any issues, please contact us.
Publisher’s note
All claims expressed in this article are solely those of the authors and do not necessarily represent those of their affiliated organizations, or those of the publisher, the editors and the reviewers. Any product that may be evaluated in this article, or claim that may be made by its manufacturer, is not guaranteed or endorsed by the publisher.
Supplementary material
The Supplementary Material for this article can be found online at: https://www.frontiersin.org/articles/10.3389/fevo.2025.1646994/full#supplementary-material
References
Adamo M., Chialva M., Calevo J., Bertoni F., Dixon K., and Mammola S. (2021). Plant scientists’ research attention is skewed towards colourful, conspicuous and broadly distributed flowers. Nat. Plants 7, 574–578. doi: 10.1038/s41477-021-00912-2
Antonelli A., Govaerts R., Nic Lughadha E., Onstein R. E., Smith R. J., and Zizka A. (2023). Why plant diversity and distribution matter. New Phytol. 240, 1331–1336. doi: 10.1111/nph.19282
Ariño A. and Pimm S. L. (1995). On the nature of population extremes. Evol. Ecol. 9, 429–443. doi: 10.1007/BF01237765
Barman D. and Devadas R. (2013). Climate change on orchid population and conservation strategies: A review. J. Crop Weed 9, 1–12.
Bateman R. M. (2022). Systematics and conservation of British and Irish orchids: a “state of the union” assessment to accompany Atlas 2020. Kew Bull. 77, 355–402. doi: 10.1007/s12225-022-10016-5
Bateman R. M. (2025a). Making a molehill out of a mountain: scale, frequency and heterogeneity greatly influence perceptions of extinction rate. BSBI News 159, 28–34.
Bateman R. M. (2025b). Supposed Spider-orchid fidelity is challenged by a (very) long-distance love affair. J. Hardy Orch. Soc. 22(3), [in press].
Bateman R. M., Rudall P. J., and Denholm I. (2021). In situ morphometric survey elucidates the evolutionary systematics of the orchid genus Gymnadenia in the British Isles. System. Biodiv. 19, 571–600. doi: 10.1080/14772000.2021.1877848
Beran J., Feng Y., Ghosh S., and Kulik R. (2013). Long Memory Processes. (Berlin, Heidelberg: Springer Berlin Heidelberg). doi: 10.1007/978-3-642-35512-7
Bournérias M., et al (Ed.) (1998). Les orchidées de France, Belgique et Luxembourg (Mèze, France: Biotope).
Bournérias M. and Prat D. (Eds.) (2005). Les orchidées de France, Belgique et Luxembourg. 2nd ed. (Mèze, France: Biotope).
Boyd R. J., Bowler D. E., Isaac N. J. B., and Pescott O. L. (2024). On the trade-off between accuracy and spatial resolution when estimating species occupancy from geographically biased samples. Ecol. Modell. 493. doi: 10.1016/j.ecolmodel.2024.110739
Braithwaite M. E. (2024). Species population decline at tetrad and hectad scales. BSBI News 155, 7–10.
Braithwaite M. E., Ellis R. W., and Preston C. D. (2006). Change in the British Flora 1987–2004 (London, UK: Botanical Society of the British Isles).
Brouwers J. M. (2024). PyGeodesy (Version 24.3.2) [Software]. GitHub. Available online at: https://github.com/mrJean1/PyGeodesy (Accessed September 3, 2024).
Burns F., Eaton M. A., Barlow K. E., Beckmann B. C., Brereton T., Brooks D. R., et al. (2016). Agricultural management and climatic change are the major drivers of biodiversity change in the UK. PloS One 11(3), e0151595. doi: 10.1371/journal.pone.0151595
Charitonidou M. (2022). Modelling the population dynamics and distribution of two Ophrys (Orchidaceae) species in northwestern Greece. University of Ioannina, Ioannina, Greece. doi: 10.12681/eadd/51844
Crisp, Laffan S., Linder H. P., and Monro A. (2001). Endemism in the Australian flora. J. Biogeog. 28, 183–198. doi: 10.1046/j.1365-2699.2001.00524.x
Damgaard C., Moeslund J. E., and Wind P. (2020). Changes in the abundance of Danish orchids over the past 30 years. Diversity 12(6), 244. doi: 10.3390/D12060244
Daru B. H., Farooq H., Antonelli A., and Faurby S. (2020). Endemism patterns are scale dependent. Nat. Commun. 11, 1–11. doi: 10.1038/s41467-020-15921-6
DeGroot M. H. and Schervish M. J. (2012). Probability and Statistics. 4th Edition (Boston, USA: Addison-Wesley, Pearson Education).
Djordjević V., Lakušić D., Novković I., Stevanović V., and Tsiftsis S. (2025). Factors influencing orchid species richness in the Central Balkans: The importance of belowground organ types. Plants 14(3), 443. doi: 10.3390/plants14030443
Djordjević V. and Tsiftsis S. (2022). “The role of ecological factors in distribution and abundance of terrestrial orchids,” in Orchids Phytochemistry, Biology and Horticulture. Eds. Mérillon J.-M. and Kodja H. (Switzerland: Springer Nature), 3–72. doi: 10.1007/978-3-030-38392-3_4
Evans A. and Jacquemyn H. (2022). Range size and niche breadth as predictors of climate-induced habitat change in Epipactis (Orchidaceae). Front. Ecol. Evol. 10. doi: 10.3389/fevo.2022.894616
Farrell L. (1985). Biological flora of the british isles: orchis militaris L. J. Ecol. 73, 1041–1053. doi: 10.2307/2260166
Fay M. F. (2015). British and Irish orchids in a changing world. Curtis’s Bot. Mag. 32, 3–23. doi: 10.1111/curt.12097
Fay M. F. (2018). Orchid conservation: how can we meet the challenges in the twenty-first century? Bot. Stud 59(1), 16. doi: 10.1186/s40529-018-0232-z
Fay M. F. and Calevo J. (2024). British and Irish orchids in a changing world–an update. Curtis’s Bot. Mag. 41, 177–179. doi: 10.1111/curt.12576
Fay M. F., Pailler T., and Dixon K. W. (2015a). Orchid conservation: Making the links. Ann. Bot. 116, 377–379. doi: 10.1093/aob/mcv142
Fay M. F., Taylor I., and Sayers B. (2015b). 804. Ophrys insectifera. Curtis’s Bot. Mag. 32, 51–62. doi: 10.1111/curt.12093
Fois M., Cuena-Lombraña A., Fenu G., Cogoni D., and Bacchetta G. (2018). Does a correlation exist between environmental suitability models and plant population parameters? An experimental approach to measure the influence of disturbances and environmental changes. Ecol. Indic. 86, 1–8. doi: 10.1016/j.ecolind.2017.12.009
Foley M. J. Y. (1990). The current distribution and abundance of Orchis ustulata L. in southern England. Watsonia 18, 37–48.
Foley M. J. Y. (2004). A summary of the past and present status of Spiranthes aestivalis (Poir.) Rich. (Orchidaceae) (Summer Lady's-tresses) in north-west Europe. Watsonia 25, 193–201.
Forest F., Grenyer R., Rouget M., Davies T. J., and Cowling R. M. (2007). Preserving the evolutionary potential of floras in biodiversity hotspots. Nature 445, 757–760. doi: 10.1038/nature05587
Franzke C. L., Barbosa S., Blender R., Fredriksen H. B., Laepple T., Lambert F., et al. (2020). The structure of climate variability across scales. Rev. Geophys 58, e2019RG000657. doi: 10.1029/2019RG000657
Fuller R. M. (1987). The changing extent and conservation interest of lowland grasslands in England and Wales: A review of grassland surveys 1930–1984. Biol. Conserv. 40, 281–300. doi: 10.1016/0006-3207(87)90121-2
Gaston K. J. (1996). The multiple forms of the interspecific abundance-distribution relationship. Oikos 76, 211–220. doi: 10.2307/3546192
Godfery M. J. (1933). Monograph and Iconograph of Native British Orchidaceae (Cambridge, Great Britain: Cambridge University Press).
Groom Q. J. (2013). Some poleward movement of British native vascular plants is occurring, but the fingerprint of climate change is not evident. PeerJ 2013, 1–13. doi: 10.7717/peerj.77
Halley J. M. (1996). Ecology, evolution and 1/f-noise. Trends Ecol. Evol. 11, 33–37. doi: 10.1016/0169-5347(96)81067-6
Halley J. M. (2009). Using models with long-term persistence to interpret the rapid increase of Earth’s temperature. Phys. A Stat. Mech. Appl. 388, 2492–2502. doi: 10.1016/j.physa.2009.02.027
Halley J. M., Hartley S., Kallimanis A. S., Kunin W. E., Lennon J. J., and Sgardelis S. P. (2004). Uses and abuses of fractal methodology in ecology. Ecol. Lett. 7, 254–271. doi: 10.1111/j.1461-0248.2004.00568.x
Halley J. M. and Kunin W. E. (1999). Extinction risk and the 1/f family of noise models. Theor. Popul. Biol. 56, 215–230. doi: 10.1006/tpbi.1999.1424
Harris C. R., Millman K. J., van der Walt S. J., Gommers R., Virtanen P., Cournapeau D., et al. (2020). Array programming with numPy. Nature 585, 357–362. doi: 10.1038/s41586-020-2649-2
Hill M. O. (2012). Local frequency as a key to interpreting species occurrence data when recording effort is not known. Methods Ecol. Evol. 3, 195–205. doi: 10.1111/j.2041-210X.2011.00146.x
Hooftman D. A. P. and Bullock J. M. (2012). Mapping to inform conservation: A case study of changes in semi-natural habitats and their connectivity over 70 years. Biol. Conserv. 145, 30–38. doi: 10.1016/j.biocon.2011.09.015
Hutchings M. J. (1987a). The population biology of the Early Spider Orchid, Ophrys sphegodes Mill. I. A demographic study from 1975 to 1984. J. Ecol. 75, 711. doi: 10.2307/2260201
Hutchings M. J. (1987b). The population biology of the Early Spider Orchid, Ophrys sphegodes Mill. II. Temporal patterns in behaviour. J. Ecol. 75, 729. doi: 10.2307/2260202
Hutchings M. J. (2010). The population biology of the Early Spider Orchid, Ophrys sphegodes Mill. III. Demography over three decades. J. Ecol. 98, 867–878. doi: 10.1111/j.1365-2745.2010.01661.x
Hutchings M. J., Robbirt K. M., Roberts D. L., and Davy A. J. (2018). Vulnerability of a specialized pollination mechanism to climate change revealed by a 356-year analysis. Bot. J. Linn. Soc 186, 498–509. doi: 10.1093/botlinnean/box086
Huybers P. and Curry W. (2006). Links between annual, Milankovitch and continuum temperature variability. Nature 441, 329–332. doi: 10.1038/nature04745
Inchausti P. and Halley J. (2002). The long-term temporal variability and spectral colour of animal populations. Evol. Ecol. Res. 4, 1033–1048.
Jacquemyn H., De Coensel B., Evans A., Wang D., and Merckx V. S. F. T. (2024). The relationship between phylogeny, range size, niche breadth and niche overlap in European orchids (Orchidaceae). J. Biogeogr. 51, 409–421. doi: 10.1111/jbi.14769
Kougioumoutzis K., Kokkoris I. P., Panitsa M., Kallimanis A., Strid A., and Dimopoulos P. (2021). Plant endemism centres and biodiversity hotspots in Greece. Biol. (Basel) 10, 72. doi: 10.3390/biology10020072
Kull T. and Hutchings M. J. (2006). A comparative analysis of decline in the distribution ranges of orchid species in Estonia and the United Kingdom. Biol. Conserv. 129, 31–39. doi: 10.1016/j.biocon.2005.09.046
Kull T., Selgis U., Peciña M. V., Metsare M., Ilves A., Tali K., et al. (2016). Factors influencing IUCN threat levels to orchids across Europe on the basis of national red lists. Ecol. Evol. 6, 6245–6265. doi: 10.1002/ece3.2363
Lazarina M., Sgardelis S. P., Michailidou D. E., Tsianou M., Andrikou-Charitidou A., Touloumis K., et al. (2023). Replacement drives native β-diversity of British avifauna, while richness differences shape alien β-diversity. Divers. Distrib. 29, 61–74. doi: 10.1111/ddi.13641
Loke L. H. L. and Chisholm R. A. (2022). Measuring habitat complexity and spatial heterogeneity in ecology. Ecol. Lett. 25, 2269–2288. doi: 10.1111/ele.v25.10
Molnár A., Tökölyi J., Végvári Z., Sramkó G., Sulyok J., and Barta Z. (2012). Pollination mode predicts phenological response to climate change in terrestrial orchids: a case study from central Europe. J. Ecol. 100, 1141–1152. doi: 10.1111/j.1365-2745.2012.02003.x
Montràs-Janer T., Suggitt A. J., Fox R., Jönsson M., and Martay B. (2024). Anthropogenic climate and land-use change drive short- and long-term biodiversity shifts across taxa. Nat. Ecol. Evol. 8, 739–751. doi: 10.1038/s41559-024-02326-7
Myers N., Mittermeier R. A., Mittermeier C. G., Fonseca G. A. B., and Kent J. (2000). Biodiversity hotspots for conservation priorities. Nature 403, 853–858. doi: 10.1038/35002501
Paušič I., Lipovšek M., Jakely D., Pavlec N., Ivajnšič D., and Kaligarič M. (2019). Local climate and latitude affect flower form of Ophrys fuciflora (Orchidaceae): evidence for clinal variation. Bot. Lett. 166, 499–512. doi: 10.1080/23818107.2019.1668298
Perring F. H. and Walters S. M. (1962). Atlas of the British Flora. 1st edn (London, UK: Thomas Nelson & Sons).
Perring F. H. and Walters S. M. (1968). Critical Supplement to the Atlas of the British Flora. 1st edn (London, UK: Thomas Nelson & Sons).
Pescott O. L., Humphrey T. A., Stroh P. A., and Walker K. J. (2019). Temporal changes in distributions and the species atlas: How can British and Irish plant data shoulder the inferential burden? Br. Irish Bot. 1, 250–282. doi: 10.33928/bib.2019.01.250
Pescott O. L., Stroh P. A., Humphrey T. A., and Walker K. J. (2022). Simple methods for improving the communication of uncertainty in species’ temporal trends. Ecol. Indicat. 141, 109117. doi: 10.1016/j.ecolind.2022.109117
Phillips E. T., Höll M., Kantz H., and Zhou Y. (2023). Trend analysis in the presence of short- and long-range correlations with application to regional warming. Phys. Rev. E 108, 034301. doi: 10.1103/PhysRevE.108.034301
Prendergast J. R., Quinn R. M., Lawton J. H., Eversham B. C., and Gibbons D. W. (1993). Rare species, the coincidence of diversity hotspots and conservation strategies. Nature 365, 335–337. doi: 10.1038/365335a0
Preston C. D., Hill M. O., Harrower C. A., and Dines T. D. (2013). Biogeographical patterns in the British and Irish flora. New J. Bot. 3, 96–116. doi: 10.1179/2042349713Y.0000000024
Preston C. D., Pearman D. A., and Dines T. D. (2002). New Atlas of the British and Irish Flora (London, UK: Oxford University Press).
Robbirt K. M., Roberts D. L., Hutchings M. J., and Davy A. J. (2014). Potential disruption of pollination in a sexually deceptive orchid by climatic change. Curr. Biol. 24, 2845–2849. doi: 10.1016/j.cub.2014.10.033
Roney N. E., Kuparinen A., and Hutchings J. A. (2015). Comparative analysis of abundance–occupancy relationships for species at risk at both broad taxonomic and spatial scales. Can. J. Zool. 93, 515–519. doi: 10.1139/cjz-2014-0318
Rose F. (1948). Biological flora of the british isles. Orchis purpurea Huds. J. Ecol. 36, 366–377. doi: 10.2307/2256683
Seaton P. T., Hu H., Perner H., and Pritchard H. W. (2010). Ex situ conservation of orchids in a warming world. Bot. Rev. 76, 193–203. doi: 10.1007/s12229-010-9048-6
Shefferson R. P., Jacquemyn H., Kull T., and Hutchings M. J. (2020). The demography of terrestrial orchids: life history, population dynamics and conservation. Bot. J. Linn. Soc 192, 315–332. doi: 10.1093/botlinnean/boz084
Stroh P. A., Walker K. J., Humphrey T. A., Pescott O. L., and Burkmar R. J. (2023). Plant Atlas 2020: mapping changes in the distribution of the British and Irish flora (New Jersey, USA: Princeton University Press).
Suggitt A. J., Wheatley C. J., Aucott P., Beale C. M., and Fox R. (2023). Linking climate warming and land conversion to species’ range changes across Great Britain. Nat. Commun. 14, 6759. doi: 10.1038/s41467-023-42475-0
Taheri S., García-Callejas D., and Araújo M. B. (2021). Discriminating climate, land-cover and random effects on species range dynamics. Glob. Change Biol. 27, 1309–1317. doi: 10.1111/gcb.15483
Tatarenko I., Zhmylev P., Voronina E., and Longrigg S. (2022). Biological flora of britain and Ireland 298: hammarbya paludosa (L.) kuntze. J. Ecol. 110, 717–737. doi: 10.1111/1365-2745.13840
Ten Caten C., Holian L. A., and Dallas T. (2022). Effects of occupancy estimation on abundance-occupancy relationships. Biol. Lett. 18, 20220137. doi: 10.1098/rsbl.2022.0137
Trudgill D. (2022). Orchids in Scotland: changes in their occurrence since 1950. Br. Irish Bot. 4, 34–41. doi: 10.33928/bib.2022.04.034
Tsiftsis S. and Tsiripidis I. (2020). Temporal and spatial patterns of orchid species distribution in Greece: implications for conservation. Biodivers. Conserv. 29, 3461–3489. doi: 10.1007/s10531-020-02035-0
Tzortzaki A. E., Vokou D., and Halley J. M. (2017). Campanula lingulata populations on Mt. Olympus, Greece: where’s the “abundant centre”? J. Biol. Res. (Thessalon) 24, 1–13. doi: 10.1186/s40709-016-0058-3
Veresoglou S. D. and Halley J. M. (2018). Seed mass predicts migration lag of European trees. Ann. For. Sci. 75, 86. doi: 10.1007/s13595-018-0766-y
Vogt-Schilb H., Munoz F., Richard F., and Schatz B. (2015). Recent declines and range changes of orchids in Western Europe (France, Belgium and Luxembourg). Biol. Conserv. 190, 133–141. doi: 10.1016/j.biocon.2015.05.002
Walker K., Stroh P., and Ellis B. (2018). Why are some plant species more threatened than others? Evidence from the BSBI’s Threatened Plants Project. BSBI News 137, 3–9.
Walker K. J., Stroh P. A., Humphrey T. A., Roy D. B., Burkmar R. A., and Pescott O. L. (2023). Britain's changing flora: a summary of the results of Plant Atlas 2020 (Durham: BSBI).
Wells T. C. E. (1967). Changes in a population of Spiranthes Spiralis (L.) Chevall. at Knocking Hoe National Nature Reserve, Bedfordshire 1962–65. J. Ecol. 55, 83. doi: 10.2307/2257718
Wells T. C. E. and Cox R. (1989). “Predicting the probability of the bee orchid (Ophrys apifera) flowering or remaining vegetative from the size and number of leaves,” in Modern Methods in Orchid Conservation: The Role of Physiology, Ecology and Management. Ed. Pritchard H. W. (Cambridge, UK: Cambridge University Press), 127–140. doi: 10.1017/CBO9780511551307.011
Willmer P. (2014). Climate change: Bees and orchids lose touch. Curr. Biol. 24, R1133–R1135. doi: 10.1016/j.cub.2014.10.061
Wraith J. and Pickering C. (2018). Quantifying anthropogenic threats to orchids using the IUCN Red List. Ambio 47, 307–317. doi: 10.1007/s13280-017-0964-0
Wraith J. and Pickering C. (2019). A continental scale analysis of threats to orchids. Biol. Conserv. 234, 7–17. doi: 10.1016/j.biocon.2019.03.015
Keywords: 1/f-noise, distribution shifts, diversity hotspots, migration, occupancy trends, Orchidaceae
Citation: Charitonidou M, Mouratidis S, Stara K, Kougioumoutzis K, Bateman RM, Walker KJ and Halley JM (2025) Analyzing patterns of change in the orchid flora of Britain and Ireland with correlated environmental variability. Front. Ecol. Evol. 13:1646994. doi: 10.3389/fevo.2025.1646994
Received: 14 June 2025; Accepted: 18 August 2025;
Published: 04 September 2025.
Edited by:
Vladan Djordjević, University of Belgrade, SerbiaReviewed by:
Mauro Fois, University of Cagliari, ItalyHans Jacquemyn, KU Leuven, Belgium
Réka Fekete, University of Debrecen, Hungary
Copyright © 2025 Charitonidou, Mouratidis, Stara, Kougioumoutzis, Bateman, Walker and Halley. This is an open-access article distributed under the terms of the Creative Commons Attribution License (CC BY). The use, distribution or reproduction in other forums is permitted, provided the original author(s) and the copyright owner(s) are credited and that the original publication in this journal is cited, in accordance with accepted academic practice. No use, distribution or reproduction is permitted which does not comply with these terms.
*Correspondence: Martha Charitonidou, bS5jaGFyaXRvbmlkb3VAdW9pLmdy; John M. Halley, amhhbGxleUB1b2kuZ3I=