 Xinggang Tang
 Zheng He1,2*
 Yingdan Yuan
- 1Technology Innovation Center for Land Spatial Ecological Protection and Restoration in Great Lakes Basin, Ministry of Natural Resources, Nanchang, China
- 2Jiangxi Institute of Land Space Survey and Planning, Nanchang, China
- 3College of Horticulture and Landscape Architecture, Yangzhou University, Yangzhou, China
To quantify the climate-change impact on bees and guide conservation planning, we employed ecological niche modeling (ENM) driven by three representative concentration pathways (RCP 4.5, 6.0 and 8.5) and three general circulation models (CCSM4, HadGEM2-AO and MIROC-ESM-CHEM). Across all scenarios and GCMs, suitable climatic space for every bee species is projected to contract, with the steepest declines in low-latitude regions. Range contractions vary from 8% to 87%, with wide-ranging species exhibiting greater resilience. Furthermore, Mean annual temperature (Bio1), annual precipitation (Bio12) and elevation collectively explain the largest share of interspecific distributional dynamics for each bee species. The median elevation of suitable pollinator habitat is projected to rise by 35 to 450m. The suitable centroids of bee species are expected to migrate 65 to 137 km south-eastwards, except for A. florea. Model projections indicate a widespread decline in environmental suitability for pollinators. Alarmingly, projected suitable occupied by habitat protected areas is relatively low, implying limited conservation efficacy under future climates. Accordingly, our findings provide a quantitative foundation for stakeholders to maximize the ecological and economic value of pollinators and develop smarter plant protection strategies in a warming world.
1 Introduction
Southeast Asia harbors exceptional biodiversity, driven by its equatorial position, surface topography, climatic characteristics, and ecosystems processes (Clements et al., 2006). The region’s low latitude and hot-humid climate, together with its dense human population, have forged a distinctive biota that attracts global ecological research (Sodhi et al., 2004). Over the past forty years, the global area cultivated with pollinator-dependent crops has expanded steadily, amplifying the ecological and economic consequences of pollinator decline (Aizen and Harder, 2009). Latitudinal thermal gradients strongly shape the geographic distribution of ectothermic insects, whose physiology and range limits are tightly coupled to ambient temperature (Wallner, 1987). Insect assemblages diverge markedly between montane and lowland habitats, reflecting distinct biogeographic histories that interact with elevational and latitudinal gradients (Koch et al., 2018). Temperature governs insect colonization, distribution, abundance, life-history traits and behavior, seasonal thermal regimes impose additional constraints on population dynamics and dispersal (Sinclair et al., 2003). Accelerating global warming now offers further possibilities for plant-pollinator research at low latitude regions.
Honey bees are keystone pollinators that underpin both wild-plant reproduction and crop yields across agricultural landscapes (Vanbergen and Initiative, 2013). Approximately 80% of angiosperms depend on animal vectors for pollination, and pollinators annually enhance both yield and quality of major crops around the world (Ollerton et al., 2011). The insect-plant mutualism that has evolved over geological time ranks among the most critical biotic interactions in terrestrial ecosystems. Nevertheless, regional and continental surveys reveal that honey bee populations are declining and some species are losing value as ecosystem providers because they are impending extinctions (Colla and Packer, 2008; Severns and Moldenke, 2010; Bommarco et al., 2012). Under low-emission climate scenarios for 2050, the habitat suitability of bumble bee species in South America is projected to contract by up to 67% (Martínez-López et al., 2021). Model projections further suggest that bee declines could disrupt coffee pollination across tropical Latin America, as shifting climatic envelopes reconfigure pollinator assemblages (Imbach et al., 2017). As an important component of agrobiodiversity, pollinating insects play a huge role in maintaining the biodiversity and stability of agroecosystems. Sustaining pollination service of ecosystems has become a core objective of agroforestry management worldwide (Potts et al., 2016a). The pollinator-friendly management measures implemented by some European countries (e.g. UK’s Agriculture Environmental Schedule) aim to regulate ecosystem pollinator communities and safeguard pollinator service function of the ecosystem (Ovenden et al., 1998).
Although we have begun to recognize the ecological value of pollinators and take targeted conservation measures, global pollinator populations continue to decline (Gallai et al., 2009). Global climate change and anthropogenic pressures increasingly destabilize biodiversity and are now primary drivers of bee diversity loss (Barman and Devadas, 2013; Giannini et al., 2020). Empirical evidence indicates that rising temperatures and altered precipitation regimes by climate change, can alter the plant-pollinator phenology matches across elevational and latitudinal gradients (Parmesan, 2006; Kharin et al., 2013). Moreover, climate-driven range shifts and centroid displacements diverge between plants and pollinators, intensifying ecosystem instability (Zhang et al., 2015; Ogilvie et al., 2017; Jakoby et al., 2019). Climate change disproportionately imperils pollinator biodiversity, especially at low latitudes (Roslin et al., 2017; Sheldon, 2019). Whereas most taxa exhibit peak diversity in the tropics, but Apidae (including honey bees) show reduced species richness near the equator (Orr et al., 2021). Low-latitude honey bee populations are affected by predicted climate change and their suitable habitat will shift upward along slope and latitude (Pyke et al., 2016; Rahimi et al., 2021). The synergistic effects of warming-driven range shifts and low tropical species richness are poised to amplify risks to regional agroforestry ecosystems. Although Imbach et al. (2017) and Martínez-López et al. (2021) examined climate-change impacts on low-latitude bee species in Latin America and Central America, equivalent analyses for Southeast Asia remain scarce (Imbach et al., 2017; Martínez-López et al., 2021). Although a few bee species may be climate-resilient, Imbach et al. (2017) have to admit that most species and the plants will be negatively affected under future climates (Imbach et al., 2017).
Recent studies found that different honey bee species exhibit convergent or divergent responses to climate change, and the hypothesis explaining this phenomenon is related to the evolutionary history and niche constraints of the species (Fründ et al., 2013; Kerr et al., 2015). Species distributions emerge from interactions between organisms and environmental factors (Wisz et al., 2008; Dormann et al., 2018). Species can continue to exist within a certain appropriate range, and the breadth and plasticity of this environmental tolerance define a key dimension of the species’ ecological niche (Kearney and Porter, 2009; Broennimann et al., 2012). Together, these principles provide a theoretical basis for anticipating pollinator responses to ongoing climate change. Ecological niche modelings (ENMs) are tools that use known species distribution data and relevant environmental variables to quantify the ecological requirements of species (Barve et al., 2011; Zhu et al., 2013). These algorithm-based frameworks offer the possibility to scientifically predict the actual and potential distribution of species across times and spaces (Peterson and Soberón, 2012). Consequently, ENMs are now integral to conservation biology, providing information for species habitat prediction, invasion risk assessment, climate-driven range shifts and phylogeographic reconstruction (Beck, 2013; Adhikari et al., 2019; Pili et al., 2020). In particular, ENM-based forecasts of pollinator distribution and niche dynamics yield additional insights into climate change and insect responses, which can help to better understand the survival principles and potential of bee-like pollinating insects in new habitats.
In this study, we used ecological niche modeling (ENM) to project the current and future potential distribution of five bee species. Based on our previous work, we have chosen two time periods, 2050 and 2070, to represent the future. Meanwhile, three representative concentration pathways (RCP 4.5, 6.0, and 8.5) and three general circulation models (CCSM4, HadGEM2-AO, and MIROC-ESM-CHEM) were chosen to capture scenario-dependent variation in projected distributions (Kerr et al., 2015; Rasmont et al., 2015). We adopted and tested the hypothesis that climate change drives both elevational increases and centroid shifts in species distribution ranges (Rotenberry and Balasubramaniam, 2020). We further hypothesized that species with larger ranges exhibit greater adaptive capacity (Gaston, 2008). We also examined the hypothesis that whether range size inversely correlates with projected range loss under future climate change. To quantify climate-change impacts on bees species, we constructed a clear ENM framework to assess species distribution and suitability based on current environmental variables. Based on this model, we used different climate change scenarios as input conditions to predict the future changes of bee species. From these projections, we analyzed and evaluated species range, centroid displacement and species responses to environmental change. In addition, we further quantified the overlap between current and future ranges of bee species and government-designated natural areas. Our findings will have theoretical insights and practical guidance for the management and conservation of these pollinators, and provide a reference for climate response of pollinators and sustainable agricultural development in low latitudes.
2 Materials and methods
2.1 Study region and species records
The study domain encompasses the equatorial belt and the Southeast Asian, comprising China, India, Thailand, Laos, Vietnam, Philippines, Cambodia, Bangladesh, Nepal, Singapore, Bhutan, Indonesia, Papua New Guinea, Timor-Leste, Australia, Vanuatu, Fiji, New Caledonia, and Solomon Islands (Figure 1). The region is topographically complex, dissected by numerous rivers, and dominated by tropical rainforest climate, tropical monsoon climate and alpine climates (Wheeler and White, 2002; Vadrevu et al., 2019). The five focal bee species involved are widespread throughout the region, and largely ensure the stability of agro-pastoral production and ecosystems in the region. The occurrence data of the five honey bee species (i.e. Apis dorsata, Apis florea, Apis laborosa, Apis andreniformis and Apis cerana) were obtained from the Global Biodiversity Information Facility (GBIF) database (GBIF, https://www.gbif.org/), China Academic Journal Network Publishing Database (http://www.cnki.net/), El Colegio de la Frontera Sur Database (http://www.ecosur.mx/) and Google Scholar (https://www.google.com/) (Kumar and Stohlgren, 2009; Kumar, 2012; Santana et al., 2019). We checked each occurrence data for the five honeybee species, and eliminated occurrence records with duplicate and unknown coordinates (Tang et al., 2020; Yuan et al., 2020). For species distribution points with only specific place name, Google Earth Pro (https://www.google.com/earth/versions/#earth-pro) was used to query precise coordinates corresponding to the place name, and the outliers were discarded (Li et al., 2020; Tang et al., 2021a; Zhao et al., 2021). In addition, the geographic distribution records with excessively ambiguous labels (e.g., ‘Thailand’) was likewise excluded (Tang et al., 2021b). The actual ranges of some honeybee species may exceed the areas delineated, and the study assumes that species distributed outside the study area (e.g., at higher latitudes) are ecologically and genetically distinct from the populations in the study area (Martínez-López et al., 2021; Wang et al., 2023). After these steps, 20,583 validated occurrences remained for the five bee species.
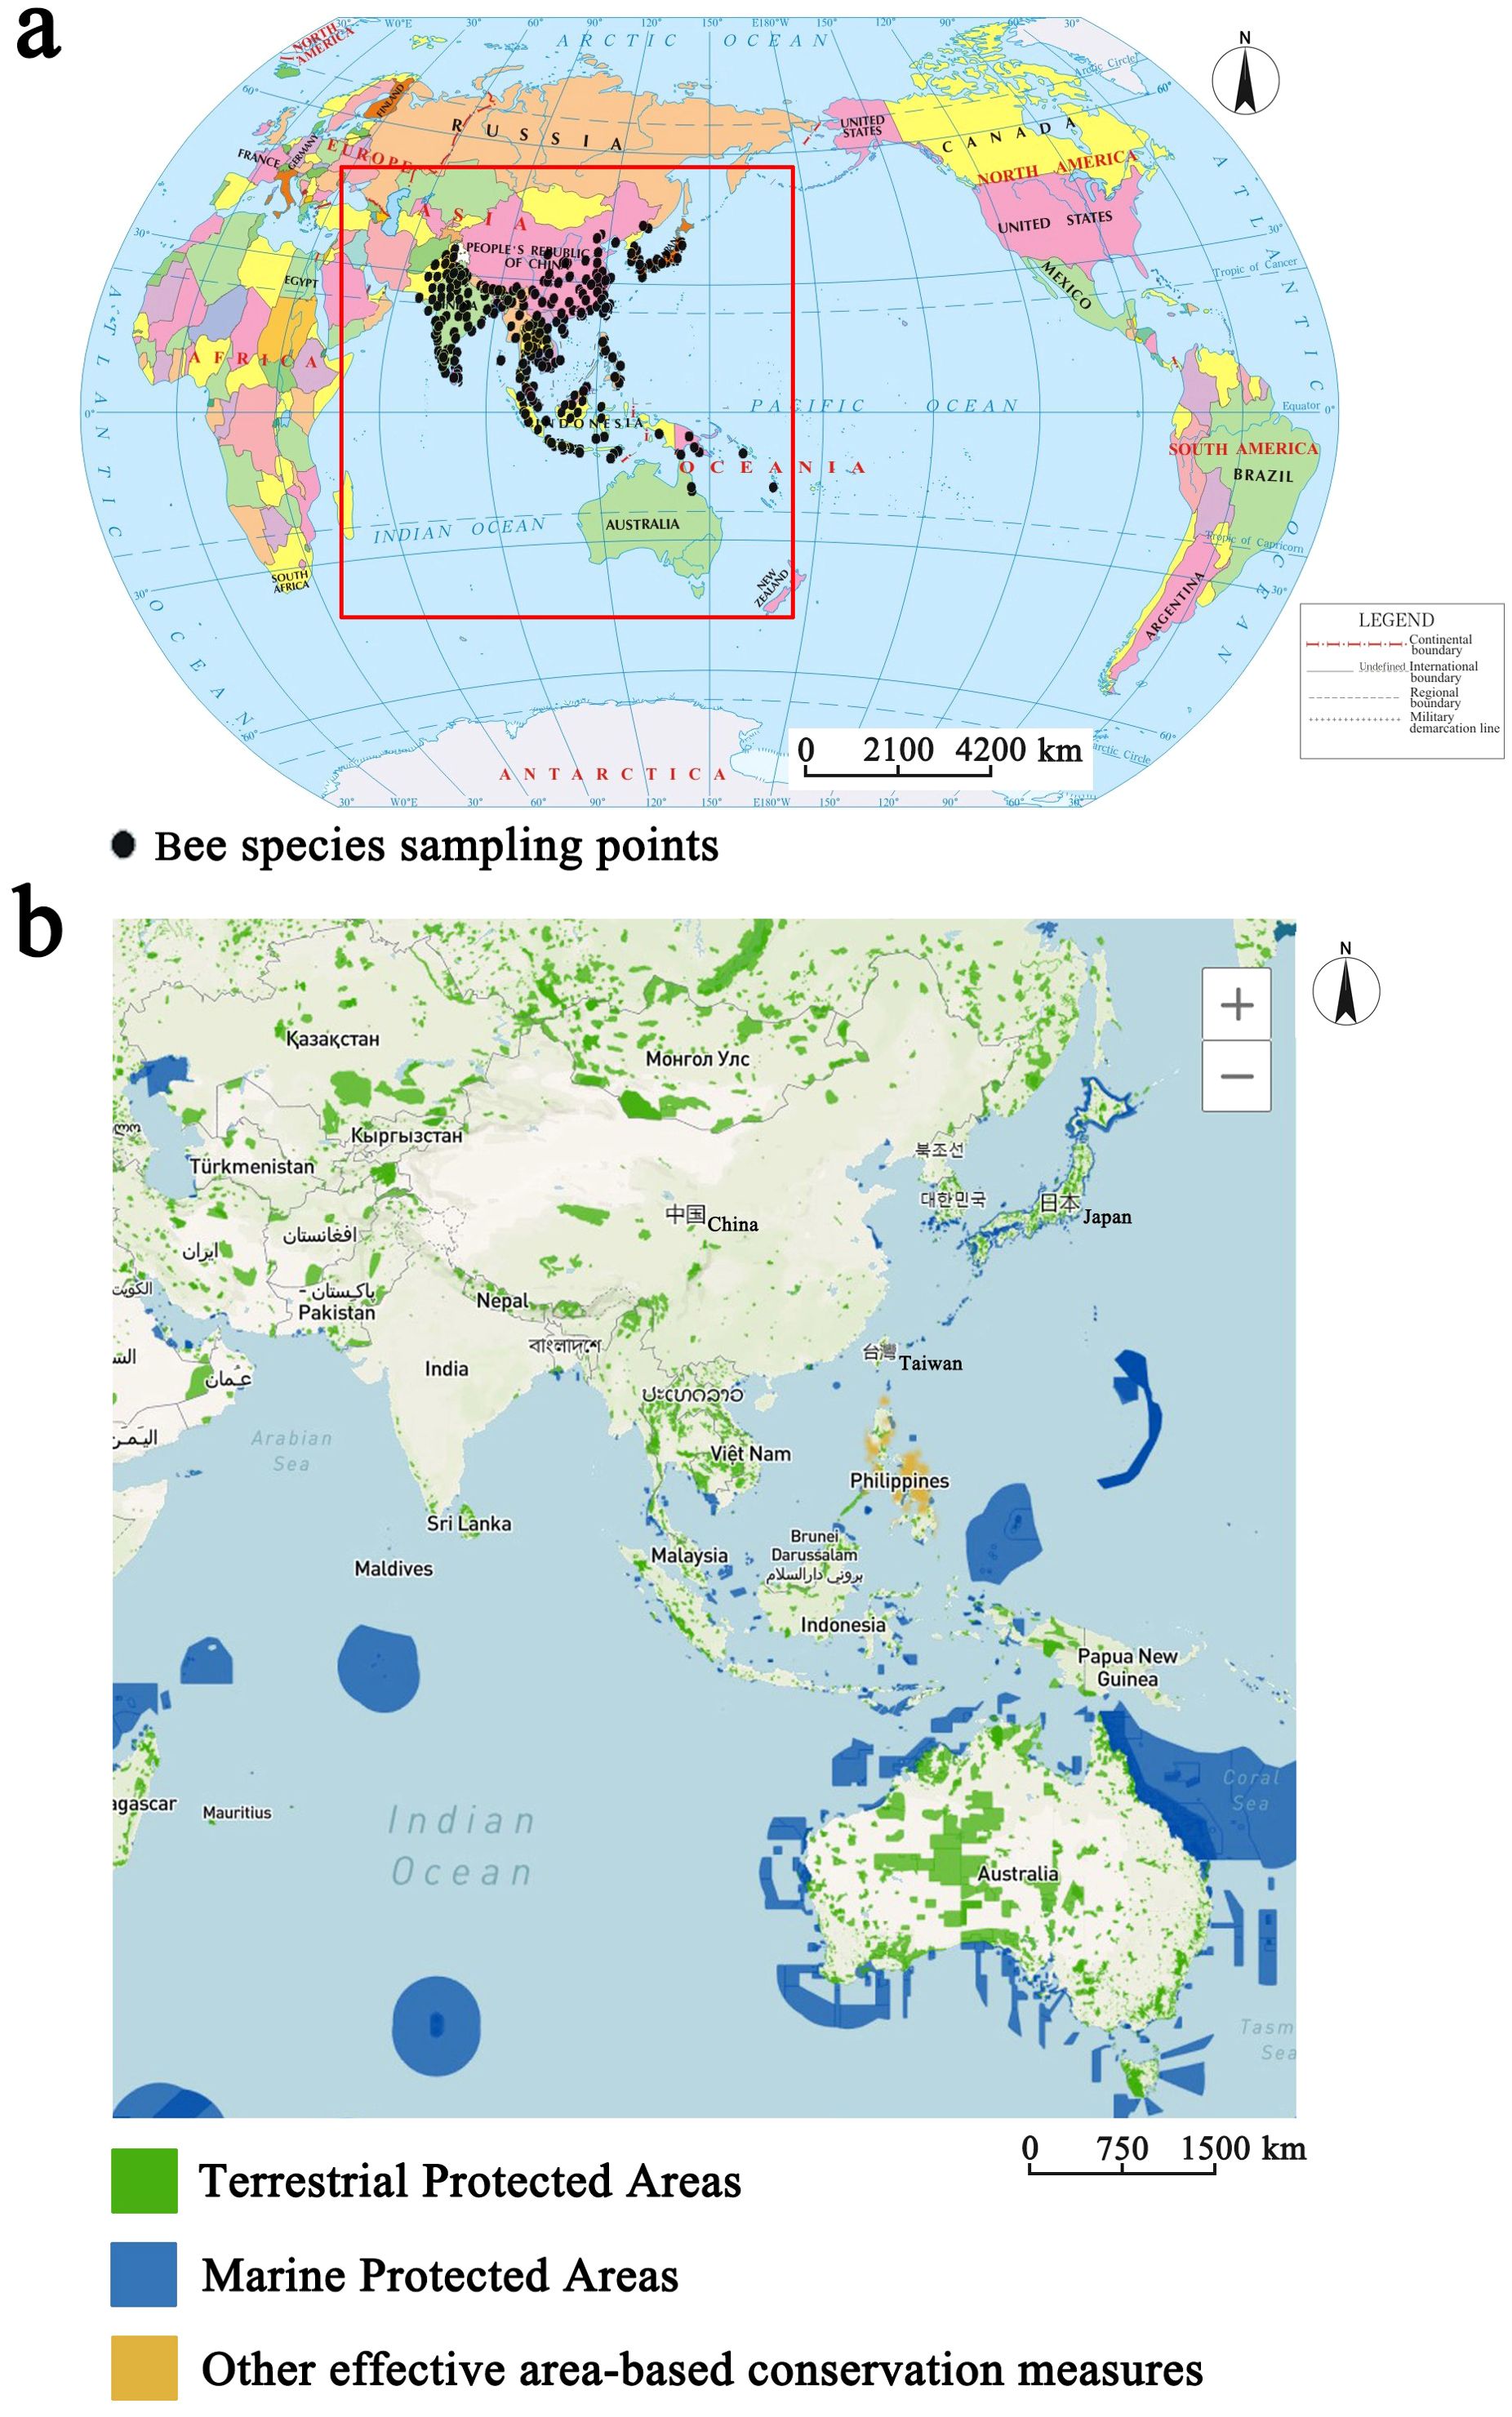
Figure 1. Comprehensive sampling points for five bee species and natural protected areas based on the Protected Planet website (https://www.protectedplanet.net). (a) Distribution of bee species sampling points. (b) Distribution of protected areas.
To mitigate oversampling bias, sampling deviation correction was applied to calibrate the distribution of each species, but different correction methods have certain limitations (Kramer-SChadt et al., 2013). The limited number of distribution points were retained within a certain distance according to the spatial screening method, and systematic sampling was performed again according to the principle of uniformity and randomness to ensure that the geographic autocorrelation of the datapoints was minimized (Tang et al., 2021a, 2021; Wen et al., 2024). Meanwhile, the sampling results were compared with the sampling results of cluster grouping and group modeling (Tang et al., 2021b). While ensuring sufficient modeling data to the greatest extent, the distribution points behave as a true reflection of the bee species distribution during the modeling process (Boria et al., 2014). Using these methods, the 5893 unique occurrences for five bee species were remained to participate in modeling. Finally, the distribution points of five bee species were exported as csv format and mapped with ArcGIS 10.4.1 (Esri, Redlands, California) to visualize spatial coverage (Figure 1). This map identified areas that were better surveyed, guiding possible caveats in our models and highlighting the interpretation of results.
2.2 Environmental variables
Environmental variables directly affect habitat suitability and are central to forecasting climate responses of species (Hirzel and Lay, 2008; Gogol-Prokurat, 2011). Twenty environmental data were selected to predict habitat suitability of five bee species, including 19 bioclimatic variables and altitude variable (see Table 1). The historical bioclimatic variables were downloaded from the WorldClim database (http://www.worldclim.org) with a resolution of 30′′, which were raster data generated by the kriging interpolation method based on the observation data of meteorological stations worldwide from 1970 to 2000 (Fick and Hijmans, 2017; Poggio et al., 2018). The altitude raster with 30 arc seconds was downloaded from the Geospatial Data Cloud (http://www.gscloud.cn/). Future projections were generated for 2050 and 2070 using created nine combinations of three greenhouse gas concentration scenario (RCP 4.5, 6.0 and RCP 8.5) and three Global Climate Models (GCMs: CCSM4, HadGEM2-AO, and MIROC-ESM-CHEM) (Gao et al., 2013; Martínez-López et al., 2021). RCPs is the abbreviation of representative concentration pathways (Drouet et al., 2015; Gebre, 2015). According to the Fifth Assessment Report (AR5) released by Intergovernmental Panel on Climate Change (IPCC), RCP4.5 and RCP 6.0 represent two intermediate greenhouse emission scenarios and RCP8.5 represents the highest emission scenario (Drouet et al., 2015; Martínez-López et al., 2021). The different climate change projections represented by the RCPs take full account of future atmospheric greenhouse gas concentrations, policy factors, and land use change (Meinshausen et al., 2011). For each RCP scenario, different GCMs present different aspects of future climate change because they consider different parameters (Ahn et al., 2021). It is accepted that these models are similar in variables used to develop them, but the models also differ in processes and inflows (Zhang et al., 2016). For example, HADGEM2-AO was established and developed mainly considering troposphere and aerosols, while MIROC-ESM-CHEM was developed based on nutrients from phytoplankton and zooplankton in the ocean (Collins et al., 2011; Gent et al., 2011; Watanabe et al., 2011; Baek et al., 2013). Based on this, the specificity of each model and the differences between models were captured and extended to predict the species distribution under different climatic conditions. We established a uniform standard framework to select the environmental variables used to model the potential distribution of each species. First, twenty environmental variables were selected for each honeybee species to build the model. Secondly, the multicollinearity of variables will lead to over-fitting of the model and reduce the accuracy of prediction results, so Pearson correlation coefficient method was used to calculate the correlation of the paired variables (Padalia et al., 2014; Tang et al., 2019). If the correlation coefficient of two variables is greater than 0.8, it means that the two variables can be substituted for each other (Wang et al., 2010; Khanum et al., 2013). On the basis of fully considering the ecological significance of variables, the less ecologically informative member should be removed (Li et al., 2020). Third, to determine which variables to retain in the final model, we prioritized the variable contributions obtained by the model under default parameters and the studies related to the survival and niche of honey bee species (Tang et al., 2021b).
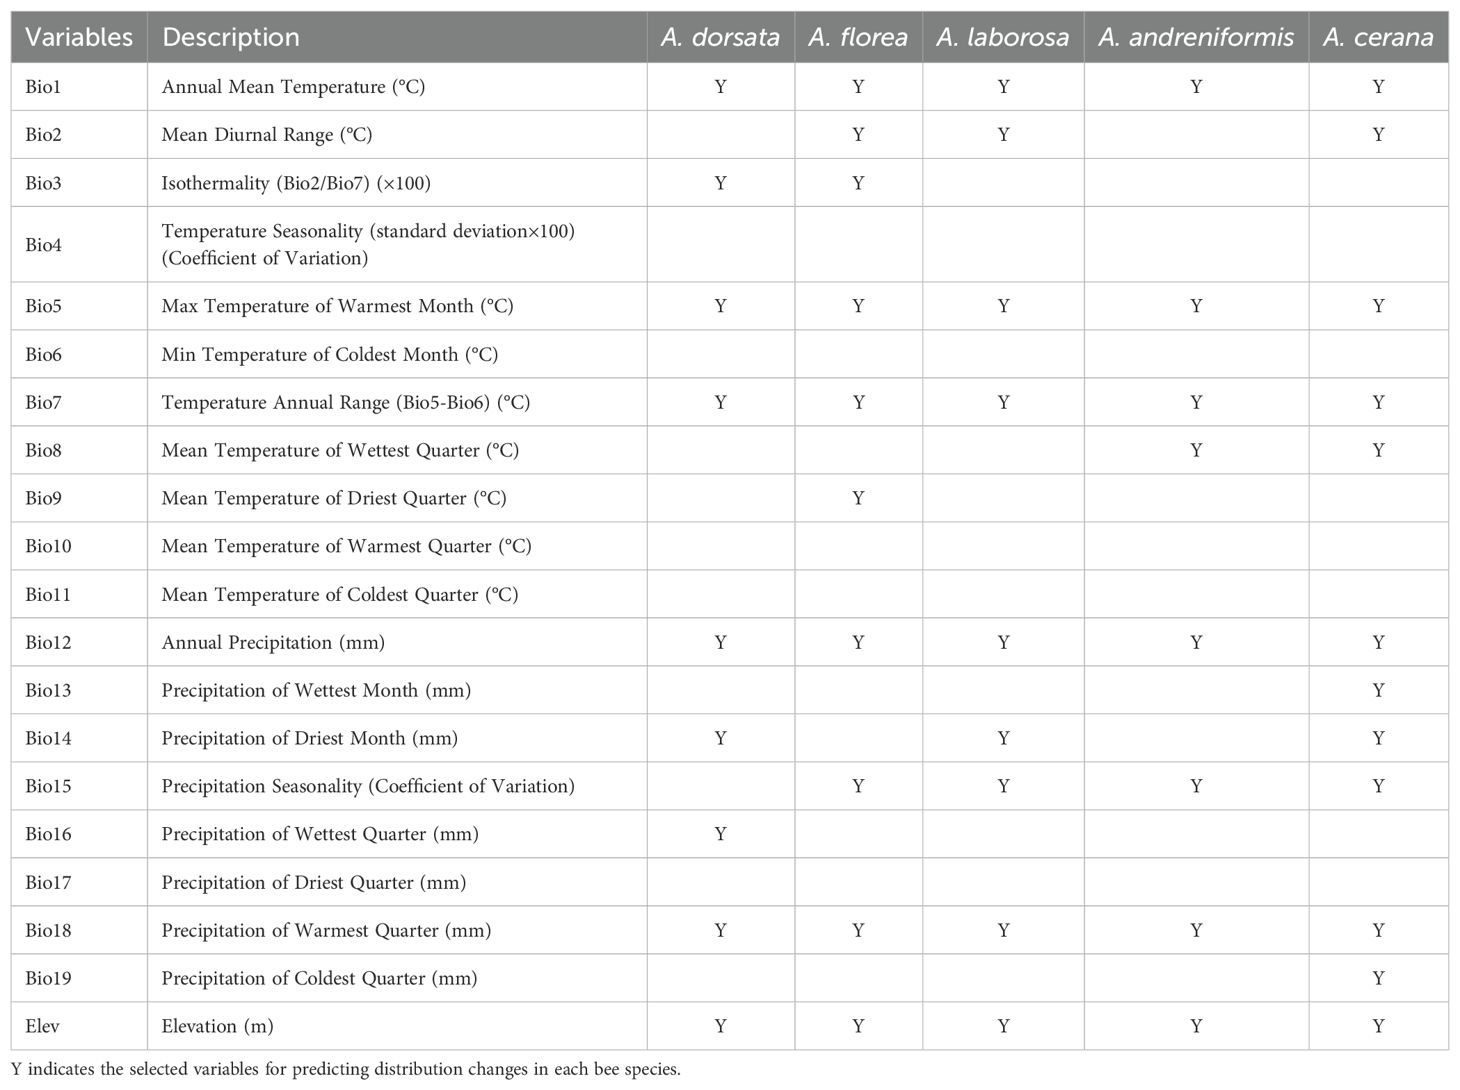
Table 1. Bioclimatic variables in this study.
2.3 ENM processing
2.3.1 Biotic and abiotic framework
We estimated the current and future distribution of each bee species using an ENM method established based on abiotic environmental conditions (A) and selected study area (M) (Martínez-López et al., 2021). Abiotic environmental conditions were determined according to the uniform standard framework, and the variables selected for each honeybee species are shown in Table 1. The study-area boundaries were further refined using known species distribution and expert knowledge (Soberón and Peterson, 2005). The chosen RCPs and GCMs at different time periods provide the possibility to show range dynamics of each bee species within the study domain.
2.3.2 ENM construction and optimization
We used MaxEnt, a Java-based algorithm founded on maximum entropy theory, to construct ENMs (Phillips et al., 2006, 2017). As a machine learning algorithm, MaxEnt is often used to predict species suitable distributions from occurrence records and bioclimatic variables and assess the potential habitat distribution (Yi et al., 2016). To maximize predictive performance and determine the optimal parameter settings for each model, we use R to optimize the Feature combination (FC) and regularization multiplier (RM) (Morales et al., 2017). Feature combination (FC) makes MaxEnt model use complex mathematical relationships to predict the response of bee species distribution to bioclimatic factors. Regularization multiplier (RM) as a model constraint can optimize the response curve of the model. These two parameters are very important for the prediction results of the model, and they are determined by calling the ENMeval packet in the R software (Muscarella et al., 2014). The model includes five features: L, Q, H, P and T, which represent linear, quadratic, hinge, product, and threshold, respectively. In order to determine the best combination of FC and RM, RM was varied from 0.5 to 4 (increments 0.5), and the characteristic combinations are L, LQ, H, LQH, LQHP, LQHPT (Velasco and González-Salazar, 2019). ENMeval packet evaluated all 48 parameter combinations. The Akaike Information Criteria (AICc) reflects the fit and complexity of the model, and the model with the smallest AICc value should be given priority (Romero-Alvarez et al., 2017). The maximum sensitivity plus specificity (MSS) and 10 percentile training presence (10 P) are used to evaluate overfitting, and the AUC value is used to evaluate the accuracy of the model (Ling et al., 2003; Radosavljevic and Anderson, 2014).
2.3.3 ENM parameter setting and evaluation
MaxEnt is used to predict species suitable distributions based on species occurrences and associated bioclimatic variables (Phillips and Dudík, 2008; Phillips et al., 2017). Final ENMs constructed by MaxEnt algorithm were built under identical protocols for all species. Occurrence points for each bee species, together with corresponding bioclimatic variables, were imported into the ENM model, and then occurrence points were randomly apportioned into training set (75%) and the test set (25%) to calibrate the model and evaluate predictive accuracy (Sobek-Swant et al., 2012; Tang et al., 2021b). The maximum number of iterations was set to 500, and 20 cross-validation replicates were generated for each species. The method that maximizes the sum of sensitivity and specificity was adopted to determine the classification threshold of potential suitable areas (Freeman and Moisen, 2008). Meanwhile, the normal distribution theory and expert experience method have also been fully used for reference and consideration (Bowler, 2014; Merow et al., 2016). We use ArcGIS 10.4.1 software to reclassify the predicted suitable habitats for each species. P≥0.75 is a highly suitable area, 0.55≤P<0.75 is a moderately suitable area, 0.25≤P<0.55 is a low suitable area, and P<0.25 is a unsuitable area. The areas under the receiver operating characteristic curves is a widely used standard for evaluating species distribution models (Wang et al., 2007). AUC ranges from 0 to 1, with higher values indicating greater model accuracy (Townsend Peterson et al., 2007). Although AUC remains the dominant metric for evaluating ecological niche models, it can yield misleading assessments and should be interpreted with circumspection (Lobo et al., 2008). Therefore, we also performed partial AUC analysis in NicheA, and partial-AUC values >1 indicates better model performance (Costa et al., 2010).
2.4 Prediction results analysis
From the ENM projections under current climate scenario, we quantified the contribution rate of each environmental variable involved in the modeling (Tang et al., 2021a). Based on ENM projections, we further analyzed the prediction results for 2050 and 2070 under different RCP conditions. We first quantified the suitable habitat for the five honey bee species. Following reclassification, only pixels scored as highly or moderately suitable were retained for subsequent area calculations. We quantified the distribution difference between present and projected future distributions to estimate climate-driven habitat losses for each honey bee species in 2050 and 2070 (Martínez-López et al., 2021). In addition, it is assumed that the presence of at least one honeybee species within a given area will basically guarantee the local agricultural and forestry production (Tscharntke et al., 2005; Ssymank et al., 2008). Consequently, we considered the five bee species as a whole in order to determine the distribution of pollinators in the study area. We overlapped the suitable distribution of the five species under same RCP and model at same time periods, and consider high, moderate and low suitable distribution are given decreasing priority. Any predicted site classified as highly suitable for at least one of the five bee species was designated as highly suitable area overall. Any predicted site simultaneously encompassed by highly and moderately suitable area were assigned the highest suitability class. Conversely, concordant unsuitability across all five species at a given site indicates a complete loss of honey bee services under projected climate change.
Climate warming typically drives upslope shifts in species’ altitudinal distribution (Gottfried et al., 1999; Chen et al., 2011). To account for the elevation changes under different RCP conditions, we quantified mean elevation of suitable habitat for the five bee species under each RCP for 2050 and 2070. Under different RCP at current and future, We randomly sampled 10,000 points within the suitable distribution areas of five honey bee species by GCM (Martínez-López et al., 2021). It should be noted again that the randomly sampled suitable distribution here also include only highly and moderately suitable areas. We then extracted the altitude information of the sampling points by ArcGIS 10.4.1 software (Zhou et al., 2010). Based on elevation data obtained of each species, we calculated the mean elevation of the five species in their current and future distribution areas.
We measured the direction and distance of centroid shifts for each bee species under each RCP-time combination by ArcGIS 10.4.1 (Tang et al., 2021b). Meanwhile, we estimated the geographical extent and area of the nature reserves within the study domain. To assess reserve effectiveness, we calculated the proportional overlap between nature reserves and species distribution under each climate scenario (Martínez-López et al., 2021). These results provide us with the minimum and maximum area losses of suitable distribution for bee species. To evaluate the overlap rate between nature reserves and species distribution under climate change, we considered five bee species as a whole, and therefore the suitable areas were overlapped to determine the final species distribution areas (only include highly and moderately suitable areas). The shapefiles of protected natural areas can be obtained from Protected Planet (https://www.protectedplanet.net), which has the most comprehensive information of protected natural areas for each country in the study area.
2.5 Correlation analyses and environmental suitability change
To assess the relationship between species distribution range and their ability to cope with climate change, we used Pearson correlation coefficients to analyze the relationship between the current distribution and the mean projected change in the future distribution under each climate scenario (Martínez-López et al., 2021). Additionally, we separately evaluated the environmental suitability of each bee species’ distribution records under each RCP condition (Teixeira et al., 2014). Prior to correlation analysis, we normalized current and future suitable distribution of each species using the following formula.
CSD means current suitable distribution and FSD means future suitable distribution.
where is the current suitable distribution (CSD) or future suitable distribution (FSD) of a species. is the mean of all the species’ CSD or FSD. is the standard deviation of the CSD or FSD of all species. The standardized procedure effectively avoids the influence of geographical range size on the analysis results when comparing current distribution reductions of each bee species. The resulting dimensionless value, that is the standardized CSD/FSD, was used to test the relationship between mean change of all standardized FSDs and standardized CSD (Martínez-López et al., 2021). For FSDs, we separated the correlation analysis into two time frames (2050 and 2070), and each frame encompassed nine GCM-RCP combinations. To evaluate climate-driven changes in environmental suitability, we extracted the suitability values and FSDs for every occurrence point of each bee species under each GCM-RCP combination. We then calculated the differences between CSD and FSD under climate effects, and determined the suitability changes for each species under different combinations of models and scenarios. Finally, we visualized the suitability changes for each species through box plots.
3 Result
3.1 Evaluation of the accuracy and contribution of variables
The current and future suitable distributions of the five bee species are predicted by the optimized ENM based on GCM-RCP combinations. The training and test AUC values exceeded 0.90 for all combinations of climate scenarios, and the highest AUC can reach 0.98. These values significantly exceed the random distribution and have little difference, indicating that the prediction results have high quality performance. Partial AUC analysis also supports this conclusion. With the maximum sensitivity plus specificity, 95.2% of species distribution points can be accurately predicted, and 91.4% of species unsampled or non-distributed areas can be accurately predicted. With the 10 percentile training presence, 93.4% of species distribution points can be accurately predicted, and 89.6% of species unsampled or non-distributed areas can be accurately predicted.
Across all bee species, Bio1, Bio5, Bio7, Bio12, Bio18 and elevation consistently explained the predicted current distribution (Table 2). Bio1, Bio12 and elevation emerged as the primary determinants of suitability across all bee species, with the cumulative contribution of the three variables reaching a maximum to 54.9% for A. andreniformis and a minimum to 43.8% for A. cerana.
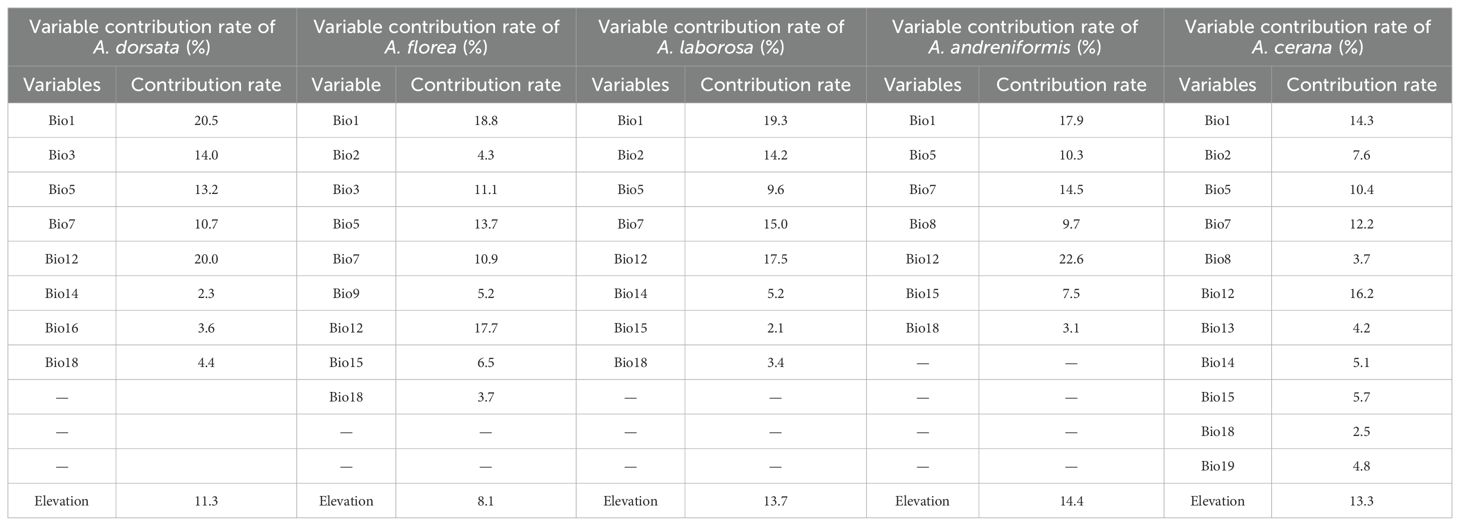
Table 2. Contribution rate of variables to current distribution prediction.
3.2 Sampling effort, current and future suitable distribution
Occurrence records for the five honey bee species involved in the modeling exhibit marked spatial heterogeneity across the study region (Figure 1). Occurrence records are markedly clustered on the Korean Peninsula, China’s eastern seaboard, China-Indochina Peninsula and Malay Peninsula, indicating that the above areas were well surveyed. Conversely, the number and density of occurrence records decreased across much of the Malay Archipelago.
The distribution ranges of the five bee species are first considered as a whole. By 2050, the highly suitable distributions of the pollinator are projected to concentrate in the Yangtze River basin in China, all of Japan except Hokkaido, the western side of the Western Ghats, the southern edge of the Qinghai-Tibet Plateau, the Irrawaddy River basin, the northeastern plateau of Thailand, the Truong Son Ra region, all of Cambodia and the Philippines, and the islands of Kalimantan, Sulawesi, and Sumatra (Figure 2). The moderately suitable distributions are spread outward with the highly suitable distributions as the center. By 2070, the highly suitable distribution will expand slightly along the southern edge of the Tibetan Plateau, and the suitable habitats in other places will contract markedly (Figure 3). Notably, almost all highly suitable areas in the China-Indochina Peninsula and the Malay Archipelago will nearly vanish. Climate warming is expected to significantly contract climatically suitable habitat for pollinators across the study region, and the highly suitable habitat will show an obvious fragmented distribution.
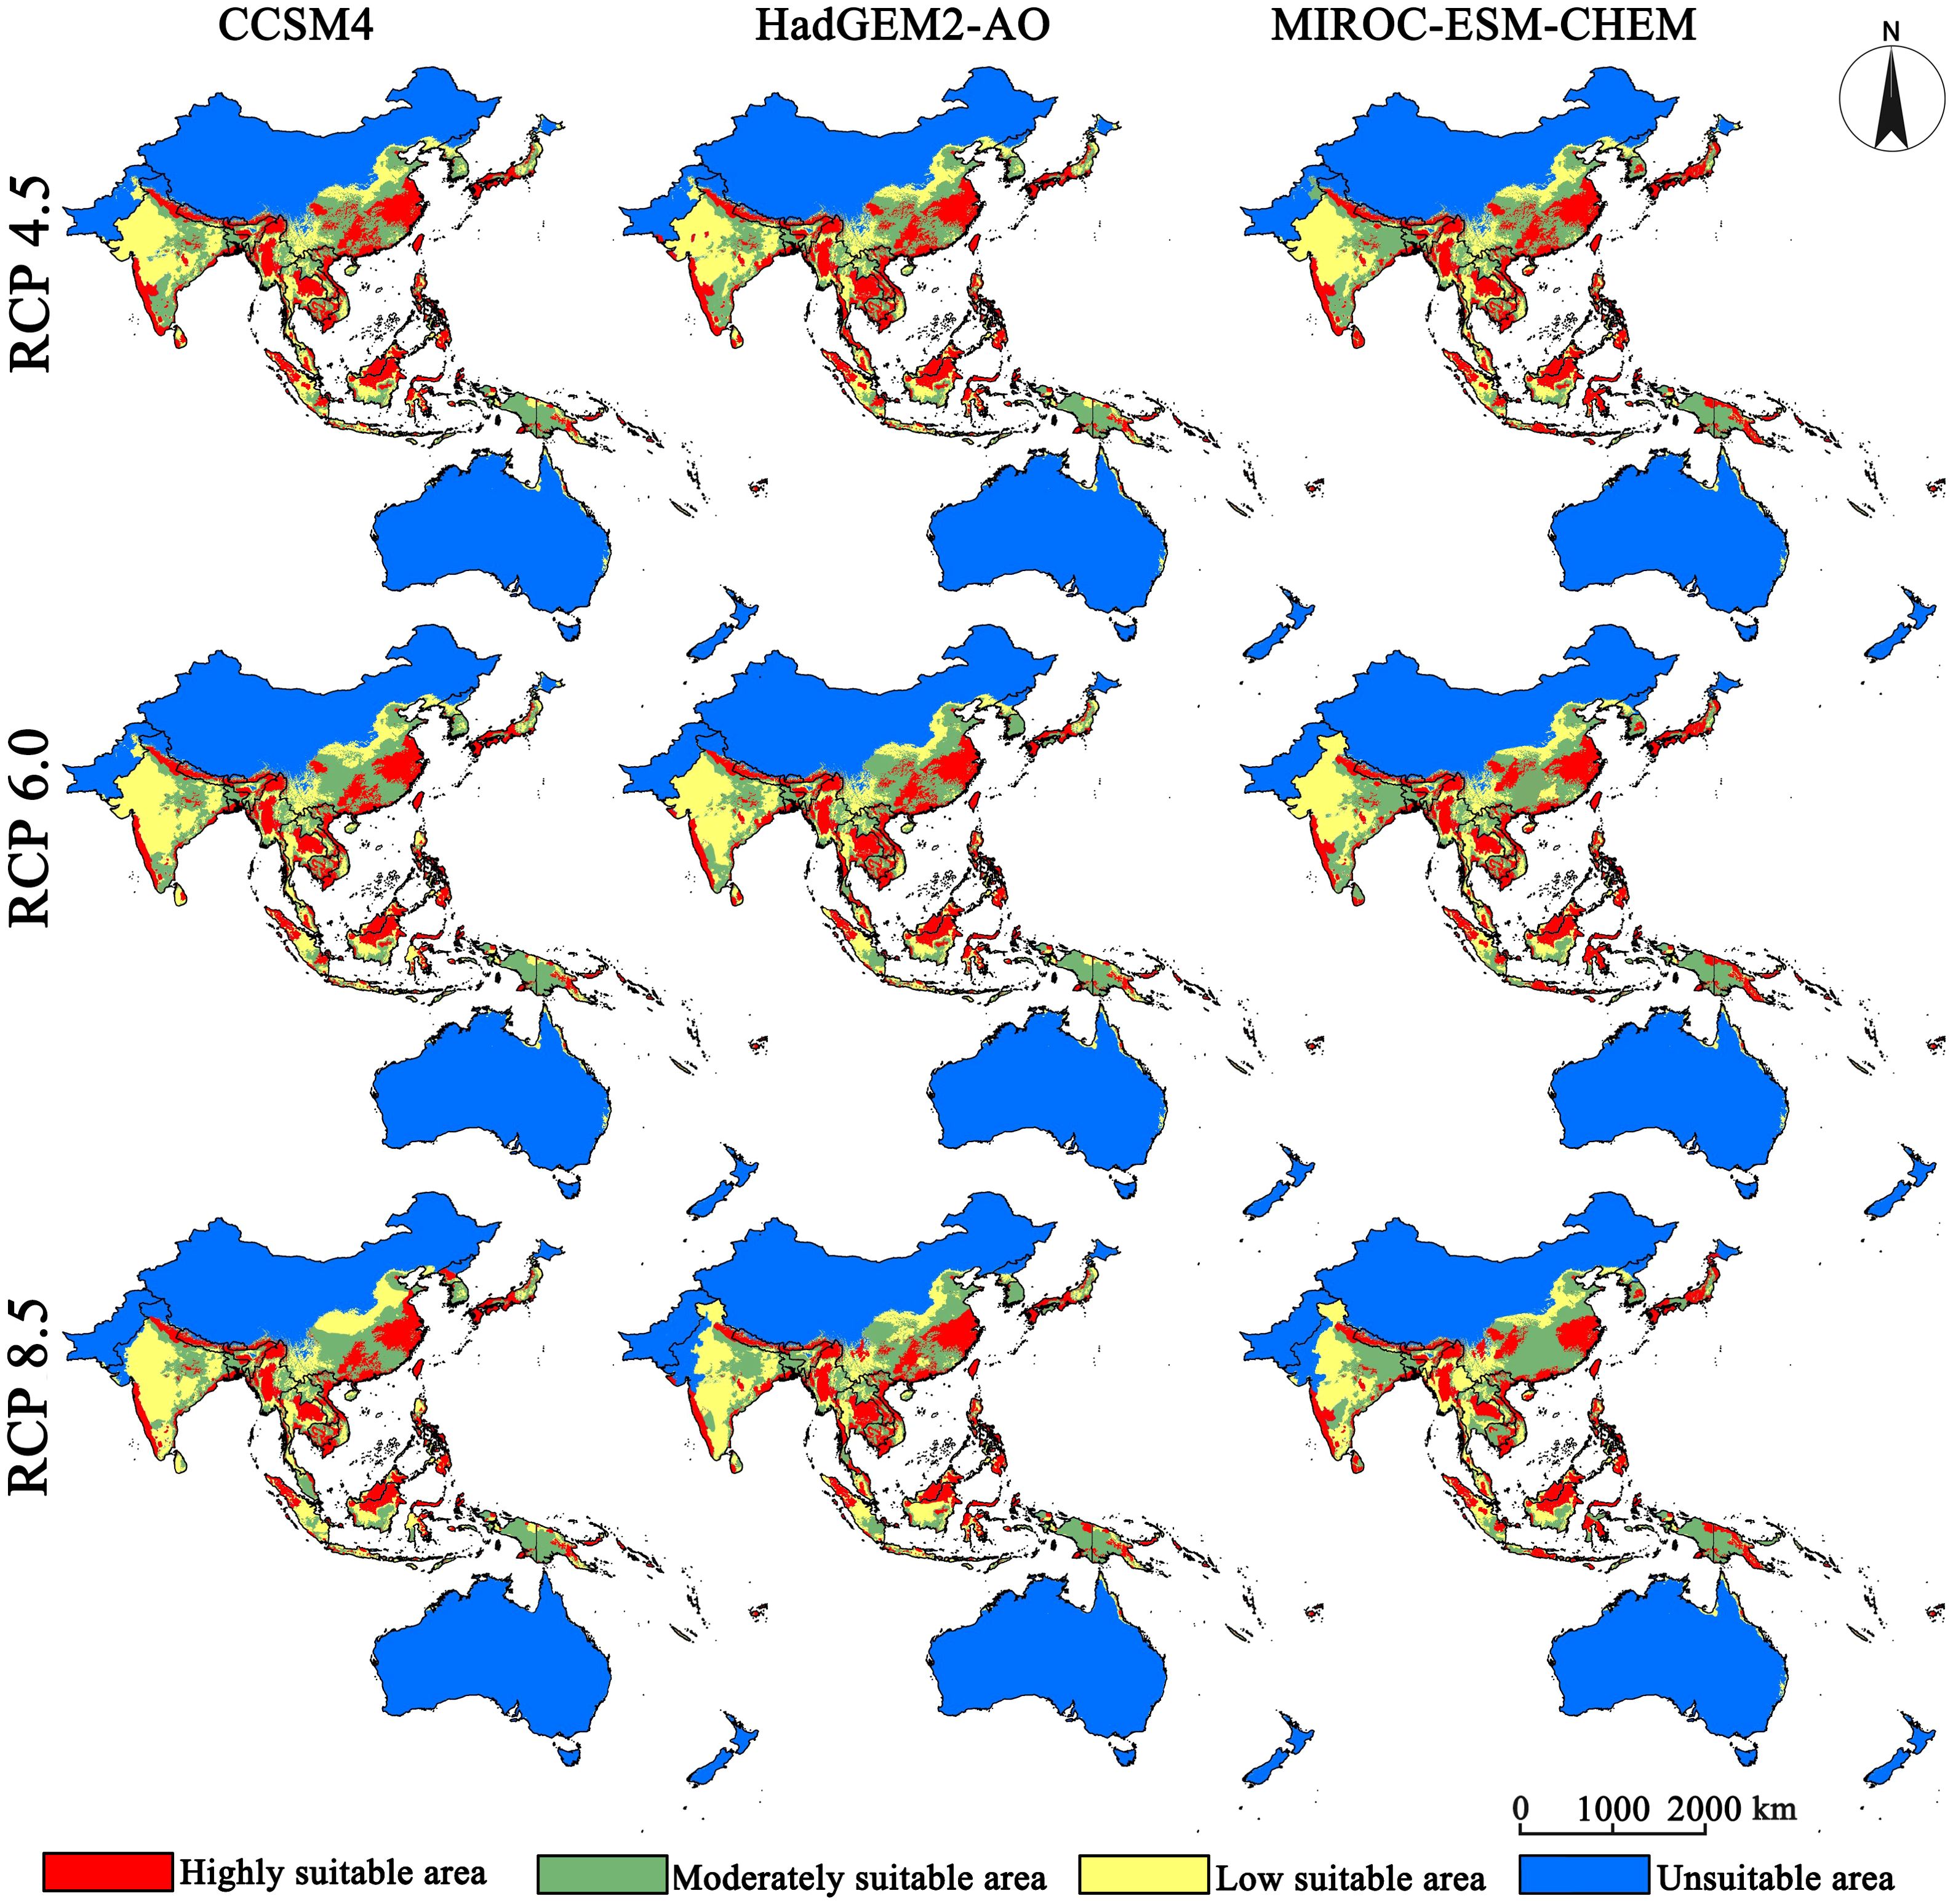
Figure 2. Projected suitable distribution for 2050 (2041–2060 average) for five bee species.
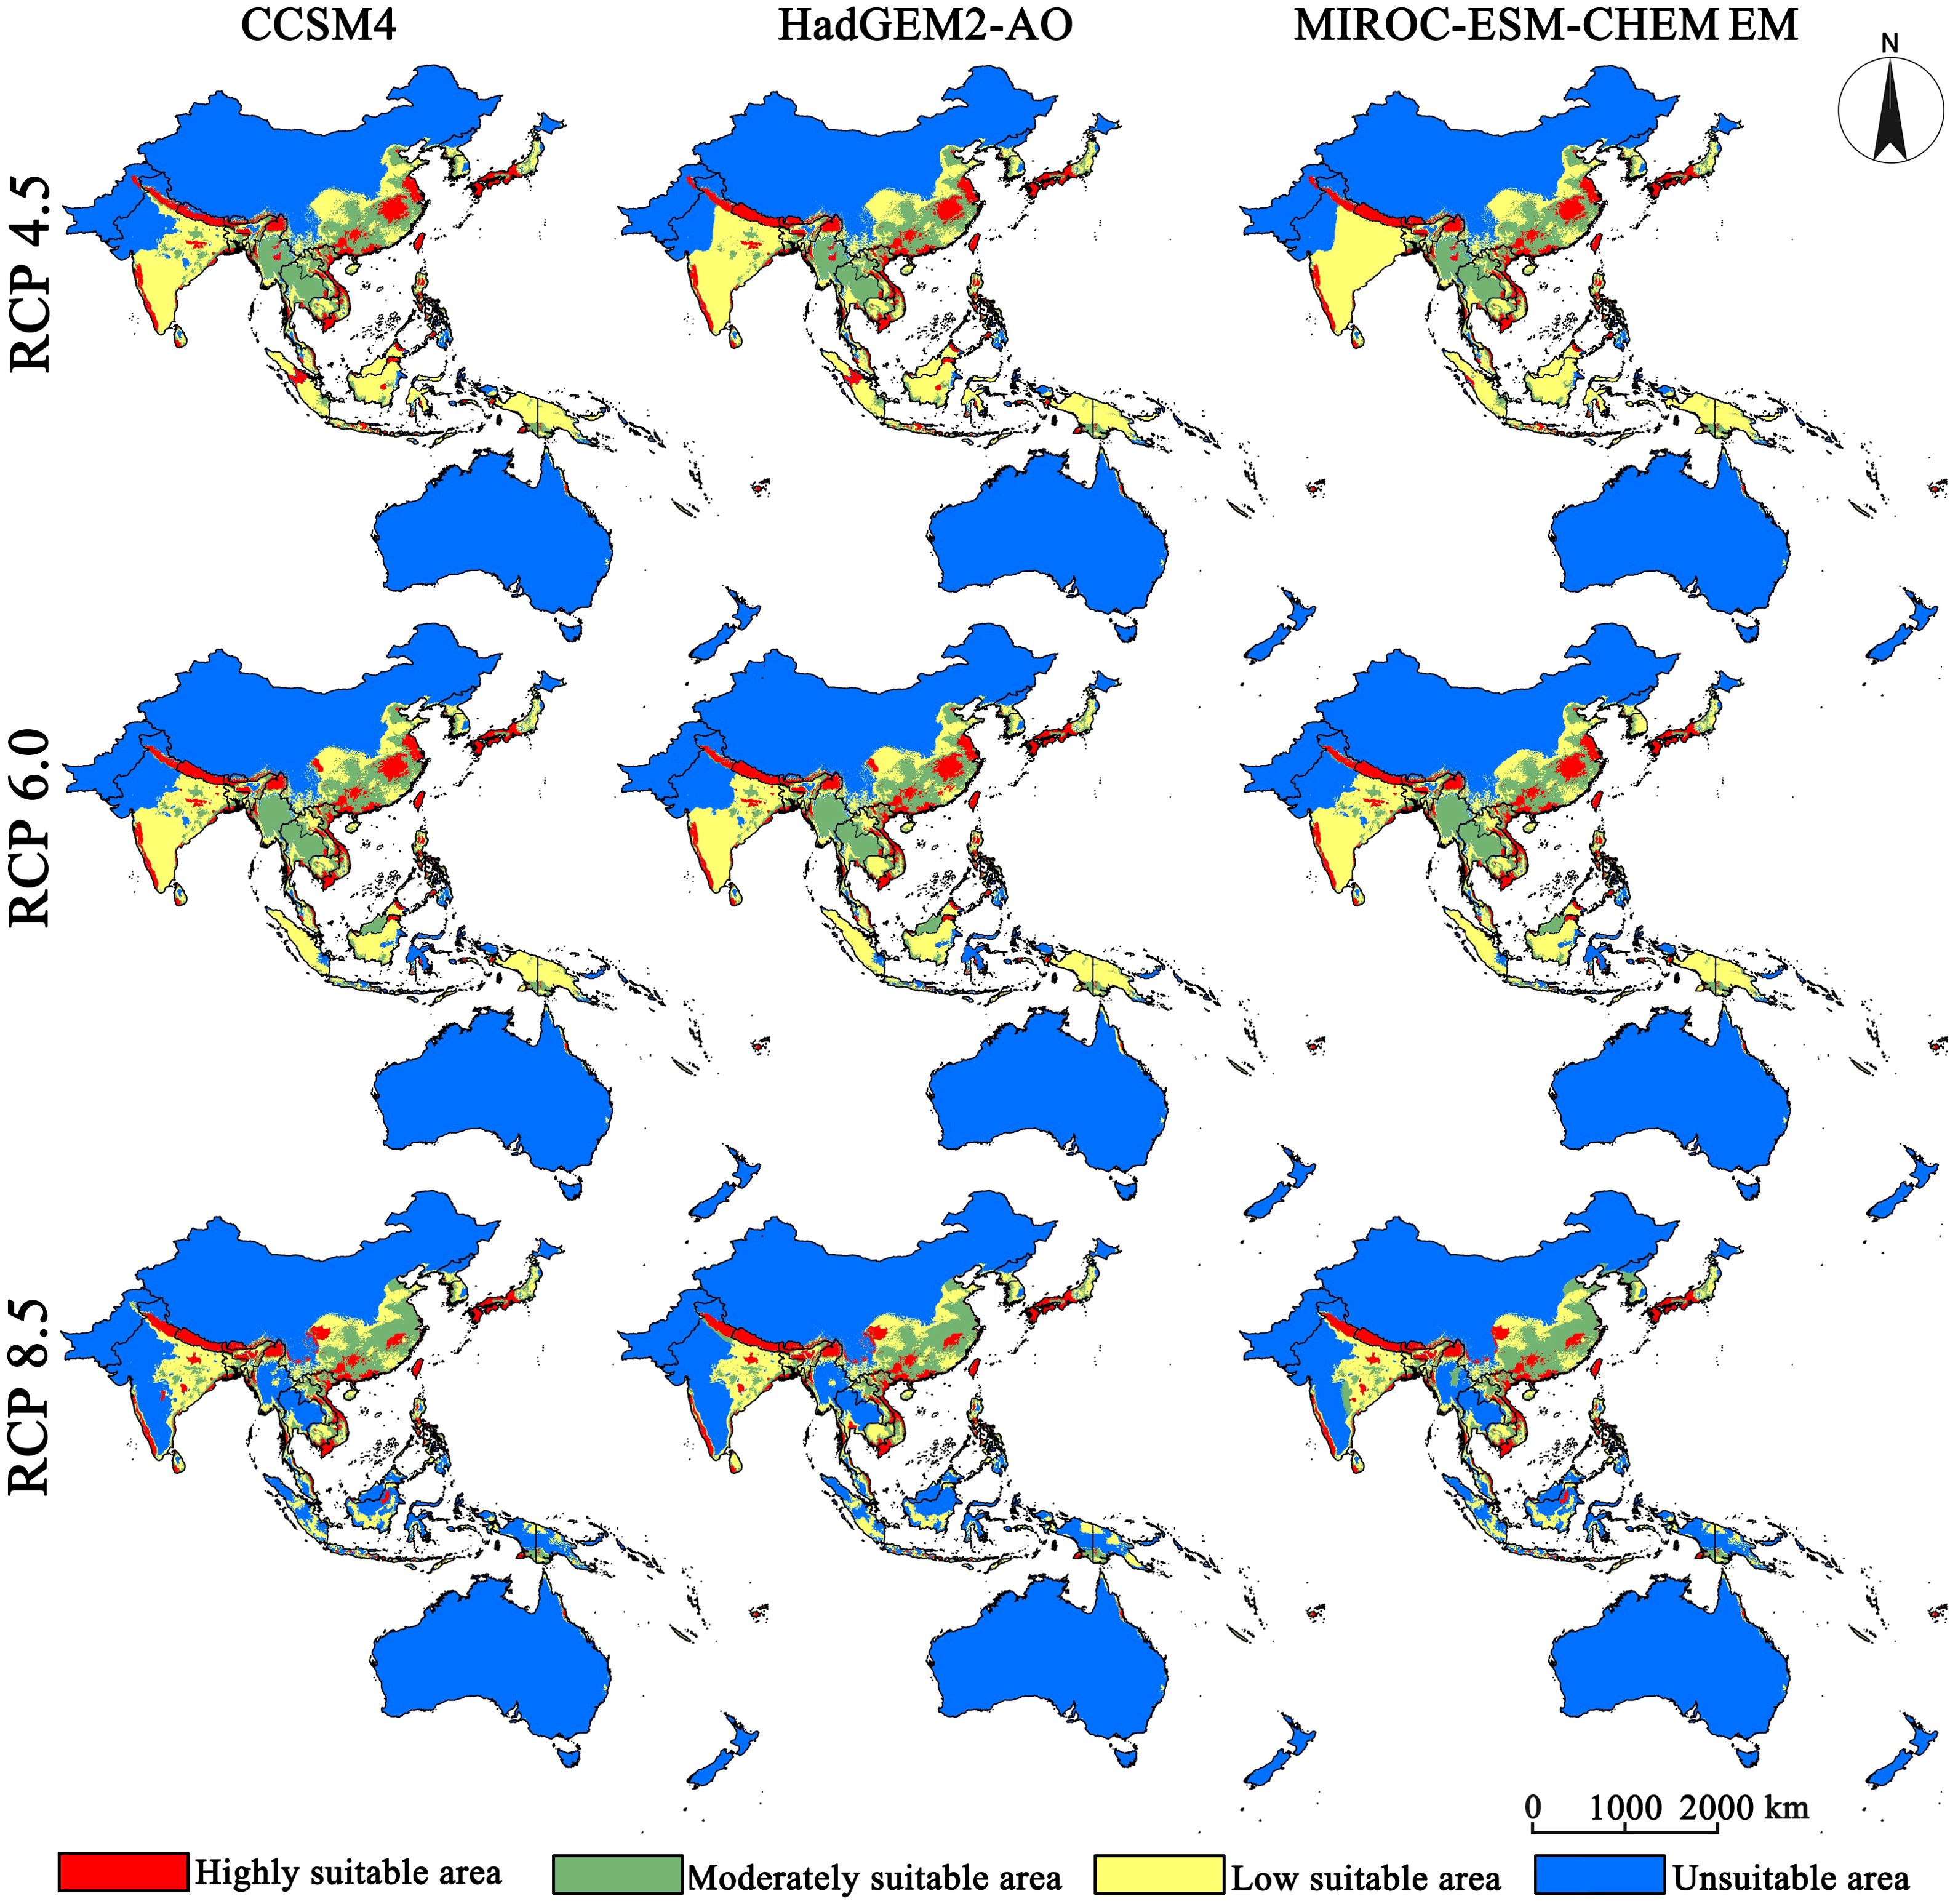
Figure 3. Projected suitable distribution for 2070 (2061–2080 average) for five bee species.
ENMs estimate that the current suitable distribution (CSD) of the five studied species range from 0.7342×10⁶ km2 (A. laborosa) to 4.3853 ×10⁶ km2 (A. cerana) (Figure 4). Based on current distribution area, expert experience and the Labougle (1990), all five species studied are common species (corresponds to rare species). By 2050, all GCM-RCP combinations indicates continued range contraction of the future suitable distribution for pollinators. The loss of honey bee species distribution ranged from 7% (A. floreafor, RCP 6.0, GCM HadGEM2-AO) to 72% (A. laborosa, RCP 8.5, GCM MIROC-ESM-CHEM) (Figure 4). By 2070, the pollinator distribution ranges are projected to contract markedly across all GCM-RCP combinations. The loss of distribution ranged from 14% (A. florea, RCP 4.5, GCM CCSM4) to 87% (A. laborosa, RCP 8.5, GCM MIROC-ESM-CHEM) (Figure 4).
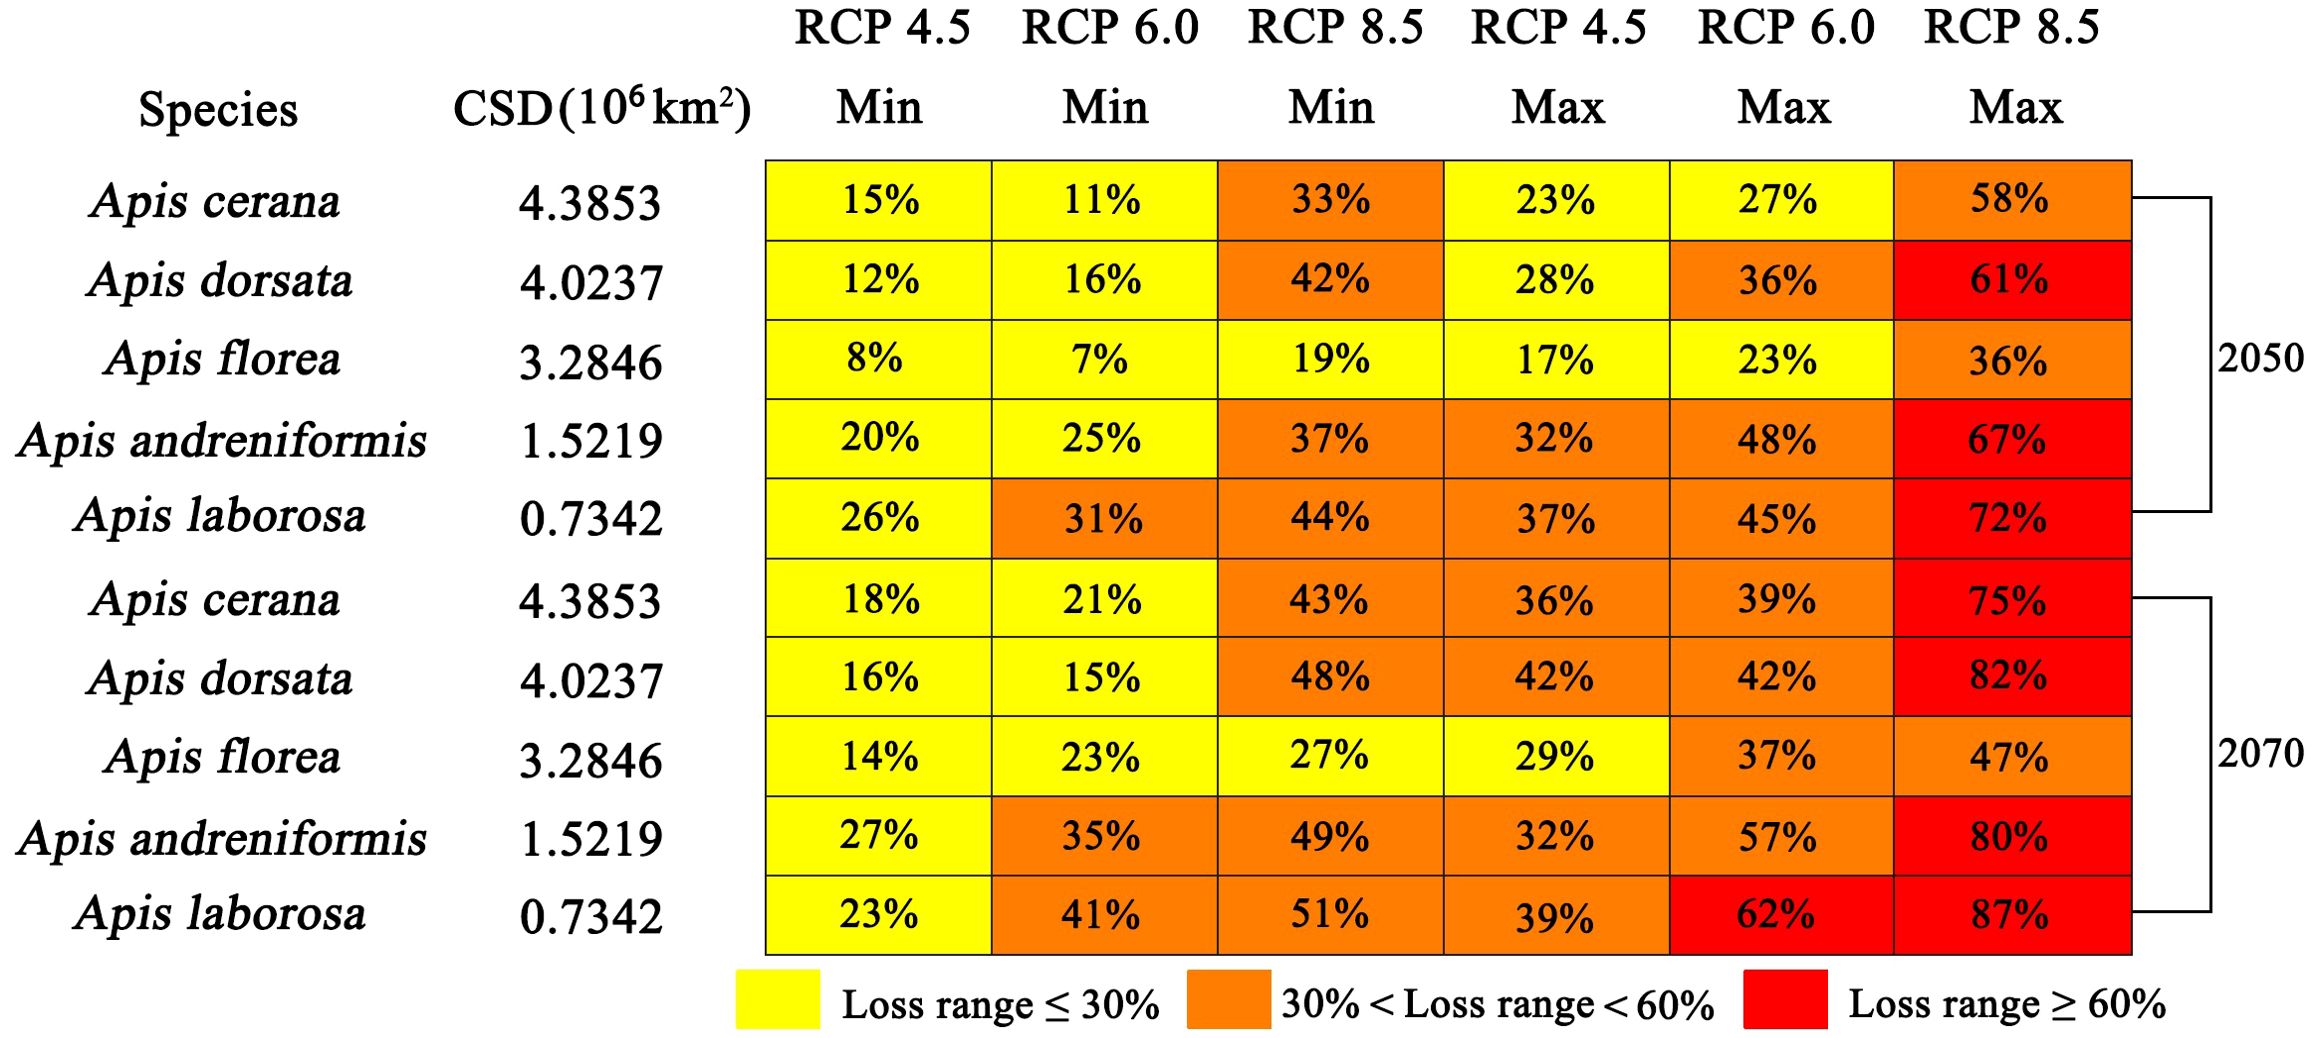
Figure 4. Range of current suitable habitat loss for five bee species in 2050 and 2070. The percentage of loss is presented as the minimum and maximum obtained across all RCPs and models.
3.3 Altitude change, geographic centroid change, and protected natural areas
Projections indicate that the median elevation of suitable habitat for all five bee species will continue to shift upslope by 2050 and 2070 (Figure 5). By 2050, mean elevation variation ranged from 35m (A. florea, RCP 4.5) to 360m (A. andreniformis, RCP 8.5) at. By 2070, the effect of climate change on the pollinators elevation change will become more pronounced. By 2070, mean elevation variation ranged from 75m (A. dorsata, RCP 4.5) to 450m (A. laborosa, RCP 8.5). As pollinator habitats shift to higher elevations, most species are projected to experience progressively greater habitat loss under RCP8.5, peaking by 2070. Meanwhile, species whose climatically suitable ranges lie at higher elevations are more significantly affected by climate change.
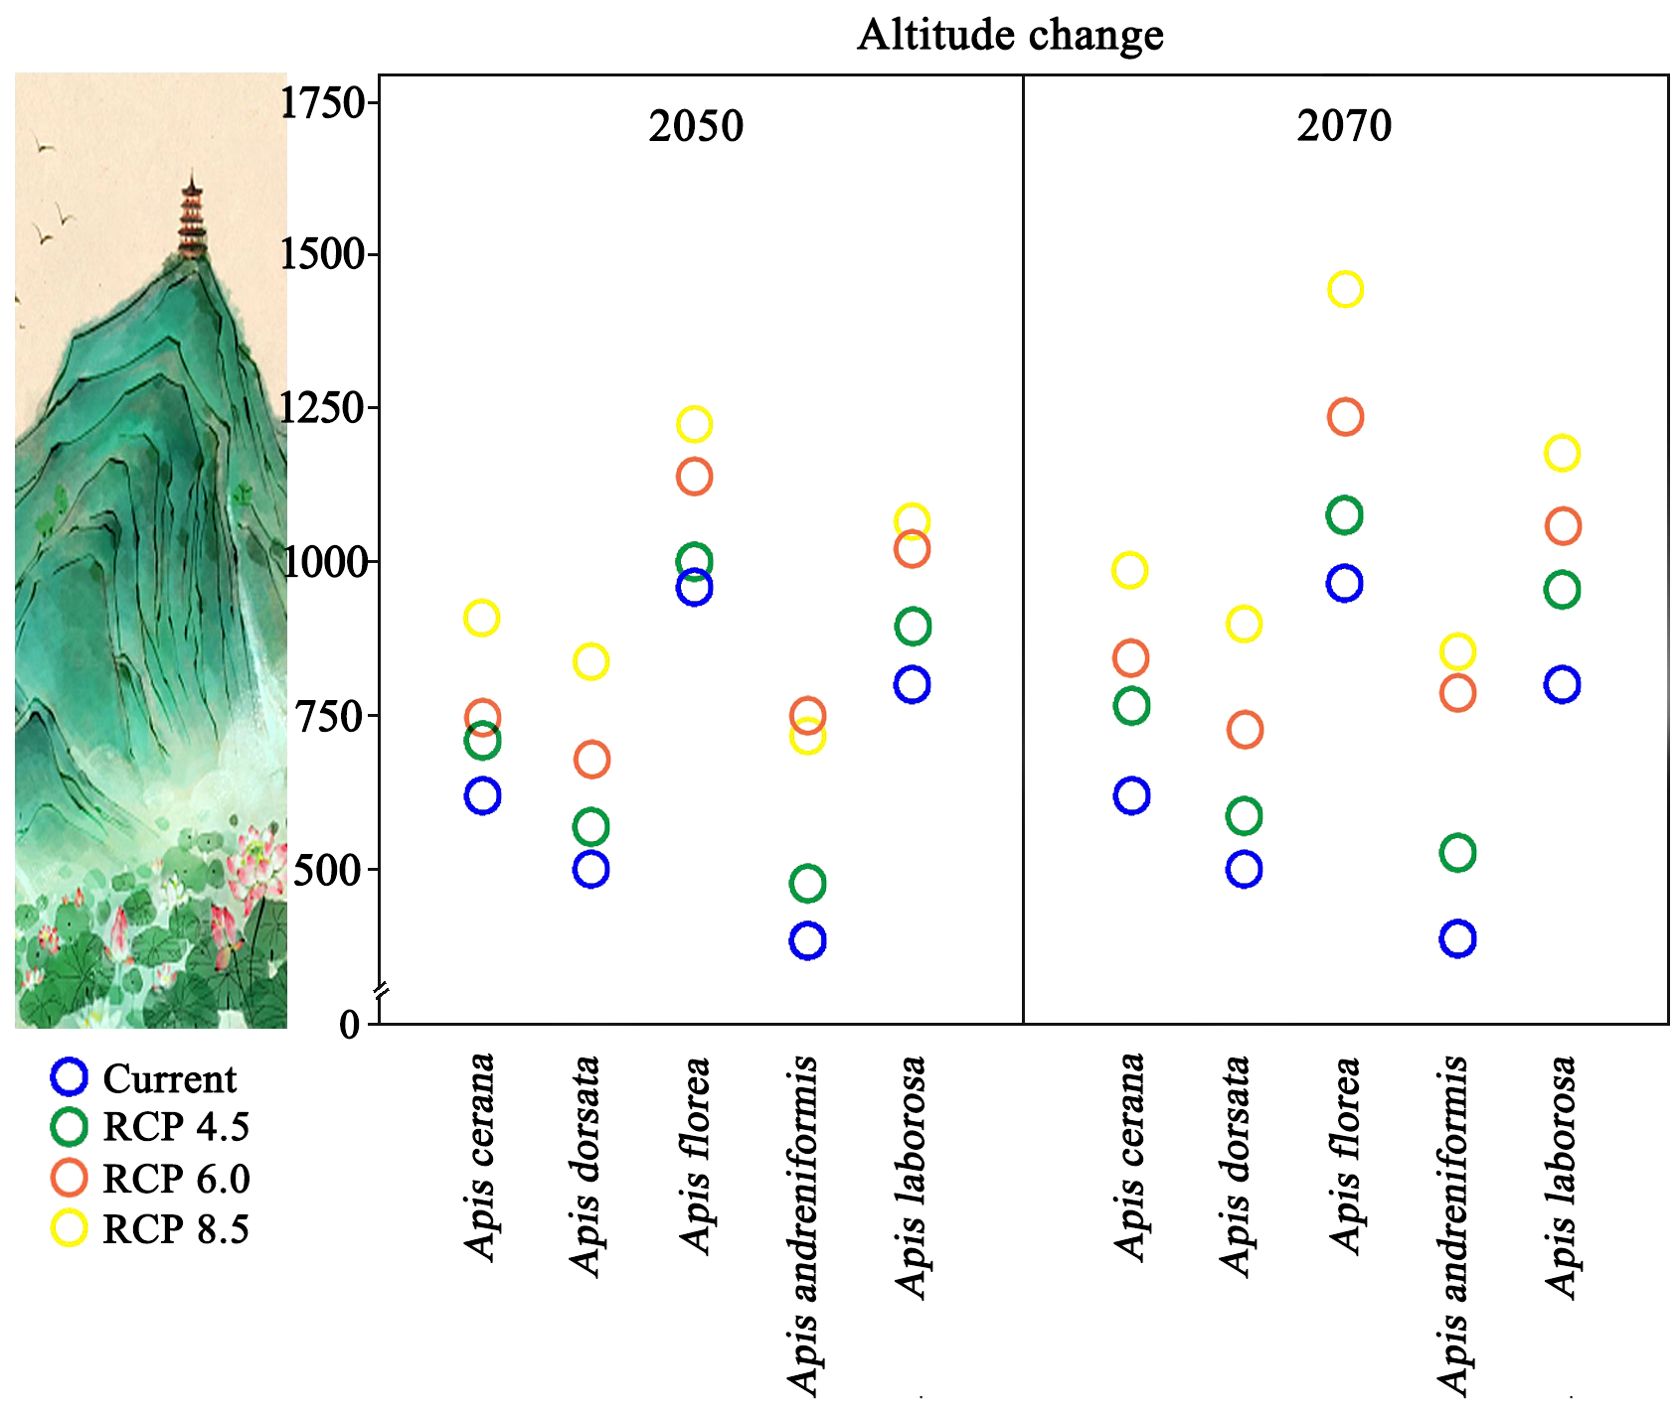
Figure 5. Altitude change from current suitable distribution (CSD) to future suitable distribution (FSD). Each circle represents the average altitude for suitable distribution.
Centroid analyses reveal that the centroid of all five bee species changed significantly under climate change, primarily in distance and direction (Figure 6). The suitable distribution of A. dorsata, A. laborosa, A. andreniformis and A. cerana will shift southeastward by 2050 and to continue in the same direction by 2070. Conversely, A. florea exhibits a north-eastward displacement. Across all species, the geographic centroids of suitable ranges are projected to shift 65–137 km by 2050 and 2070. Overall, RCP8.5 scenario exerts the strongest influence on geographic-centroid shifts across all species by 2050 and 2070.
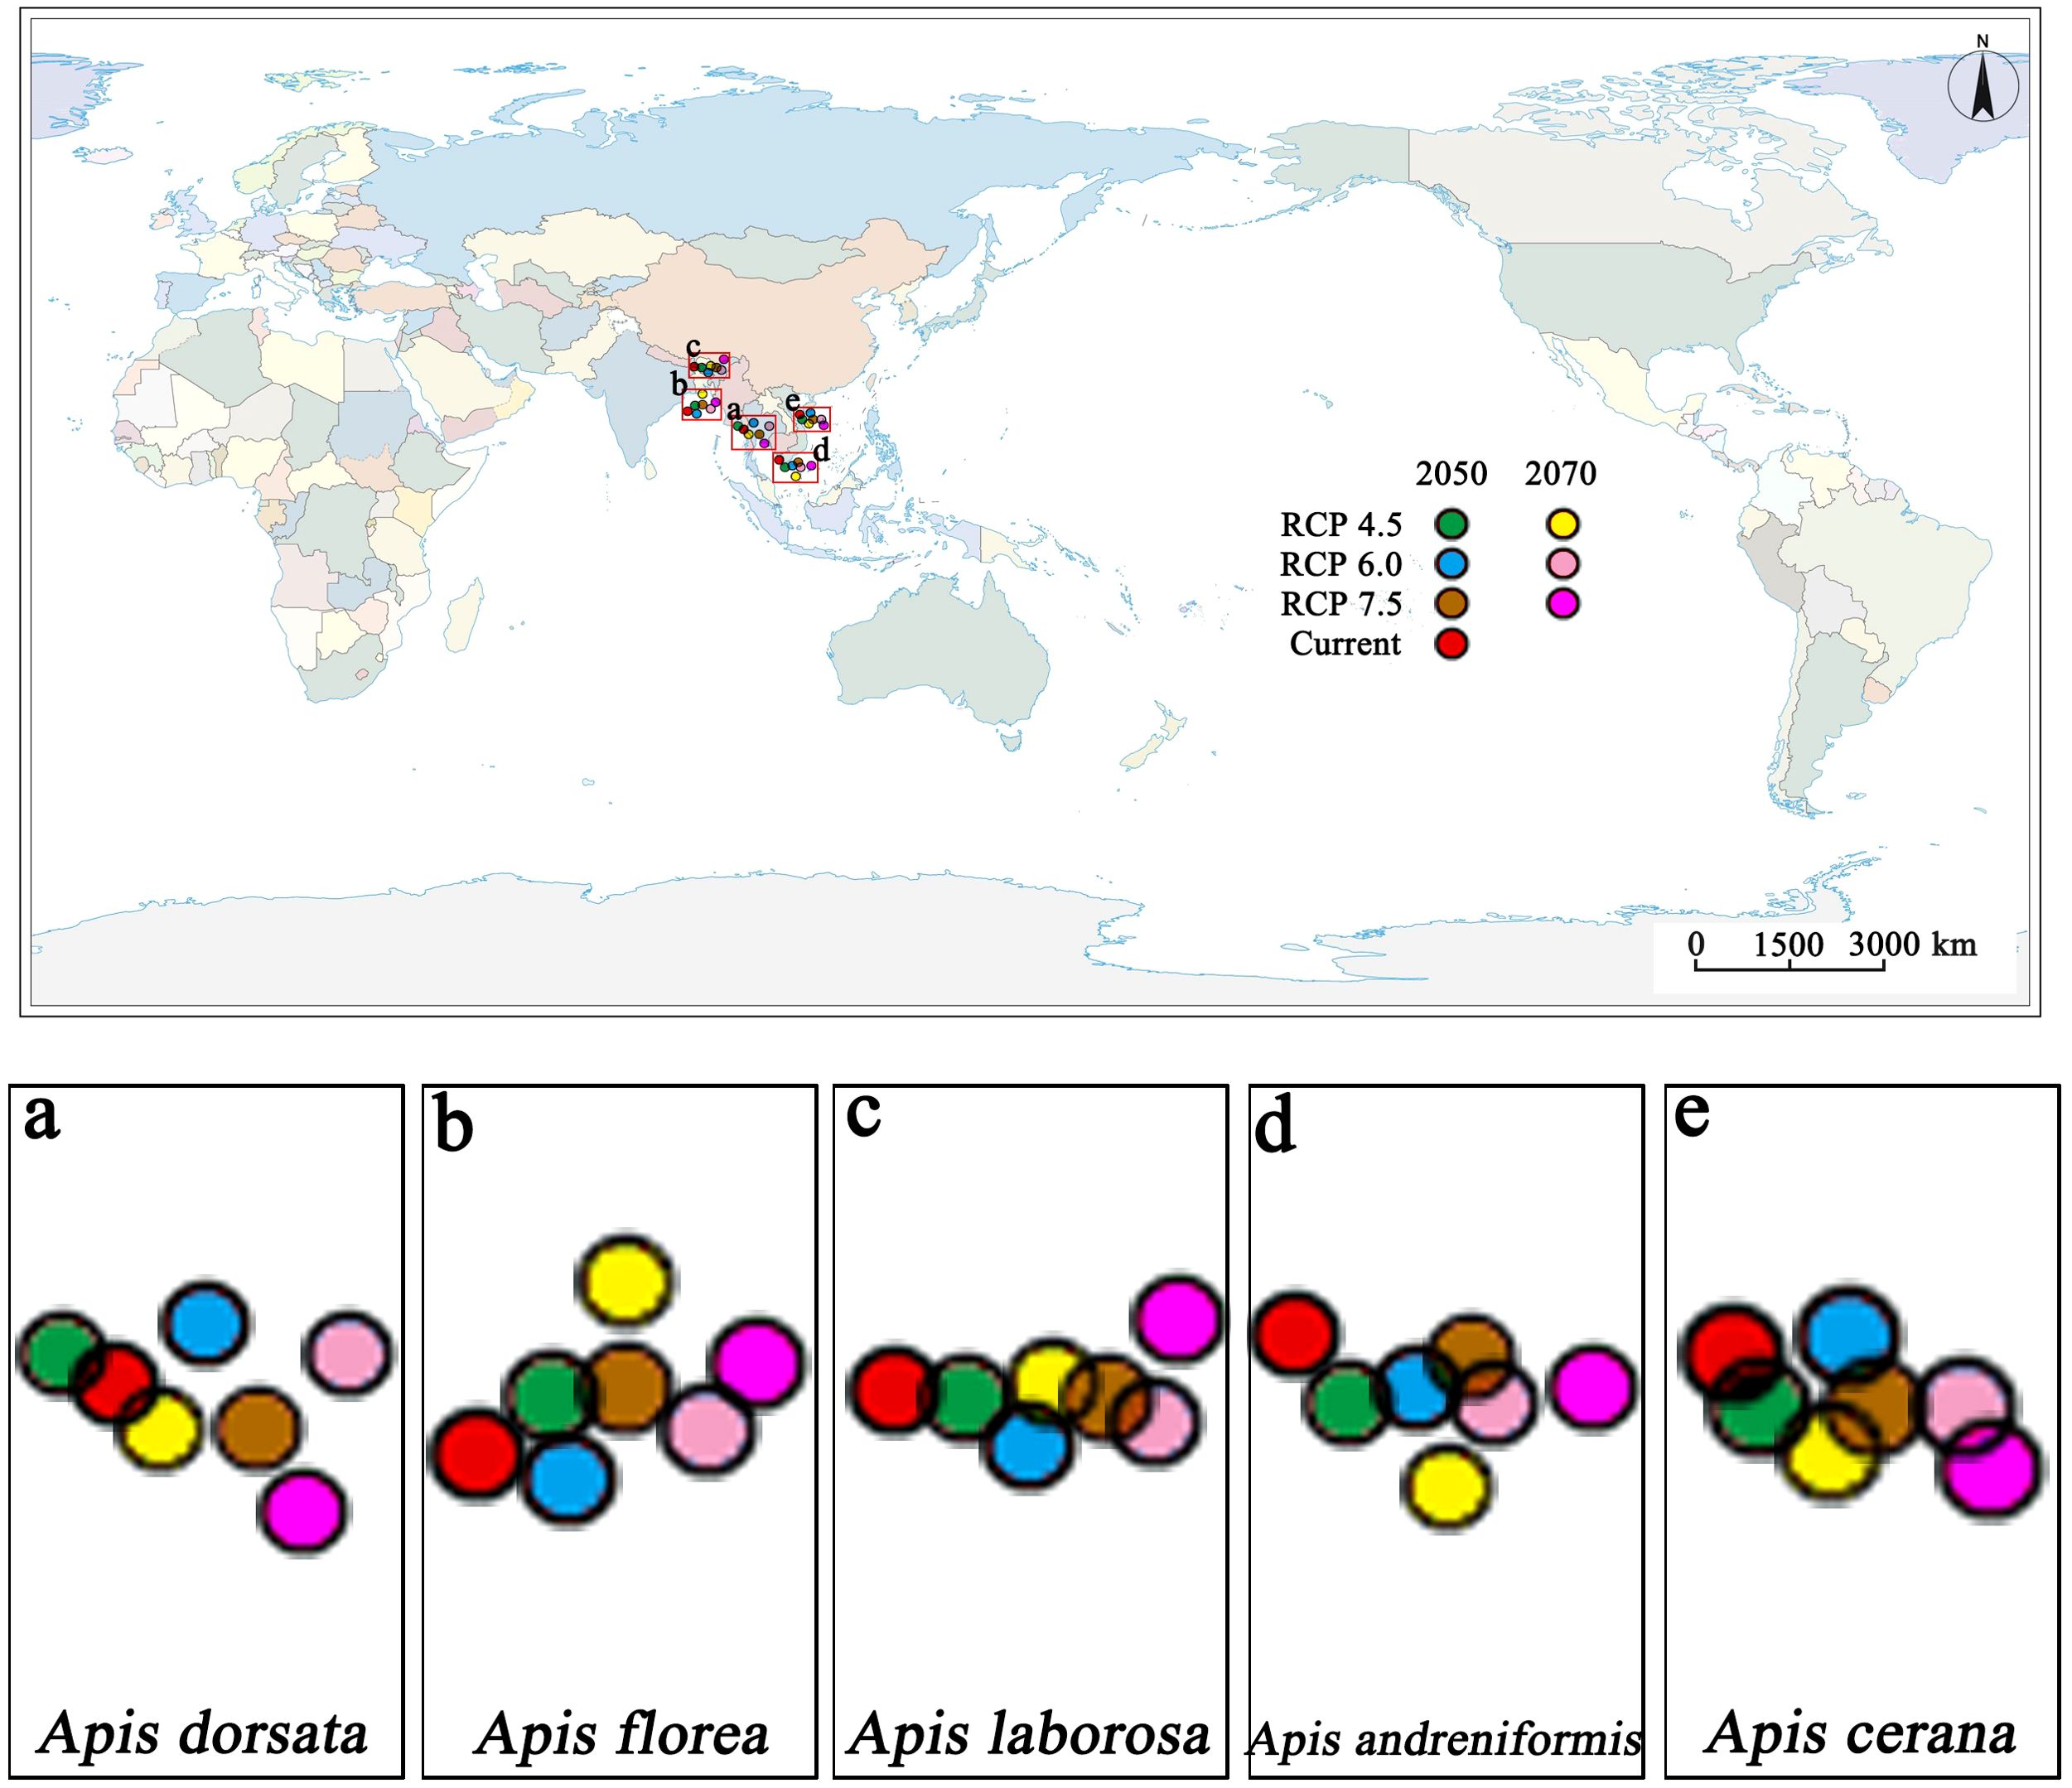
Figure 6. Centroid change analysis for five bee species in the study area. Each circle represents the centroid of suitable distribution in current and future (2050 and 2070). (a) The centroid shift of Apis dorsata. (b) The centroid shift of Apis florea. (c). The centroid shift of Apis laborosa. (d) The centroid shift of Apis andreniformis. (e) The centroid shift of Apis cerana.
We overlapped the suitable distributions of all bee species (only include highly and moderately suitable areas) into one whole. Currently, 17% of the total suitable habitat falls within protected natural areas (Figure 7). By 2050, as habitat contracts, 20% (range 18%-22%) of the remaining suitable area is protected by the nature reserve. By 2070, this proportion rises modestly only 28% (range 24%-32%).
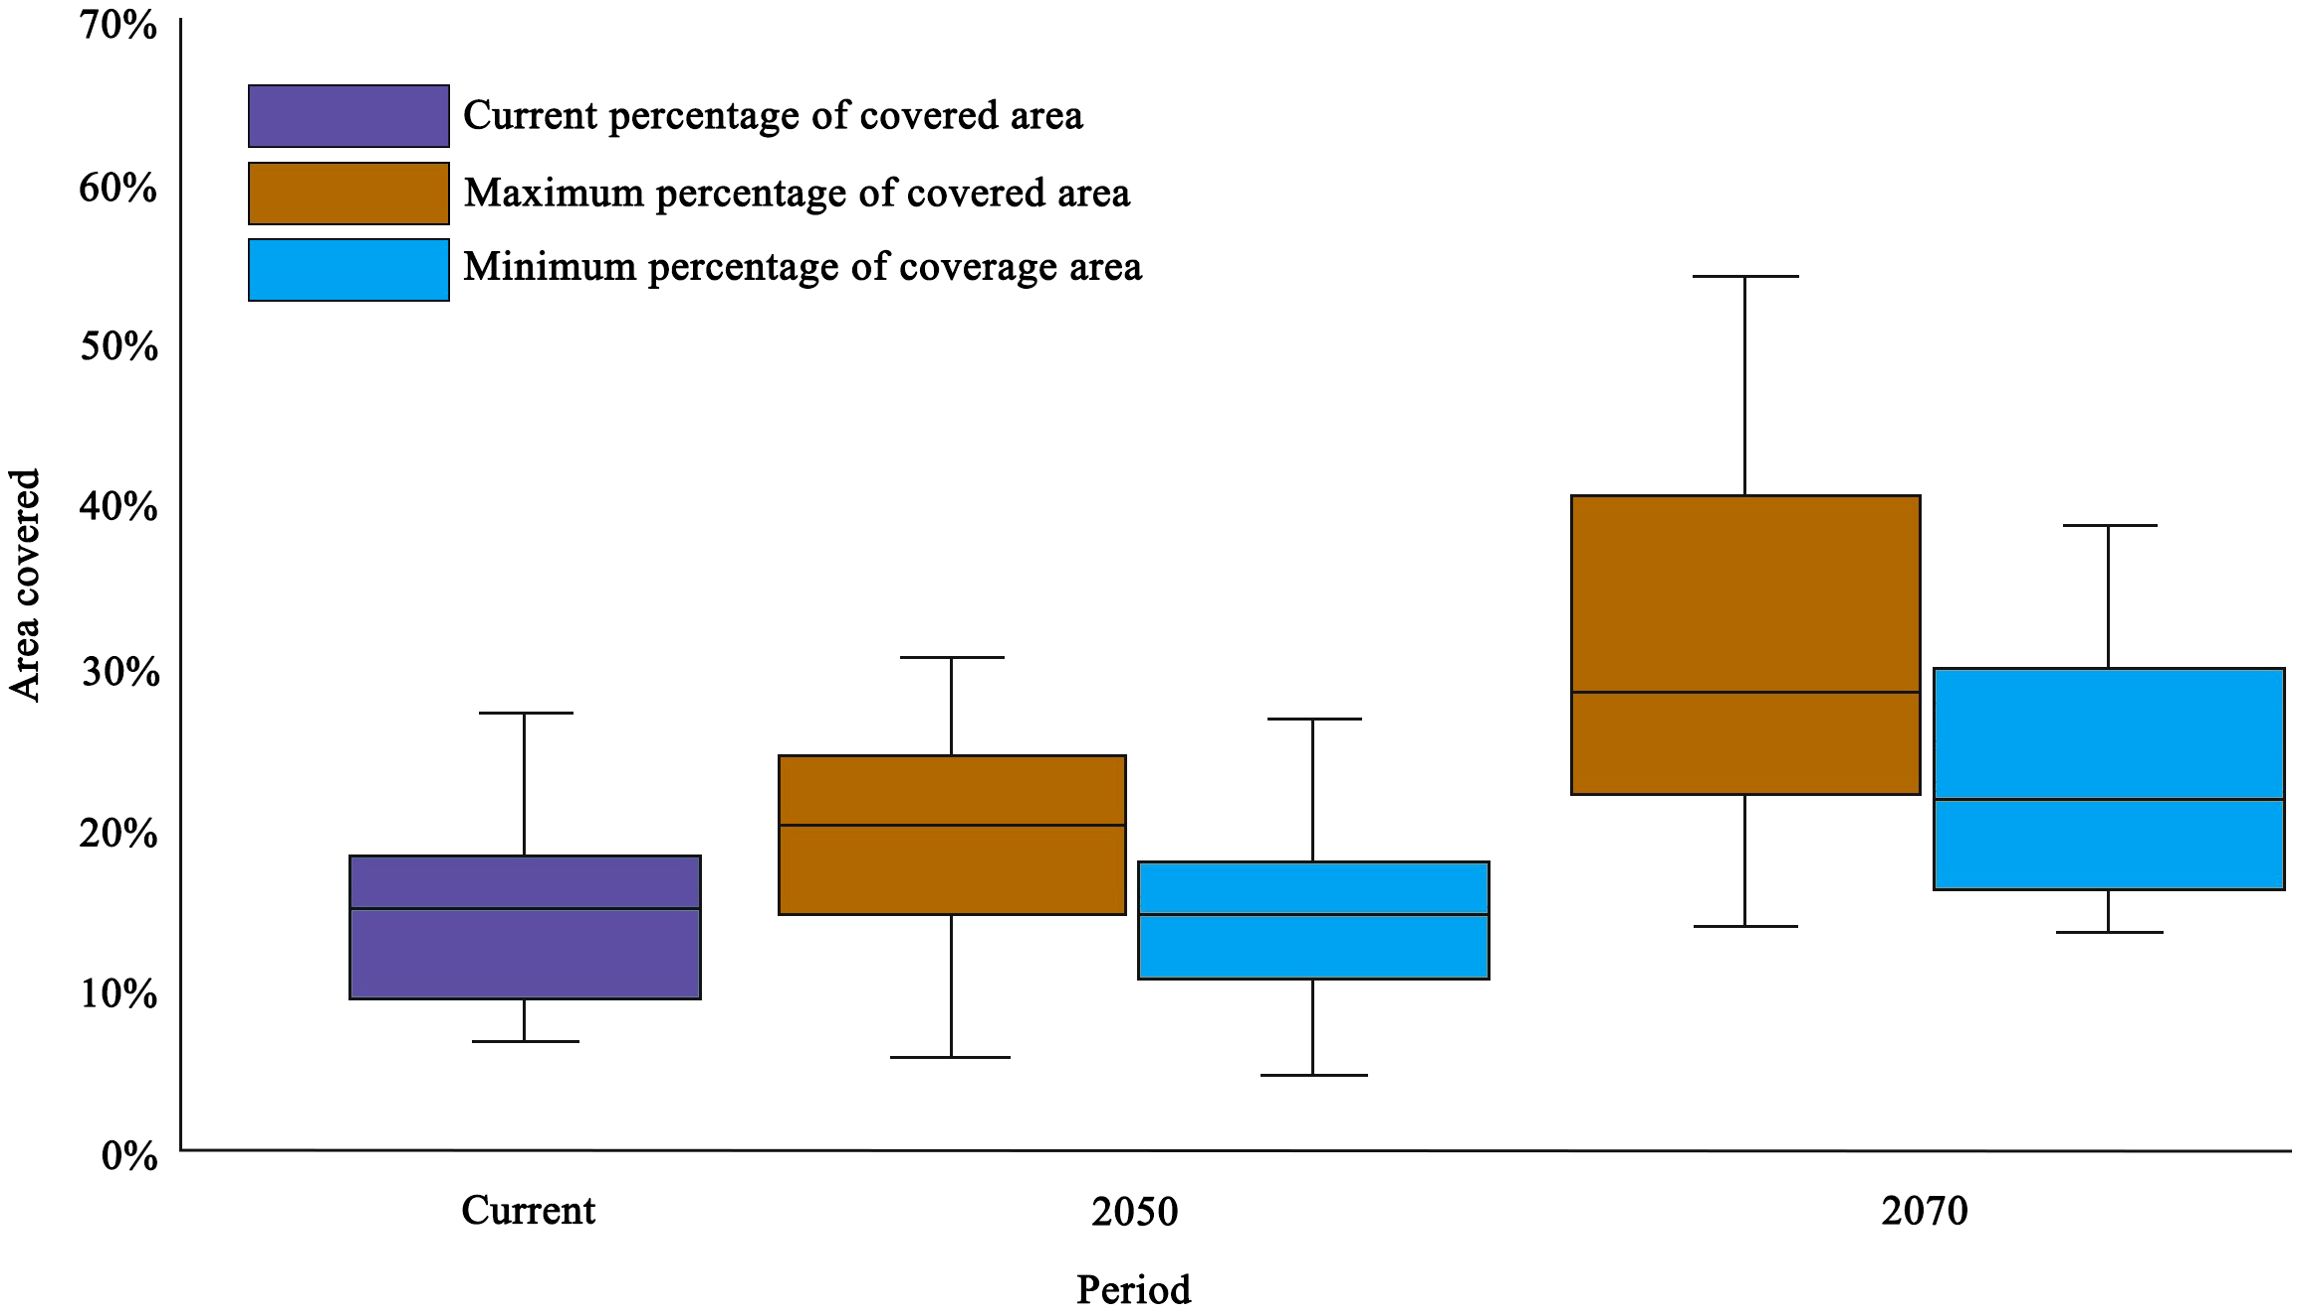
Figure 7. Current and future (minimum and maximum) proportion of suitable distribution within protected natural areas for five bee species.
3.4 Correlation analyses and environmental suitability change for bee species
A species’ resilience to climate change scales with its geographic range size. Correlation analyses revealed strong positive relationships between CSD and mean FSD change in 2050 (r = 0.76, df = 16, p < 0.01) and in 2070 (r = 0.86, df = 17, p < 0.01) (Figure 8). The correlation between CSD and mean FSD change will be stronger by 2070, and pollinators will be more strongly affected by global warming. Our models predict that honey bee species with smallest current suitable ranges will be more negatively impacted by projected climate change in the future. This negative impact will be more pronounced by 2070 as warming accelerates. Overall, climate change will diminish pollinators availability across their suitable habitats.
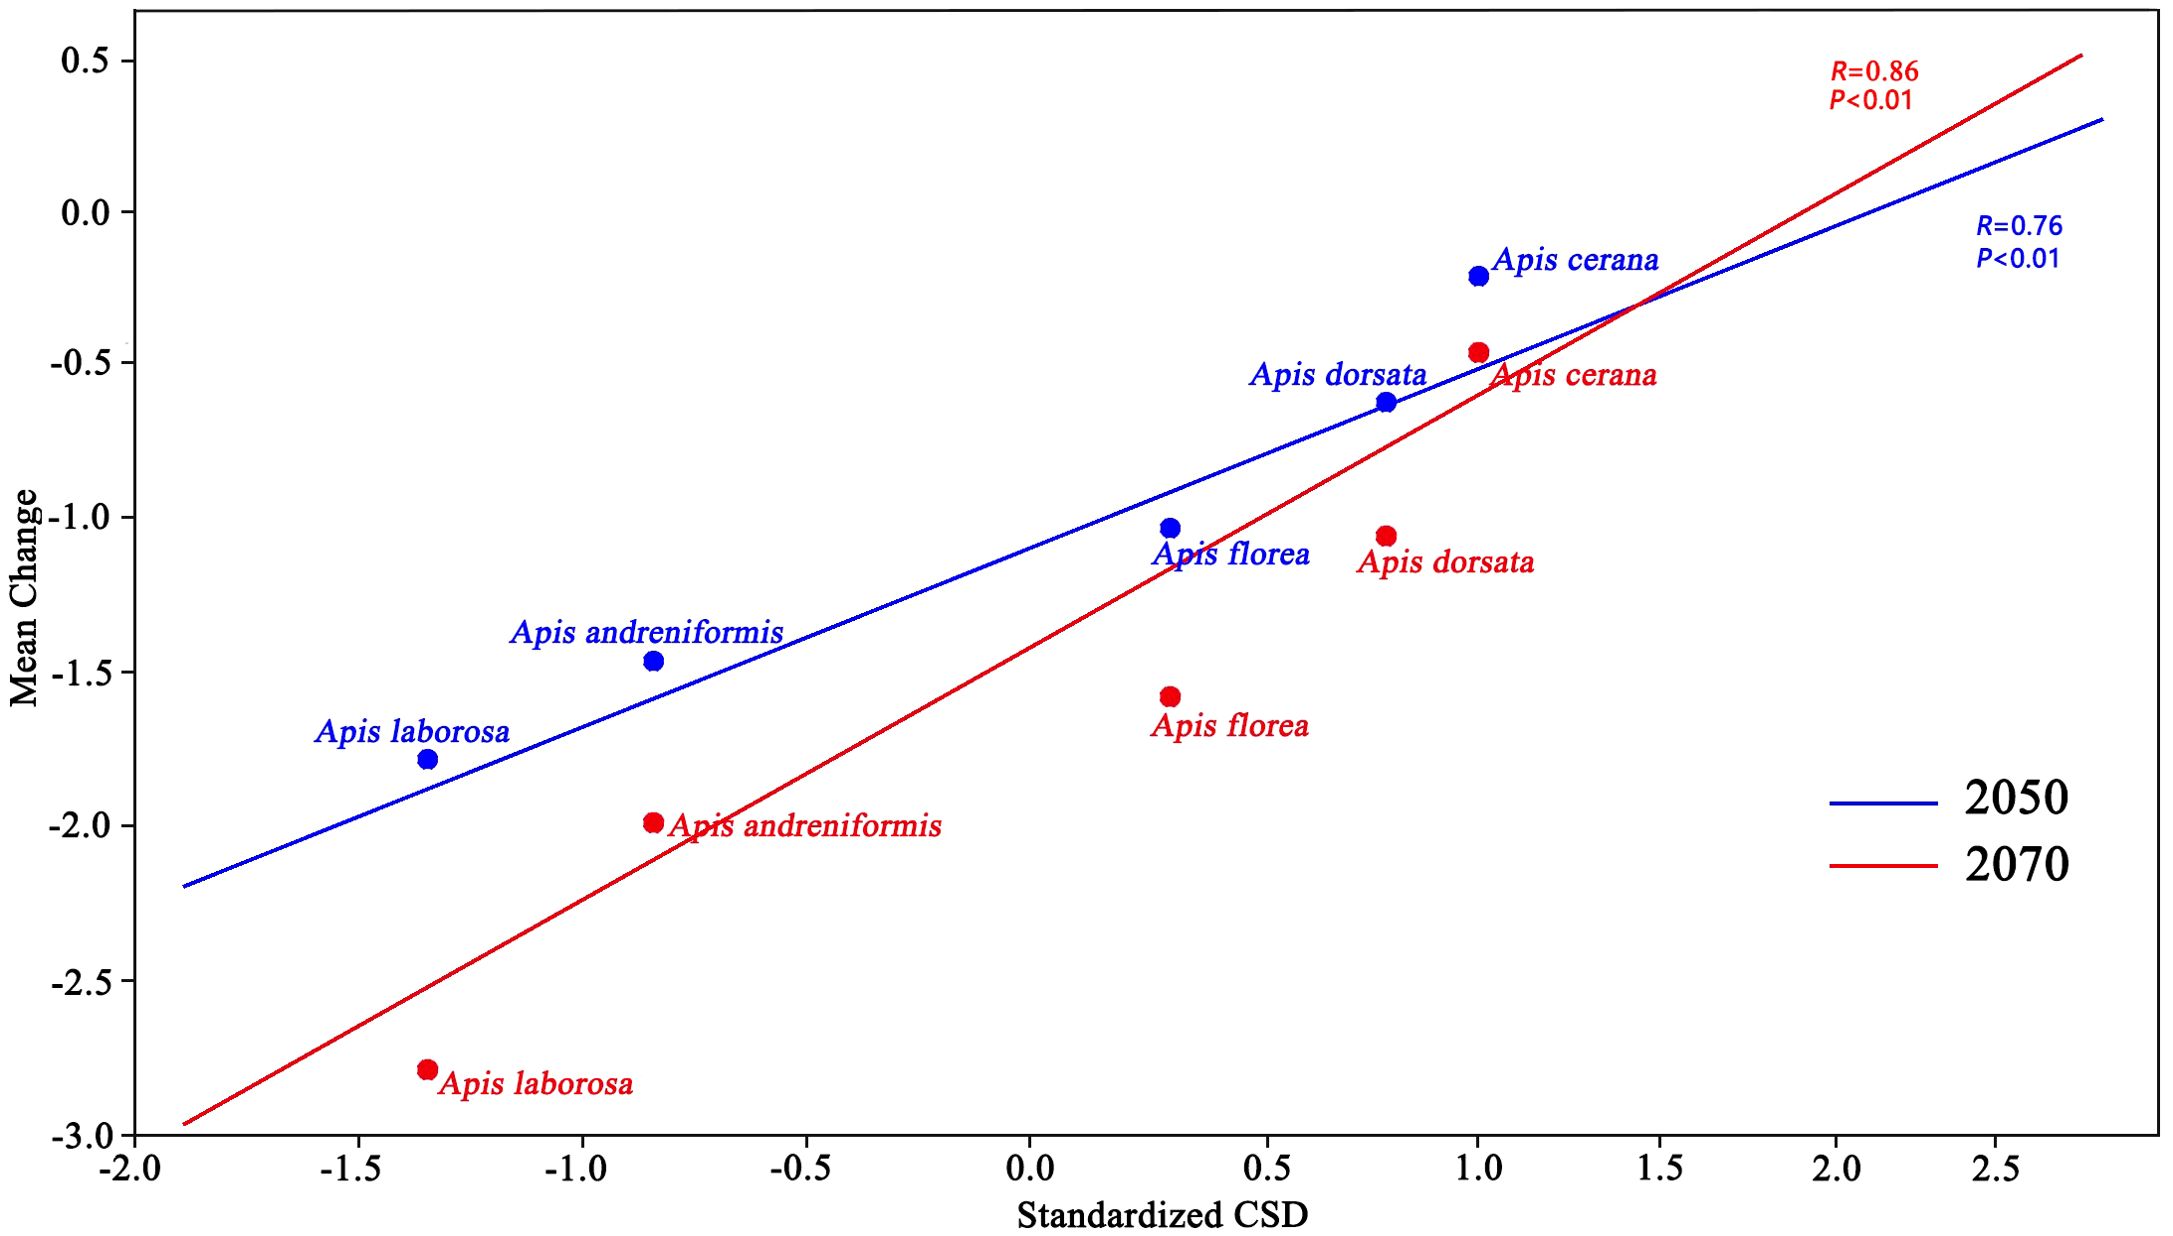
Figure 8. Correlation analysis for 2050 and 2070 mean change (future compared to current suitable distribution) and standardized current suitable distribution (CSD) for five bee species in the study area.
Environmental suitability is projected to decline for all species across every GCM-RCP combination by 2050 and 2070 (Figure 9). Species with smaller ranges face proportionally larger suitability losses over the coming decades. Comparing the median losses of all GCMs, median losses under RCP 8.5 exceed those under RCP 4.5 and 6.0 for both 2050 and 2070.
Figure 9. Box plot analysis of habitat suitability change for RCP models in 2050 and 2070.
4 Discussion
4.1 Performance of the ENMs approach
Ecological niche modelings (ENMs) can accurately predict and analyze the suitable habitat range of species, and reveal the relationship between climate variables and species presence (De Marco et al., 2008; Evans et al., 2015). As the most commonly used species-climate analysis method, ENMs also capture large-scale species distribution information, which provides richer environmental context for establishing a systematic and comprehensive relationship between species and the environment (Elith and Leathwick, 2009; Zhu et al., 2013). Therefore, ENMs are currently the most widely accepted and well-fitted models for species distribution prediction. The International Union for Conservation of Nature (IUCN) has begun to apply the model to species invasion, endangered species conservation and climate-change responses (Cassini, 2011).
To predict the impacts of global climate change on low-latitude pollinator distributions, we constructed ecological niche models under current and future climatic conditions. The modelled ranges and climate envelopes of all five bee species closely match their currently documented distributions within the study region (Hepburn et al., 2005; Radloff et al., 2010; Nagir et al., 2016; Raffiudin et al., 2020). It is worth noting that climate is not the only decisive factor affecting the process of species distribution dynamics (Root et al., 2003; Davis et al., 2010). Intrinsic adaptive capacity, habitat disturbance, reproductive traits, land-use change, pesticide exposure, pathogen pressure and anthropogenic activities will affect the survival and distribution of the species (Otto et al., 2016; Potts et al., 2016b; Heneberg and Bogusch, 2020). These factors, as important external pressures, limit the suitable distribution of pollinators and may potentially aggravate species declines under climate warming. Meanwhile, the construction of the niche models also must be carefully calibrated to approximate each species’ fundamental niche (Owens et al., 2013). Nonetheless, climate is the most important factors that determine the survival and reproduction of species, profoundly shaping the geographic distribution and ecological functions of pollinators (Hegland et al., 2009; Uden et al., 2015). We quantified the climatic niche of five bee species using nineteen environmental variables, and evaluated model accuracy with AUC values from both training and test datasets. We believe that our models provide sufficiently accurate estimates of species distributions. Accuracy analyses also confirmed the robust performance of our SDMs.
4.2 Climatic space for pollinator species
Environmental factors are closely related to the geographic distribution of insects (Lobo, 2016). The study area, centered on Southeast Asia at low latitudes, is strongly influenced by maritime climate regimes. The unique temperature-precipitation patterns and geography conditions provide essential environmental information for the survival and distribution of pollinators in the region (Abrahamczyk et al., 2011; Bartomeus et al., 2011). Among the many climatic factors that affect the suitable distribution, only a few exert dominant control over insect ranges (Stiling, 1988). Under current climates, Bio1 (annual mean temperature) and Bio12 (annual precipitation) primarily constrain suitable distributions for all five pollinators, with the lowest cumulative contribution of both exceeding 43%. Reproduction is the basic life activity of insects to maintain population, and temperature is an important influencing factors (Régnière et al., 2012). Annual average temperature can characterize the thermal requirements for each pollinator, and temperature deviation from the optimum impair insect reproduction and physiology (Janowitz and Fischer, 2011). Elevated temperatures impair neural function and affect the short-term memory of bees, which in turn will affect their performance as adults (Jones et al., 2005). In addition, temperature anomalies further destabilize the balance of the population (Savage et al., 2004). Investigation of the correlation between weather conditions and winter mortality of bee species in Austria revealed that warmer and drier weather conditions in the preceding year were associated with elevated winter mortality of bee species (Switanek et al., 2017). To reduce the negative effects of increased temperatures, most species shift upslope to higher elevations where temperatures are more suitable. Altitudinal surveys of the species abundance for bee populations on the Kilimanjaro region also reveal temperature as the primary driver of bee abundance at higher elevations (Classen et al., 2015). Elevation-associated changes in temperature, precipitation, vapor pressure and wind speed reduce both abundance and beta-diversity (Perillo et al., 2017). However, there are interspecific differences in climate change adaptation. Honey bee species inhabiting harsh environments generally exhibit greater tolerance to climate variability and extremes than those in normal climatic conditions (Abou-Shaara et al., 2012). Global warming is an important challenge to pollinators, especially those at low latitudes. The pollination process requires honey bees to fly a certain distance, and the sustained muscle activity raises their body temperature well above ambient (Heinrich and Buchmann, 1986). Bees will stop foraging and pollination in hot environments when their body temperature approaches their critical thermal limit (Willmer and Stone, 2004). Global warming will inevitably reduce the pollination efficiency of most honey bee species, so artificial selection of heat-tolerant bees may be an important way to address the climate challenge (Abou-Shaara, 2016). In conclusion, temperature constrains pollinator diversity by restricting the resource acquisition of ectothermic pollinators under global change.
In addition to temperature, precipitation and ambient humidity also profoundly influence insect physiology and population ecology (Barton and Ives, 2014). Our model indicated that annual precipitation is another key factor limiting suitable distribution of each bee species. Environmental moisture primarily influences the water balance of insects, thereby regulating the growth and development of pollinators (Benoit, 2010; Jactel et al., 2012). The nationwide study of pollinators across Ethiopia found that the precipitation of the driest quarter and the precipitation of the warmest quarter are the best contributors to bee distribution, and fluctuations in precipitation affect the pollination services as well as the ecological and economic roles of honey bee species in the country (Abrha, 2018). As with temperature, altered precipitation patterns in the current and preceding years can alter bee abundance, and plant-resource abundance is likewise affected (Moeller et al., 2012). Both excessively high and extremely low soil-moisture levels greatly reduce the hatching success of honey bee eggs (Dupraw, 1961). Future climatic change will cause irregular shifts of the rainfall belt in equatorial regions, further exacerbating the uneven distribution of water resources (Mamalakis et al., 2021). The survival of honey bee species affected by rainfall will eventually shape the structure of the community. In addition to altering species communities, future changes in rainfall patterns will also influence key physiological and morphological traits of individual insects. Body size increased over time, more so at drier sites (Suni and Dela Cruz, 2021). At the same time, the increase in body weight reduces water loss but, in turn, limits their flight range (Peterson et al., 2006). Pollinators must make developmental decisions without complete information about future conditions, and this uncertainty affects the structure of populations (Forrest et al., 2019). Precipitation may be an important driver of trait shifts in tropical bees, shifts that arise from differential climatic tolerances and thereby motivate investigations of natural selection on color and body size.
4.3 Distribution of occurrence points and future suitable distribution changes
Climate change will affect the relationship among human activities, the abiotic environment and organisms, and may further aggravate the loss of pollinator species (Settele et al., 2016). Based on the optimized ENM, we predicted the suitable areas for low-latitude pollinators and analyzed distribution patterns in relation to the key limiting factors. Drawing on multiple databases, we conducted a detailed and comprehensive statistical analysis for each honey bee species in the study region. Therefore, it is reasonable to conclude that the sampling of species distribution points is adequate. Nevertheless, we are still uncertain whether the five bee species studied are transferable across space and time (Martínez-López et al., 2021). This is mainly because the existing distribution point data can provide additional information on the distribution of the species across temporal and spatial scales. Pollinators are widely distributed in the study area, but regions such as Myanmar, Sumatra, Kalimantan and New Guinea islands remain properly and adequately surveyed. We should also be cautious about prediction results in areas characterized by low point density and limited sampling.
Based on an combined analysis of different RCP scenarios and models, we found that the suitable distribution of all honey bee species in the study area will decrease under climate change. The hypothesis that climate change will reduce the suitable range of bee species has been supported by previous studies (Soroye et al., 2020). In a study of regional crops and pollinators, climate change significantly reduced the suitable range of ten Brazilian bee species, particularly Melipona bicolor and Melipona scutellaris (Giannini et al., 2012). It is worth noting that the negative impact of climate change on honey bee populations is inevitable even in climatically suitable sites (Faleiro et al., 2018). Meanwhile, the contraction of suitable pollinator habitat also exhibits clear spatiotemporal patterns. Correlation analysis showed that the loss of pollinator habitat in 2070 was more significantly correlated with the size of the current distribution area than in 2050. Compared to species with large suitable ranges, those with smaller current ranges experience a greater climate-induced reduction in range size. Similar conclusions have also been confirmed in studies of bumble bee species in Mesoamerica (Martínez-López et al., 2021). In addition, environmental suitability for all species is projected to decline, with analyses for 2050 and 2070 indicating that RCP 8.5 could cause the greatest reduction. In the Pacific Northwest, environmental suitability for bumble bees is expected to decline markedly, with that of Bombus. vandykei projected to fall by 63% by 2050 (Koch et al., 2019). The pollinator responses to climate change examined in this study align with projected global range losses of other honey bee species (Le Conte and Navajas, 2008; Willmer, 2014; Pyke et al., 2016).
Our ENMs predicted that the loss of the suitable habitat for low-latitude pollinators will be concentrated in the equatorial region, especially on islands belonging to Indonesia and in the southern regions of Southeast Asia. The spatial mismatch between pollinators and plants caused by habitat loss will disrupt the symbiotic relationship within the ecosystem (Gorostiague et al., 2018). By 2070, only the higher latitudes within the study area are expected to remain highly suitable areas for pollinators. During recent climate warming, many insect species have shifted their ranges to higher latitudes and altitudes (Hill et al., 2011). In addition, Chapman et al. (2012) suggested that poleward migration of insects can promote population increases, highlighting their strong capacity to respond to environmental change (Chapman et al., 2012). Not only are low-latitude insect pollinators affected by climate change, but marine biodiversity near the equator has also declined significantly, with some populations now at risk of extinction (Beaugrand et al., 2015; Davies et al., 2017). Meanwhile, marine organisms tended to migrate poleward, whereas honeybee species showed no comparable shift (Molinos et al., 2016). Centroid migration trends among the five honey bee species could be influenced by variable winds and ocean currents in the study area, but further validation is needed (Jha, 2015). Moreover, the loss of suitable area was mainly concentrated at the edge of suitable range, while the core habitat persisted. Numerous studies have supported this hypothesis, but controversies remain over the underlying causes (Brown, 1984; Martínez-Meyer et al., 2013; Lee-Yaw et al., 2018). Supplementing our models with field investigations at the edge of suitable habitats may clarify this controversial phenomenon of range loss in these species.
Changes in altitude and environmental suitability revealed that future climate change will shift the suitable distribution of insect pollinators to higher elevations. Environmental suitability for all species will decrease in the future. In particular, the most significant decrease in environmental suitability was observed under the RCP8.5 scenario. Many studies have found that most honey bee species shift their altitudinal ranges under climate warming, thereby moving their habitat centroids (Hoiss et al., 2012; Inouye, 2020; Nooten and Rehan, 2020). Insects often migrate to higher elevations to track more suitable habitats (Adedoja et al., 2018). However, this upward shift also results in a loss of suitable habitat for pollinators at higher altitudes. Against the background of marked warming at lower latitudes, pollinators with lower tolerance for warmer or cooler climates are unable to shift toward higher latitudes (Kerr et al., 2015). In addition, the east-west mountains of the continent often block northward movement for pollinators. Kerr et al. (2015) found that the mean elevation of bumble bees’ suitable distribution in Europe rose by 300 m because of the Alps (Kerr et al., 2015). It is worth noting that many studies have shown that vegetation will continue shifting poleward and upslope under climate change (Ashton et al., 2009; Hagedorn et al., 2019). Vegetation shifts at low latitudes may be a key driver of range loss in insects. Although higher altitudes still provide some plant resources for pollinators, plant species richness there is significantly lower than at lower altitudes (Lawton et al., 1987; Becker et al., 2005). Our results suggest that the highly suitable habitat for pollinators is mainly concentrated in the Himalayan region and is projected to shift upslope by up to 500 m in the future. This warrants further investigation, as the upslope shift observed across all bee species may result from their populations being influenced by the east–west-oriented Himalayan mountain range.
4.4 Role of protected natural areas for bees under climate change
Protected terrestrial areas are widespread worldwide and play a key role in protecting endangered species and fragile ecosystems under climate change (Deguise and Kerr, 2006). However, protected areas have often been selected not to protect specific species, but to meet other criteria (Dunn, 2003). For example, Jiuzhaigou Valley in Sichuan and Yushan National Park in Taiwan were both established to protect natural landscapes (Wang et al., 2018). The Wudalianchi Nature Reserve in Heilongjiang Province was established to protect unique geological landforms (Huang et al., 2018). The protected terrestrial areas within our study region are relatively small, spatially fragmented, and poorly connected. Meanwhile, some of these protected areas are themselves at risk from climate change (Hoffmann et al., 2019; Elsen et al., 2020). According to our results, the proportion of suitable pollinator habitat that falls within protected areas remains extremely limited under both current and future scenarios. Therefore, protected-area establishment alone may be insufficient to conserve pollinator diversity and habitat.
Overall, the proportion of suitable pollinator habitat within protected areas is projected to increase, but this does not guarantee effective protection for bee species. If protected areas remain unchanged, the suitable habitat of pollinators will suffer substantial losses under climate warming (Martínez-López et al., 2021). This explains why the proportion of suitable habitat within protected areas is increasing. Although climate change is already so detrimental to pollinators, it is unrealistic to assume that protected areas will remain unchanged. Studies on the negative impacts of climate change on protected areas and forests are frequently reported (Hannah et al., 2007; Seidl et al., 2017). In addition to climatic factors, deforestation, land use change and pesticide abuse all pose significant challenges to vegetation within protected areas (Ashley et al., 2006). Even though certain species can retain ecological functions within protected areas, these areas are often not major agricultural production zones, limiting pollinators’ contribution to agriculture (Mcdonald and Boucher, 2011). Furthermore, our analysis shows that environmental suitability for pollinators is projected to decline in the future. In this context, it remains uncertain whether protected areas will continue to serve as refuges for pollinators.
Predictions indicate that the highly suitable habitat of honey bee species will be significantly fragmented in the future. While the conservation role of protected areas for species needs further study, establishing new nature reserves may enhance pollinator conservation (Martínez-López et al., 2021). In particular, the Himalayan region will become an important habitat for pollinators in the future. Although our projections suggest the Himalayan region is an important area, environmental problems such as habitat fragmentation, air pollution, and deforestation are becoming more pronounced in the region today (Chakraborty et al., 2017; Dhungel et al., 2018). A recent study showed that environmental changes in the Himalayan region have led to significant biomass loss, likely driven by global climate change and intensifying agricultural activities in the region (Chakraborty et al., 2018). However, the significant increase in the average vegetation index during the growing season may indicate improved food availability for pollinators in a warming climate (Shrestha et al., 2012). For the fragmented suitable habitat patches of pollinators in plains and low mountain areas, establishing nature reserves may not be the most effective strategy. For example, the Mekong Plain is the most densely populated area in Southeast Asia, and establishing nature reserves there would exacerbate human–land conflicts, thereby affecting agricultural production (Kontgis et al., 2019). In conclusion, protecting important species under climate change should avoid pure in-situ protection and adopt integrated landscape management strategies, a task that requires the active participation and efforts of land stakeholders. Furthermore, timely environmental education activities may benefit conservation efforts (González-Fernández et al., 2018). The floristic inventories allow us to determine which plants bees pollinate and from which plants they collect pollen and nectar. Conversely, we can grow plant species needed by bees in protected areas to support bee survival. Finally, the floristic inventories in the study area fill an obvious geographical gap in our sampling and lay the foundation for more scientifically and rationally predicting species distributions.
5 Conclusion
Ecological niche models (ENMs) can evaluate species distribution dynamics of under different climate scenarios and models based on known occurrence points and associated environmental variables. These models play an increasingly important role in the study of the distribution of species in response to climate change. Nevertheless, many factors pose significant challenges for establishing reliable ecological niche models for species, including spatial sampling bias, geographical limitations, habitat specialization, RCP and GCM assumptions, and model algorithms. In this study, we attempted to address these biases and problems affecting distribution predictions from ecological niche models, and to scientifically predict the response of pollinators to climate change in low-latitude regions. In addition, we recommend environmental education activities and floristic inventories to support more reliable near-term predictions.
Our analysis found that future climate change will lead to a sustained decline in the suitable distribution of pollinators, and for those bee species with smaller ranges, their suitable ranges decline even more sharply. Bio1, Bio12 and altitude are the most important variables affecting the dynamics of suitable distribution for each honey bee species, and the combined contribution rate of these three variables exceeds 40%. Under climate change, the average altitude shift for pollinators ranges from 35 to 450 meters, and highly suitable areas are clearly fragmented and concentrated at higher elevations, especially in the Himalayas. Except for A. florea, the geographic centroid of all bee species shifted to the southeast, with distances varying from 65 to 137 km. Our model predicts that future climate change will reduce the environmental suitability of pollinators in the study area. At the same time, protected areas are too fragmented and cover a small fraction of suitable pollinator habitat, limiting their effectiveness for bee conservation. These studies are expected to inform conservation efforts by governments and local organizations to enhance the conservation and sustainable use of insect pollinator resources in low latitudes.
Data availability statement
The original contributions presented in the study are included in the article/supplementary material. Further inquiries can be directed to the corresponding author.
Author contributions
XT: Writing – original draft, Software, Writing – review & editing, Conceptualization. ZH: Investigation, Supervision, Writing – review & editing. YD: Formal analysis, Writing – original draft, Software. YY: Writing – original draft, Conceptualization, Data curation, Resources, Validation. KZ: Resources, Project administration, Writing – original draft, Funding acquisition.
Funding
The author(s) declare financial support was received for the research and/or publication of this article. This project was funded by the Jiangxi Institute of Land Space Survey and Planning, Technology Innovation Center for Land Spatial Ecological Protection and Restoration in Great Lakes Basin, Ministry of Natural Resources. The funders had no role in study design, data collection and analysis, decision to publish, or preparation of the manuscript.
Conflict of interest
The authors declare that the research was conducted in the absence of any commercial or financial relationships that could be construed as a potential conflict of interest.
Generative AI statement
The author(s) declare that no Generative AI was used in the creation of this manuscript.
Any alternative text (alt text) provided alongside figures in this article has been generated by Frontiers with the support of artificial intelligence and reasonable efforts have been made to ensure accuracy, including review by the authors wherever possible. If you identify any issues, please contact us.
Publisher’s note
All claims expressed in this article are solely those of the authors and do not necessarily represent those of their affiliated organizations, or those of the publisher, the editors and the reviewers. Any product that may be evaluated in this article, or claim that may be made by its manufacturer, is not guaranteed or endorsed by the publisher.
References
Abou-Shaara H. F. (2016). Expectations about the potential impacts of climate change on honey bee colonies in Egypt. J. Apiculture 31, 157–164. doi: 10.17519/apiculture.2016.06.31.2.157
Abou-Shaara H. F., Al-Ghamdi A. A., and Mohamed A. A. (2012). Tolerance of two honey bee races to various temperature and relative humidity gradients. Environ. Exp. Biol. 10, 133–138. doi: 10.2298/BAH1203575A
Abrahamczyk S., Kluge J., Gareca Y., Reichle S., and Kessler M. (2011). The influence of climatic seasonality on the diversity of different tropical pollinator groups. PloS One 6, e27115. doi: 10.1371/journal.pone.0027115
Abrha H. (2018). Climate change impact on coffee and the pollinator bee suitable area interaction in Raya Azebo, Ethiopia. Cogent Food Agric. 4, 156–168. doi: 10.1080/23311932.2018.1564538
Adedoja O. A., Kehinde T., and Samways M. J. (2018). Insect-flower interaction networks vary among endemic pollinator taxa over an elevation gradient. PloS One 13, e0207453. doi: 10.1371/journal.pone.0207453
Adhikari D., Tiwary R., Singh P. P., Upadhaya K., Singh B., Haridasan K. E., et al. (2019). Ecological niche modeling as a cumulative environmental impact assessment tool for biodiversity assessment and conservation planning: A case study of critically endangered plant Lagerstroemia minuticarpa in the Indian Eastern Himalaya. J. Environ. Manage. 243, 299–307. doi: 10.1016/j.jenvman.2019.05.036
Ahn J., Kim Y., Shim K., Suh M., Cha D., Lee D., et al. (2021). Climatic yield potential of Japonica-type rice in the Korean Peninsula under RCP scenarios using the ensemble of multi-GCM and multi-RCM chains. Int. J. Climatology 41, 1287–1302. doi: 10.1002/joc.6767
Aizen M. A. and Harder L. D. (2009). The global stock of domesticated honey bees is growing slower than agricultural demand for pollination. Curr. Biol. 19, 915–918. doi: 10.1016/j.cub.2009.03.071
Ashley R., Russell D., and Swallow B. (2006). The policy terrain in protected area landscapes: challenges for agroforestry in integrated landscape conservation. Biodiversity Conserv. 15, 663–689. doi: 10.1007/s10531-005-2100-x
Ashton S., Gutierrez D., and Wilson R. J. (2009). Effects of temperature and elevation on habitat use by a rare mountain butterfly: implications for species responses to climate change. Ecol. Entomology 34, 437–446. doi: 10.1111/j.1365-2311.2008.01068.x
Baek H.-J., Lee J., Lee H.-S., Hyun Y.-K., Cho C., Kwon W.-T., et al. (2013). Climate change in the 21st century simulated by HadGEM2-AO under representative concentration pathways. Asia-Pacific J. Atmospheric Sci. 49, 603–618. doi: 10.1007/s13143-013-0053-7
Barman D. and Devadas R. (2013). Climate change on orchid population and conservation strategies: a review. J. Crop Weed 9, 1–12.
Bartomeus I., Ascher J. S., Wagner D., Danforth B. N., Colla S., Kornbluth S., et al. (2011). Climate-associated phenological advances in bee pollinators and bee-pollinated plants. Proc. Natl. Acad. Sci. 108, 20645–20649. doi: 10.1073/pnas.1115559108
Barton B. T. and Ives A. R. (2014). Species interactions and a chain of indirect effects driven by reduced precipitation. Ecology 95, 486–494. doi: 10.1890/13-0044.1
Barve N., Barve V., Jiménez-Valverde A., Lira-Noriega A., Maher S. P., Peterson A. T., et al. (2011). The crucial role of the accessible area in ecological niche modeling and species distribution modeling. Ecol. Model. 222, 1810–1819. doi: 10.1016/j.ecolmodel.2011.02.011
Beaugrand G., Edwards M., Raybaud V., Goberville E., and Kirby R. R. (2015). Future vulnerability of marine biodiversity compared with contemporary and past changes. Nat. Climate Change 5, 695–701. doi: 10.1038/nclimate2650
Beck J. (2013). Predicting climate change effects on agriculture from ecological niche modeling: who profits, who loses? Climatic Change 116, 177–189. doi: 10.1007/s10584-012-0481-x
Becker T., Dietz H., Billeter R., Buschmann H., and Edwards P. J. (2005). Altitudinal distribution of alien plant species in the Swiss Alps. Perspect. Plant Ecology Evol. Systematics 7, 173–183. doi: 10.1016/j.ppees.2005.09.006
Benoit J. B. (2010). Water management by dormant insects: comparisons between dehydration resistance during summer aestivation and winter diapause. Aestivation 49, 209–229. doi: 10.1007/978-3-642-02421-4_10
Bommarco R., Lundin O., Smith H. G., and Rundlöf M. (2012). Drastic historic shifts in bumble-bee community composition in Sweden. Proc. R. Soc. B: Biol. Sci. 279, 309–315. doi: 10.1098/rspb.2011.0647
Boria R. A., Olson L. E., Goodman S. M., and Anderson R. P. (2014). Spatial filtering to reduce sampling bias can improve the performance of ecological niche models. Ecol. Model. 275, 73–77. doi: 10.1016/j.ecolmodel.2013.12.012
Bowler M. (2014). Species abundance distributions, statistical mechanics and the priors of MaxEnt. Theor. population Biol. 92, 69–77. doi: 10.1016/j.tpb.2013.12.002
Broennimann O., Fitzpatrick M. C., Pearman P. B., Petitpierre B., Pellissier L., Yoccoz N. G., et al. (2012). Measuring ecological niche overlap from occurrence and spatial environmental data. Global Ecol. biogeography 21, 481–497. doi: 10.1111/j.1466-8238.2011.00698.x
Brown J. H. (1984). On the relationship between abundance and distribution of species. Am. Nat. 124, 255–279. doi: 10.1086/284267
Cassini M. H. (2011). Ranking threats using species distribution models in the IUCN Red List assessment process. Biodiversity Conserv. 20, 3689–3692. doi: 10.1007/s10531-011-0126-9
Chakraborty A., Ghosh A., Sachdeva K., and Joshi P. K. (2017). Characterizing fragmentation trends of the Himalayan forests in the Kumaon region of Uttarakhand, India. Ecol. Inf. 38, 95–109. doi: 10.1016/j.ecoinf.2016.12.006
Chakraborty A., Saha S., Sachdeva K., and Joshi P. K. (2018). Vulnerability of forests in the Himalayan region to climate change impacts and anthropogenic disturbances: a systematic review. Regional Environ. Change 18, 1783–1799. doi: 10.1007/s10113-018-1309-7
Chapman J. W., Bell J. R., Burgin L. E., Reynolds D. R., Pettersson L. B., Hill J. K., et al. (2012). Seasonal migration to high latitudes results in major reproductive benefits in an insect. Proc. Natl. Acad. Sci. 109, 14924–14929. doi: 10.1073/pnas.1207255109
Chen I.-C., Hill J. K., Ohlemüller R., Roy D. B., and Thomas C. D. (2011). Rapid range shifts of species associated with high levels of climate warming. Science 333, 1024–1026. doi: 10.1126/science.1206432
Classen A., Peters M. K., Kindeketa W. J., Appelhans T., Eardley C. D., Gikungu M. W., et al. (2015). Temperature versus resource constraints: which factors determine bee diversity on M ount K ilimanjaro, T anzania? Global Ecol. Biogeography 24, 642–652. doi: 10.1111/geb.12286
Clements R., Sodhi N. S., Schilthuizen M., and Ng P. K. (2006). Limestone karsts of Southeast Asia: imperiled arks of biodiversity. Bioscience 56, 733–742. doi: 10.1641/0006-3568(2006)56[733:LKOSAI]2.0.CO;2
Colla S. R. and Packer L. (2008). Evidence for decline in eastern North American bumblebees (Hymenoptera: Apidae), with special focus on Bombus affinis Cresson. Biodiversity Conserv. 17, 1379–1391. doi: 10.1007/s10531-008-9340-5
Collins W., Bellouin N., Doutriaux-Boucher M., Gedney N., Halloran P., Hinton T., et al. (2011). Development and evaluation of an Earth-System model–HadGEM2. Geoscientific Model. Dev. 4, 1051–1075. doi: 10.5194/gmd-4-1051-2011
Costa G. C., Nogueira C., MaChado R. B., and Colli G. R. (2010). Sampling bias and the use of ecological niche modeling in conservation planning: a field evaluation in a biodiversity hotspot. Biodiversity Conserv. 19, 883–899. doi: 10.1007/s10531-009-9746-8
Davies T., Maxwell S., Kaschner K., Garilao C., and Ban N. C. (2017). Large marine protected areas represent biodiversity now and under climate change. Sci. Rep. 7, 1–7. doi: 10.1038/s41598-017-08758-5
Davis C. C., Willis C. G., Primack R. B., and Miller-Rushing A. J. (2010). The importance of phylogeny to the study of phenological response to global climate change. Philos. Trans. R. Soc. B: Biol. Sci. 365, 3201–3213. doi: 10.1098/rstb.2010.0130
Deguise I. E. and Kerr J. T. (2006). Protected areas and prospects for endangered species conservation in Canada. Conserv. Biol. 20, 48–55. doi: 10.1111/j.1523-1739.2005.00274.x
De Marco J. P., Diniz-Filho J., and Bini L. M. (2008). Spatial analysis improves species distribution modelling during range expansion. Biol. Lett. 4, 577–580. doi: 10.1098/rsbl.2008.0210
Dhungel S., Kathayat B., Mahata K., and Panday A. (2018). Transport of regional pollutants through a remote trans-Himalayan valley in Nepal. Atmospheric Chem. Phys. 18, 1203–1216. doi: 10.5194/acp-18-1203-2018
Dormann C. F., Bobrowski M., Dehling D. M., Harris D. J., Hartig F., Lischke H., et al. (2018). Biotic interactions in species distribution modelling: 10 questions to guide interpretation and avoid false conclusions. Global Ecol. biogeography 27, 1004–1016. doi: 10.1111/geb.12759
Drouet L., Bosetti V., and Tavoni M. (2015). Selection of climate policies under the uncertainties in the Fifth Assessment Report of the IPCC. Nat. Climate Change 5, 937–940. doi: 10.1038/nclimate2721
Dunn H. (2003). Can conservation assessment criteria developed for terrestrial systems be applied to riverine systems? Aquat. Ecosystem Health Manage. 6, 81–95. doi: 10.1080/14634980301478
Dupraw E. (1961). A unique hatching process in the honeybee. Trans. Am. Microscopical Soc. 80, 185–191. doi: 10.2307/3223908
Elith J. and Leathwick J. R. (2009). Species distribution models: ecological explanation and prediction across space and time. Annu. Rev. ecology evolution systematics 40, 677–697. doi: 10.1146/annurev.ecolsys.110308.120159
Elsen P. R., Monahan W. B., Dougherty E. R., and Merenlender A. M. (2020). Keeping pace with climate change in global terrestrial protected areas. Sci. Adv. 6, eaay0814. doi: 10.1126/sciadv.aay0814
Evans T. G., Diamond S. E., and Kelly M. W. (2015). Mechanistic species distribution modelling as a link between physiology and conservation. Conserv. Physiol. 3, 1032–1056. doi: 10.1093/conphys/cov056
Faleiro F. V., Nemésio A., and Loyola R. (2018). Climate change likely to reduce orchid bee abundance even in climatic suitable sites. Global Change Biol. 24, 2272–2283. doi: 10.1111/gcb.14112
Fick S. E. and Hijmans R. J. (2017). WorldClim 2: new 1-km spatial resolution climate surfaces for global land areas. Int. J. climatology 37, 4302–4315. doi: 10.1002/joc.5086
Forrest J. R., Cross R., and Caradonna P. J. (2019). Two-year bee, or not two-year bee? How voltinism is affected by temperature and season length in a high-elevation solitary bee. Am. Nat. 193, 560–574. doi: 10.1086/701826
Freeman E. A. and Moisen G. G. (2008). A comparison of the performance of threshold criteria for binary classification in terms of predicted prevalence and kappa. Ecol. Model. 217, 48–58. doi: 10.1016/j.ecolmodel.2008.05.015
Fründ J., Zieger S. L., and Tscharntke T. (2013). Response diversity of wild bees to overwintering temperatures. Oecologia 173, 1639–1648. doi: 10.1007/s00442-013-2729-1
Gallai N., Salles J.-M., Settele J., and Vaissière B. E. (2009). Economic valuation of the vulnerability of world agriculture confronted with pollinator decline. Ecol. economics 68, 810–821. doi: 10.1016/j.ecolecon.2008.06.014
Gao Y., Fu J. S., Drake J. B., Lamarque J. F., and Liu Y. (2013). The impact of emissions and climate change on ozone in the United States under Representative Concentration Pathways (RCPs). Atmospheric Chem. Phys. 13, 11315–11355. doi: 10.5194/acp-13-9607-2013
Gaston K. J. (2008). Biodiversity and extinction: the importance of being common. Prog. Phys. Geogr. 32, 73–79. doi: 10.1177/0309133308089499
Gebre S. L. (2015). Hydrological response to climate change of the upper blue nile river basin: based on IPCC fifth assessment report (AR5). J. Climatology Weather Forecasting 03, 57–69. doi: 10.4172/2332-2594.1000121
Gent P. R., Danabasoglu G., Donner L. J., Holland M. M., Hunke E. C., Jayne S. R., et al. (2011). The community climate system model version 4. J. Climate 24, 4973–4991. doi: 10.1175/2011JCLI4083.1
Giannini T. C., Acosta A. L., Garófalo C. A., Saraiva A. M., Alves-Dos-Santos I., and Imperatriz-Fonseca V. L. (2012). Pollination services at risk: Bee habitats will decrease owing to climate change in Brazil. Ecol. Model. 244, 127–131. doi: 10.1016/j.ecolmodel.2012.06.035
Giannini T. C., Costa W. F., Borges R. C., Miranda L., Da Costa C. P. W., Saraiva A. M., et al. (2020). Climate change in the Eastern Amazon: crop-pollinator and occurrence-restricted bees are potentially more affected. Regional Environ. Change 20, 1–12. doi: 10.1007/s10113-020-01611-y
Gogol-Prokurat M. (2011). Predicting habitat suitability for rare plants at local spatial scales using a species distribution model. Ecol. Appl. 21, 33–47. doi: 10.1890/09-1190.1
González-Fernández A., Manjarrez J., García-Vázquez U., D’addario M., and Sunny A. (2018). Present and future ecological niche modeling of garter snake species from the Trans-Mexican Volcanic Belt. PeerJ 6, 1–20. doi: 10.7717/peerj.4618
Gorostiague P., Sajama J., and Ortega-Baes P. (2018). Will climate change cause spatial mismatch between plants and their pollinators? A test using Andean cactus species. Biol. Conserv. 226, 247–255. doi: 10.1016/j.biocon.2018.07.003
Gottfried M., Pauli H., Reiter K., and Grabherr G. (1999). A fine-scaled predictive model for changes in species distribution patterns of high mountain plants induced by climate warming. Diversity Distributions 5, 241–251. doi: 10.1046/j.1472-4642.1999.00058.x
Hagedorn F., Gavazov K., and Alexander J. M. (2019). Above-and belowground linkages shape responses of mountain vegetation to climate change. Science 365, 1119–1123. doi: 10.1126/science.aax4737
Hannah L., Midgley G., Andelman S., Araújo M., Hughes G., Martinez-Meyer E., et al. (2007). Protected area needs in a changing climate. Front. Ecol. Environ. 5, 131–138. doi: 10.1890/1540-9295(2007)5[131:PANIAC]2.0.CO;2
Hegland S. J., Nielsen A., Lázaro A., Bjerknes A. L., and Totland Ø. (2009). How does climate warming affect plant-pollinator interactions? Ecol. Lett. 12, 184–195. doi: 10.1111/j.1461-0248.2008.01269.x
Heinrich B. and Buchmann S. L. (1986). Thermoregulatory physiology of the carpenter bee, Xylocopa varipuncta. J. Comp. Physiol. B 156, 557–562. doi: 10.1007/BF00691042
Heneberg P. and Bogusch P. (2020). Identification of a previously overlooked anthropogenic habitat that attracts diverse assemblages of threatened bees and wasps. Ecol. Eng. 147, 105759. doi: 10.1016/j.ecoleng.2020.105759
Hepburn H. R., Radloff S. E., Otis G. W., Fuchs S., Verma L., Ken T., et al. (2005). Apis florea: morphometrics, classification and biogeography. Apidologie 36, 359–376. doi: 10.1051/apido:2005023
Hill J. K., Griffiths H. M., and Thomas C. D. (2011). Climate change and evolutionary adaptations at species’ range margins. Annu. Rev. entomology 56, 143–159. doi: 10.1146/annurev-ento-120709-144746
Hirzel A. H. and Lay G. L. (2008). Habitat suitability modelling and niche theory. J. Appl. Ecol. 45, 1372–1381. doi: 10.1111/j.1365-2664.2008.01524.x
Hoffmann S., Irl S., and Beierkuhnlein C. (2019). Predicted climate shifts within terrestrial protected areas worldwide. Nat. Commun. 10, 4787. doi: 10.1038/s41467-019-12603-w
Hoiss B., Krauss J., Potts S. G., Roberts S., and Steffan-Dewenter I. (2012). Altitude acts as an environmental filter on phylogenetic composition, traits and diversity in bee communities. Proc. R. Soc. B: Biol. Sci. 279, 4447–4456. doi: 10.1098/rspb.2012.1581
Huang Q., Zhu D., Cao H., Xie L., and Ni H. (2018). Species composition and diversity analysis of lava flow in different periods in Wudalianchi Nature Reserve, China. J. Northeast Agric. Univ. (English Edition) 25, 22–28.
Imbach P., Fung E., Hannah L., Navarro-Racines C. E., Roubik D. W., Ricketts T. H., et al. (2017). Coupling of pollination services and coffee suitability under climate change. Proc. Natl. Acad. Sci. 114, 10438–10442. doi: 10.1073/pnas.1617940114
Inouye D. W. (2020). Effects of climate change on alpine plants and their pollinators. Ann. New York Acad. Sci. 1469, 26–37. doi: 10.1111/nyas.14104
Jactel H., Petit J., Desprez-Loustau M. L., Delzon S., Piou D., Battisti A., et al. (2012). Drought effects on damage by forest insects and pathogens: a meta-analysis. Global Change Biol. 18, 267–276. doi: 10.1111/j.1365-2486.2011.02512.x
Jakoby O., Lischke H., and Wermelinger B. (2019). Climate change alters elevational phenology patterns of the European spruce bark beetle (Ips typographus). Global Change Biol. 25, 4048–4063. doi: 10.1111/gcb.14766
Janowitz S. A. and Fischer K. (2011). Opposing effects of heat stress on male versus female reproductive success in Bicyclus anynana butterflies. J. Thermal Biol. 36, 283–287. doi: 10.1016/j.jtherbio.2011.04.001
Jha S. (2015). Contemporary human-altered landscapes and oceanic barriers reduce bumble bee gene flow. Mol. Ecol. 24, 993–1006. doi: 10.1111/mec.13090
Jones J. C., Helliwell P., Beekman M., Maleszka R., and Oldroyd B. P. (2005). The effects of rearing temperature on developmental stability and learning and memory in the honey bee, Apis mellifera. J. Comp. Physiol. A 191, 1121–1129. doi: 10.1007/s00359-005-0035-z
Kearney M. and Porter W. (2009). Mechanistic niche modelling: combining physiological and spatial data to predict species’ ranges. Ecol. Lett. 12, 334–350. doi: 10.1111/j.1461-0248.2008.01277.x
Kerr J. T., Pindar A., Galpern P., Packer L., Potts S. G., Roberts S. M., et al. (2015). Climate change impacts on bumblebees converge across continents. Science 349, 177–180. doi: 10.1126/science.aaa7031
Khanum R., Mumtaz A., and Kumar S. (2013). Predicting impacts of climate change on medicinal asclepiads of Pakistan using Maxent modeling. Acta Oecologica 49, 23–31. doi: 10.1016/j.actao.2013.02.007
Kharin V. V., Zwiers F., Zhang X., and Wehner M. (2013). Changes in temperature and precipitation extremes in the CMIP5 ensemble. Climatic Change 119, 345–357. doi: 10.1007/s10584-013-0705-8
Koch J. B., Looney C., Hopkins B., Lichtenberg E. M., Sheppard W. S., and Strange J. P. (2019). Projected climate change will reduce habitat suitability for bumble bees in the Pacific Northwest. BioRxiv, 610071. doi: 10.1101/610071
Koch J. B., Vandame R., Mérida-Rivas J., Sagot P., and Strange J. (2018). Quaternary climate instability is correlated with patterns of population genetic variability in Bombus huntii. Ecol. Evol. 8, 7849–7864. doi: 10.1002/ece3.4294
Kontgis C., Schneider A., Ozdogan M., Kucharik C., Duc N. H., and Schatz J. (2019). Climate change impacts on rice productivity in the Mekong River Delta. Appl. Geogr. 102, 71–83. doi: 10.1016/j.apgeog.2018.12.004
Kramer-SChadt S., Niedballa J., Pilgrim J. D., Schröder B., Lindenborn J., Reinfelder V., et al. (2013). The importance of correcting for sampling bias in MaxEnt species distribution models. Diversity Distributions 19, 1366–1379. doi: 10.1111/ddi.12096
Kumar P. (2012). Assessment of impact of climate change on Rhododendrons in Sikkim Himalayas using Maxent modelling: limitations and challenges. Biodiversity Conserv. 21, 1251–1266. doi: 10.1007/s10531-012-0279-1
Kumar S. and Stohlgren T. J. (2009). Maxent modeling for predicting suitable habitat for threatened and endangered tree Canacomyrica monticola in New Caledonia. J. Ecol. Natural Environ. 1, 94–98. doi: 10.5897/JENE09.016
Lawton J., Macgarvin M., and Heads P. (1987). Effects of altitude on the abundance and species richness of insect herbivores on bracken. J. Anim. Ecol. 147-160, 147–160. doi: 10.2307/4805
Le Conte Y. and Navajas M. (2008). Climate change: impact on honey bee populations and diseases. Rev. Scientifique Technique-Office Int. Des. Epizooties 27, 499–510. doi: 10.20506/RST.27.2.1819
Lee-Yaw J. A., Fracassetti M., and Willi Y. (2018). Environmental marginality and geographic range limits: a case study with Arabidopsis lyrata ssp. lyrata. Ecography 41, 622–634. doi: 10.1111/ecog.02869
Li J., Fan G., and He Y. (2020). Predicting the current and future distribution of three Coptis herbs in China under climate change conditions, using the MaxEnt model and chemical analysis. Sci. Total Environ. 698, 134141. doi: 10.1016/j.scitotenv.2019.134141
Ling C. X., Huang J., and Zhang H. (2003). “AUC: a better measure than accuracy in comparing learning algorithms,” in Conference of the canadian society for computational studies of intelligence (Berlin, Germany: Springer), 329–341.
Lobo J. M. (2016). The use of occurrence data to predict the effects of climate change on insects. Curr. Opin. Insect Sci. 17, 62–68. doi: 10.1016/j.cois.2016.07.003
Lobo J. M., Jiménez-Valverde A., and Real R. (2008). AUC: a misleading measure of the performance of predictive distribution models. Global Ecol. Biogeography 17, 145–151. doi: 10.1111/j.1466-8238.2007.00358.x
Mamalakis A., Randerson J. T., Yu J.-Y., Pritchard M. S., Magnusdottir G., Smyth P., et al. (2021). Zonally contrasting shifts of the tropical rain belt in response to climate change. Nat. Climate Change 11, 143–151. doi: 10.1038/s41558-020-00963-x
Martínez-López O., Koch J. B., Martínez-Morales M. A., Navarrete-Gutiérrez D., Enríquez E., and Vandame R. (2021). Reduction in the potential distribution of bumble bees (Apidae: Bombus) in Mesoamerica under different climate change scenarios: Conservation implications. Global Change Biol. 27, 1772–1787. doi: 10.1111/gcb.15559
Martínez-Meyer E., Díaz-Porras D., Peterson A. T., and Yáñez-Arenas C. (2013). Ecological niche structure and rangewide abundance patterns of species. Biol. Lett. 9, 20120637. doi: 10.1098/rsbl.2012.0637
Mcdonald R. I. and Boucher T. M. (2011). Global development and the future of the protected area strategy. Biol. Conserv. 144, 383–392. doi: 10.1016/j.biocon.2010.09.016
Meinshausen M., Smith S. J., Calvin K., Daniel J. S., Kainuma M., Lamarque J. F., et al. (2011). The RCP greenhouse gas concentrations and their extensions from 1765 to 2300. Climatic Change 109, 213. doi: 10.1007/s10584-011-0156-z
Merow C., Allen J. M., Aiello-Lammens M., and Silander J. J. A. (2016). Improving niche and range estimates with Maxent and point process models by integrating spatially explicit information. Global Ecol. Biogeography 25, 1022–1036. doi: 10.1111/geb.12453
Moeller D. A., Geber M. A., Eckhart V. M., and Tiffin P. (2012). Reduced pollinator service and elevated pollen limitation at the geographic range limit of an annual plant. Ecology 93, 1036–1048. doi: 10.1890/11-1462.1
Molinos J. G., Halpern B. S., Schoeman D. S., Brown C. J., Kiessling W., Moore P. J., et al. (2016). Climate velocity and the future global redistribution of marine biodiversity. Nat. Climate Change 6, 83–88. doi: 10.1038/nclimate2769
Morales N. S., Fernández I. C., and Baca-González V. (2017). MaxEnt’s parameter configuration and small samples: are we paying attention to recommendations? A systematic review. PeerJ 5, e3093. doi: 10.7717/peerj.3093
Muscarella R., Galante P. J., Soley-Guardia M., Boria R. A., Kass J. M., Uriarte M., et al. (2014). ENM eval: An R package for conducting spatially independent evaluations and estimating optimal model complexity for Maxent ecological niche models. Methods Ecol. Evol. 5, 1198–1205. doi: 10.1111/2041-210X.12261
Nagir M. T., Atmowidi T., and Kahono S. (2016). The distribution and nest-site preference of Apis dorsata binghami at Maros Forest, South Sulawesi, Indonesia. J. Insect Biodiversity 4, 1–14. doi: 10.12976/jib/2016.4.23
Nooten S. S. and Rehan S. M. (2020). Historical changes in bumble bee body size and range shift of declining species. Biodiversity Conserv. 29, 451–467. doi: 10.1007/s10531-019-01893-7
Ogilvie J. E., Griffin S. R., Gezon Z. J., Inouye B. D., Underwood N., Inouye D. W., et al. (2017). Interannual bumble bee abundance is driven by indirect climate effects on floral resource phenology. Ecol. Lett. 20, 1507–1515. doi: 10.1111/ele.12854
Ollerton J., Winfree R., and Tarrant S. (2011). How many flowering plants are pollinated by animals? Oikos 120, 321–326. doi: 10.1111/j.1600-0706.2010.18644.x
Orr M. C., Hughes A. C., Chesters D., Pickering J., Zhu C.-D., and Ascher J. S. (2021). Global patterns and drivers of bee distribution. Curr. Biol. 31, 451–458. e454. doi: 10.1016/j.cub.2020.10.053
Otto C. R., Roth C. L., Carlson B. L., and Smart M. D. (2016). Land-use change reduces habitat suitability for supporting managed honey bee colonies in the Northern Great Plains. Proc. Natl. Acad. Sci. 113, 10430–10435. doi: 10.1073/pnas.1603481113
Ovenden G. N., Swash A. R., and Smallshire D. (1998). Agri-environment schemes and their contribution to the conservation of biodiversity in England. J. Appl. Ecol. 35, 955–960. doi: 10.1111/j.1365-2664.1998.tb00014.x
Owens H. L., Campbell L. P., Dornak L. L., Saupe E. E., Barve N., Soberón J., et al. (2013). Constraints on interpretation of ecological niche models by limited environmental ranges on calibration areas. Ecol. Model. 263, 10–18. doi: 10.1016/j.ecolmodel.2013.04.011
Padalia H., Srivastava V., and Kushwaha S. (2014). Modeling potential invasion range of alien invasive species, Hyptis suaveolens (L.) Poit. in India: Comparison of MaxEnt and GARP. Ecol. Inf. 22, 36–43. doi: 10.1016/j.ecoinf.2014.04.002
Parmesan C. (2006). Ecological and evolutionary responses to recent climate change. Annu. Rev. Ecol. Evol. Syst. 37, 637–669. doi: 10.1146/annurev.ecolsys.37.091305.110100
Perillo L. N., Neves F. D. S., Antonini Y., and Martins R. P. (2017). Compositional changes in bee and wasp communities along Neotropical mountain altitudinal gradient. PloS One 12, e0182054. doi: 10.1371/journal.pone.0182054
Peterson J. H., Roitberg B. D., and Peterson J. (2006). Impacts of flight distance on sex ratio and resource allocation to offspring in the leafcutter bee, MegaChile rotundata. Behav. Ecol. Sociobiology 59, 589–596. doi: 10.1007/s00265-005-0085-9
Peterson A. T. and Soberón J. (2012). Species distribution modeling and ecological niche modeling: getting the concepts right. Natureza Conservação 10, 102–107. doi: 10.4322/natcon.2012.019
Phillips S. J., Anderson R. P., Dudík M., Schapire R. E., and Blair M. E. (2017). Opening the black box: An open-source release of Maxent. Ecography 40, 887–893. doi: 10.1111/ecog.03049
Phillips S. J., Anderson R. P., and Schapire R. E. (2006). Maximum entropy modeling of species geographic distributions. Ecol. Model. 190, 231–259. doi: 10.1016/j.ecolmodel.2005.03.026
Phillips S. J. and Dudík M. (2008). Modeling of species distributions with Maxent: new extensions and a comprehensive evaluation. Ecography 31, 161–175. doi: 10.1111/j.0906-7590.2008.5203.x
Pili A. N., Tingley R., Sy E. Y., Diesmos M. L. L., and Diesmos A. C. (2020). Niche shifts and environmental non-equilibrium undermine the usefulness of ecological niche models for invasion risk assessments. Sci. Rep. 10, 1–18. doi: 10.1038/s41598-020-64568-2
Poggio L., Simonetti E., and Gimona A. (2018). Enhancing the WorldClim data set for national and regional applications. Sci. Total Environ. 625, 1628–1643. doi: 10.1016/j.scitotenv.2017.12.258
Potts S. G., Imperatriz-Fonseca V., Ngo H. T., Aizen M. A., Biesmeijer J. C., Breeze T. D., et al. (2016a). Safeguarding pollinators and their values to human well-being. Nature 540, 220–229. doi: 10.1038/nature20588
Potts S. G., Imperatriz-Fonseca V., Ngo H. T., Biesmeijer J. C., Breeze T. D., Dicks L. V., et al. (2016b). The assessment report on pollinators, pollination and food production: summary for policymakers (Paris, France: Secretariat of the Intergovernmental Science-Policy Platform on Biodiversity).
Pyke G. H., Thomson J. D., Inouye D. W., and Miller T. J. (2016). Effects of climate change on phenologies and distributions of bumble bees and the plants they visit. Ecosphere 7, e01267. doi: 10.1002/ecs2.1267
Radloff S. E., Hepburn C., Hepburn H. R., Fuchs S., Hadisoesilo S., Tan K., et al. (2010). Population structure and classification of Apis cerana. Apidologie 41, 589–601. doi: 10.1051/apido/2010008
Radosavljevic A. and Anderson R. P. (2014). Making better Maxent models of species distributions: complexity, overfitting and evaluation. J. biogeography 41, 629–643. doi: 10.1111/jbi.12227
Raffiudin R., Salmah S., and Jambak J. (2020). “Distribution, nesting trees and genetic diversity of Apis andreniformis in West Sumatra,” in The future role of dwarf honeybees in natural and agricultural systems (Boca Raton, FL, USA: CRC Press), 279–293.
Rahimi E., Barghjelveh S., and Dong P. (2021). Estimating potential range shift of some wild bees in response to climate change scenarios in northwestern regions of Iran. J. Ecol. Environ. 45, 1–13. doi: 10.1186/s41610-021-00189-8
Rasmont P., Franzén M., Lecocq T., Harpke A., Roberts S. P., Biesmeijer J. C., et al. (2015). Climatic risk and distribution atlas of European bumblebees (Sofia, Bulgaria: Pensoft Publishers).
Régnière J., Powell J., Bentz B., and Nealis V. (2012). Effects of temperature on development, survival and reproduction of insects: experimental design, data analysis and modeling. J. Insect Physiol. 58, 634–647. doi: 10.1016/j.jinsphys.2012.01.010
Romero-Alvarez D., Escobar L. E., Varela S., Larkin D. J., and Phelps N. B. (2017). Forecasting distributions of an aquatic invasive species (Nitellopsis obtusa) under future climate scenarios. PloS One 12, e0180930. doi: 10.1371/journal.pone.0180930
Root T. L., Price J. T., Hall K. R., Schneider S. H., Rosenzweig C., and Pounds J. A. (2003). Fingerprints of global warming on wild animals and plants. Nature 421, 57–60. doi: 10.1038/nature01333
Roslin T., Hardwick B., Novotny V., Petry W. K., Andrew N. R., Asmus A., et al. (2017). Higher predation risk for insect prey at low latitudes and elevations. Science 356, 742–744. doi: 10.1126/science.aaj1631
Rotenberry J. T. and Balasubramaniam P. (2020). Connecting species’ geographical distributions to environmental variables: range maps versus observed points of occurrence. Ecography 43, 897–913. doi: 10.1111/ecog.04871
Santana J. P. A., Kumar L., Da Silva R. S., Pereira J. L., and Picanço M. C. (2019). Assessing the impact of climate change on the worldwide distribution of Dalbulus maidis (DeLong) using MaxEnt. Pest Manage. Sci. 75, 2706–2715. doi: 10.1002/ps.5379
Savage V. M., Gillooly J. F., Brown J. H., West G. B., and Charnov E. L. (2004). Effects of body size and temperature on population growth. Am. Nat. 163, 429–441. doi: 10.1086/381872
Seidl R., Thom D., Kautz M., Martin-Benito D., Peltoniemi M., Vacchiano G., et al. (2017). Forest disturbances under climate change. Nat. Climate Change 7, 395–402. doi: 10.1038/nclimate3303
Settele J., Bishop J., and Potts S. G. (2016). Climate change impacts on pollination. Nat. Plants 2, 1–3. doi: 10.1038/nplants.2016.92
Severns P. M. and Moldenke A. R. (2010). Management tradeoffs between focal species and biodiversity: endemic plant conservation and solitary bee extinction. Biodiversity Conserv. 19, 3605–3609. doi: 10.1007/s10531-010-9897-7
Sheldon K. S. (2019). Climate change in the tropics: ecological and evolutionary responses at low latitudes. Annu. Rev. Ecology Evolution Systematics 50, 303–333. doi: 10.1146/annurev-ecolsys-110218-025005
Shrestha U. B., Gautam S., and Bawa K. S. (2012). Widespread climate change in the Himalayas and associated changes in local ecosystems. PloS One 7, e36741. doi: 10.1371/journal.pone.0036741
Sinclair B. J., Vernon P., Klok C. J., and Chown S. L. (2003). Insects at low temperatures: an ecological perspective. Trends Ecol. Evol. 18, 257–262. doi: 10.1016/S0169-5347(03)00014-4
Sobek-Swant S., Kluza D. A., Cuddington K., and Lyons D. B. (2012). Potential distribution of emerald ash borer: What can we learn from ecological niche models using Maxent and GARP? For. Ecol. Manage. 281, 23–31. doi: 10.1016/j.foreco.2012.06.017
Soberón J. and Peterson A. T. (2005). Interpretation of models of fundamental ecological niches and species’ distributional areas. Biodiversity Inf. 2, 1–10. doi: 10.17161/bi.v2i0.4
Sodhi N. S., Koh L. P., Brook B. W., and Ng P. K. (2004). Southeast Asian biodiversity: an impending disaster. Trends Ecol. Evol. 19, 654–660. doi: 10.1016/j.tree.2004.09.006
Soroye P., Newbold T., and Kerr J. (2020). Climate change contributes to widespread declines among bumble bees across continents. Science 367, 685–688. doi: 10.1126/science.aax8591
Ssymank A., Kearns C., Pape T., and Thompson F. C. (2008). Pollinating flies (Diptera): a major contribution to plant diversity and agricultural production. Biodiversity 9, 86–89. doi: 10.1080/14888386.2008.9712892
Stiling P. (1988). Density-dependent processes and key factors in insect populations. J. Anim. Ecol. 57, 581–593. doi: 10.2307/4926
Suni S. S. and Dela Cruz K. (2021). Climate-associated shifts in color and body size for a tropical bee pollinator. Apidologie 52, 1–13. doi: 10.1007/s13592-021-00875-5
Switanek M., Crailsheim K., Truhetz H., and Brodschneider R. (2017). Modelling seasonal effects of temperature and precipitation on honey bee winter mortality in a temperate climate. Sci. Total Environ. 579, 1581–1587. doi: 10.1016/j.scitotenv.2016.11.178
Tang J., Li J., Lu H., Lu F., and Lu B. (2019). Potential distribution of an invasive pest, Eu platypus parallelus, in China as predicted by Maxent. Pest Manage. Sci. 75, 1630–1637. doi: 10.1002/ps.5280
Tang X., Yuan Y., Li X., and Zhang J. (2021a). Maximum entropy modeling to predict the impact of climate change on pine wilt disease in China. Front. Plant Sci. 12, 764. doi: 10.3389/fpls.2021.652500
Tang X., Yuan Y., Liu X., and Zhang J. (2021b). Potential range expansion and niche shift of the invasive Hyphantria cunea between native and invasive countries. Ecol. Entomology 46, 910–925. doi: 10.1111/een.13028
Tang X., Yuan Y., and Zhang J. (2020). How climate change will alter the distribution of suitable Dendrobium habitats. Front. Ecol. Evol. 8, 320. doi: 10.3389/fevo.2020.536339
Teixeira T. S., Weber M. M., Dias D., Lorini M. L., Esbérard C. E. L., Novaes R. L., et al. (2014). Combining environmental suitability and habitat connectivity to map rare or Data Deficient species in the Tropics. J. Nat. Conserv. 22, 384–390. doi: 10.1016/j.jnc.2014.04.001
Townsend Peterson A., Papeş M., and Eaton M. (2007). Transferability and model evaluation in ecological niche modeling: a comparison of GARP and Maxent. Ecography 30, 550–560. doi: 10.1111/j.0906-7590.2007.05102.x
Tscharntke T., Klein A. M., Kruess A., Steffan-Dewenter I., and Thies C. (2005). Landscape perspectives on agricultural intensification and biodiversity–ecosystem service management. Ecol. Lett. 8, 857–874. doi: 10.1111/j.1461-0248.2005.00782.x
Uden D. R., Allen C. R., Angeler D. G., Corral L., and Fricke K. A. (2015). Adaptive invasive species distribution models: a framework for modeling incipient invasions. Biol. invasions 17, 2831–2850. doi: 10.1007/s10530-015-0914-3
Vadrevu K. P., Lasko K., Giglio L., Schroeder W., Biswas S., and Justice C. (2019). Trends in vegetation fires in south and southeast Asian countries. Sci. Rep. 9, 1–13. doi: 10.1038/s41598-019-43940-x
Vanbergen A. J. and Initiative T. I. P. (2013). Threats to an ecosystem service: pressures on pollinators. Front. Ecol. Environ. 11, 251–259. doi: 10.1890/120126
Velasco J. A. and González-Salazar C. (2019). Akaike information criterion should not be a “test” of geographical prediction accuracy in ecological niche modelling. Ecol. Inf. 51, 25–32. doi: 10.1016/j.ecoinf.2019.02.005
Wallner W. (1987). Factors affecting insect population dynamics: differences between outbreak and non-outbreak species. Annu. Rev. entomology 32, 317–340. doi: 10.1146/annurev.en.32.010187.001533
Wang X., Huang X., Jiang L., and Qiao G. (2010). Predicting potential distribution of chestnut phylloxerid (Hemiptera: Phylloxeridae) based on GARP and Maxent ecological niche models. J. Appl. Entomology 134, 45–54. doi: 10.1111/j.1439-0418.2009.01447.x
Wang L., Pan Y., Cao Y., Li B., Wang Q., Wang B., et al. (2018). Detecting early signs of environmental degradation in protected areas: An example of Jiuzhaigou Nature Reserve, China. Ecol. Indic. 91, 287–298. doi: 10.1016/j.ecolind.2018.03.080
Wang Y., Xie B., Wan F., Xiao Q., and Dai L. (2007). Application of ROC curve analysis in evaluating the performance of alien species potential distribution models. Biodivers. Sci. 15, 365–372. doi: 10.1360/biodiv.060280
Wang Y., Zhao R., Zhou X., Zhang X., Zhao G., and Zhang F. (2023). Prediction of potential distribution areas and priority protected areas of Agastache rugosa based on Maxent model and Marxan model. Front. Plant Science. 14. doi: 10.3389/fpls.2023.1200796
Watanabe S., Hajima T., Sudo K., Nagashima T., Takemura T., Okajima H., et al. (2011). MIROC-ESM 2010: Model description and basic results of CMIP5-20c3m experiments. Geoscientific Model. Dev. 4, 845–872. doi: 10.5194/gmd-4-845-2011
Wen X., Fang G., Chai S., He C., Sun S., Zhao G., et al. (2024). Can ecological niche models be used to accurately predict the distribution of invasive insects? A case study of Hyphantria cunea in China. Ecol. Evol. 14. doi: 10.1002/ece3.11159
Wheeler P. and White N. (2002). Measuring dynamic topography: An analysis of Southeast Asia. Tectonics 21, 4–1-4-26. doi: 10.1029/2001TC900023
Willmer P. (2014). Climate change: bees and orchids lose touch. Curr. Biol. 24, R1133–R1135. doi: 10.1016/j.cub.2014.10.061
Willmer P. and Stone G. (2004). Behavioral, ecological, and physiological determinants of the activity patterns of bees. Adv. Study Behav. 34, 347–466. doi: 10.1016/S0065-3454(04)34009-X
Wisz M. S., Hijmans R., Li J., Peterson A. T., Graham C., Guisan A., et al. (2008). Effects of sample size on the performance of species distribution models. Diversity distributions 14, 763–773. doi: 10.1111/j.1472-4642.2008.00482.x
Yi Y.-J., Cheng X., Yang Z.-F., and Zhang S.-H. (2016). Maxent modeling for predicting the potential distribution of endangered medicinal plant (H. riparia Lour) in Yunnan, China. Ecol. Eng. 92, 260–269. doi: 10.1016/j.ecoleng.2016.04.010
Yuan Y., Tang X., Jia Z., Li C., Ma J., and Zhang J. (2020). The Effects of Ecological Factors on the Main Medicinal Components of Dendrobium officinale under Different Cultivation Modes. Forests 11, 94. doi: 10.3390/f11010094
Zhang J., Nielsen S. E., Stolar J., Chen Y., and Thuiller W. (2015). Gains and losses of plant species and phylogenetic diversity for a northern high-latitude region. Diversity Distributions 21, 1441–1454. doi: 10.1111/ddi.12365
Zhang Y., You Q., Chen C., and Ge J. (2016). Impacts of climate change on streamflows under RCP scenarios: A case study in Xin River Basin, China. Atmospheric Res. 178, 521–534. doi: 10.1016/j.atmosres.2016.04.018
Zhao G., Cui X., Sun J., Li T., Wang Q., Ye X., et al. (2021). Analysis of the distribution pattern of Chinese Ziziphus jujuba under climate change based on optimized biomod2 and MaxEnt models. Ecol. Indic. 132, 108256. doi: 10.1016/j.ecolind.2021.108256
Zhou H., Bi H., and Lin J. (2010). Comparative study on hydrological terrain parameters based on DEM using Rivertools and ArcGIS. J. Beijing Forestry Univ. 32, 101–105. doi: 10.13332/j.1000-1522.2010.03.041
Keywords: ecological niche modeling, maxent, general circulation models, pollinators, protected natural areas, climate changes
Citation: Tang X, He Z, Deng Y, Yuan Y and Zeng K (2025) Reduction in the potential distribution of bee species in low latitudes under different climate change scenarios: conservation implications. Front. Ecol. Evol. 13:1648496. doi: 10.3389/fevo.2025.1648496
Received: 18 June 2025; Accepted: 28 July 2025;
Published: 14 August 2025.
Edited by:
Ling Zhang, Jiangxi Agricultural University, ChinaReviewed by:
Guanghua Zhao, South China Normal University, ChinaYongji Wang, Shanxi Normal University, China
Copyright © 2025 Tang, He, Deng, Yuan and Zeng. This is an open-access article distributed under the terms of the Creative Commons Attribution License (CC BY). The use, distribution or reproduction in other forums is permitted, provided the original author(s) and the copyright owner(s) are credited and that the original publication in this journal is cited, in accordance with accepted academic practice. No use, distribution or reproduction is permitted which does not comply with these terms.
*Correspondence: Zheng He, anhjeHp4aHpAMTI2LmNvbQ==