 Ying Zheng
 Zixuan Zhang1,2
 Lei Dong
- 1Yinshanbeilu Grassland Eco-hydrology National Observation and Research Station, China Institute of Water Resources and Hydropower Research, Beijing, China
- 2Institute of Water Resources for Pastoral Area Ministry of Water Resources, Hohhot, China
- 3Institute of Sustainable Development, Huzhou University, Huzhou, China
The Chahannur Lake Basin is a crucial component of the ecological security barrier construction in northern China. Land use changes induced by high-intensity human activities have increasingly triggered a series of ecological and environmental issues, severely threatening the ecosystem health (EH) of the basin. Understanding the impact of land use changes on ecosystem health is of great significance for ecological conservation and territorial spatial planning. This study took the Chahannur Lake Basin as study area, analyzed the spatio-temporal evolution of land use over the past 30 years, systematically evaluated the EH level based on the vitality-organization-resilience-services (VORS) framework, and further revealed the impacts of land use structure and conversions between land use types on EH. The results indicated that (1) the most prominent land use changes were characterized by the continuous expansion of forest and construction land, as well as the sustained contraction in farmland area from 1990 to 2022. (2) The ecosystem of the basin was generally at a moderate healthy level, with a trend of first deteriorating and then gradually improving. The EH demonstrated the strongest positive response to the conversion of farmland to grassland, while grassland degradation and rapid urbanization were unfavorable for the maintenance of high-level EH. (3) Grassland and farmland were identified as the key land use types influencing EH, both exhibiting significant threshold effects. The proportion of grassland area exerted a positive promoting effect, with a threshold of 37.99%, beyond which the promoting effect would be progressively weakened. Farmland, by contrast, exhibited dual effect on EH, with its effect shifting from positive to negative beyond a critical threshold. Strengthening grassland ecosystem protection and restoration, appropriately promoting grassland area expansion, and restricting excessive farmland development are the core strategies to improve EH of the basin. These findings can provide scientific reference for ecological protection and restoration, land use optimization management, and sustainable development in ecologically fragile basin.
1 Introduction
Natural ecosystems provide abundant material foundation and ecological services for human survival and social development (Pan et al., 2021; Li et al., 2024b). Ecosystem health (EH) refers to the capacity of ecosystems to maintain their structural integrity, functional stability and to guarantee the sustainable supply of ecosystem services in the face of natural or anthropogenic disturbances (Ran et al., 2023; Gu et al., 2024). Maintaining a healthy ecosystem is fundamental to regional sustainable development (Li et al., 2021; Liu et al., 2023; Zhang et al., 2023). Land use change represents a primary pathway through which human activities directly impact ecosystems (Fang et al., 2022). Over the past decades, rapid socio-economic development and escalating land demand have drastically altered land use patterns. Natural ecosystems, particularly in fragile ecological regions, have been plagued by recurring ecological and environmental issues - such as land degradation, biodiversity loss, and decline in ecosystem functions - thereby exacerbating ecosystem degradation and posing severe threats to EH and sustainable development of human society (Ouyang et al., 2021; Ríos-Touma et al., 2022; Das et al., 2024). Therefore, scientific assessment of EH and revelation of the impacts of land use change on EH are crucial for optimizing territorial spatial governance and promoting stable and healthy development of ecosystem.
Establishing appropriate evaluation methods is crucial for regional EH assessment (Vollmer et al., 2016; Chen et al., 2023). Previous case studies on EH assessment primarily employed the species indicator method and the index system method (Zhao et al., 2019; Das et al., 2021). The former selects numerous typical biological species or biochemical indicators to reflect ecosystem health status (e.g., using fish, algae or waterfowl as biological indicators for wetland health assessment), which is suitable for evaluating specific natural ecosystem types (Xu et al., 2022; Huang et al., 2024). However, this method relies on extensive field monitoring data and proves challenging to apply at larger spatial scales. Additionally, it focuses on the internal health of ecosystems while rarely considering external influences (Luo et al., 2018). In contrast, the latter emphasizes socio-ecological processes, reflecting external pressures and threats to ecosystems. Owing to its comprehensiveness and high applicability, it has been widely adopted in practice, with the pressure-state-response (PSR) model and vigor-organization-resilience (VOR) model being most prevalent (Rapport and Singh, 2006; Khatun and Das, 2022). The PSR model emphasizes the causal relationship between natural environments and human society activities but fails to adequately capture ecosystem integrity and natural status (Tang et al., 2018). In 1992, Costanza (1992) developed the VOR model through integrating qualitative and quantitative analyses, which is suitable for complex ecosystems. However, this traditional VOR model is constrained by reflecting ecosystem natural attributes, insufficiently considers the integrity of regional human-land composite systems, and lacks effective linkage between ecosystems and social systems (Shu et al., 2021). With research advancements, ecosystem services have been incorporated as a new dimension into EH assessment. Based on the VOR framework, a novel evaluation framework of vigor-organization-resilience-services (VORS) has emerged (Bi et al., 2024), enabling more comprehensive assessment of ecosystem natural components and their capacity to meet human needs (Pan et al., 2020). Current EH assessment studies have gradually shifted from single ecosystems (e.g., wetlands, forests, rivers and grasslands) (Xu and Guo, 2015; Lausch et al., 2016; Cheng et al., 2018; Chen et al., 2019) to complex regional ecosystems (e.g., towns, cities, national scales) (He et al., 2019; Zhou et al., 2022; Li et al., 2024a). Notably, however, small basin ecosystems with fragile ecological environments remain understudied.
As a bridge between ecosystem processes and human activities, land use is increasingly recognized as a key driving factor of EH (Liao et al., 2018; Ran et al., 2022; Li et al., 2024a). Changes in land use configuration (e.g., alterations in stability, connectivity and integrity) and compositions (e.g., transitions between land use types) can not only transform surface physical properties but also affect material circulation and energy flow in ecosystems, thereby inducing significant changes in regional climate, soil, biodiversity, and hydrological water resources (Peng et al., 2019; Wang et al., 2020; Xie et al., 2020; Davison et al., 2021). These changes profoundly influence regional ecological processes and thus exert direct or indirect impacts on ecosystem health status (Xie et al., 2021; Ma et al., 2022). Current studies have focused on the impacts of natural factors (e.g., temperature, precipitation and topographic variables like elevation and slope) and socioeconomic factors (e.g., population, urbanization, overgrazing, and regional policies) on maintaining ecosystem health and stability (Shen et al., 2021). However, the influence of land use structure and conversions between different land use types on EH remains poorly understood, which to some extent restricts the formulation of ecological protection and territorial spatial planning policies. Therefore, research linking land use change to EH is crucial for developing sustainable land use management strategies and facilitating the implementation of ecological adaptive management.
The agro-pastoral ecotone in semi-arid regions serves as a core component of the ecological security barrier in northern China, playing a pivotal role in safeguarding national ecological security and facilitating the development of agriculture and animal husbandry. However, with the long-term irrational utilization of land resources, the region has been plagued by a series of ecological issues such as land degradation, water scarcity, and the deterioration of ecosystem service functions, posing serious challenges to regional ecosystem health, ecological security and sustainable development (Chen et al., 2022). The Chahannur Lake Basin is a typical ecologically fragile area within the semi-arid agro-pastoral ecotone, which is situated in the Beijing-Tianjin sandstorm source region, acting as a critical barrier against the southward expansion of the Otindag Sandy Land into the Beijing-Tianjin-Hebei region. The basin hosts a unique integration of grassland, wetland, and saline lake ecosystems, embodying a prominent ecological strategic status. Over the past decades, driven by accelerating socioeconomic development and increasingly intensive exploitation of land resources, the basin has experienced significant land cover transformations, manifesting as grassland degradation, gradual shrinkage of lake area, wetland loss, declining groundwater tables, and widespread land desertification and salinization. These ecological issues have severely compromised the basin’s ecosystem health and pose substantial threats to the ecological security of the Beijing-Tianjin-Hebei region (Chen et al., 2024; Xu et al., 2025). The Chahannur Lake Basin has been a key implementation area for ecological restoration programs since 2000s, such as the “Beijing-Tianjin Sandstorm Source Control Program”, “Grain for Green Program” (Wang et al., 2023). This study takes the Chahannur Lake Basin as the study area, examining the spatiotemporal dynamics of land use change from 1990 to 2022, conducting a quantitative assessment of EH status and its spatiotemporal evolution patterns using a VORS model framework, and systematically analyzing the impacts of land use structure and conversions between land use types on EH. The findings are expected to provide scientific insights for territorial spatial planning, ecosystem conservation strategies, and sustainable development policies in the semi-arid agro-pastoral ecotone.
2 Materials and methods
2.1 Study area
The Chahannur Lake Basin is located in the southeastern part of Inner Mongolia Autonomous Region, serving as the key area for territorial spatial ecological restoration in Inner Mongolia. The basin covers approximately 5,561 km², spanning geographical coordinates 41°14′~42°06′N and 113°18′~114°32′E (Figure 1). Landform types within the basin are predominantly low mountains and hills, intermontane basins, valley depressions and plains. The topography generally rises from the southeast toward other directions, with elevations ranging from 1,252 m to 1,817 m. The region is geographically distant from the ocean and belongs to typical temperate semi-arid continental monsoon climate, characterized by high temperature with concentrated precipitation in summer and dry, cold, windy conditions in winter. The basin has an annual mean temperature of approximately 4 °C, annual precipitation of about 351 mm, and annual mean evaporation of approximately 1,647 mm - nearly five times the precipitation amount. Due to agricultural irrigation and excessive groundwater extraction, water areas in the Chahannur Lake Basin have significantly shrunk, imposing notable pressure on the ecological environment.
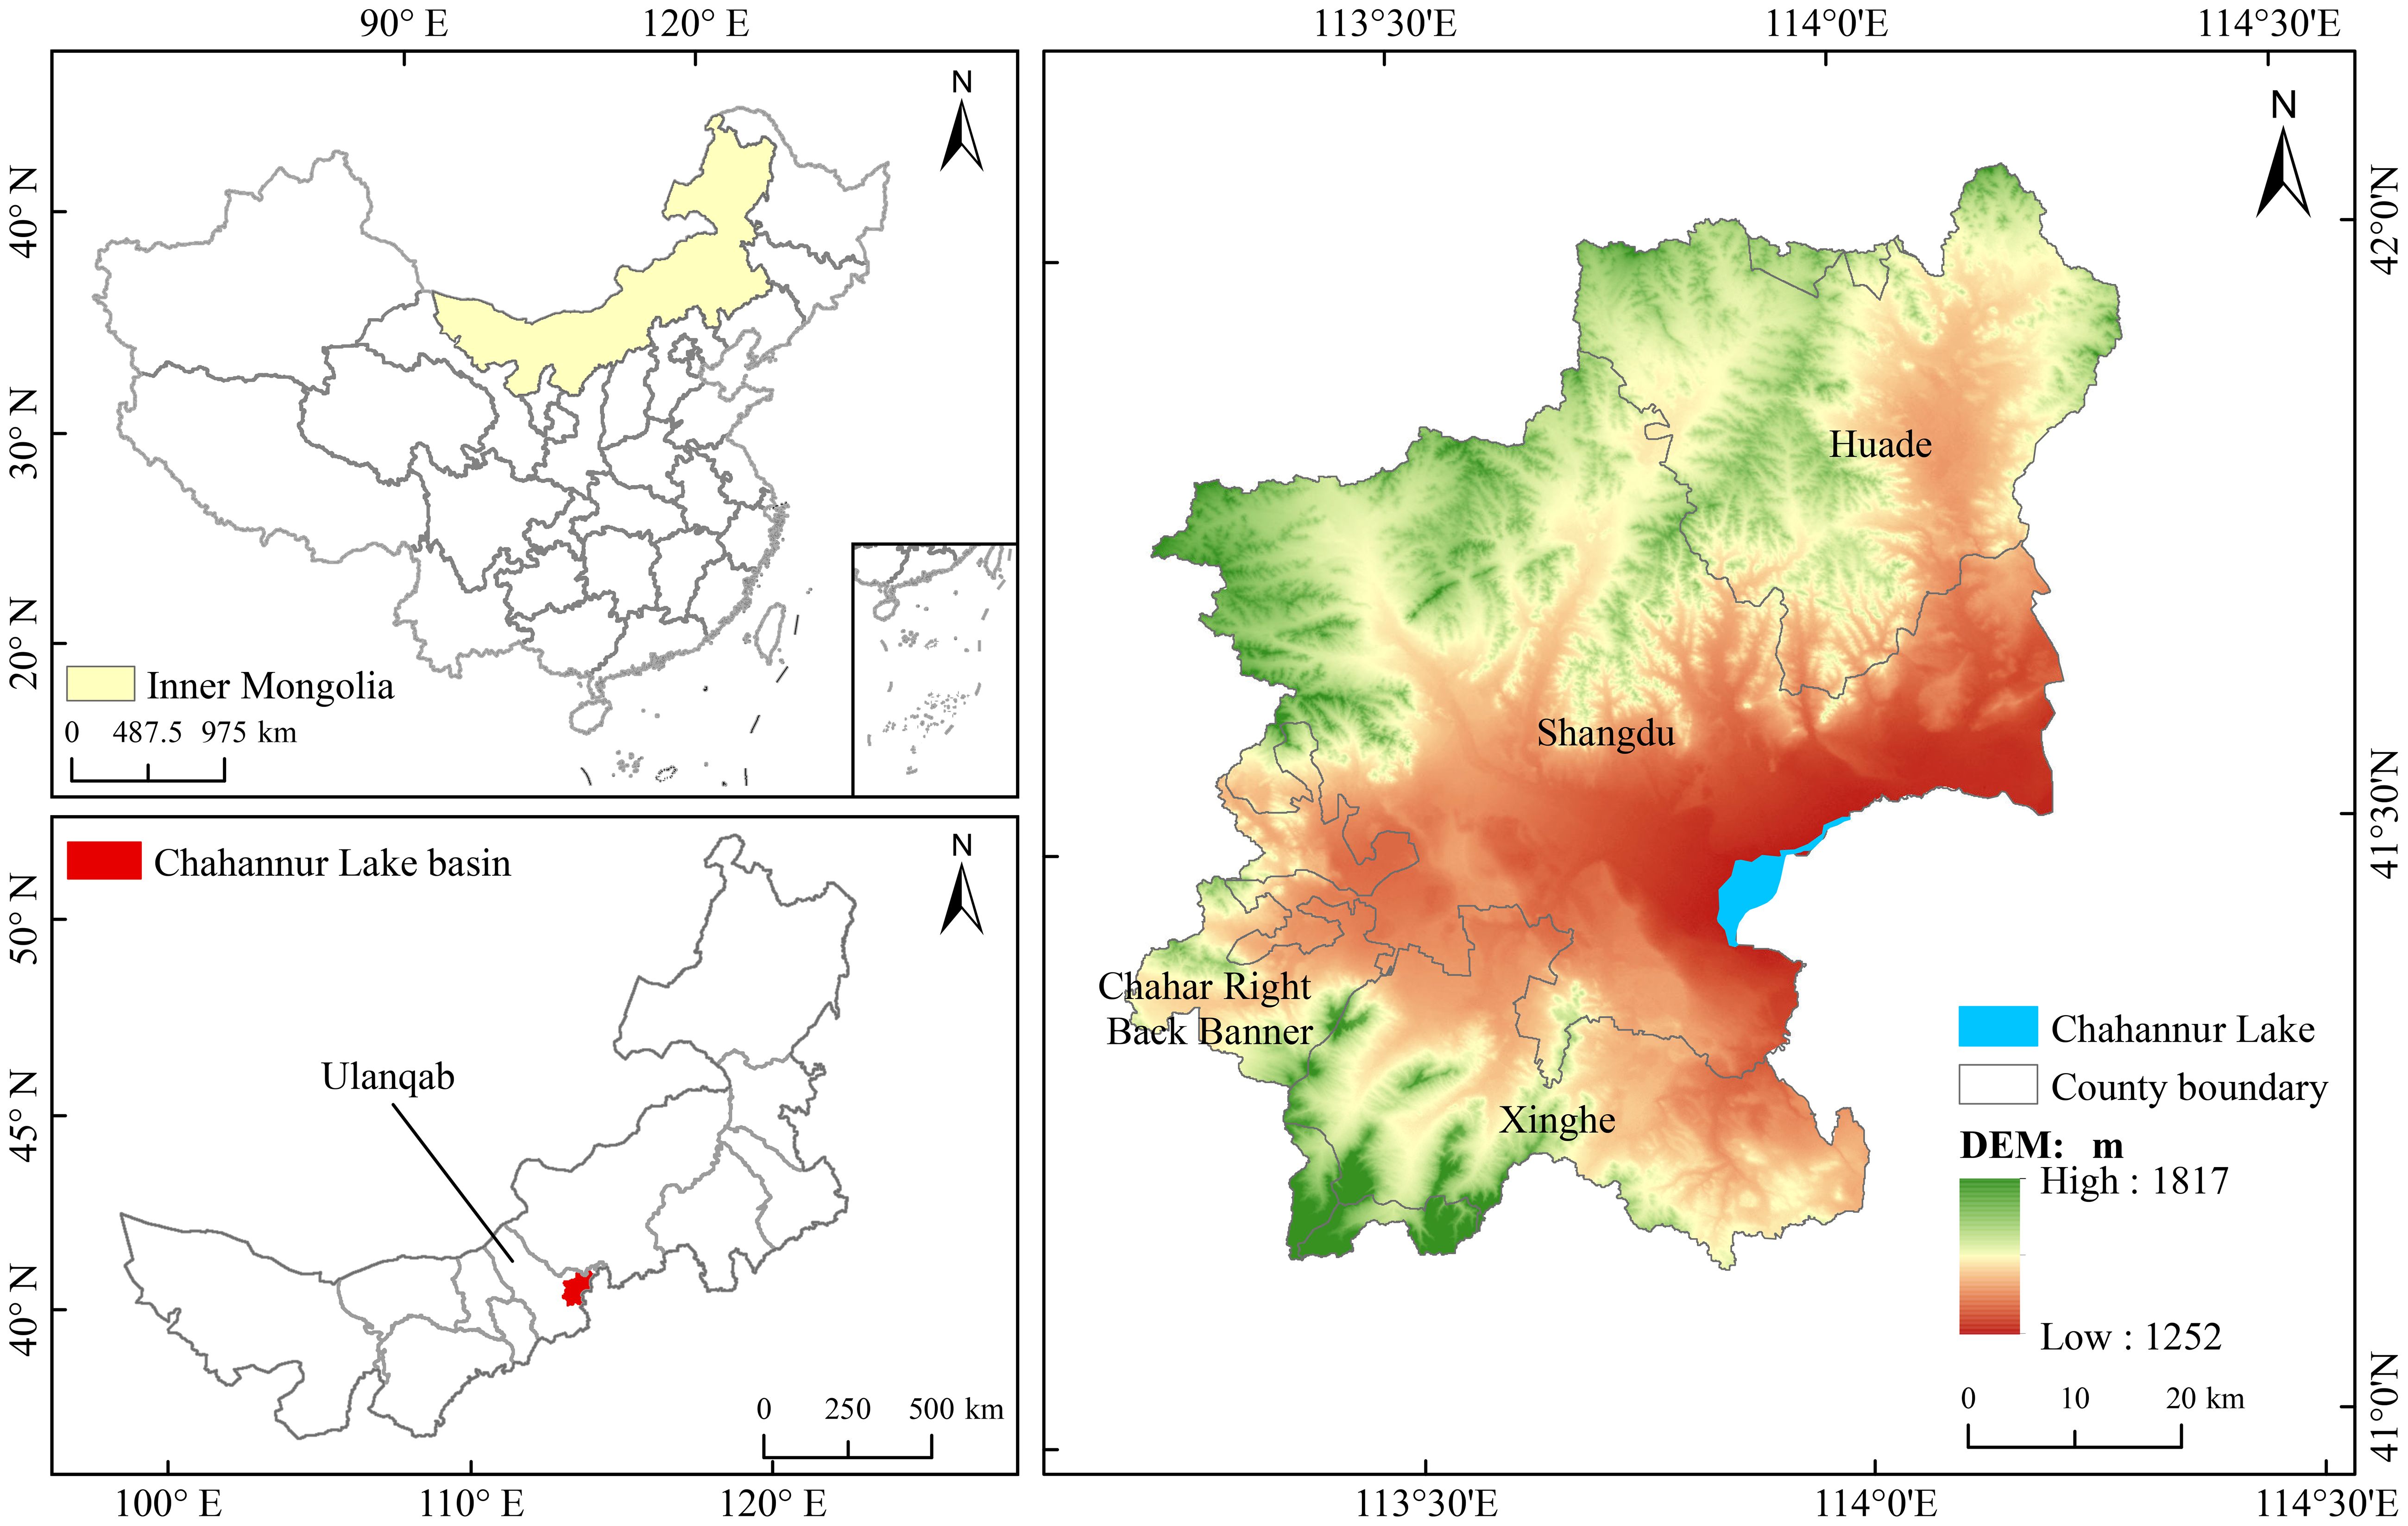
Figure 1. Location of the Chahannur Lake Basin.
2.2 Data source and pre-processing
The data employed in this study mainly include land use data and natural environment data. (1) Land use data: 30 m×30 m spatial resolution land use and land cover data were obtained from the Resource and Environment Science Data Center of the Chinese Academy of Sciences (https://www.resdc.cn/). (2) Natural environment data: 30 m×30 m resolution digital elevation model (DEM) and Landsat series remote sensing images were both acquired from the Geospatial Data Cloud (https://www.gscloud.cn/). Based on these remote sensing images, the Normalized Difference Vegetation Index (NDVI) was calculated using the near-infrared and red bands. Meteorological data were obtained from the annual spatial interpolation dataset of meteorological elements in China, with a spatial resolution of 1 km×1 km, provided by the Resource and Environment Science Data Center of the Chinese Academy of Sciences (https://www.resdc.cn/). All the above data were unified to the WGS_1984_UTM_Zone_49N geographic coordinate system with the help of ArcGIS 10.8 software. Low-resolution raster data were resampled to 30 m×30 m resolution. The time series of dynamic data cover the years 1990, 2000, 2010 and 2022.
2.3 Methodology
2.3.1 Ecological carrying capacity assessment
Ecosystem health emphasizes not only the integrity of ecosystem components, structure and functions, but also encompasses the capacity to continuously provide ecosystem services for human well-being. In this study, the “vigor-organization-resilience-service” (VORS) model (Peng et al., 2017; Wang et al., 2024) was adopted to construct an ecosystem health assessment framework for the Chahannur Lake Basin. The calculation formula is shown in Equation (1):
where EHI denotes the ecosystem health index; EV, EO, ER and ES represent ecosystem vigor, organization, resilience and service, respectively. To eliminate unit and dimensional discrepancies, each indicator was standardized using the range normalization method, with EV, EO, ER, and ES scaled to the range of 0~1. Currently, there remains a lack of unified standards for ecosystem health assessment classification. To accurately characterize ecosystem health status, the natural break method was used to categorize EHI into five levels from low to high (Zhu et al., 2023): weak (0~0.213), relatively weak (0.213~0.353), moderate (0.353~0.504), relatively well (0.504~0.651) and well (0.651~10.780).
2.3.1.1 Ecosystem vigor
Ecosystem vigor (EV) refers to the metabolism or primary productivity of an ecosystem, typically characterized by the Normalized Difference Vegetation Index (NDVI) (Shen et al., 2023) In this study, the maximum NDVI value during the peak growing season (July-September) was selected to quantify the ecosystem vigor index. The calculation formula is shown in Equation (2):
where NIR is the near-infrared band, and RED is the red band.
2.3.1.2 Ecosystem organization
Ecosystem organization (EO) refers to the structural stability of an ecosystem (Costanza, 2012). Generally, the more complex the ecosystem structure, the healthier the ecosystem. In this study, landscape pattern indices reflecting landscape heterogeneity, connectivity, and morphology were selected to characterize EO. Landscape pattern indices were first calculated using Fragstats 4.2 software, and then the EO index was derived via a weight coefficient model. The calculation formula is shown in Equation (3):
where LH、LC and IC denote landscape heterogeneity, connectivity and morphology, respectively; SHDI and SHEI represent the Shannon Diversity Index and Shannon Evenness Index, respectively; COHESION, LJI and CONTAG denote the Cohesion Index, Interspersion and Juxtaposition Index, and Contagion Index, respectively; and FRAC is Perimeter-Area Fractal Dimension.
2.3.1.3 Ecosystem resilience
Ecosystem resilience (ER) refers to the capacity of an ecosystem’s structure and functions to rebound to their original state following natural or anthropogenic interferences (Zeng et al., 2022), which can be described from two aspects: the ecosystem’s resistance and resilience to external stressors. The former denotes the ability of an ecosystem to resist external interferences, which can maintain the stability of its structure and function through self-regulation; the latter refers to the ability of an ecosystem to recover its original state after the suffering severe damage (Pan et al., 2021). Based on the contribution of each land use type to external disturbances and ecological recovery (Peng et al., 2017), ecological resilience and resistance coefficients were assigned to different land use types (Table 1). ER was then calculated as the area-weighted average of resilience and resistance coefficients for each land use type. The specific calculation formula is shown in Equation (4):
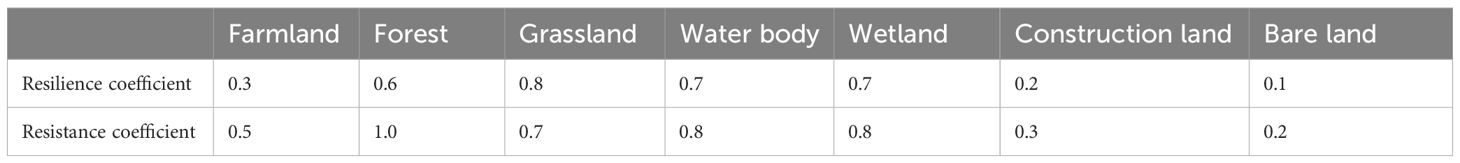
Table 1. Ecological resilience and resistance coefficient of different land use.
where Resil and Resist denote ecological resilience and resistance, respectively; Ai is the area of land use type i; n represents the number of land use types; and Cr,i and Ct,i are resilience coefficient and resistance coefficient for land use type i, respectively.
2.3.1.4 Ecosystem service
Ecosystem services (ES) refer to the capacity of ecosystems to provide essential products and services for human society (Zhang et al., 2025). Based on the basin’s characteristics and data availability, four key ecosystem services were selected: soil conservation, carbon storage, water yield, and habitat quality maintenance. These services were quantitively assessed using the InVEST model. To quantity the comprehensive ability of various ecosystem services, the comprehensive ecosystem service index was adopted (Laterra et al., 2012), calculated as the weighted summation of each normalized ecosystem service. The specific calculation formula is shown in Equation (5):
where CESI denotes the comprehensive ecosystem service index; Pi represents the standardized value of ecosystem service i; and Wi is the weight of ecosystem service i, which was determined using entropy method (Wang et al., 2021).
2.3.2 Impact of land use change on ecosystem health
2.3.2.1 Contribution of land use conversions to ecosystem health
The method advanced by Li et al. (2022) was employed to quantify the contribution degree of land use conversions to EHI changes, which can effectively identify the dominant land use transitions that exert positive or negative influences of on ecosystem health across different stages. The specific calculation formula is shown in Equation (6):
where EHCIij denotes the contribution index of the transition from land use type i to j to EHI change; Mij is the mean EHI change value in resulting from the conversion from land use type i to j; ΔQij is the conversion area from land use type i to j; and ΔS is the total conversion area. An EHCI>0 indicates a positive contribution to EHI change, with the magnitude of the contribution increasing as EHCI rises, conversely, EHCI < 0 signifies a negative contribution, where the degree of negative impact intensifies with decreasing EHCI.
2.3.2.2 Identification of key land use types influencing ecosystem health and their threshold effects
This study applied the random forest model to evaluate the contribution of different land use types to ecosystem health and identify key land use types at a 3 km × 3 km grid scale. Subsequently, using RStudio, a piecewise linear regression model was constructed with the average EHI as the dependent variable and the proportions of key land use types as the independent variables. This approach was used to determine the non-linear relationship between EH and the proportions of key land use types at the grid scale, as well as to identify how EH responds to the proportions of key land use types and their threshold values.
3 Results
3.1 Spatio-temporal changes of land use
As shown in Figure 2, farmland was the dominant land use type in the Chahannur Lake Basin from 1990 to 2022, comprising over 50% of the total area, followed by grassland (>36%). These two types exhibited a spatially interlaced distribution pattern. Construction land accounted for 4.68%-5.75%, with a scattered distribution. Bare land (3.17%-3.63%) was primarily concentrated in the central region—particularly around water bodies—where saline-alkali lands were largely distributed. Forest ranged from 2.07% to 2.56%, sporadically distributed in the central-southern area. Both water body and wetland accounted for merely 1%, with minimal fluctuations. Although the overall land use structure remained stable during the study period, individual land use type showed distinct changes. Notably, farmland area decreased most significantly (100.00 km²), dropping from 51.74% in 1990 to 49.94% in 2022—a trend reflecting the effectiveness of the implementation of the “Grain for Green” Program. In contrast, forest and construction land expanded (27.53 km² and 59.11 km², respectively), while grassland area remained nearly unchanged. Wetland and bare land areas increased slightly, and water body area displayed a trend of initial decline followed by recovery.
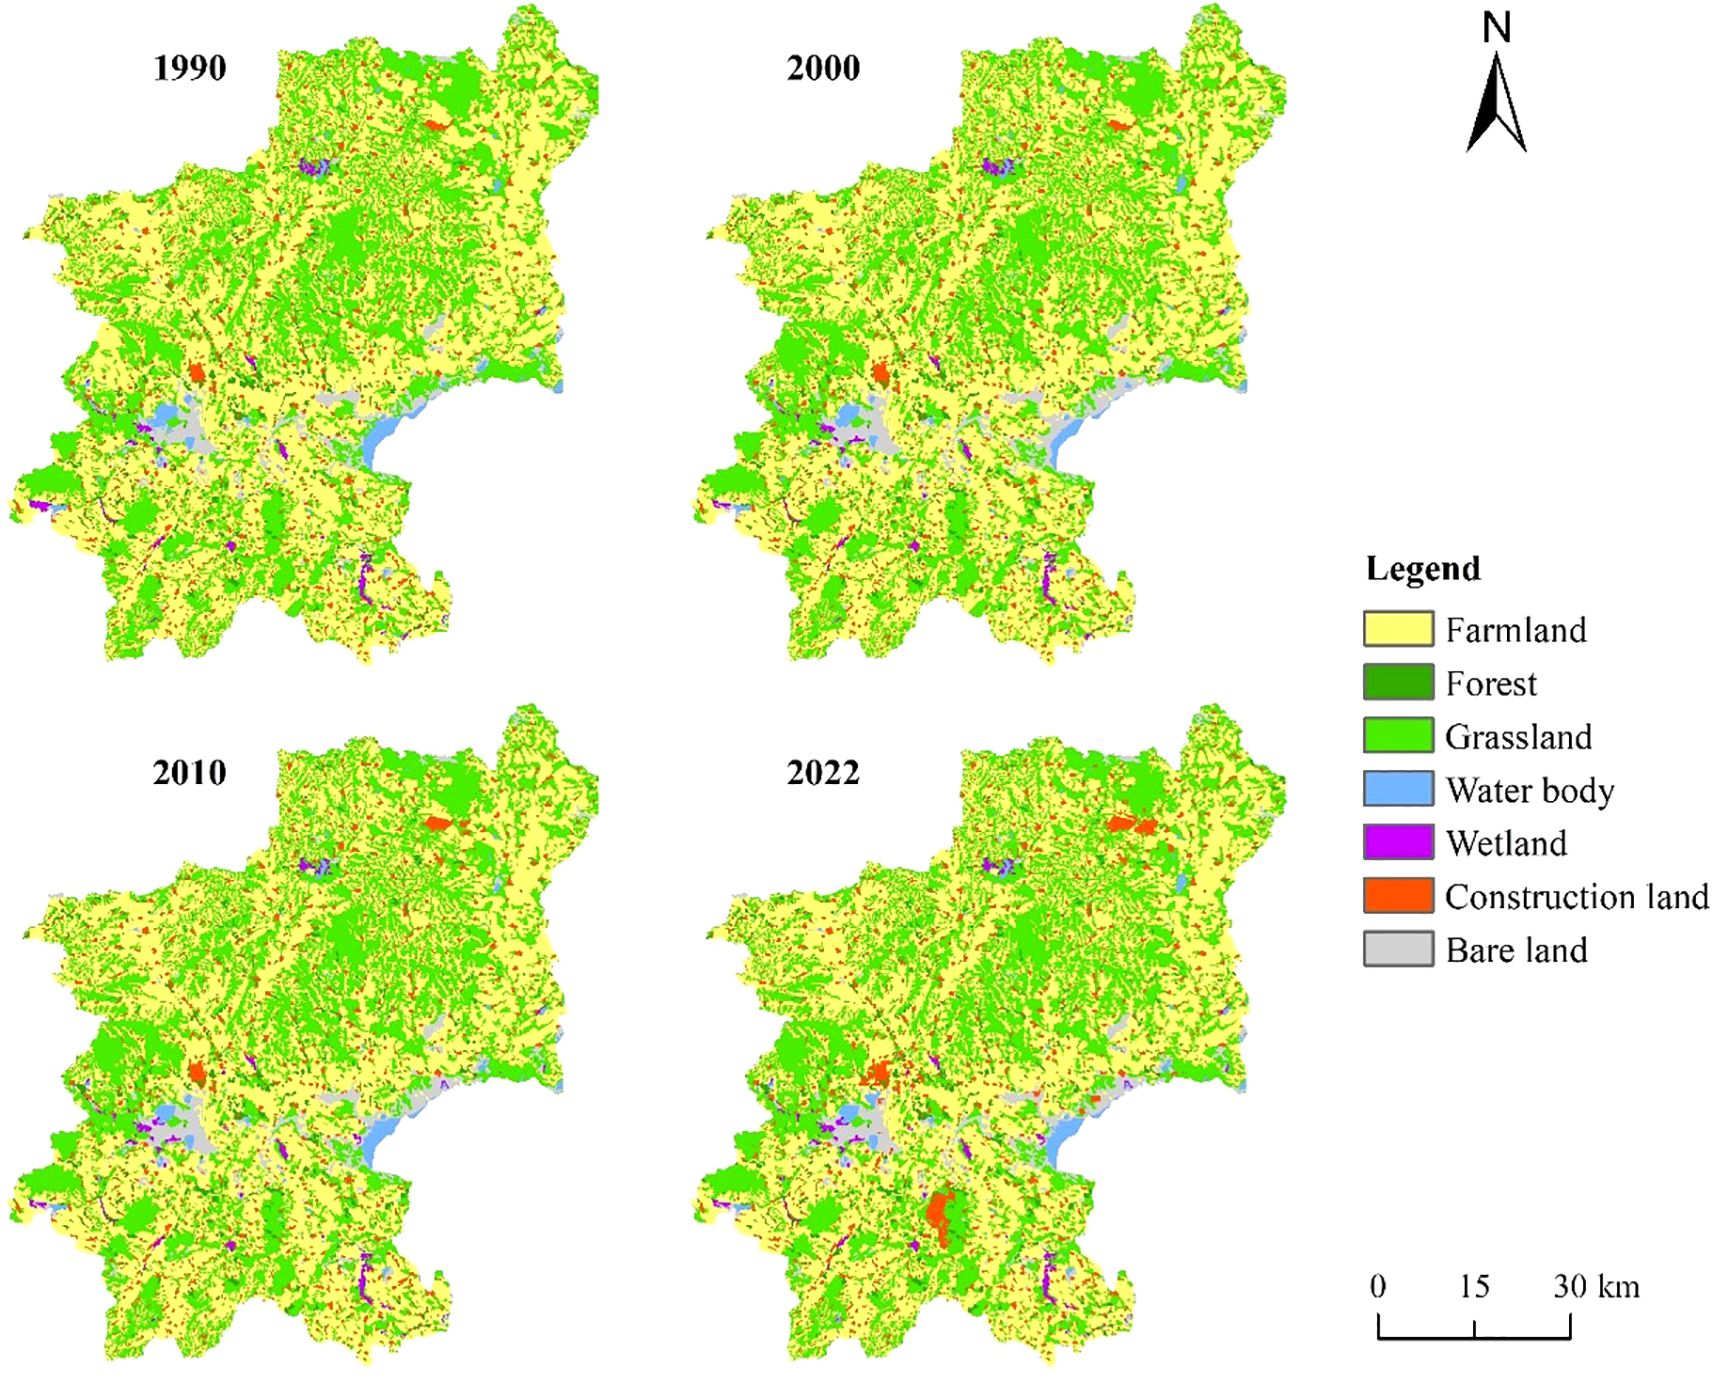
Figure 2. Spatial pattern of land use in the Chahannur Lake Basin during 1990-2022.
Figure 3 illustrates that land use transitions in the basin from 1990 to 2022 were dominated by conversions among farmland, grassland and construction land. Farmland was the primary land use type for out-transfers, with a cumulative area of 189.05 km². Reductions in farmland was mainly converted to grassland (132.48 km²), construction land (40.12 km²) and forest (13.33 km²). Grassland primarily transitioned to farmland (80.49 km²), bare land (19.44 km²) and construction land (14.54 km²). However, the implementation of ecological conservation projects promoted substantial farmland-to-grassland conversions, making grassland the main in-transferred type. Forest area expansion originated from farmland and grassland conversions, with areas of 13.33km² and 21.17 km², respectively. Construction land expansion primarily resulted from the occupation of farmland and grassland, with areas of 40.12 km² and 14.54 km², respectively.
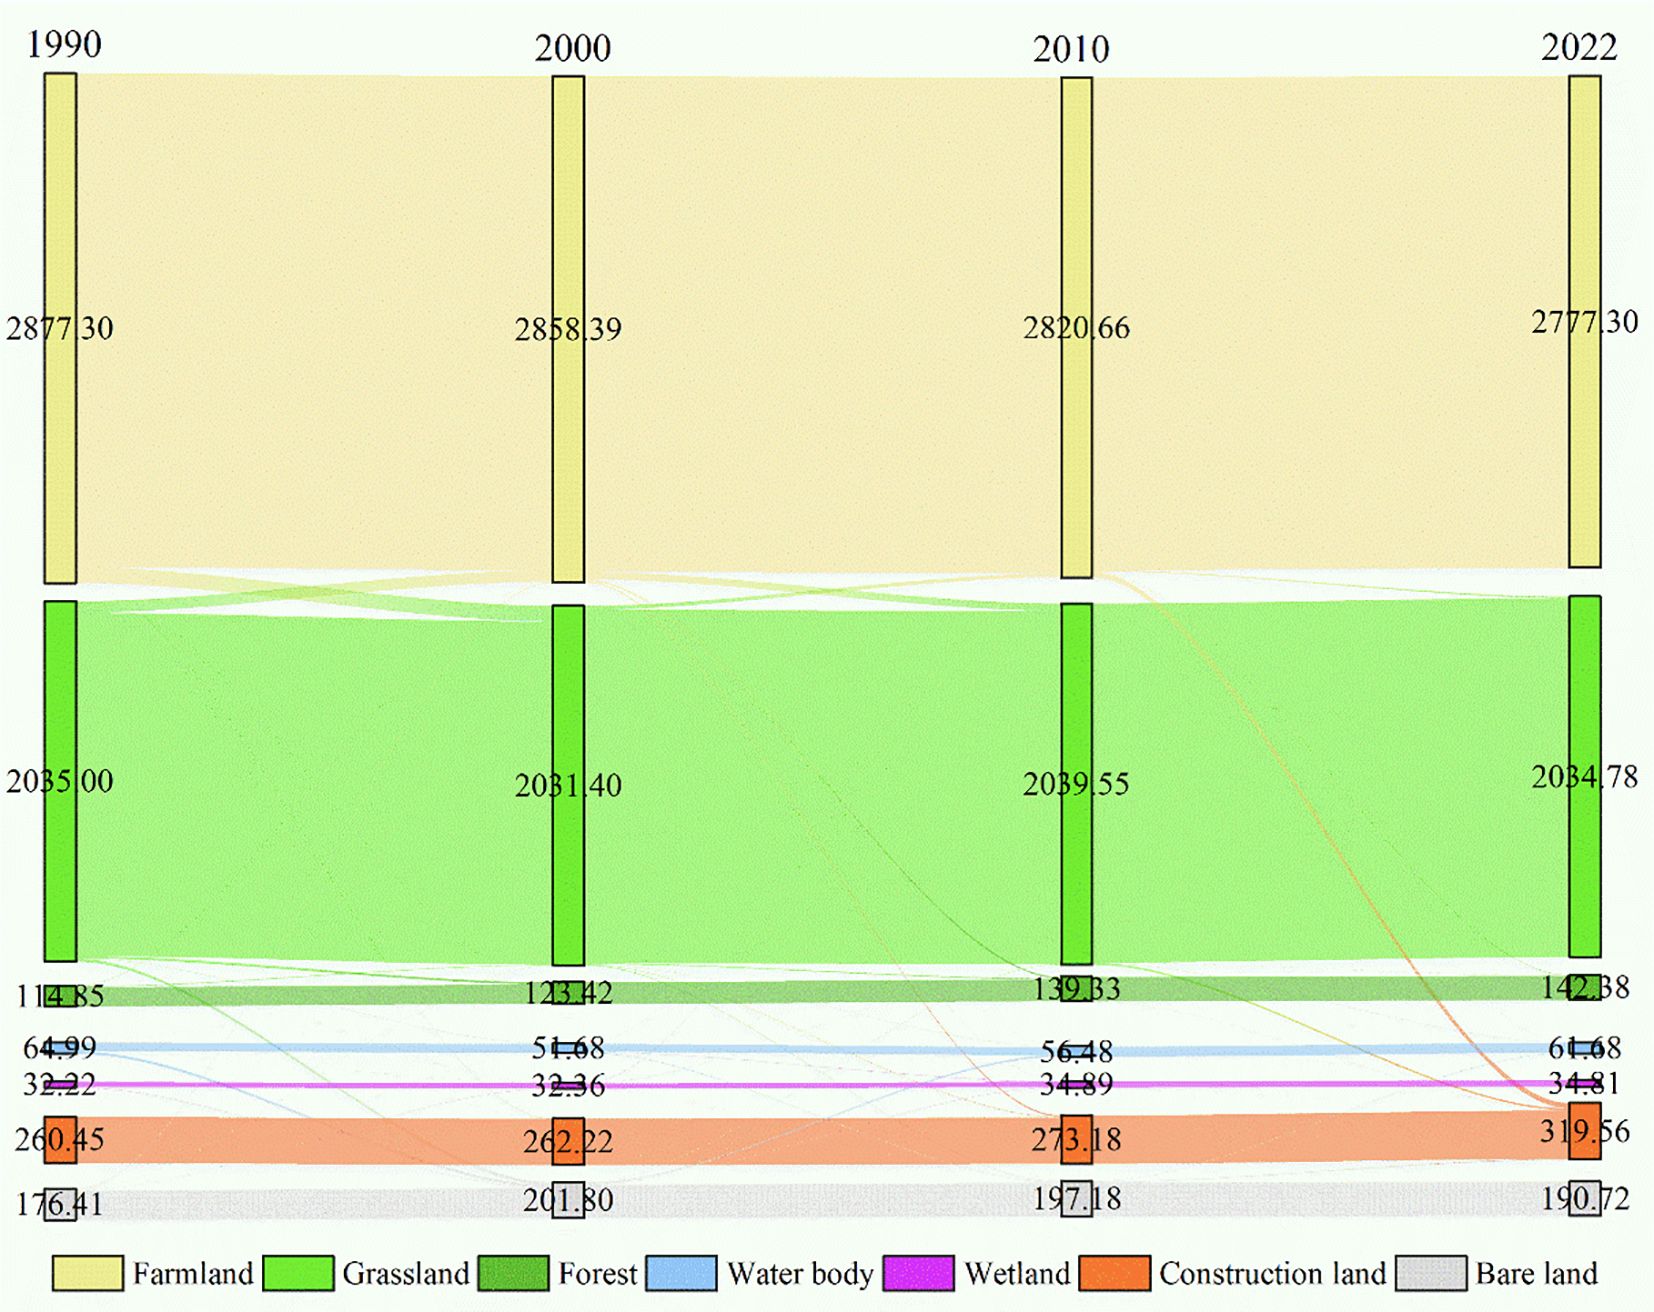
Figure 3. Land use transfer matrix in the Chahannur Lake Basin during 1990-2022.
3.2 Spatial patterns and evolution of ecosystem health
The EHI for 1990–2022 was calculated using the VORS model. As shown in Figure 4, the Chahannur Lake Basin generally exhibited a moderate ecosystem health level. The EHI showed spatially heterogeneous distribution patterns. Areas with well and relatively well grades were mostly concentrated in the low mountains and hills of the southern regions, as well as the intermontane basins of the southern and northwestern regions, where grasslands were largely distributed and vegetation coverage was relatively high. In contrast, areas with weak and relatively weak grades were scattered without obvious aggregation characteristics, primarily dominated by saline-alkali lands and construction land, where fragile ecological environments were highly vulnerable to climate change and human disturbances.
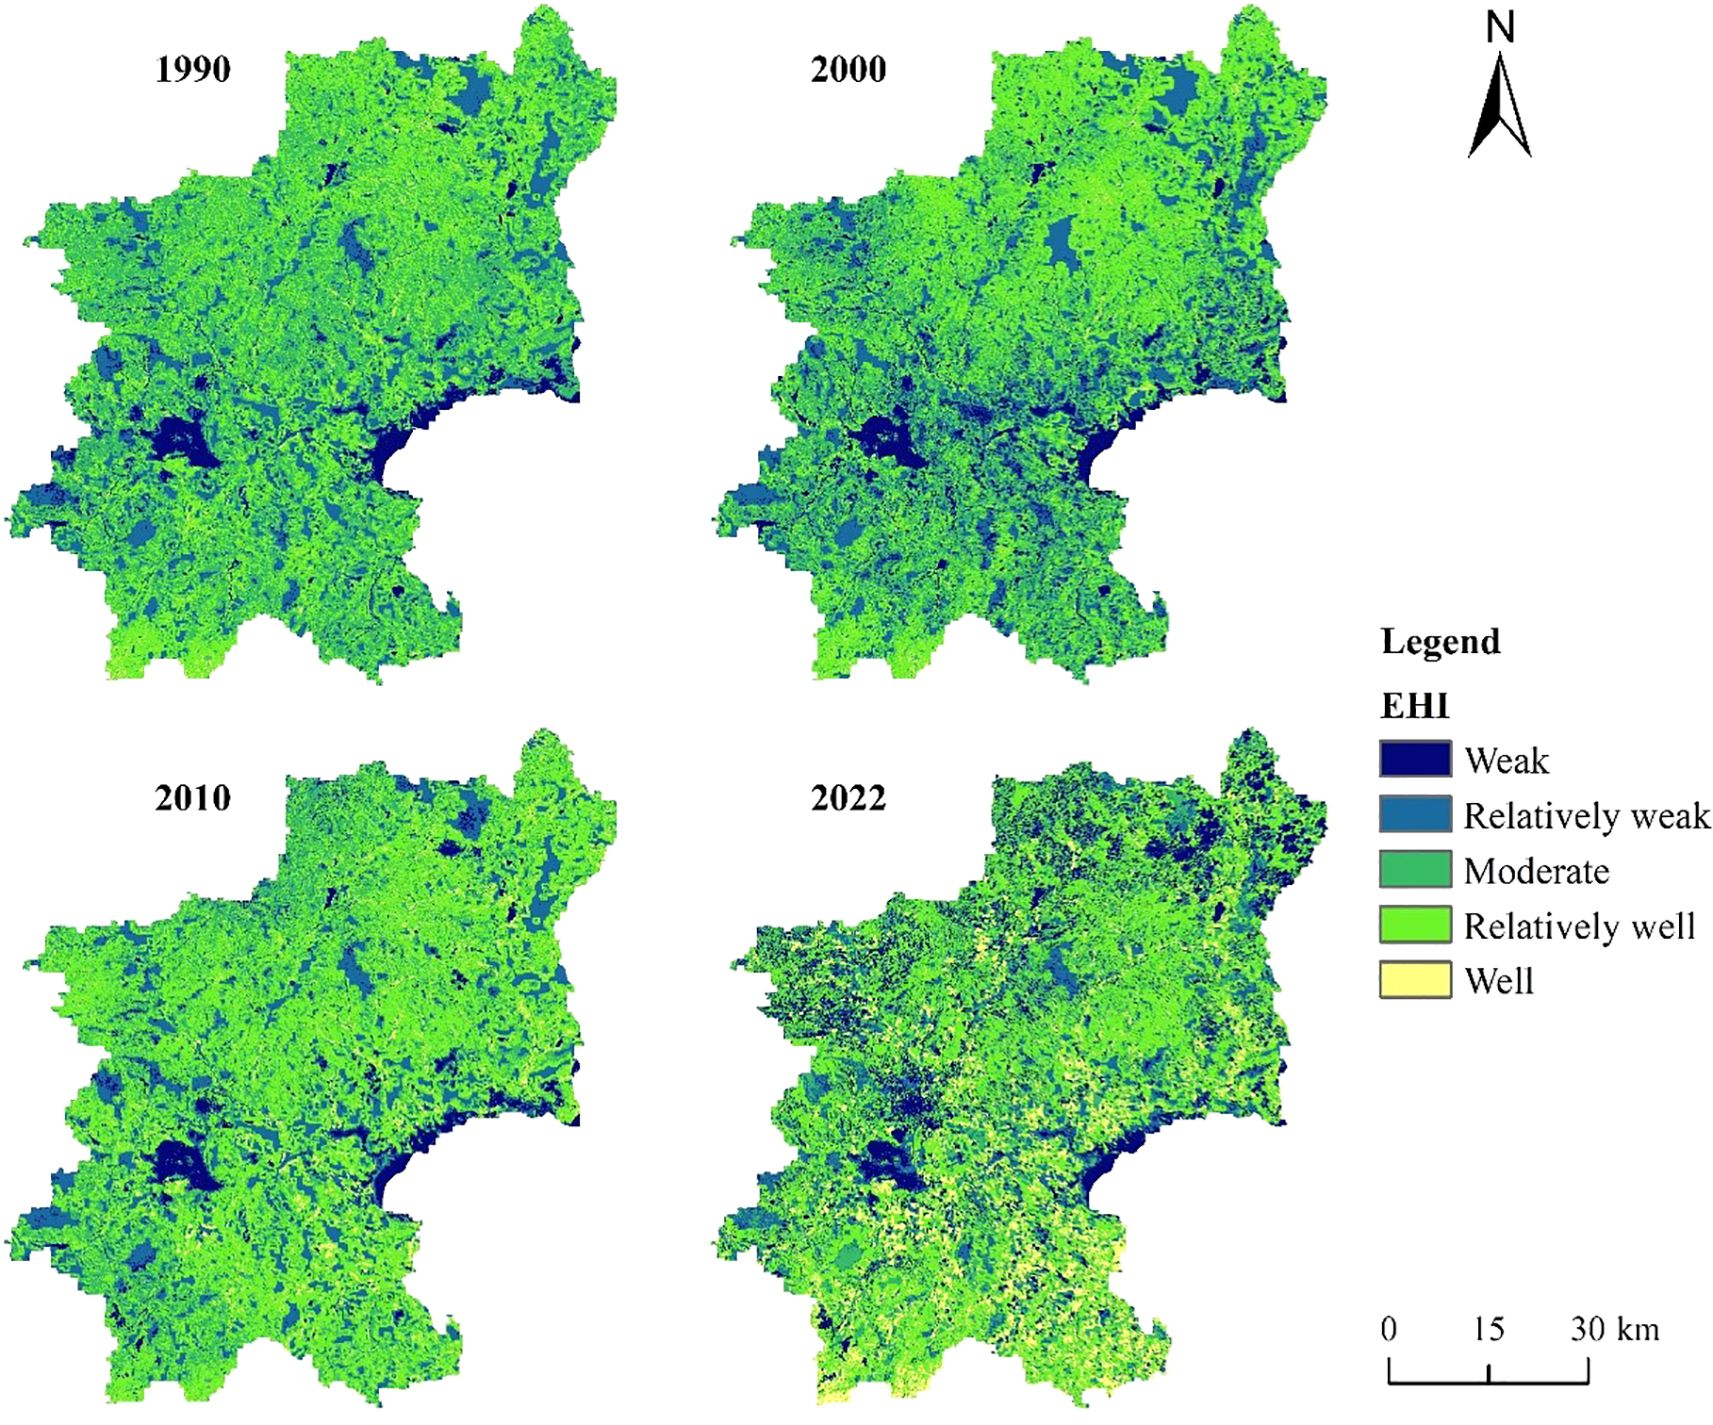
Figure 4. Spatial distribution of ecosystem health index in the Chahannur Lake Basin during 1990-2022.
Figure 5 shows the temporal dynamics of ecosystem health in the Chahannur Lake Basin. Throughout the study period, the EHI of the overall basin showed a fluctuating trend, with mean values in 1990, 2000, 2010, and 2022 were 0.337, 0.325, 0.361, and 0.363, respectively, indicating an overall improvement in ecological environment. Based on variations in EHI and the implementation time nodes of ecological projects (various ecological conservation programs have been implemented since 2000), the EHI evolution could be divided into three phases: pre-implementation (1990-2000, ecological degradation period), mid-implementation (2000-2010, ecological recovery period), and post-implementation (2010-2022, ecological stability period).
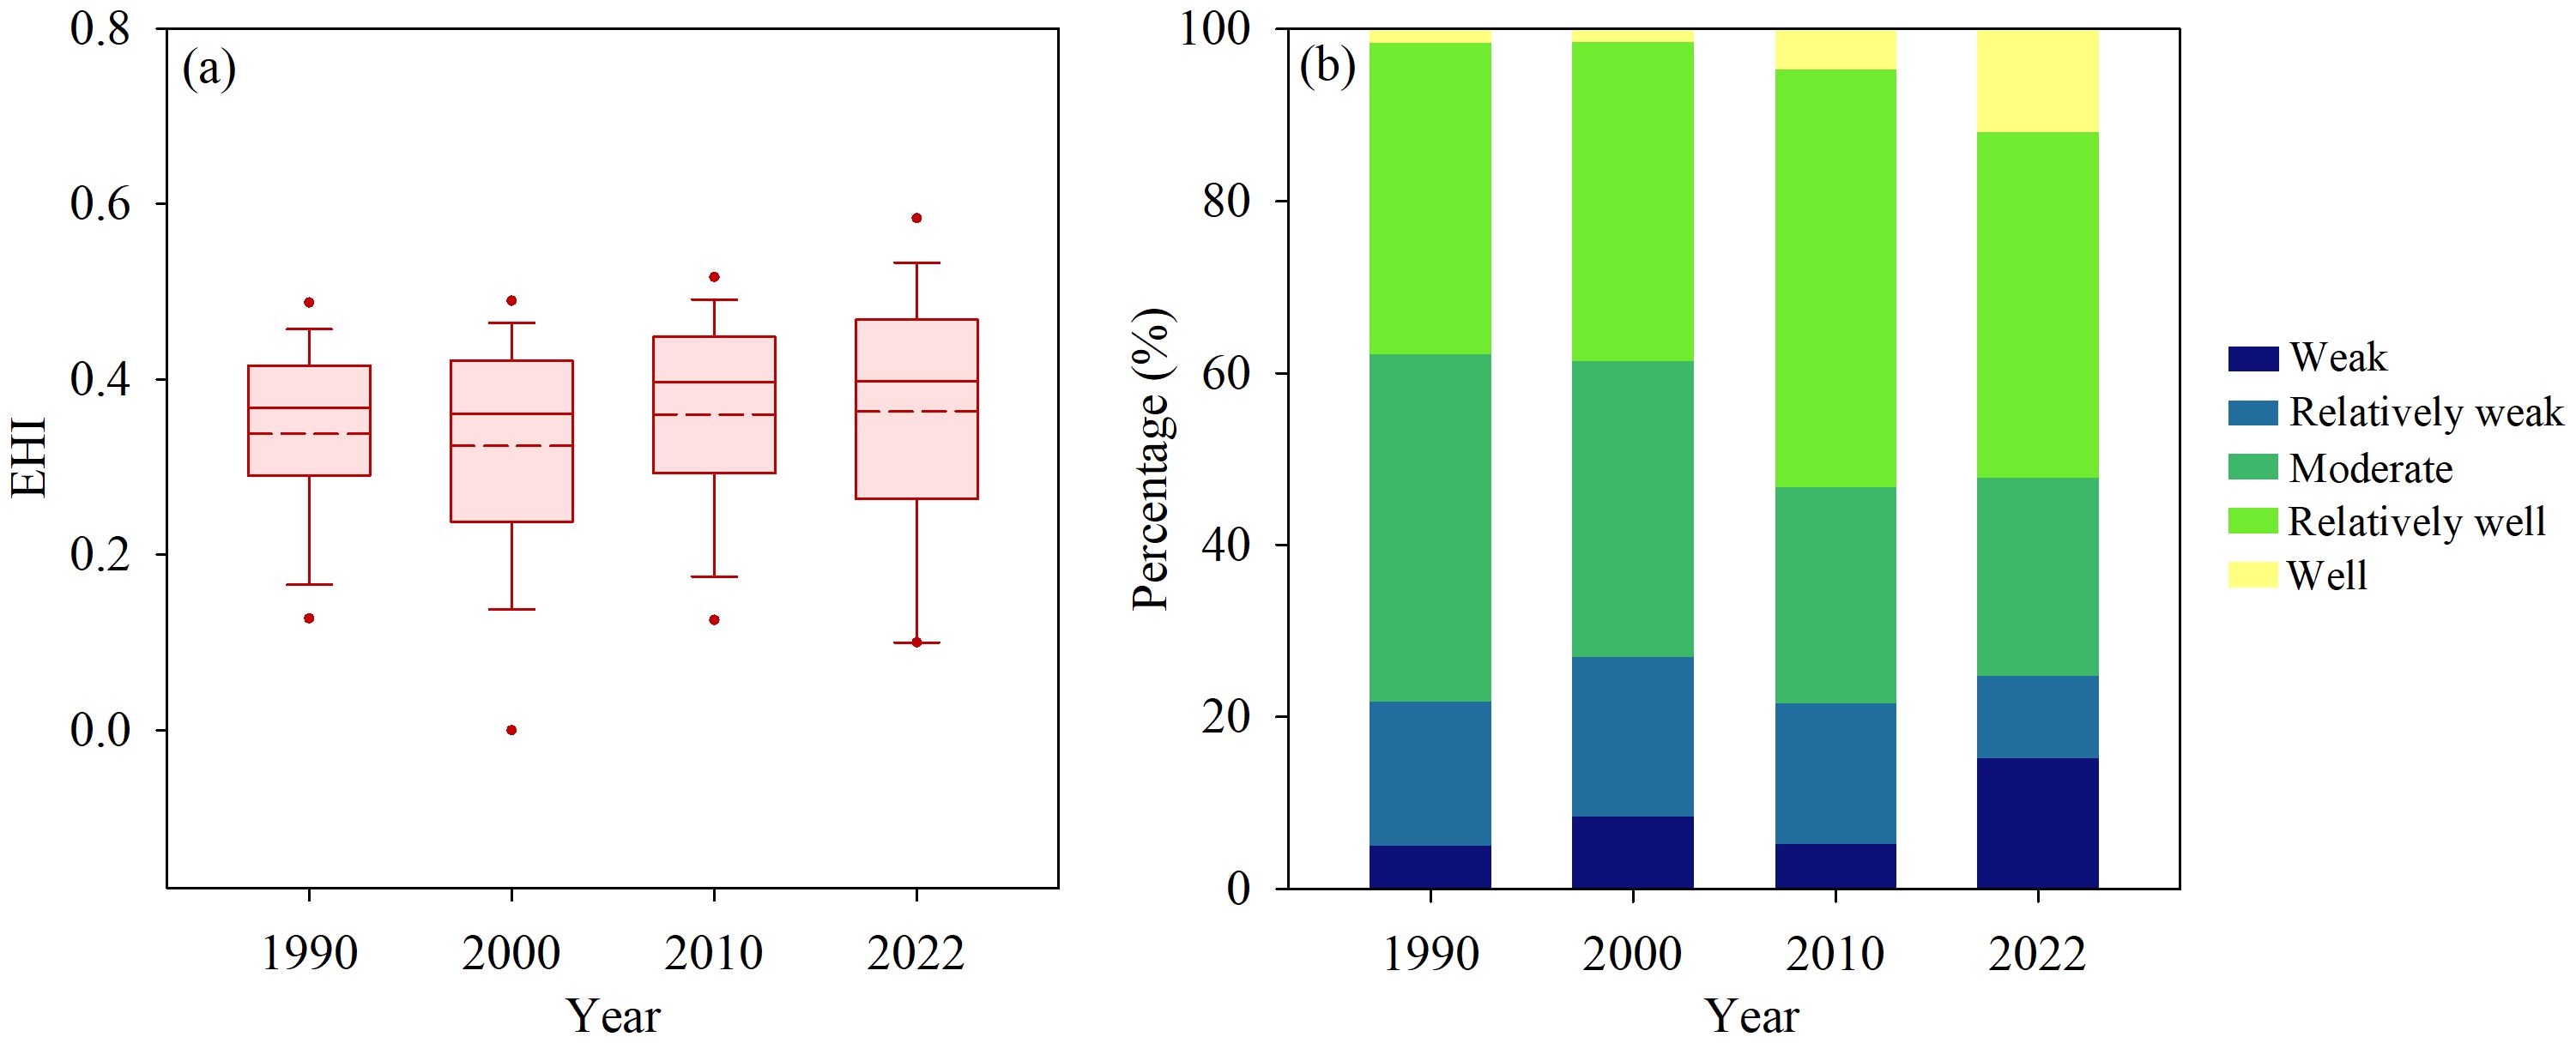
Figure 5. (a) Temporal variation of the ecosystem health index (EHI) in the Chahannur Lake Basin from 1990 to 2022. In the box plot, the solid line and dashed line represent the median and mean values, respectively. (b) Area proportions of different EHI levels in the Chahannur Lake Basin from 1990 to 2022.
Specifically, during the ecological degradation period, the basin’s EHI was largely declined, with the combined area of relatively weak and weak health grades increasing from 21.78% in 1990 to 27.00% in 2000. This was primarily driven by the degradation of moderate grade areas, leading to a gradual ecological deterioration. From 2000 to 2010, the basin’s ecological health improved rapidly, with EHI increasing by 11.08% by 2010. This suggests that the early-stage ecological projects had a significant positive impact on the improvement of ecological environment, substantially enhancing overall ecosystem health level. During 2010-2022, the EHI continued its steady upward trend, with the well grade area significantly increasing to 11.92%. However, it is noteworthy that the weak grade area also increased substantially, primarily due to construction land expansion encroaching on natural landscapes, causing persistent health decline in these regions. Concurrently, grassland degradation in some areas further exacerbated a deterioration of ecosystem health.
3.3 Impacts of land use transitions on ecosystem health
We assessed the contribution of land use transitions to ecosystem health (Figure 6). Overall, the conversion of farmland to grassland made the most substantial contribution to EHI change during 1990-2022, displaying a positive impact (EHCI = 0.1346). This finding highlights the effectiveness of the implementation of ecological protection policies in improving the basin’s ecosystem health. Additionally, transitions from bare land to farmland and grassland also exhibited notable positive effects on EHI, with EHCI values of 0.0117 and 0.0111, respectively. Conversely, although transitions of grassland to bare land and construction land also contributed largely to ecosystem health changes, they exerted negative impacts, with EHCI values of -0.0252 and -0.0212, respectively, followed by farmland-to-construction land transitions (EHCI=-0.0211), indicating that grassland degradation and rapid urbanization exacerbated ecological degradation and were detrimental to maintaining high-level ecosystem health in the basin.
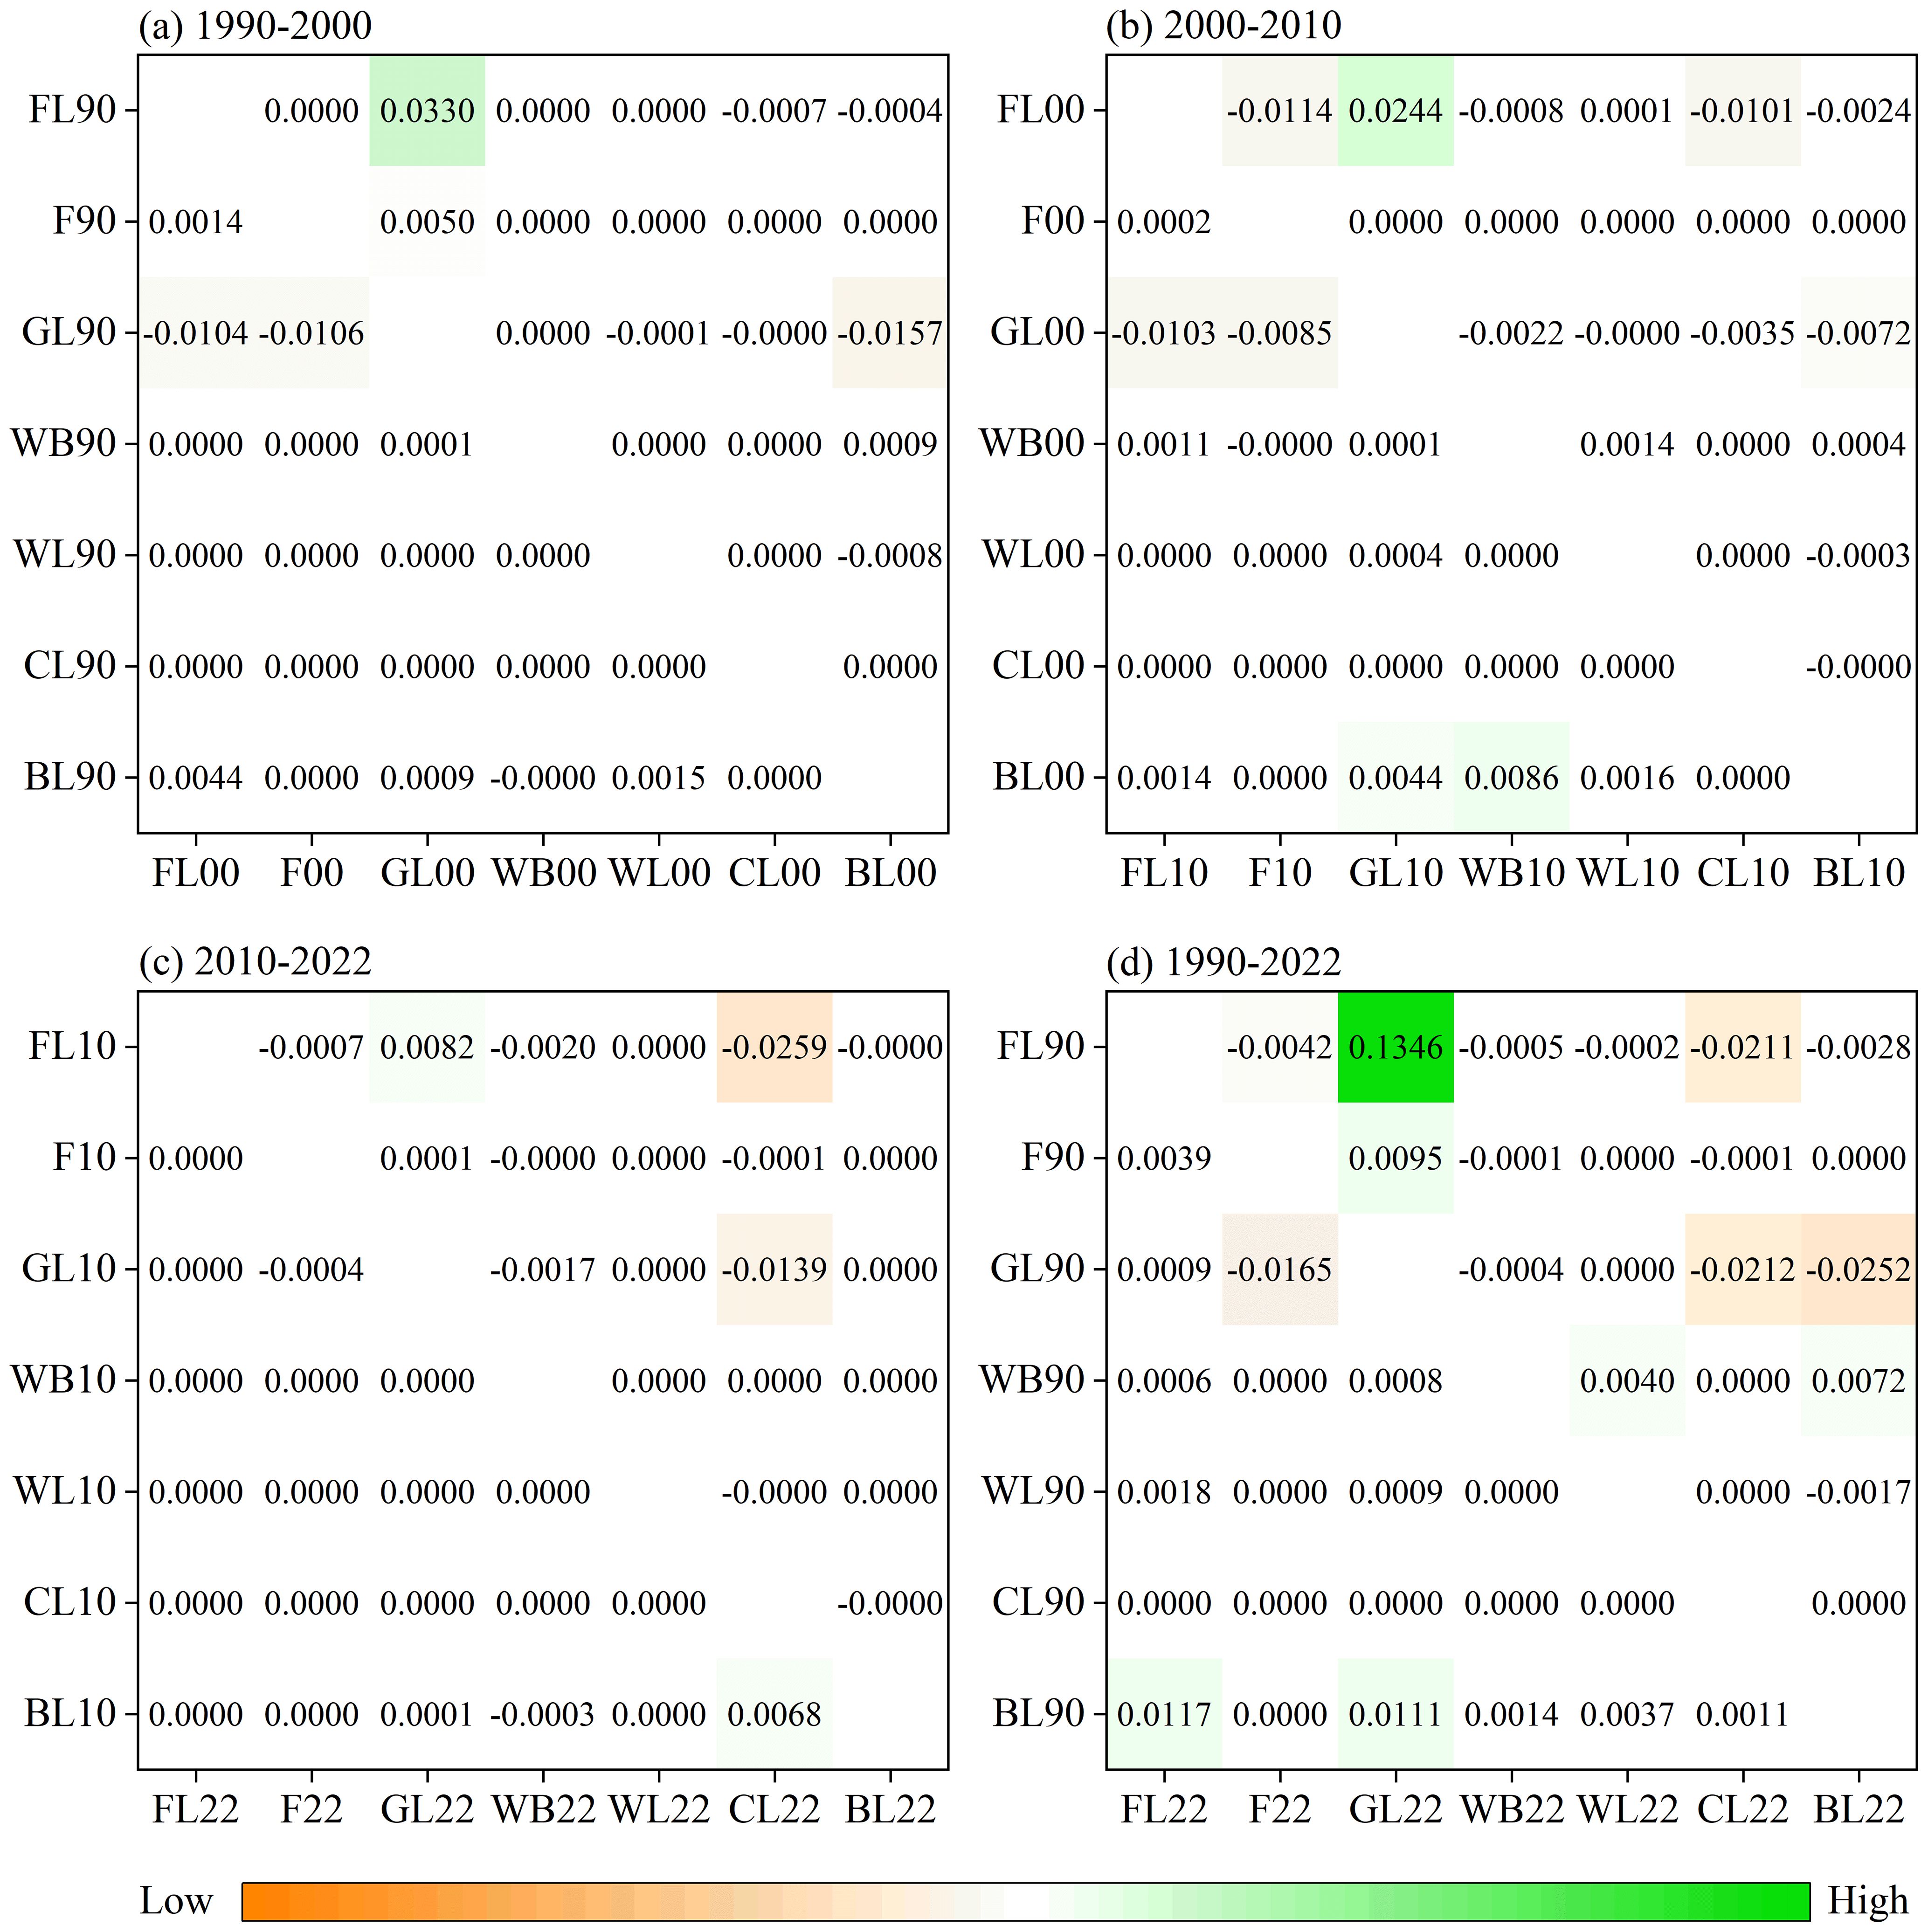
Figure 6. The contribution index of land use conversions to ecosystem health during 1990-2022. The horizontal and vertical axes represent various land use types in different years, respectively. FL, farmland; F, forest; GL, grassland; WB, water body; WL, wetland; CL, construction land; BL, bare land. 1990, 2000, 2010 and 2022 are labeled as “90”, “00”, “10” and “22” respectively on the axis of the figure.
3.4 Impact of land use structure on ecosystem health
Figure 7 shows the contribution of different land use types to ecosystem health, with grassland exhibiting the highest contribution to the EHI, followed by farmland. Thus, grassland and farmland were identified as the key land use types influencing ecosystem health in the basin. Figure 8 reveals a significant non-linear relationship between the EHI and area proportions of key land use types. The grassland area proportion had a significant positive effect on ecosystem health. When the proportion was below 37.99%, an increase in grassland area led to a rapid rise in EHI, however, exceeding this threshold weakened the rate of EHI increase. The farmland area proportion also had a threshold effect on EHI. When the farmland area proportion was below 50.51%, expanding farmland positively influenced EHI, conversely, exceeding this threshold resulted in a negative impact of farmland expansion on EHI.
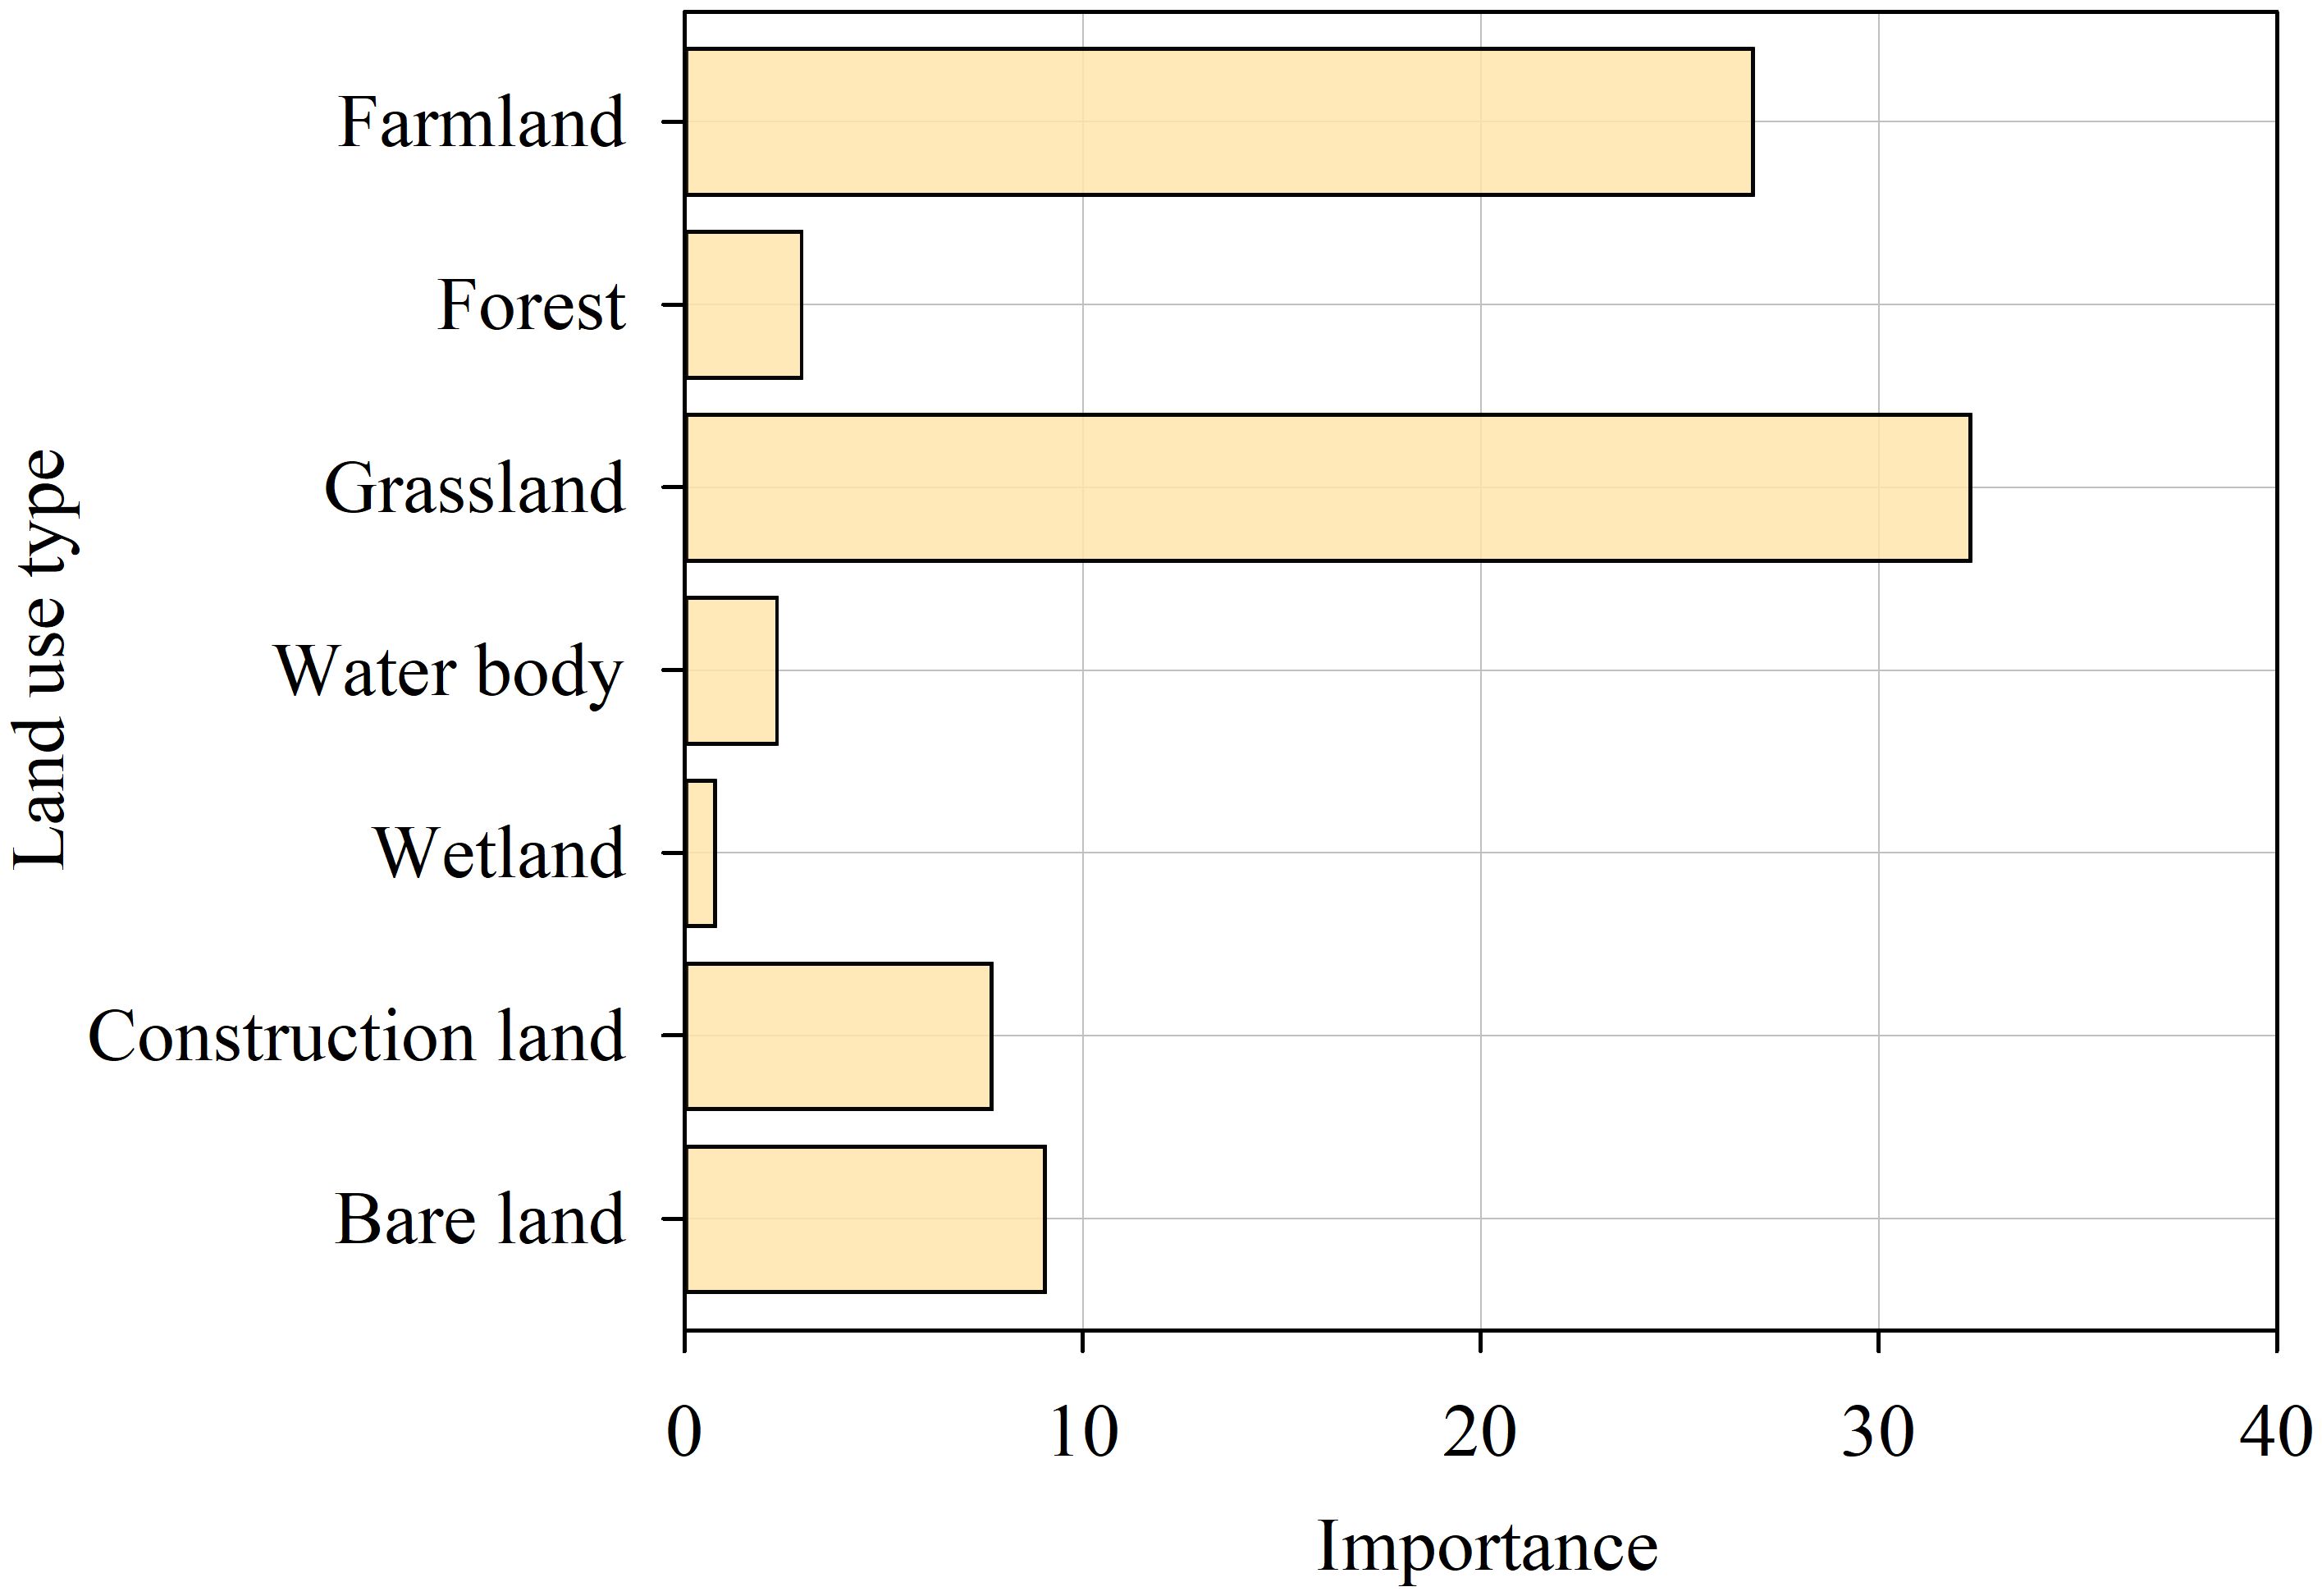
Figure 7. Identification of key land use types affecting ecosystem health.
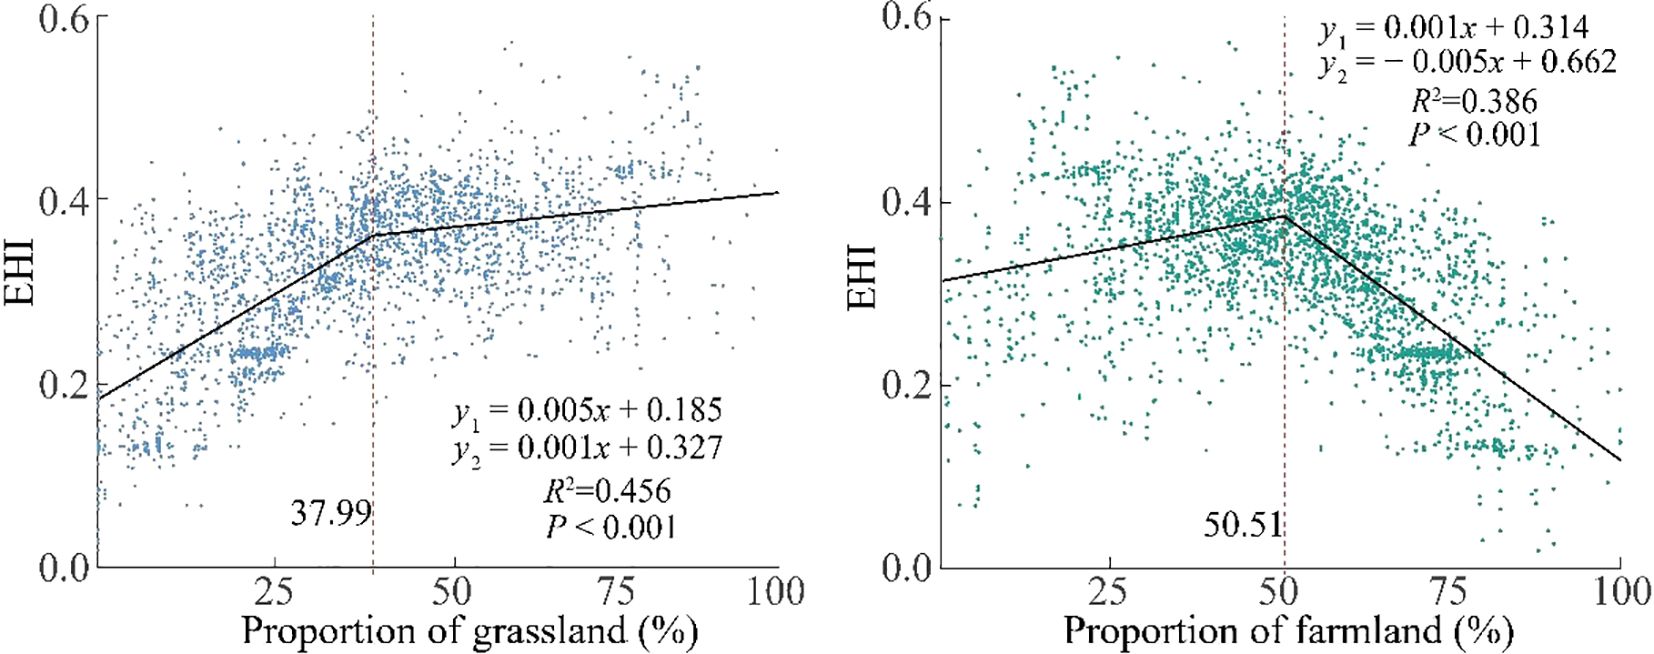
Figure 8. The effects of key land use types on ecosystem health and their thresholds.
4 Discussions
4.1 Impacts of land use change on ecosystem health
In this study, the VORS framework combined with integrated indicators was employed to conduct a comprehensive assessment of EH in the Chahannur Lake Basin, with a focus on exploring the effects of land use change on EH. Previous studies have mostly analyzed the driving factors of variation in EH from natural, social and economic perspectives (He et al., 2019; Xiao et al., 2022; Xu et al., 2022) and proposed optimization strategies. However, few studies have systematically investigated how land use configuration and transitions between land use types influence EH, which limits the ability to inform land use and ecosystem management decisions. Land use serves as a critical link between ecosystem processes and human activities (Fang et al., 2022). Land use changes can impact EH both positively or negatively by altering ecosystem structure and function (Li et al., 2024a). The contribution index analysis revealed that EH dynamics were closely associated with land use transitions driven by human activities (Figure 6). Overall, EH in the basin exhibited a trend of decline followed by recovery during 1990-2022. The conversion of farmland to grassland made the greatest and positive contribution to EH (EHCI = 0.1346), reflecting the significant ecological improvement brought about by recent ecological protection policies—particularly the “Grain to Green Program”, which has enhanced the quality of ecological environment. In contrast, grassland degradation into bare land and urban expansion at the expense of farmland and grassland exerted notable negative impacts on EH (Figure 6d).
The findings further revealed the directions of land use transitions and their contribution degree to EH vary across different periods. Specifically, from 1990 to 2000, the EH of the overall basin substantially declined (Figure 5), primarily driven by rapid population growth and intensified natural resource exploitation. These pressures altered original land use patterns, with extensive grassland conversions to farmland and bare land (Figure 2 and Figure 3), severely disrupting natural ecosystems, compromising their carrying capacity, and exacerbating ecological degradation, thus imposing severe negative impacts on EH in the basin. To mitigate ecological degradation from decades of socioeconomic expansion, multiple ecological protection and restoration programs have been launched in the Chahannur Lake Basin since 2000s (Yin et al., 2018). Our results show that EH significantly improved during 2000-2010 (Figure 5), attributed to the “Grain to Green Program”. The expansion of ecological land and large-scale increase in vegetation coverage enhance the vigor of ecosystems as well as their ability to resist external interferences and improve critical ecosystem services provisioning capacity (Liu et al., 2019), which played an effective role in alleviating socioeconomic pressures on natural ecosystems to some extent. Such ecological gains persisted through 2010-2022, with EH showing steady improvement (Figure 5). However, ecological restoration also faced challenges: intensified urban expansion encroached on the surrounding original productive and ecological lands to meet housing and transportation demands. Transfer of farmland to construction land increased farmland fragmentation and reduced connectivity (Chen et al., 2023), while conversions of grassland and wetland to construction land fragmented continuous natural landscapes, disrupting structural connectivity and stability of ecosystem (Rahman and Islam, 2021). Additionally, human-induced grassland degradation (e.g., overgrazing-driven transitions to bare land) also exerted persistent pressures on EH, contributing to localized health declines during this period.
Furthermore, this study identified key land use types affecting EH of the basin and revealed their threshold effects, providing a scientific basis for optimizing land use patterns to improve regional EH level. Results showed that grassland exerted a positive influence on EH, attributed to its relatively high productivity, resistance and resilience. As a highly multifunctional ecosystem, grassland provides diverse ecosystem services for humans, greatly contributing to ecological balance and ecosystem stability (Bengtsson et al., 2019). However, the influence of grassland area proportion on EH exhibited a significant threshold effect, exceeding the threshold would weaken the rate of EHI increase. This phenomenon can be primarily ascribed to the fact that water resources act as a pivotal limiting factor for the ecosystem in the Chahannur Lake Basin. When grassland area is relatively small, the shallow groundwater and seasonal precipitation can fully meet the water demands of the vegetation. As the continuous expansion of grassland area, the total water consumption of the vegetation will rise rapidly, which may approach or even exceed the water resource carrying capacity of the basin. This, in turn, imposes constraints on vegetation growth, thereby compromising the long-term sustainability of the grassland ecosystem. Therefore, expanding grassland area within suitable thresholds can effectively improve EH. In contrast, farmland exhibited dual effects on EH, with its influence shifting from positive to negative beyond a critical threshold. Farmland not only fulfills its basic productive functions but also provides ecosystem services like water conservation and soil retention (Hu et al., 2023). However, excessive expansion at the expense of natural ecosystems for agricultural production would adversely affect EH. Moreover, excessive groundwater extraction for agricultural irrigation persists in the Chahannur Lake Basin, resulting in a dramatic decline in the regional groundwater table, accompanied by the shrinkage or even complete desiccation of major lakes within the basin. This phenomenon not only impairs the intrinsic ecological functions of lake and wetland ecosystems, but also induces degradation of surrounding grasslands, which are exhibiting a tendency toward desertification and salinization (Xu et al., 2025; Zhu et al., 2022). Consequently, the EH of the basin has been severely compromised. In the future, balancing grassland protection with agricultural production is pivotal to achieving synergistic improvement in ecological health and food security.
4.2 Suggestions on ecological protection and land use planning
The analysis of effects of land use change on EH could provide scientific guidance for resolving conflicts between agricultural and ecological spaces, formulating rational territorial space layouts, and implementing major ecological conservation projects (Kroll et al., 2012; Pan et al., 2021). Our findings highlight that optimizing land use patterns and strengthening ecological protection and restoration should be prioritized for long-term ecosystem health management in the Chahannur Lake Basin.
Given the significant positive impact of grasslands on EH, relying on the key ecological projects such as the Beijing-Tianjin Sandstorm Source Control Program, fenced protection should be implemented for protecting existing grasslands with high-level healthy ecosystem - particularly those distributed in the low mountains and hills of the southern regions, as well as the intermontane basins of the southern and northwestern regions. For the saline-alkali lands around water bodies, measures such as fenced enclosures and artificial planting with native adapted grass species according to local conditions should be carried out to restore degraded and salinized grasslands, thereby improving the decline in EH level caused by grassland degradation and salinization. Furthermore, with the relentless advancement of urbanization, the expansion of construction land is inevitable. However, grasslands can alleviate the negative impacts of urban expansion to some extent. Therefore, policymakers should not only control the disorderly expansion of construction land, but also attach great importance to the construction of urban green spaces. In addition, the spatially scattered distribution of the population, their living patterns, and production activities within the basin exerts enormous pressure on the natural ecological environment and inflicts damage upon it. By contrast, the geographical concentration of the population constitutes an optimal strategy for improving the ecological environment. Therefore, efforts should be made to promote the appropriate concentration of both population and residential land.
Considering the dual impacts of farmland proportion on EH in the Chahannur Lake Basin, it is recommended to appropriately adjust the extent of farmland to mitigate the adverse effects of excessive reclamation on EH. Furthermore, in view of the severe impacts of over-exploitation of groundwater for agricultural irrigation on regional lakes, wetlands and their adjacent grassland ecosystems, it is necessary to reduce agricultural water consumption, strengthen the construction of dryland agriculture, and promote the conversion of paddy fields to drylands. The cultivation of high-water-consuming crops such as potatoes should be reduced, while the planting of low-water-consuming and drought-tolerant crops - including silage corn and dryland wheat, which are suitable for local natural conditions - should be expanded in an orderly manner. For the existing low-quality and low-yield farmlands with low-level EH and unsuitable for cultivation, efforts should be intensified to implement the national policy of converting farmland to grassland in conjunction with local livestock development objectives. Measures such as cultivation of high-quality forages (e.g., oats, forage green naked oats, alfalfa, etc.), artificial reseeding, or natural restoration should be employed according to local conditions, which can not only expand grassland areas, but also synergize with the development of forage processing industry, thereby achieving a win-win situation of ecological and economic benefits. Concurrently, the ecological compensation mechanism for farmland abandonment and grassland restoration should be enhanced to prevent farmers from recultivating fallow lands due to subsidy reductions. For high-quality farmlands, it is suggested to alleviate environmental pollution from agricultural fertilizers and pesticides, adjust the structure of the planting industry and reduce the cultivation of high-water-consuming crops, and promote efficient water-saving irrigation to optimate the protection effectiveness and improve agricultural production capacity, which not only foster green agricultural development but also ensure the long-term sustainable utilization of farmland resources.
It is worth noting that the “thresholds” derived from this study represent theoretical values established based on statistical correlation between land use and EH. In practical application, it is essential to take full account of the specific challenges of the basin to formulate more reasonable land use regulation policies. Additionally, in our pursuit of improvements in EH, the local government should also take regional development goals as guidance and comprehensively weigh economic, ecological and social benefits to formulate land use planning and regulation to determine optimal composition ratios of land use types.
4.3 Limitation and future work
This study assessed the status of EH in the Chahannur Lake Basin and its response to land use changes, providing important scientific insights for basin-scale ecological protection and sustainable development. However, several limitations and uncertainties in this research require further investigation. First, although this study incorporated the supply capacity of ecosystem services into EH evaluation and improved the reliability of the assessment results, the range of ecosystem service types considered remained insufficient due to limitations in data acquisition and evaluation methodologies. Although soil conservation, carbon storage, water yield, and habitat quality maintenance are the most representative regulating services in the Chahannur Lake Basin, this does not imply that other services such as supporting and cultural services are not important. Future research should therefore include a broader spectrum of ecosystem services to more comprehensively and accurately reflect the ecosystem status of the basin. Additionally, this study lacked quantification of human demand for ecosystem services. In the future, efforts should be made to deeply explore methods for measuring human demand for ecosystem services, and to further expand the breadth and depth of EH assessment from the perspectives of human-land coupling and supply-demand balance. Second, this study focused primarily on the impacts of land use change on EH during the historical period (i.e., 1990-2022), ignoring future trends and dynamic evolution of both land use and EH. Given the uncertainties of future land policies and the complexity of environmental changes, EH simulations should be carried out by integrating multiple climate change and land use policy scenarios in the future to better support ecosystem management and policy formulation. Third, the evolution of EH is driven by the combined effects of climate change (e.g., rising temperature, increased CO2 concentration, and precipitation changes) and human activities including land use changes (Li et al., 2024a). This study only examined the impact of different land use changes on EH, without simultaneously considering climatic factors or other key human activity factors (e.g., grazing intensity). Future research should thus integrate multiple influencing factors to enhance the understanding of the relationship between EH and land use changes. Finally, studies on the impact of land use structure on EH exhibit certain limitations. On one hand, while this study identified the effects of key land use types on EH and their thresholds, it did not explore scale effects on these relationships. Future research should investigate how multi-scale processes influence the dynamics of land use-EH thresholds. On the other hand, although grassland and farmland have been identified as the key land use types affecting EH, no further exploration has been conducted into the differential impacts on EH among distinct grasslands types (e.g., those with varying community compositions) and farmland types (e.g., drylands versus paddy fields), which also requires in-depth investigation in future research. Moreover, given the importance of water resources in the basin, future study should additionally focus on the relatively weak EH status of wetlands and waterbodies themselves.
5 Conclusions
This study analyzed the spatio-temporal change of land use within the Chahannur Lake Basin, Inner Mongolia, from 1990 to 2022, then systematically evaluated the EH level of the basin through the construction of VORS framework, and further explored the impacts of land use structure and conversions between different land use types on EH. The main findings can be summarized as follows: (1) Farmland and grassland were the dominant land use types. Forest and construction land aeras continuously expanded, while farmland area reduced, primarily converting to grassland and forest. (2) The basin ecosystem was generally at a moderately healthy level, showing a trend of initial deterioration followed by sustained improvement. High-level EH regions were predominantly concentrated in the low mountains and hills of the southern areas and intermontane basins of southern and northwestern areas, whereas low-level EH regions were scattered without obvious clustering patterns. (3) The conversions of grassland to bare land and construction land were the main driver of deterioration in EH in areas with land use change, while the return of farmland to grassland had the greatest and positive impact on EH. (4) Grassland and farmland were identified as the key land use types influencing EH, both exhibiting significant threshold effects. The grassland area proportion exerted a positive promoting effect on EH, with a threshold of 37.99%. Beyond this threshold, the positive promoting effect would be progressively weakened. Conversely, the impact of farmland area proportion on EH showed contrasting effects across the threshold: when the proportion was below 50.51%, it had a positive effect on EH, but a significant negative effect emerged upon exceeding this threshold. To sum up, policy-makers should appreciate the role of land use structure and conversions on EH when formulating ecological protection and land use optimization policies. Strengthening grassland ecosystem protection and restoration, appropriately expanding grassland area, and restricting excessive reclamation activities are the core strategies to enhance EH of the basin.
Data availability statement
The raw data supporting the conclusions of this article will be made available by the authors, without undue reservation.
Author contributions
YZ: Methodology, Conceptualization, Formal Analysis, Software, Writing – original draft. ZZ: Writing – review & editing, Formal Analysis. SL: Writing – review & editing, Formal Analysis. LD: Writing – review & editing, Formal Analysis. JG: Funding acquisition, Supervision, Writing – review & editing.
Funding
The author(s) declare financial support was received for the research and/or publication of this article. This research was funded by the Science and Technology Plan Program of Inner Mongolia Autonomous Region (2022YFHH0024), and the IWHR Research & Development Support Program (MK0145B022021).
Conflict of interest
The authors declare that the research was conducted in the absence of any commercial or financial relationships that could be construed as a potential conflict of interest.
Generative AI statement
The author(s) declare that no Generative AI was used in the creation of this manuscript.
Any alternative text (alt text) provided alongside figures in this article has been generated by Frontiers with the support of artificial intelligence and reasonable efforts have been made to ensure accuracy, including review by the authors wherever possible. If you identify any issues, please contact us.
Publisher’s note
All claims expressed in this article are solely those of the authors and do not necessarily represent those of their affiliated organizations, or those of the publisher, the editors and the reviewers. Any product that may be evaluated in this article, or claim that may be made by its manufacturer, is not guaranteed or endorsed by the publisher.
References
Bengtsson J., Bullock J. M., Egoh B., Everson C., Everson T., O'connor T., et al (2019). Grasslands—more important for ecosystem services than you might think. Ecosphere 10, e02582. doi: 10.1002/ecs2.2582
Bi X., Fu Y., Wang P., Zhang Y., Yang Z., Hou F., et al. (2024). Ecosystem health assessment based on deep learning in a mountain-basin system in Central Asia’s arid regions, China. Ecol. Indic. 165, 112148. doi: 10.1016/j.ecolind.2024.112148
Chen W., Cao C., Liu D., Tian R., Wu C., Wang Y., et al. (2019). An evaluating system for wetland ecological health: Case study on nineteen major wetlands in Beijing-Tianjin-Hebei region, China. Sci. Total Environ. 666, 1080–1088. doi: 10.1016/j.scitotenv.2019.02.325, PMID: 30970474
Chen W., Wang G., and Zeng J. (2023). Impact of urbanization on ecosystem health in Chinese urban agglomerations. Environ. Impact Assess. Rev. 98, 106964. doi: 10.1016/j.eiar.2022.106964
Chen P., Zhang B., Ma R., Shi J., SI L., Wu J., et al. (2024). Ecosystem degradation risk based on health and resilience: A case study of Chahannur Lake basin on Bashang Plateau. Geology China 51, 1034–1045.
Chen H., Zhao Y., Fu X., Tang M., Guo M., Zhang S., et al. (2022). Impacts of regional land-use patterns on ecosystem services in the typical agro-pastoral ecotone of northern China. Ecosystem Health Sustainability 8, 2110521. doi: 10.1080/20964129.2022.2110521
Cheng X., Chen L., Sun R., and Kong P. (2018). Land use changes and socio-economic development strongly deteriorate river ecosystem health in one of the largest basins in China. Sci. Total Environ. 616, 376–385. doi: 10.1016/j.scitotenv.2017.10.316, PMID: 29127791
Costanza R. (1992). Toward an operational definition of ecosystem health. Ecosystem health: New goals Environ. Manage. 239, 269.
Costanza R. (2012). Ecosystem health and ecological engineering. Ecol. Eng. 45, 24–29. doi: 10.1016/j.ecoleng.2012.03.023
Das M., Das A., Pereira P., and Mandal A. (2021). Exploring the spatio-temporal dynamics of ecosystem health: A study on a rapidly urbanizing metropolitan area of Lower Gangetic Plain, India. Ecol. Indic. 125, 107584. doi: 10.1016/j.ecolind.2021.107584
Das M., Inácio M., Das A., Barcelo D., and Pereira P. (2024). Mapping and assessment of ecosystem health in the Vilnius functional zone (Lithuania). Sci. Total Environ. 912, 168891. doi: 10.1016/j.scitotenv.2023.168891, PMID: 38042183
Davison C. W., Rahbek C., and Morueta-Holme N. (2021). Land-use change and biodiversity: Challenges for assembling evidence on the greatest threat to nature. Global Change Biol. 27, 5414–5429. doi: 10.1111/gcb.15846, PMID: 34392585
Fang Z., Ding T., Chen J., Xue S., Zhou Q., Wang Y., et al. (2022). Impacts of land use/land cover changes on ecosystem services in ecologically fragile regions. Sci. Total Environ. 831, 154967. doi: 10.1016/j.scitotenv.2022.154967, PMID: 35367552
Gu T., Luo T., Ying Z., Wu X., Wang Z., Zhang G., et al. (2024). Coupled relationships between landscape pattern and ecosystem health in response to urbanization. J. Environ. Manage. 367, 122076. doi: 10.1016/j.jenvman.2024.122076, PMID: 39111014
He J., Pan Z., Liu D., and Guo X. (2019). Exploring the regional differences of ecosystem health and its driving factors in China. Sci. total Environ. 673, 553–564. doi: 10.1016/j.scitotenv.2019.03.465, PMID: 30999096
Hu B., Xie M., He R., Shi Z., Zhou Y., Ni H., et al. (2023). Spatio-temporal evolution of cropland ecosystem services value and its spatially varying dominate over the past two decades: A case study in Jiangxi Province in southern China. J. Cleaner Production 427, 139228. doi: 10.1016/j.jclepro.2023.139228
Huang C., Liu S., Du X., Qin Y., and Deng L. (2024). Chinese urbanization promoted terrestrial ecosystem health by implementing high-quality development and ecological management. Land Degradation Dev. 35, 2000–2021. doi: 10.1002/ldr.5037
Khatun R. and Das S. (2022). Exploring ecosystem health of wetlands in Rarh tract of West Bengal through VOR model. Ecol. Inf. 72, 101840. doi: 10.1016/j.ecoinf.2022.101840
Kroll F., Müller F., Haase D., and Fohrer N. (2012). Rural–urban gradient analysis of ecosystem services supply and demand dynamics. Land Use Policy 29, 521–535. doi: 10.1016/j.landusepol.2011.07.008
Laterra P., Orúe M. E., and Booman G. C. (2012). Spatial complexity and ecosystem services in rural landscapes. Agriculture Ecosyst. Environ. 154, 56–67. doi: 10.1016/j.agee.2011.05.013
Lausch A., Erasmi S., King D. J., Magdon P., and Heurich M. (2016). Understanding forest health with remote sensing-part I—a review of spectral traits, processes and remote-sensing characteristics. Remote Sens. 8, 1029. doi: 10.3390/rs8121029
Li J., Dong S., Li Y., Wang Y., Li Z., and Li F. (2022). Effects of land use change on ecosystem services in the China–Mongolia–Russia economic corridor. J. Cleaner Production 360, 132175. doi: 10.1016/j.jclepro.2022.132175
Li W., Kang J., and Wang Y. (2024a). Identifying the contribution and spatial effects of land use conversion on ecosystem health in Chongqing: A multi-scenario simulation perspective. Ecol. Indic. 165, 112232. doi: 10.1016/j.ecolind.2024.112232
Li Y., Qin L., Wang Y., Liu H., Zhang M., and Hao H. (2024b). Ecosystem health assessment of the largest lake wetland in the Yellow River basin using an improved vigor-organization-resilience-services model. Ecol. Indic. 166, 112539. doi: 10.1016/j.ecolind.2024.112539
Li W., Wang Y., Xie S., and Cheng X. (2021). Coupling coordination analysis and spatiotemporal heterogeneity between urbanization and ecosystem health in Chongqing municipality, China. Sci. Total Environ. 791, 148311. doi: 10.1016/j.scitotenv.2021.148311, PMID: 34412384
Liao C., Yue Y., Wang K., Fensholt R., Tong X., and Brandt M. (2018). Ecological restoration enhances ecosystem health in the karst regions of southwest China. Ecol. Indic. 90, 416–425. doi: 10.1016/j.ecolind.2018.03.036
Liu W., Cui L., Guo Z., Wang D., and Zhang M. (2023). Wetland ecosystem health improvement from ecological conservation and restoration offset the decline from socio-economic development. Land Degradation Dev. 34, 283–295. doi: 10.1002/ldr.4459
Liu Y., Lü Y., Fu B., Harris P., and Wu L. (2019). Quantifying the spatio-temporal drivers of planned vegetation restoration on ecosystem services at a regional scale. Sci. Total Environ. 650, 1029–1040. doi: 10.1016/j.scitotenv.2018.09.082, PMID: 30308792
Luo Z., Zuo Q., and Shao Q. (2018). A new framework for assessing river ecosystem health with consideration of human service demand. Sci. Total Environ. 640, 442–453. doi: 10.1016/j.scitotenv.2018.05.361, PMID: 29864658
Ma S., Wang L. J., Wang H. Y., Zhang X., and Jiang J. (2022). Spatial heterogeneity of ecosystem services in response to landscape patterns under the Grain for Green Program: A case-study in Kaihua County, China. Land Degradation Dev. 33, 1901–1916. doi: 10.1002/ldr.4272
Ouyang X., Tang L., Wei X., and Li Y. (2021). Spatial interaction between urbanization and ecosystem services in Chinese urban agglomerations. Land Use Policy 109, 105587. doi: 10.1016/j.landusepol.2021.105587
Pan Z., He J., Liu D., and Wang J. (2020). Predicting the joint effects of future climate and land use change on ecosystem health in the Middle Reaches of the Yangtze River Economic Belt, China. Appl. Geogr. 124, 102293. doi: 10.1016/j.apgeog.2020.102293
Pan Z., He J., Liu D., Wang J., and Guo X. (2021). Ecosystem health assessment based on ecological integrity and ecosystem services demand in the Middle Reaches of the Yangtze River Economic Belt, China. Sci. Total Environ. 774, 144837. doi: 10.1016/j.scitotenv.2020.144837
Peng J., Hu X., Wang X., Meersmans J., Liu Y., and Qiu S. (2019). Simulating the impact of Grain-for-Green Programme on ecosystem services trade-offs in Northwestern Yunnan, China. Ecosystem Serv. 39, 100998. doi: 10.1016/j.ecoser.2019.100998
Peng J., Liu Y., Li T., and Wu J. (2017). Regional ecosystem health response to rural land use change: A case study in Lijiang City, China. Ecol. Indic. 72, 399–410. doi: 10.1016/j.ecolind.2016.08.024
Rahman M. F. and Islam K. (2021). Effectiveness of protected areas in reducing deforestation and forest fragmentation in Bangladesh. J. Environ. Manage. 280, 111711. doi: 10.1016/j.jenvman.2020.111711, PMID: 33267977
Ran P., Frazier A. E., Xia C., Tiando D. S., and Feng Y. (2023). How does urban landscape pattern affect ecosystem health? Insights from a spatiotemporal analysis of 212 major cities in China. Sustain. Cities Soc. 99, 104963. doi: 10.1016/j.scs.2023.104963
Ran Y., Lei D., Li J., Gao L., Mo J., and Liu X. (2022). Identification of crucial areas of territorial ecological restoration based on ecological security pattern: A case study of the central Yunnan urban agglomeration, China. Ecol. Indic. 143, 109318. doi: 10.1016/j.ecolind.2022.109318
Rapport D. J. and Singh A. (2006). An ecohealth-based framework for state of environment reporting. Ecol. Indic. 6, 409–428. doi: 10.1016/j.ecolind.2005.05.003
Ríos-Touma B., Villamarín C., Jijón G., Checa J., Granda-Albuja G., Bonifaz E., et al. (2022). Aquatic biodiversity loss in Andean urban streams. Urban Ecosyst. 25, 1619–1629. doi: 10.1007/s11252-022-01248-1
Shen W., Li Y., and Qin Y. (2023). Research on the influencing factors and multi-scale regulatory pathway of ecosystem health: A case study in the Middle Reaches of the Yellow River, China. J. Cleaner Production 406, 137038. doi: 10.1016/j.jclepro.2023.137038
Shen W., Zheng Z., Pan L., Qin Y., and Li Y. (2021). A integrated method for assessing the urban ecosystem health of rapid urbanized area in China based on SFPHD framework. Ecol. Indic. 121, 107071. doi: 10.1016/j.ecolind.2020.107071
Shu H., Xiao C., Ma T., and Sang W. (2021). Ecological health assessment of chinese national parks based on landscape pattern: A case study in shennongjia national park. Int. J. Environ. Res. Public Health 18, 11487. doi: 10.3390/ijerph182111487, PMID: 34770001
Tang D., Liu X., and Zou X. (2018). An improved method for integrated ecosystem health assessments based on the structure and function of coastal ecosystems: A case study of the Jiangsu coastal area, China. Ecol. Indic. 84, 82–95. doi: 10.1016/j.ecolind.2017.08.031
Vollmer D., Regan H. M., and Andelman S. J. (2016). Assessing the sustainability of freshwater systems: A critical review of composite indicators. Ambio 45, 765–780. doi: 10.1007/s13280-016-0792-7, PMID: 27250097
Wang Q., Liu M., Tian S., Yuan X., Ma Q., and Hao H. (2021). Evaluation and improvement path of ecosystem health for resource-based city: A case study in China. Ecol. Indic. 128, 107852. doi: 10.1016/j.ecolind.2021.107852
Wang C., Liu X., Wu J., Qiao W., and Liu Y. (2023). Planning a water-constrained ecological restoration pattern to enhance sustainable landscape management in drylands. J. Environ. Manage. 335, 117514. doi: 10.1016/j.jenvman.2023.117514, PMID: 36841000
Wang X., Yao W., Luo Q., and Yun J. (2024). Spatial relationship between ecosystem health and urbanization in Coastal Mountain City, Qingdao, China. Ecol. Inf. 79, 102458. doi: 10.1016/j.ecoinf.2023.102458
Wang X., Zhang B., Xu X., Tian J., and He C. (2020). Regional water-energy cycle response to land use/cover change in the agro-pastoral ecotone, Northwest China. J. Hydrology 580, 124246. doi: 10.1016/j.jhydrol.2019.124246
Xiao Z., Liu R., Gao Y., Yang Q., and Chen J. (2022). Spatiotemporal variation characteristics of ecosystem health and its driving mechanism in the mountains of southwest China. J. Cleaner Production 345, 131138. doi: 10.1016/j.jclepro.2022.131138
Xie X., Fang B., Xu H., He S., and Li X. (2021). Study on the coordinated relationship between Urban Land use efficiency and ecosystem health in China. Land Use Policy 102, 105235. doi: 10.1016/j.landusepol.2020.105235
Xie H., Zhang Y., Zeng X., and He Y. (2020). Sustainable land use and management research: A scientometric review. Landscape Ecol. 35, 2381–2411. doi: 10.1007/s10980-020-01002-y
Xu R., Du Y., Wang Z., Sun X., Yang L., Liu J., et al. (2025). Contrasting lacustrine groundwater discharge in two small perennial lakes around dried-up Chahannaoer Lake, Northern China. J. Hydrology: Regional Stud. 58, 102280. doi: 10.1016/j.ejrh.2025.102280
Xu D. and Guo X. (2015). Some insights on grassland health assessment based on remote sensing. Sensors 15, 3070–3089. doi: 10.3390/s150203070, PMID: 25643060
Xu W., He M., Meng W., Zhang Y., Yun H., Lu Y., et al. (2022). Temporal-spatial change of China’s coastal ecosystems health and driving factors analysis. Sci. Total Environ. 845, 157319. doi: 10.1016/j.scitotenv.2022.157319, PMID: 35839892
Yin H., Pflugmacher D., Li A., Li Z., and Hostert P. (2018). Land use and land cover change in Inner Mongolia-understanding the effects of China’s re-vegetation programs. Remote Sens. Environ. 204, 918–930. doi: 10.1016/j.rse.2017.08.030
Zeng C., Cheng Y., and Lyu T. (2022). Research on land-space ecological restoration zoning based on ecosystem health: A case study of the urban agglomeration in the middle reaches along the Yangtze River. J. Natural Resour. 37, 3118–3135. doi: 10.31497/zrzyxb.20221207
Zhang R., Li P., Xu L., and Zhong S. (2023). Reconciling ecological footprint and ecosystem services in natural capital accounting: Applying a novel framework to the Silk Road Economic Belt in China. J. Environ. Manage. 330, 117115. doi: 10.1016/j.jenvman.2022.117115, PMID: 36587549
Zhang X., Wu T., Du Q., Ouyang N., Nie W., Liu Y., et al. (2025). Spatiotemporal changes of ecosystem health and the impact of its driving factors on the Loess Plateau in China. Ecol. Indic. 170, 113020. doi: 10.1016/j.ecolind.2024.113020
Zhao C., Shao N., Yang S., Ren H., Ge Y., Zhang Z., et al. (2019). Integrated assessment of ecosystem health using multiple indicator species. Ecol. Eng. 130, 157–168. doi: 10.1016/j.ecoleng.2019.02.016
Zhou Y., Yue D., Li S., Liang G., Chao Z., Zhao Y., et al. (2022). Ecosystem health assessment in debris flow-prone areas: A case study of Bailong River Basin in China. J. Cleaner Production 357, 131887. doi: 10.1016/j.jclepro.2022.131887
Zhu L., Ke Y., Hong J., Zhang Y., and Pan Y. (2022). Assessing degradation of lake wetlands in Bashang Plateau, China based on long-term time series Landsat images using wetland degradation index. Ecol. Indic. 139, 108903. doi: 10.1016/j.ecolind.2022.108903
Keywords: ecosystem health, land use, spatio-temporal evolution, VORS model, threshold effect
Citation: Zheng Y, Zhang Z, Lu S, Dong L and Guo J (2025) Impacts of land use change on ecosystem health in the Chahannur Lake Basin of Inner Mongolia, China. Front. Ecol. Evol. 13:1653000. doi: 10.3389/fevo.2025.1653000
Received: 24 June 2025; Accepted: 26 September 2025;
Published: 14 October 2025.
Edited by:
Miguel Ferrer, Spanish National Research Council (CSIC), SpainCopyright © 2025 Zheng, Zhang, Lu, Dong and Guo. This is an open-access article distributed under the terms of the Creative Commons Attribution License (CC BY). The use, distribution or reproduction in other forums is permitted, provided the original author(s) and the copyright owner(s) are credited and that the original publication in this journal is cited, in accordance with accepted academic practice. No use, distribution or reproduction is permitted which does not comply with these terms.
*Correspondence: Jianying Guo, Z3VvanlAaXdoci5jb20=