 Cassandre C. Venumière-Lefebvre1*†
 Heather E. Johnson2†
 Stewart W. Breck3†
 Mathew W. Alldredge4†
 Kevin R. Crooks1†
- 1Center for Human-Carnivore Coexistence, Department of Fish, Wildlife, and Conservation Biology, Colorado State University, Fort Collins, CO, United States
- 2U.S. Geological Survey, Alaska Science Center, Anchorage, AK, United States
- 3United States Department of Agriculture, Wildlife Services, National Wildlife Research Center, Fort Collins, CO, United States
- 4Mammals Research Section, Colorado Parks and Wildlife, Fort Collins, CO, United States
Introduction: Urbanization is an extreme form of land use alteration, with human development driving changes in the distribution of resources available to wildlife. Some large carnivores have learned to exploit anthropogenic food resources in urban development, resulting in human-carnivore conflict that can have detrimental impacts to people and carnivores, as exemplified by American black bears. Management agencies commonly promote the use of bear-resistant garbage containers for reducing conflicts, but little is known about the actual behavioral responses of bears to this intervention.
Methods: To understand whether black bears alter their behavior in response to changes in residential waste management, we investigated patterns of bear behavior in Durango, Colorado, where anthropogenic attractants were experimentally manipulated. Using location data from collared black bears, we modeled resource selection and movement in response to areas that had received bear-resistant garbage containers compared to those that did not.
Results: Bears avoided residential areas where garbage availability had been reduced, and this avoidance response increased over subsequent years, potentially suggesting that bears were learning from the management intervention. Bear movement rates, however, were not notably affected by the garbage reduction.
Discussion: Our findings highlight the importance of reducing the availability of anthropogenic attractants for changing bear behavior and reducing risk of urban human-bear conflict, and that these responses can strengthen over time as bears learn from the management intervention.
1 Introduction
Urbanization is an extreme form of land use alteration, with human development driving changes in biogeochemical cycles, habitat, and biodiversity (Grimm et al., 2008), thus altering ecological patterns and processes (Schell et al., 2020). Specifically, urban development affects landscape heterogeneity, modifying the temporal and spatial distribution of resources for animals (Alberti, 2005). For wildlife, such alterations in the distribution of resources can result in changes in individual behavior, population dynamics, and community structure by favoring or disadvantaging particular species (Shochat et al., 2006). Some species actively avoid urban areas (i.e., “avoiders”), some species rely primarily on natural habitat but use some anthropogenic resources (i.e., “adapters”), and some species inhabit city environments and become dependent on anthropogenic food and shelter (i.e., “exploiters”) (McKinney, 2006).
Certain large carnivores have learned to exploit anthropogenic food sources associated with urban development (Crooks, 2002; Bateman and Fleming, 2012), resulting in human-carnivore conflict that can have detrimental impacts on both people and carnivores (Soulsbury and White, 2015). Impacts to people include direct attacks on humans or their domestic animals. For example, injuries and fatalities have resulted from people being attacked by spotted hyenas (Crocuta crocuta) in Ethiopian suburbs (Abay et al., 2011), by leopards (Panthera pardus) in Mumbai, India (Landy, 2018), and by coyotes (Canis latrans), mountain lions (Puma concolor), and American black bears (Ursus americanus) in urban areas across North America (Bombieri et al., 2018). Other impacts to people include property damage, which can incur significant costs. For example, badger (Meles meles) burrows in England created damages amounting to approximately £250,000 per year (Davison et al., 2011), and damage to structures by brown bears (Ursus arctos) averaged 1,800€ per year in a single national park in Italy (Galluzzi et al., 2021). Impacts to carnivores include mortality from vehicle collisions, lethal removals, toxicity, and disease (Gehrt et al., 2010; Bateman and Fleming, 2012). For example, black bears that use urban areas in Colorado commonly died from vehicle collisions (Johnson et al., 2020), urban coyotes died frequently from ingestion of toxicants (Poessel et al., 2015), and red fox (Vulpes vulpes) mortality in urban areas in Europe was due to lethal management control (Bateman and Fleming, 2012). To reduce the impacts of conflict for both people and carnivores, there is a need to identify and evaluate solutions that foster human-carnivore coexistence (Artelle et al., 2024), defined as the co-occurrence of sustainable carnivore populations and human endeavors with minimal human-carnivore and social conflict (Venumière-Lefebvre et al., 2022).
One of the most common management strategies to reduce human-carnivore conflict is to restrict carnivores from accessing human food sources. For example, fenced corrals are used to prevent wolves (Canis lupus) and snow leopards (Panthera uncia) from predating on livestock at night in Mongolia, and electric fencing effectively reduced depredations from jaguars (Panthera onca) in livestock operations throughout Central and South America (Polisar et al., 2025). Attractant management assumes that target animals are capable of behavioral plasticity and will respond to an altered distribution of resources by modifying their behavior in a way that reduces conflict (Greggor et al., 2020; Artelle et al., 2024). Knowledge about animal behavior can inform the conservation and management of wildlife (Blumstein and Fernández-Juricic, 2004, 2010), for instance by using behavioral responses as indicators of management success (Verzuh et al., 2024). In the approach-avoid framework (Greggor et al., 2020), the management goal is to attract or repel animals from specific locations or stimuli by altering the economics of foraging decision-making, for example by de-valuing an attractant. This is done either by increasing the perception of risk using something like repellents, or by decreasing the reward through reduced access. If animals are capable of associating spatial cues with the increased risk or decreased reward, the expected behavioral response is spatial avoidance (Greggor et al., 2020; Homstol et al., 2024). Animals also tend to increase their movement rates in response to decreased forage availability (Avgar et al., 2013). Thus, movement rates such as speed and path sinuosity can also be used as indicators of animal behavioral response.
Black bears (hereafter bears) in North America are an excellent example of a large carnivore that can exploit human resources in urban areas, leading to increased conflict (Spencer et al., 2007; Klees Van Bommel et al., 2022). Black bears are opportunists and respond to scarcity of resources by expanding their home ranges and food sources, showing behavioral flexibility (Baruch-Mordo et al., 2014; Ditmer et al., 2018a; Garshelis et al., 2020). The greater availability of anthropogenic food in developed landscapes, particularly garbage, creates an environment that is highly attractive to bears and brings them into human settlements (Beckmann and Berger, 2003; Fusaro et al., 2017). Bears that enter developed areas have a higher probability of mortality due to vehicle collisions (Ditmer et al., 2018b; Gantchoff et al., 2020) and encounters that can lead to their lethal removal (Spencer et al., 2007; Beckmann and Lackey, 2008). Human-bear conflict also impacts people, including threats to human safety (Herrero et al., 2011), damage to cars and property (Pelton et al., 1976; Baruch-Mordo et al., 2008), and fostering negative attitudes toward wildlife management agencies (Lischka et al., 2019; Zajac et al., 2012). Human-bear conflicts are exacerbated during periods of drought or late spring freezes, both of which can greatly limit natural forage (Baruch-Mordo et al., 2014). During these poor food years, bear physiological needs for resources often outweigh the risks of using developed areas (Johnson et al., 2015), and as bears use anthropogenic resources as food subsidy, rates of conflicts increase (Zack et al., 2003). Resulting bear mortality can be high, with significant demographic impacts on surrounding bear populations (Johnson et al., 2020). For example, during a year with poor natural food availability, collisions with vehicles, hunter harvests, and lethal removals by management agencies led to a 57% decline in the local female bear population (Laufenberg et al., 2018).
The primary anthropogenic resource black bears access within developed landscapes is garbage (Lewis et al., 2015). As a result, wildlife agencies often advocate for the use of bear-resistant garbage containers and infrastructure to reduce bear access to this resource, and thus, decrease the reward of foraging within residential development. While studies have shown that bear-proofing infrastructure is generally effective at reducing bear access to human foods and decreasing conflicts (Johnson et al., 2018; Barrett et al., 2023), little is known about the actual behavioral responses of bears to this management action. If bears perceive the reduction in food rewards while risk on the landscape remains high, they should respond by spatially avoiding areas with bear-resistant containers, and potentially moving more quickly through those areas. Because bears are known to be highly adaptive learners (Mazur and Seher, 2008; Hopkins, 2013), we may also expect that their behavioral responses to bear-proofing garbage may increase over time or change under different environmental conditions (e.g., decrease after natural food shortages).
The goal of this study was to investigate the fine-scale behavioral response of black bears to the implementation of bear-resistant trash containers, one of the most commonly used management strategies for reducing human-bear conflicts. We leveraged longitudinal data from a large-scale experiment that tested the effectiveness of bear-resistant garbage containers in Durango, Colorado, a mountain community that experiences high rates of conflicts with black bears (Johnson et al., 2015, 2018; Lischka et al., 2019). The experiment successfully reduced instances of bears accessing garbage (Johnson et al., 2018), but its impact on fine-scale bear behavior has not yet been investigated. To understand whether bears changed their behavior in residential areas in Durango in response to reduced access to human food, we used black bear GPS collar location data and modeled resource selection and movement as a function of the bear-proofing treatment. Specifically, our objectives were to evaluate: (1) whether the reduction in garbage availability in certain residential areas resulted in decreased bear selection for these areas; (2) whether the reduction in garbage availability resulted in increased bear movements in these areas; and (3) whether these responses shifted over time as bears learned about the management intervention or as natural food conditions varied.
2 Materials and methods
2.1 Study system
Our study took place in Durango, a city located in southwest Colorado, USA (37.2753°N, 107.8801°W), on the Animas River near the San Juan National Forest. Elevation in the immediate vicinity of the study area ranges from 1,960 to 2,410 m (U.S. Geological Survey, 2024). Between 2011 and 2016, temperatures in Durango averaged -1.9 °C in the winter (Dec-Feb) and 21.2 °C in the summer (Jun-Aug), and precipitation averaged 27.0 cm of rain and 45.9 cm of snow annually (National Weather Service, 2024). Vegetation is dominated by ponderosa pine (Pinus ponderosa), pinyon pine (Pinus edulis), Gambel oak (Quercus gambelii), aspen (Populus tremuloides), juniper (Juniperus spp.), chokecherry (Prunus virginiana), serviceberry (Amelanchier canadensis), and wild crab apple (Peraphyllum ramosissimum). Areas around the city are predominately public lands, owned and managed by city, county, state, and federal entities.
Durango has a land area of 38.1 km2 (U.S. Census Bureau, 2020) and has experienced high levels of human growth and activity. From 2010 to 2020, the city experienced an 18.3% increase in the resident population (16,887 residents in 2010 and 19,971 in 2020), increased rates of tourism, and increased urban development (U.S. Census Bureau, 2020). Black bears in the vicinity typically consume mast species such as Gambel oak, pinyon pine, chokecherry, and wild crab apple; but will also consume human food sources such as garbage and birdseed, contributing to human-bear interactions (Johnson et al., 2015). When natural foods are scarce, bears often increase their use of human foods in and around Durango, which is associated with higher bear mortality (Johnson et al., 2020). According to the Colorado Revised Statutes § 33-4-101.3, bear baiting for hunting is illegal in Colorado.
To reduce the risk of human-bear encounters, the City of Durango enacted an ordinance in 2010 requiring residents to secure garbage in buildings or in wildlife-resistant containers (Ordinance O-2018-6, 2018). At that time, approximately 10% of residents had voluntarily purchased bear-resistant containers. In 2011, Colorado Parks and Wildlife, the U.S. Department of Agriculture National Wildlife Research Center, and the City of Durango partnered to conduct an experiment that used a longitudinal (2011-2016) before-after-control-impact design to determine whether widescale use of bear-resistant garbage containers was effective at reducing human-bear conflicts (Johnson et al., 2018). Within the residential core of Durango, they identified two treatment areas and two paired control areas. They randomly assigned a treatment and a control area in the northern part of the city (Figure 1C), which consisted mostly of larger single-family homes where garbage was likely to be secured in garages between pick up days. They similarly assigned a treatment and a control area in the southern part of the city, which included smaller lots and more rental properties and where garbage was mostly stored in alleys. In 2011 and 2012, researchers monitored all four areas to collect pre-treatment data on human-bear garbage-related conflicts (i.e., instances of strewn trash showing evidence of bears having accessed garbage). They recorded similar baseline rates of garbage-related incidents in designated control and treatment areas (Johnson et al., 2018). In spring of 2013, each residence in the two treatment areas (n = 1,145 homes; shown in green in Figure 1C) received a bear-resistant garbage container (depicted in Supplementary Figure S1). Residences in the two control areas (n = 1,123; shown in purple in Figure 1C) continued to use the garbage containers they previously owned. Researchers continued to monitor post-treatment garbage-related conflict with bears for 4 years during the summers of 2013-2016. We used data collected from this experiment to address our questions about the effect of urban bear-proofing on bear resource selection and movement (additional details about the experiment are described in Johnson et al., 2018).
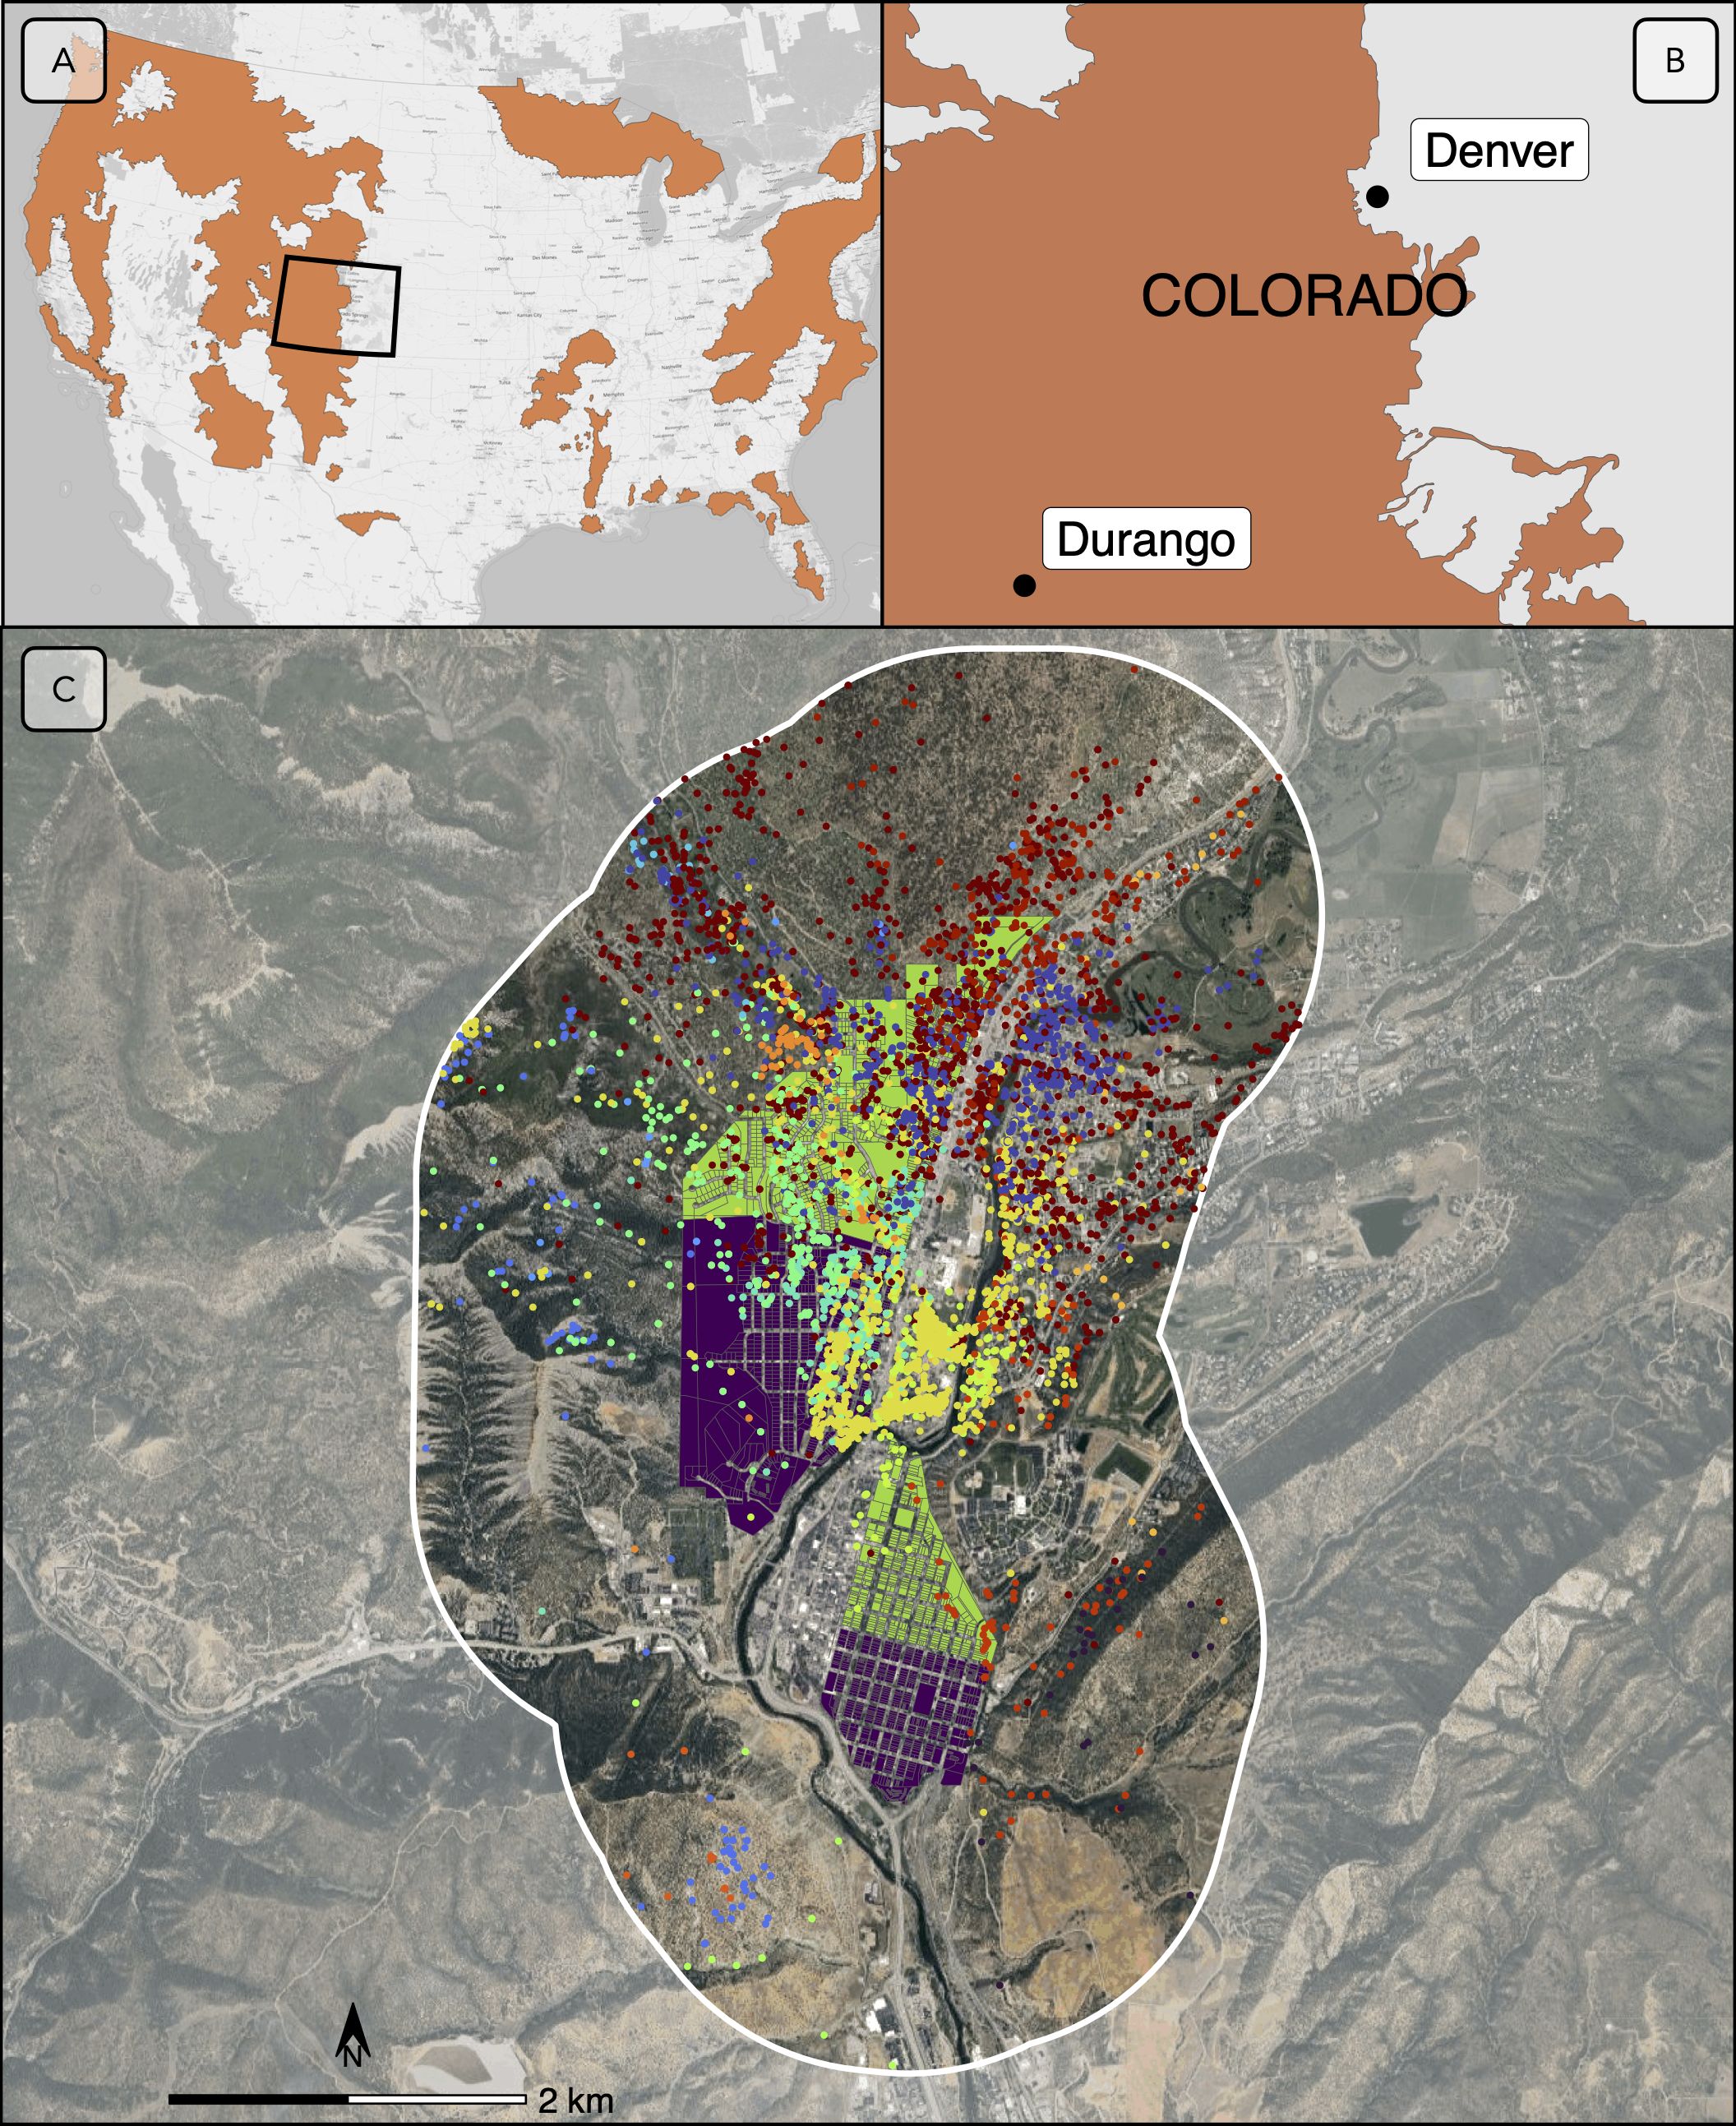
Figure 1. Location of the study area, at the national (A), state (B), and local (C) scale. In panels (A, B), the current range of American black bears (Ursus americanus) is represented in brown (IUCN (International Union for Conservation of Nature) 2016; Colorado Parks and Wildlife, 2023). In panel (C), treatment areas in Durango, Colorado, where bear-resistant garbage containers were distributed, are represented in green; control areas where non-bear-resistant garbage containers were predominantly used are represented in purple. Bear GPS locations are represented by colored dots; each color associated with one individual. The 1.5-km buffer around the experimental area was used to filter location data retained for the analysis and is represented as a white line. Base map source: Imagery © 2025 Airbus, Landsat/Copernicus, Maxar Technologies, USDA/FPAC/GEO.
Because interannual availability of natural forage is an important predictor of bear use of developed areas (Baruch-Mordo et al., 2014) and of resulting human-bear conflicts (Zack et al., 2003; Johnson et al., 2015), researchers also monitored natural food availability. They surveyed 15 1-km vegetation transects within 10 km of Durango and estimated the annual availability of hard and soft mast from Gambel oak, chokecherry, and wild crab apple shrubs along each transect every two weeks during August and September. They used the average annual abundance of mast across the three shrub species to generate an annual index of natural forage conditions (Johnson et al., 2018).
2.2 Black bear data
During 2011-2016, individual bears were captured with box traps in the vicinity of Durango each summer (Johnson et al., 2020). Traps were located within approximately 10 km of the Durango city limits to collar individuals that had access to both human-modified and natural habitats. Adult females estimated to be ≥3 years old were immobilized and fitted with Vectronic Globalstar GPS collars (Johnson et al., 2015). Collars were programmed to collect hourly locations, and dens were visited in the winter to download locations, replace collar batteries, and collect additional biometric data on collared bears and their cubs.
To evaluate bear responses to the garbage reduction treatment, we used the GPS data to define bear “steps” in the immediate vicinity of the experimental area (i.e., treatment and control areas) during the late summer period when conflicts peak. A step was defined as the straight line distance between two consecutive locations with a time interval of 60 ± 10 min (following Fortin et al., 2005; Thurfjell et al., 2014). Temporally, we included steps associated with the hyperphagia season, between 1 July and 30 September (2011-2016), when bears increase their time spent foraging on both natural and human foods in preparation for hibernation (Nelson et al., 1983; Lewis et al., 2015). Spatially, we defined a 1.5-km buffer around the experimental area, covering an area of 30.7 km2 (Figure 1C). This distance was the near-maximum distance covered by bears in 1 h (i.e., 99% percentile length of steps); we included any step that started or ended within the buffer. We removed all steps shorter than 30 m to avoid non-movement periods (e.g., hours when bears were resting) and included only individual-year combinations with at least 10 steps to meet the computational demands of the subsequent analysis.
2.3 Habitat covariates
We investigated black bear behavioral responses to the garbage-reduction treatment after accounting for other natural and anthropogenic habitat covariates expected to influence bear resource selection based on the literature. Following Signer et al. (2019), predictors of resource selection were attributed based on the location of the end of the step, and predictors of movement kernel were attributed based on the location at the start of the step. We expected bears to stay near riparian areas which offer water, cool habitats, and dense vegetative cover (Naiman and Rogers, 1997; Lyons et al., 2003). We used linear hydrography data (U.S. Census Bureau, 2013) and calculated the natural logarithm of the distance (m) from step end points to the closest river or stream (perennial and intermittent). We also expected bears to select areas with lower elevations and steeper slopes, which generally offered more vegetation cover and less human development, respectively (Johnson et al., 2015). We used data from the National Elevation Dataset (U.S. Geological Survey, 2024, 30-m resolution) and extracted elevation (m) and slope (°). We initially included elevation and slope as either linear or quadratic predictors of bear resource selection in univariate models; quadratic effects were more strongly supported based on the corrected Akaike Information Criterion (AICc, Akaike, 1974), and so we used them in our multivariate models (described below). We expected bears to use forested areas for cover as well as for food resources (Johnson et al., 2015; Laufenberg et al., 2018). We compared (1) deciduous, evergreen, and mixed forest land cover classes and (2) percent tree canopy (Multi-Resolution Land Characteristics consortium, 2011; 30-m resolution) as potential predictors of bear resource selection. We considered univariate models with these potential predictors and selected the one producing the lowest AICc. Based on AICc, percent tree canopy cover was the strongest predictor and was included in further analyses. We expected bear use of developed areas to increase during years of poor natural food availability (Baruch-Mordo et al., 2014) and therefore included the annual index of natural forage conditions from Johnson et al. (2018) as an additional predictor in our models.
We also attributed bear steps with covariates related to human development because these areas represent both sources of food (e.g., garbage, birdseed, fruit trees) and increased risk (e.g., roads, human activity). We expected bears to select intermediate densities of development (Johnson et al., 2015; Evans et al., 2017; Laufenberg et al., 2018) because they have been observed to prefer areas with ample human food resources but to avoid dense development associated with greater human activity. We compared (1) percent imperviousness (i.e., proportion of area covered by surfaces that prevent water from infiltrating the ground such as roads, rooftops, and parking lots), included either as a linear or quadratic term, (2) categorical development land cover classes (open space, low, medium, and high intensity development where impervious surfaces account for 0-19%, 20-49%, 50-79%, and 80-100% of the total area, respectively), and (3) the log-distance (m) from the step end point to development (Multi-Resolution Land Characteristics consortium, 2011; 30-m resolution) as univariate predictors of bear resource selection. Based on AICc, percent urban imperviousness with a quadratic term was the strongest predictor and was included in further stages of analyses. We examined predictors for autocorrelation and no pair of variables had a Pearson’s correlation coefficient |r| > 0.7 (Dormann et al., 2013).
2.4 Investigating bear behavioral responses to the experiment
We jointly modeled the effect of the garbage-reduction treatment on bear resource selection and movement using an integrated step selection analysis (Avgar et al., 2016; Fieberg et al., 2021). This method reduces bias in estimating resource selection parameters (Forester et al., 2009) while simultaneously providing inference about animal movement. We adapted the framework of Dickie et al. (2020) and identified steps as belonging to one of four possible categories of behavioral response to habitat: (1) forage, (2) travel, (3) cautious, and (4) flee (Figure 2). We assumed that strong resource selection with slow and sinuous movement (i.e., short step lengths and high angular deviation) is a response to habitats providing food resources and protection, thus categorized as “forage.” We assumed that strong selection with fast and straight steps is a response to safe habitats facilitating movement, such as corridors (“travel”). We also assumed that weak selection with slow and sinuous movement is a behavioral response to novel or complex habitats that impede movement (“cautious”) and that weak selection with fast and straight movement is a behavioral response to risky habitats, where risks overcome elements impeding movement (“flee”) (Avgar et al., 2013) (Figure 2). We used this framework to test our hypotheses relating to the garbage-reduction treatment. We expected that, if the treatment was successful at limiting food resources, bears would reduce foraging in the treatment areas after the containers were distributed and would instead display fleeing behavior. Thus, we expected lower selection and faster and straighter movement in treatment conditions (i.e., post-implementation treatment areas) relative to control conditions (i.e., pre-implementation treatment areas and control areas). A shift in treatment conditions from “forage” to “flee” would be indicative of behavioral flexibility in bears and of success of the management action.
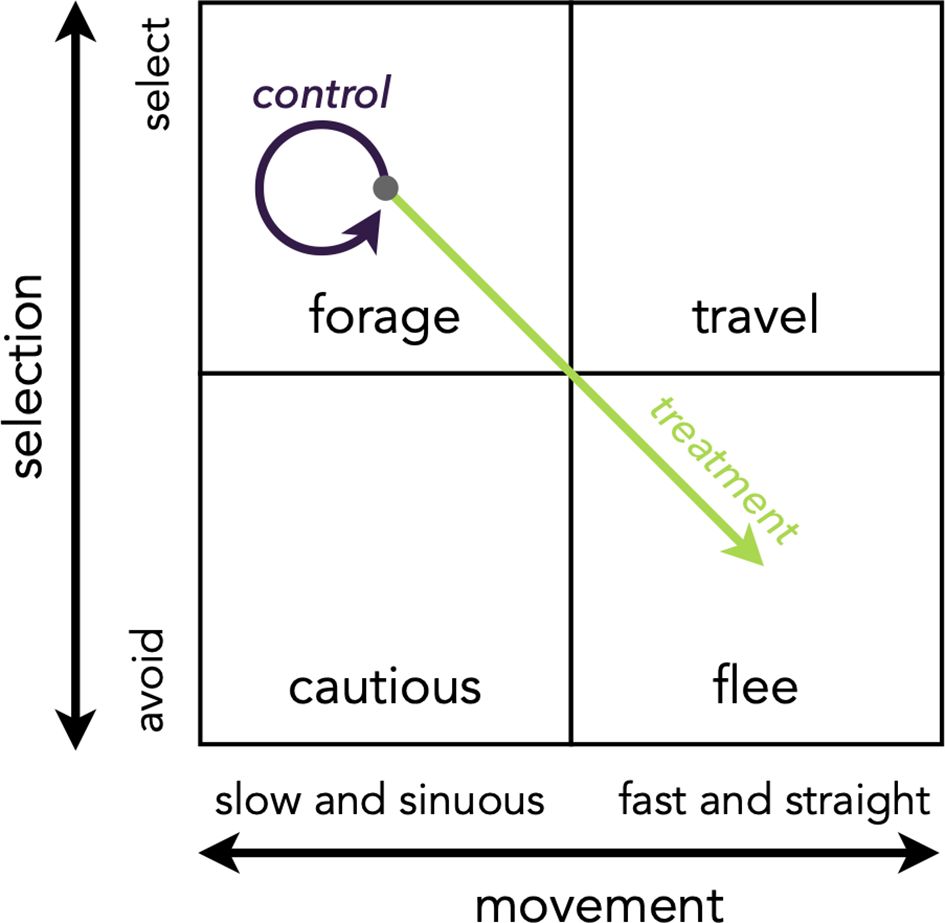
Figure 2. Animal behavioral responses to habitats that vary in resource availability and risk can be combined in four theoretical categories: forage (i.e., strong selection, slow and sinuous movement), travel (i.e., strong selection, fast and straight movement), cautious (i.e., weak selection, slow and sinuous movement), and flee (i.e., weak selection, fast and straight movement) (adapted from Dickie et al., 2020). We hypothesized that bears would display forage behavior in pre-implementation conditions and post-implementation control areas (purple arrow, “control”) (Johnson et al., 2020) and would shift to flee behavior in post-implementation treatment areas (green arrow, “treatment”).
To test our hypotheses regarding the effect of the garbage-reduction treatment on black bear selection and movement, we sampled 10 “available” steps for each observed step (Figure 3). Available step lengths were drawn from a gamma distribution with shape and scale parameters based on observed step lengths for the individual. Similarly, available turn angles were drawn from a Von Mises distribution with a concentration parameter based on observed turn angles for the individual (following Avgar et al., 2016; Prokopenko et al., 2017). We fit conditional logistic regression models that included the natural logarithm of step lengths and the cosine of step turning angles as fixed effects to model movement. We accounted for individual bear variation by using a mixed-model approach and included nested random intercepts for each step of each individual-year (Muff et al., 2020).
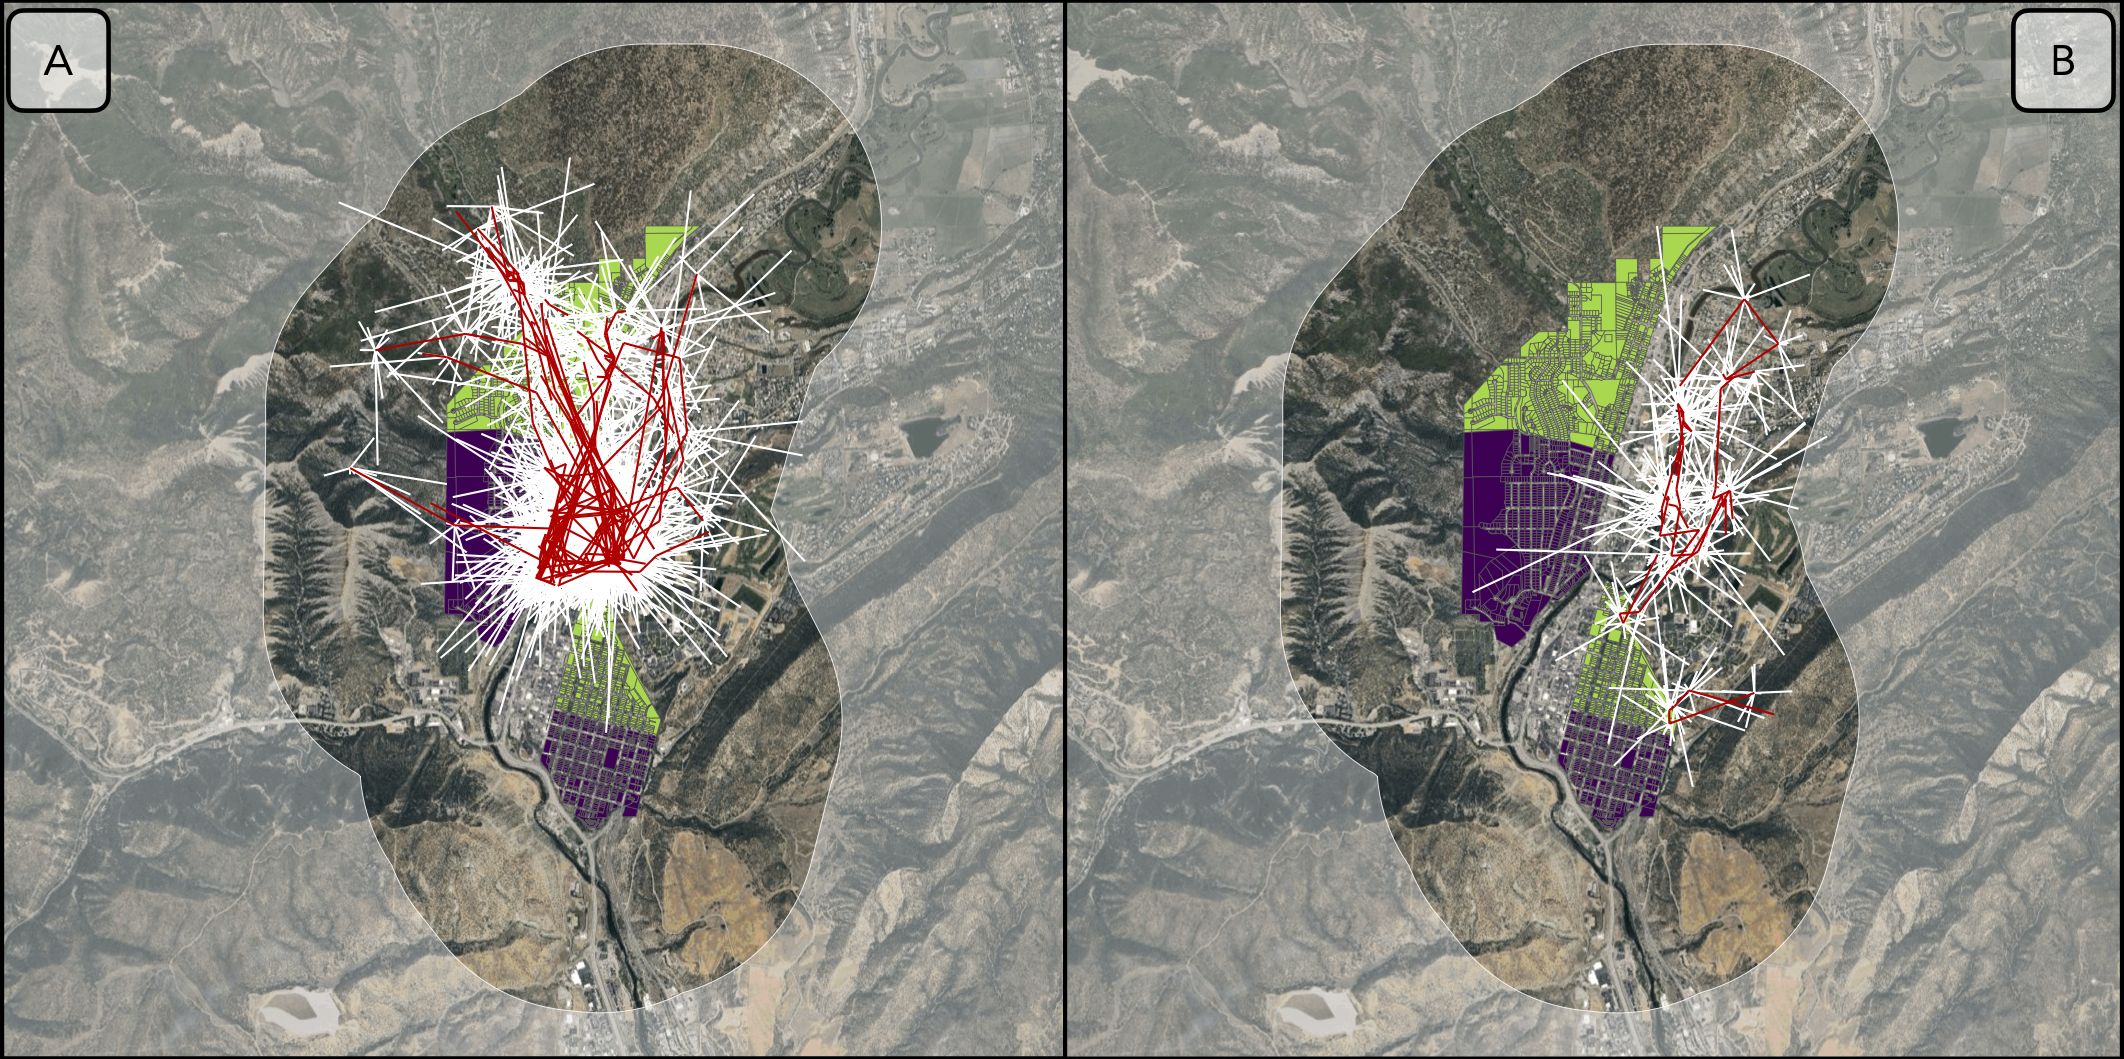
Figure 3. Examples of used (i.e., observed; red lines) and available (i.e., simulated; white lines) steps for two black bears (B27 and B51) in Durango, Colorado in 2013. (A) B27 extensively used the experimental area (i.e., control and treatment areas). (B) B51 had access to the experimental area but seldom used it. Base map source: Imagery © 2025 Airbus, Landsat/Copernicus, Maxar Technologies, USDA/FPAC/GEO.
First, we identified a base model (m0) by modeling the steps as a function of all possible combinations of five habitat predictors of the selection function , including log-distance to rivers, elevation, slope, canopy cover, and urban imperviousness as fixed effects. All models were fit assuming a constant movement kernel, to limit the candidate model set. Covariates were standardized and included as linear predictors, except elevation, slope, and imperviousness for which a quadratic effect was included. We identified the best model based on the lowest AICc value. The most supported combination of predictors became the structure of our base model, m0.
We used the base model (m0) as a null hypothesis that bears did not respond to the garbage-reduction treatment and tested several alternative hypotheses (models) against it. If the garbage-reduction treatment was successful at altering bear perceptions about reward and risk, we expected that after bear-resistant cans were distributed, bears would abandon “forage” behavior in treatment areas by: (1) avoiding treatment areas (m1); (2) displaying faster and straighter movements in treatment areas relative to pre-implementation conditions and to the control areas (m2); or (3) both avoiding treatment areas and increasing movement (i.e., “fleeing”; m3; Table 1). We expected that these responses could vary with time since implementation if repeated exposure to the bear-resistant garbage containers contributed to bear learning and strengthened their response. Therefore, we fit models with an interactive effect of treatment and “time since implementation” (m4, m5, and m6). Alternatively, bears’ responses to the treatment could be influenced by the availability of natural foods each year, where elevated urban activity would result from poor natural food conditions and would be biased towards control areas compared to treatment sites. Therefore, we fit models with an interactive effect of treatment and annual natural food availability (m7, m8, and m9). Finally, we also modeled the possibility that both time since implementation and annual natural food availability affected response to the treatment in m10, m11, and m12. For each effect tested (i.e., treatment, interaction with time since implementation and/or natural food availability), we tested whether the effect influenced: (1) bear selection, by including it as a predictor of the selection function (m1, m4, m7, and m10); (2) bear movement, by including it as a predictor of the movement function (m2, m5, m8, and m11); or (3) bear selection and movement, by including it as a predictor in both functions (m3, m6, m9, and m12) (Table 1). We identified the best supported hypothesis based on the lowest AICc value (Akaike, 1974).
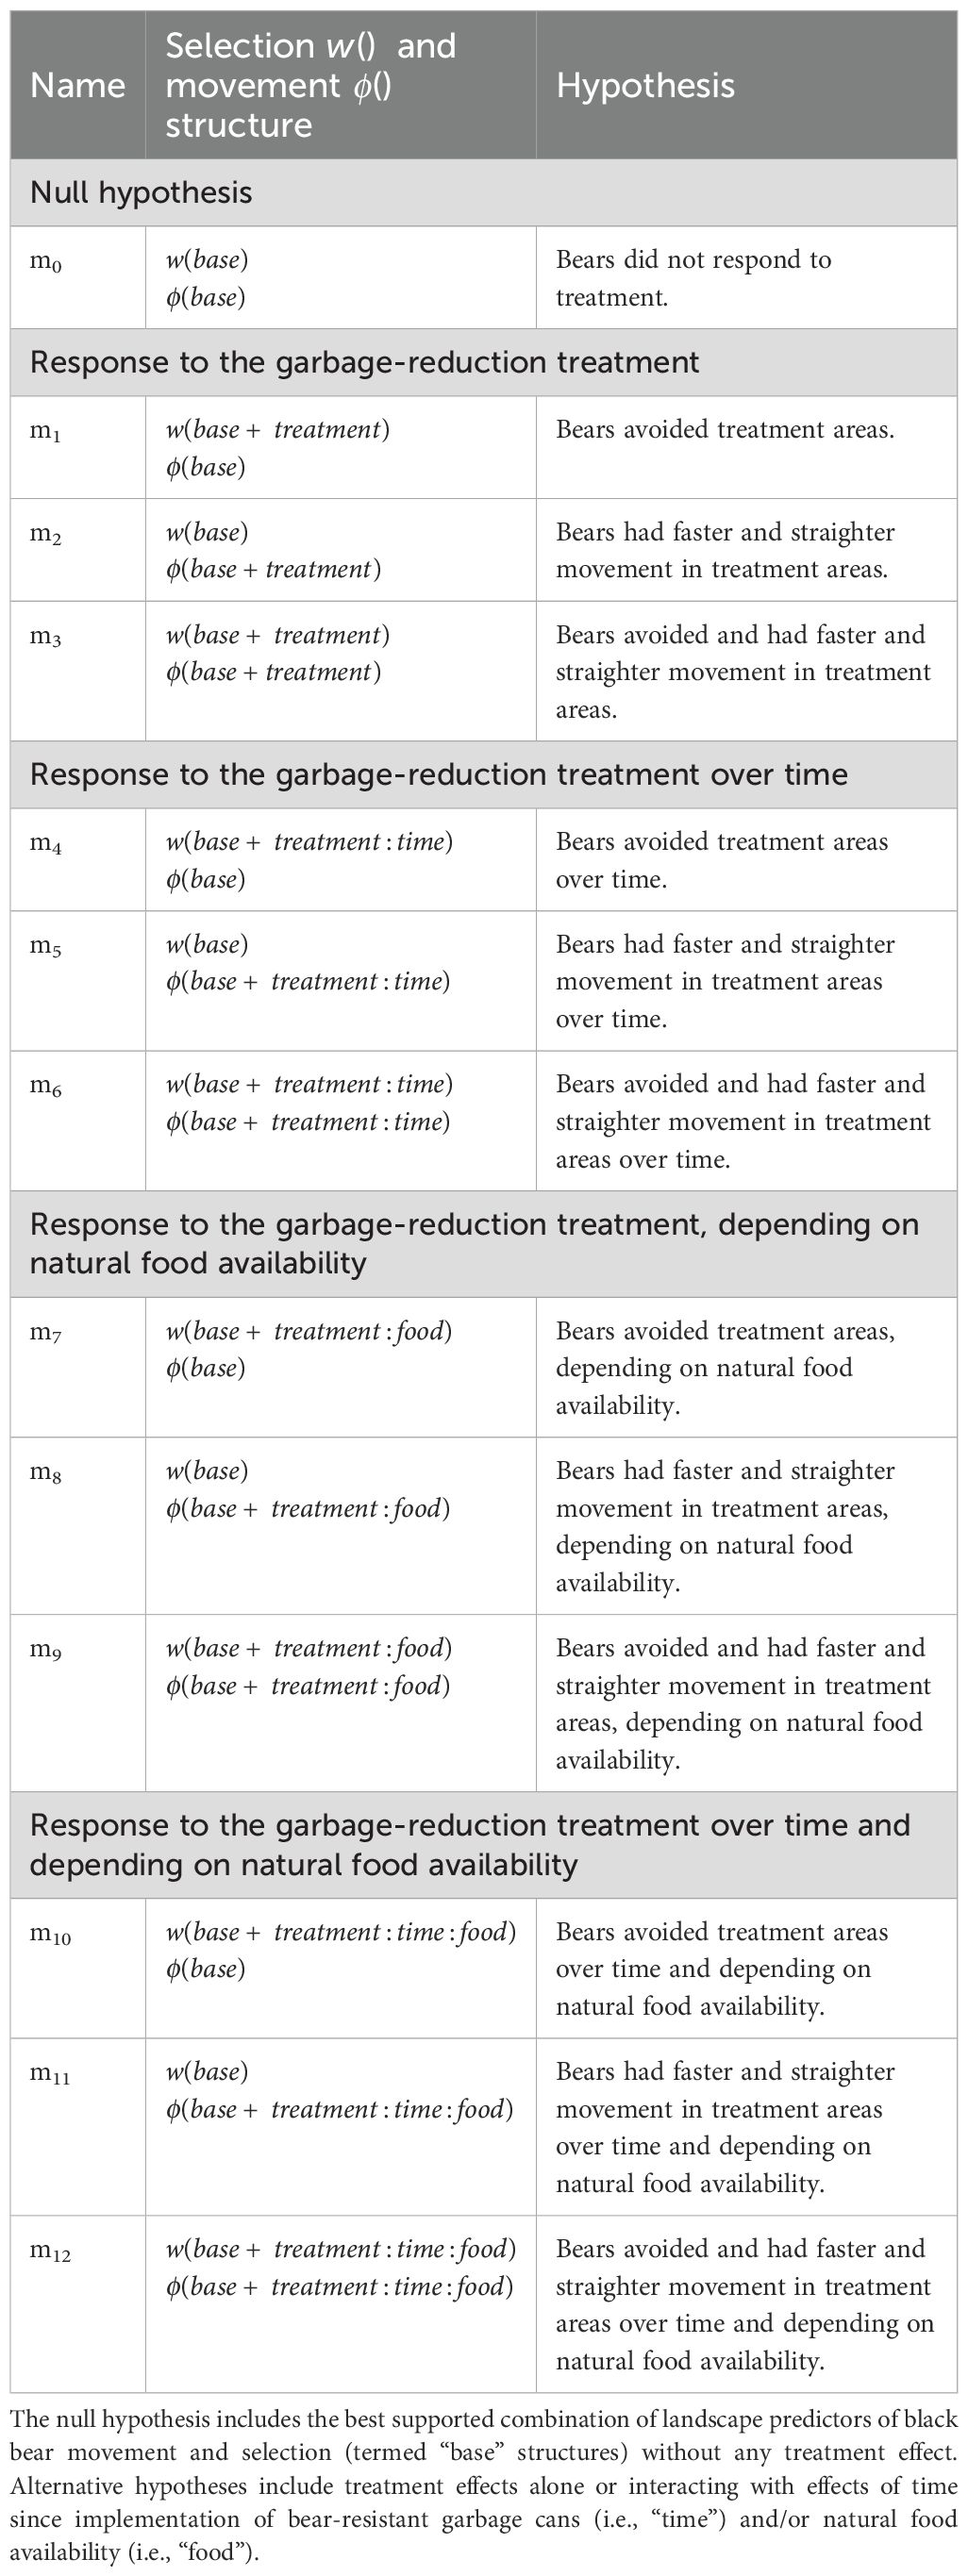
Table 1. Model structures used to test hypotheses regarding the effect of the garbage-reduction treatment (i.e., “treatment”) on black bear selection and movement .
To evaluate the predictive ability of our best supported model, we used a five-fold cross-validation procedure (Boyce et al., 2002). For each individual-year, we randomly selected 80% of steps to estimate model parameters while holding out 20% of steps for validation. We predicted the probability of use of the used steps retained for validation and divided these predicted values in 10 equal area bins. Each bin was characterized by a bin score, which was the central value of the bin (i.e., 0.05, 0.15, 0.25, 0.35, 0.45, 0.55, 0.65, 0.75, 0.85, 0.95) and by a bin frequency, which was the number of used steps for which the predicted probability of use fell into that bin. We adjusted bin frequencies by dividing them by the number of available steps (from validation data) for which the predicted probability of use fell into that bin. We calculated the Spearman rank correlation (rs) between the bin scores and the bin adjusted frequencies. High predictive performance is indicated by strong positive correlations because more used locations are within higher predicted use bins (Boyce et al., 2002). We rotated data held for validation and iteratively estimated Spearman rank correlations for each validation fold (k).
To report effect size predicted under our best model, we predicted the relative probability of use at all available locations, where we used the observed value for the covariate of interest while maintaining all other predictors at their mean, following (Avgar et al., 2017). We did so at the population level (i.e., across all individual-years) and, to further investigate the effect of treatment over time, we also predicted use at the individual level, only retaining individuals with data available at least one year before and two years or more after implementation. To report effects on movement rates, we predicted speed by multiplying the shape and scale parameters of the gamma distribution and straightness by reporting the concentration parameter of the Von Mises distribution (Avgar et al., 2016; Prokopenko et al., 2017).
Analyses were completed using R version 4.4.0 (R Core Team, 2024) and the packages ‘Animal Movement Tools’ (amt, version 0.2.2.0) (Signer et al., 2019) and ‘Generalized Linear Mixed Models using Template Model Builder’ (glmmTMB, version. 1.1.10.) (Brooks et al., 2017).
3 Results
3.1 Black bear data
During summers 2011-2016, GPS collar locations were collected from 76 adult female black bears across 2,546 km2; all individuals ranged far beyond the Durango city limits. Of these bears, 16 individuals had steps intersecting our study area (i.e., 1.5-km buffer around the experimental area) and period of interest (i.e., July-September). We analyzed a total of 4,198 used steps from these 16 bears across 6 years. Of these individuals, 6 had steps collected exclusively before the treatment was implemented (i.e., 2011-2012), 5 had steps collected exclusively after the treatment was implemented (i.e., 2013-2016), and 5 had steps collected both before and after the treatment was implemented (Supplementary Table S1). Of the 5 bears with steps before and after treatment implementation, 3 had steps collected both before and multiple years after the treatment was implemented and were used to investigate the effect of treatment over time. In the post-treatment years, 3 other individuals were active only at the edge of the buffer and were far away enough from the experimental area that neither their used nor their available steps overlapped the treatment area. However, all these individuals were included because they informed the effect of the other habitat covariates evaluated as predictors of bear selection. In total, the effect of the treatment on selection and movement was informed by 15 individual-years (i.e., 7 individuals across 2013-2016) (Supplementary Table S2).
3.2 Effect of habitat covariates on bear selection and movement
Baseline habitat covariates that predicted bear resource selection included percent canopy cover, elevation, distance to rivers, slope, and percent urban imperviousness (Figure 4; refer to Supplementary Table S3 for model selection results and to Supplementary Table S4 for model coefficients). These five habitat variables were included in our base model (m0) representing the null hypothesis. As predicted, collared bears selected areas with higher canopy cover, lower elevation, closer to rivers and streams, steeper slopes, and intermediate levels of imperviousness, which corresponded to residential neighborhoods with larger backyards and some impervious surfaces. Within our study area, undeveloped areas (i.e., open space natural areas) and areas with higher imperviousness (i.e., apartment complexes, commercial and industrial areas) had lower predicted probabilities of use.
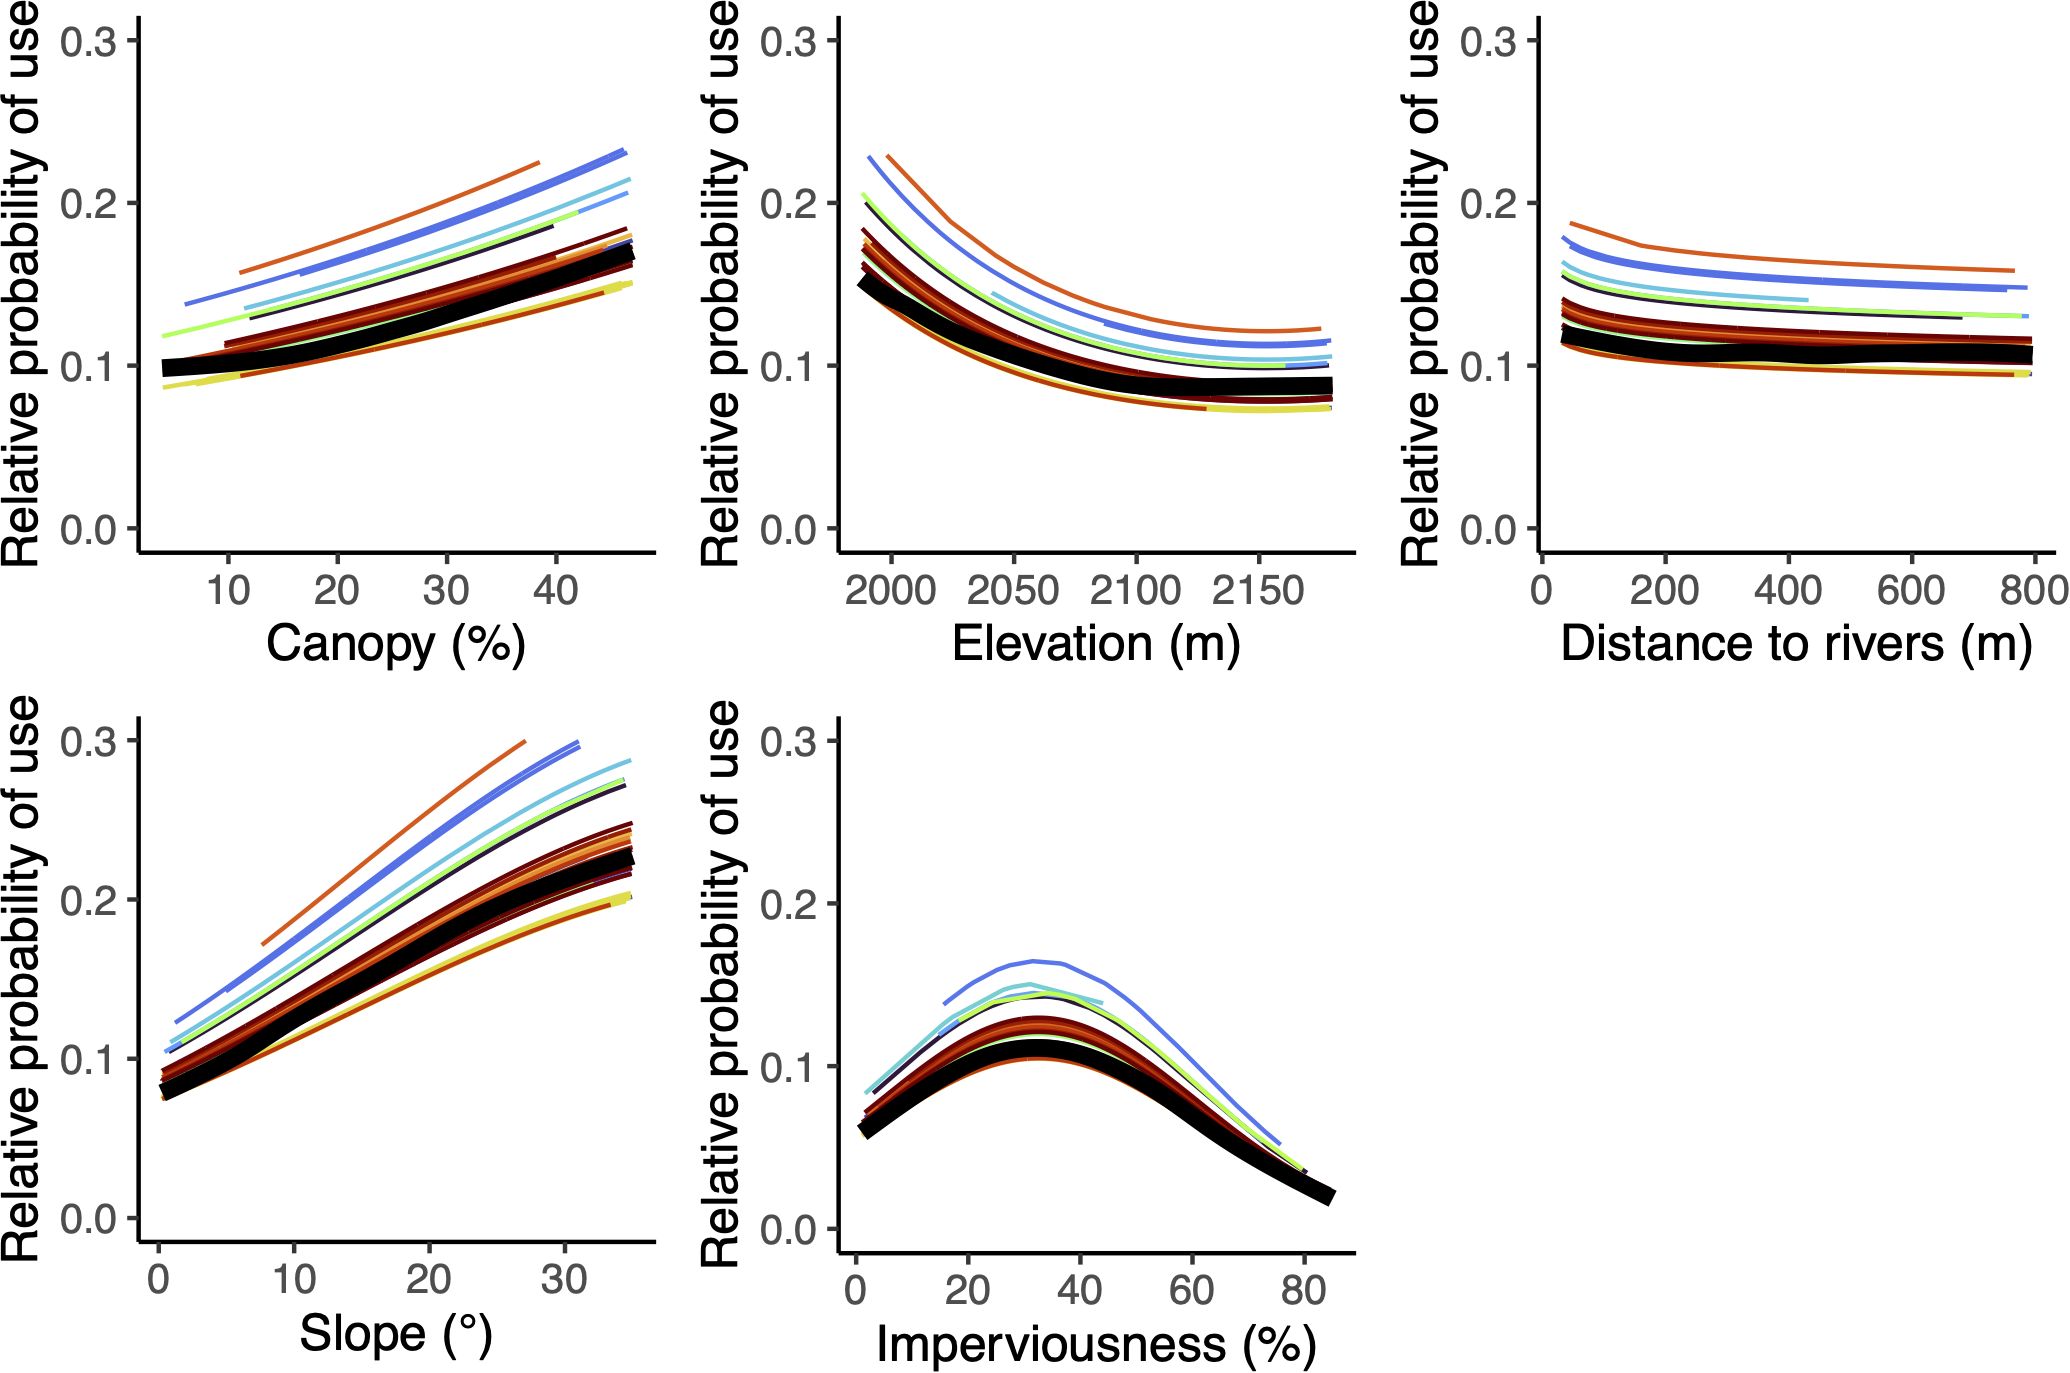
Figure 4. Estimated effects of percent canopy cover, elevation, distance to rivers, slope, and imperviousness on the relative probability of use by black bears in Durango, Colorado (2011-2016), included in the base model (m0). Each colored line represents a unique individual-year, with one color for each bear individual (i.e., some colors appear 2–3 times to represent the same bear in different years). Thicker black lines show the population average response.
3.3 Effect of garbage reduction on bear selection and movement
After accounting for important habitat covariates, we tested multiple hypotheses regarding the effect of the garbage-reduction treatment on bear resource selection and movement, including the interacting effects of time since implementation and annual natural food availability. Of these hypotheses, the best supported model was m4 (AICc weight = 0.91), which included the interactive effects of the garbage-reduction treatment and time since implementation on resource selection but no effect of treatment on movement (Table 2). Model m4 demonstrated a significant cross-validated Spearman-rank correlation (rs = 0.77; p = 0.01), indicating good model performance (Boyce et al., 2002; refer to Supplementary Table S5 for Spearman-rank correlations of each validation fold). Importantly, under m4, the predicted relative probability of use for collared bears slightly increased in control areas over the years following implementation (i.e., 2013-2016) but decreased over the same years in treatment areas (Table 3, Figure 5). Between 2013 and 2016, the average probability of use increased 10% in control areas (2013: probability = 0.107, sd = 0.006; 2016: probability = 0.117, sd = 0.016) and decreased 30% in treatment areas (2013: probability = 0.119, sd = 0.004; 2016: probability = 0.084, sd = 0.010). Individual predictions of use under m4 for the three bears with data available both before and multiple years after implementation (i.e., B27, B7, and B125) showed that each bear reduced her relative use of treatment areas compared to control areas post-treatment (Figure 6). Notably, all 3 bears showed a slightly stronger selection for treatment areas in 2013, but they all reduced their use of treatment areas across the study period and instead selected for control areas.

Table 2. AICc-based model selection results for generalized linear mixed models of black bear selection and movement testing the effect of the garbage-reduction treatment (i.e., “treatment”), including interacting effects of time since implementation (i.e., “time”) and natural food availability (i.e., “food”) in Durango, Colorado, 2011-2016.
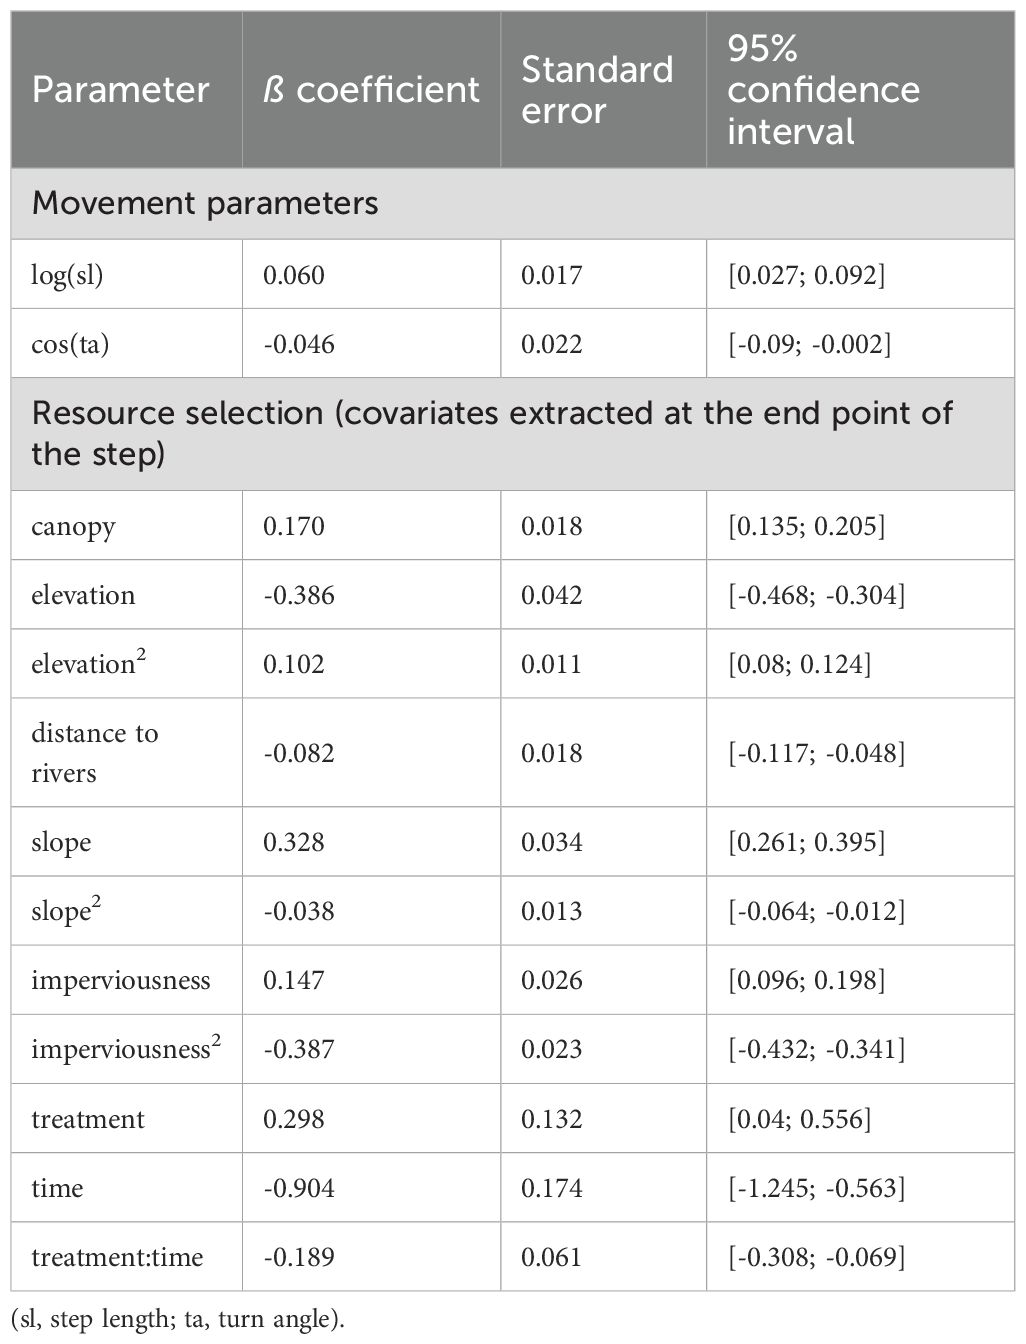
Table 3. Standardized coefficients from the best supported model of black bear selection and movement (m4) in Durango, Colorado.
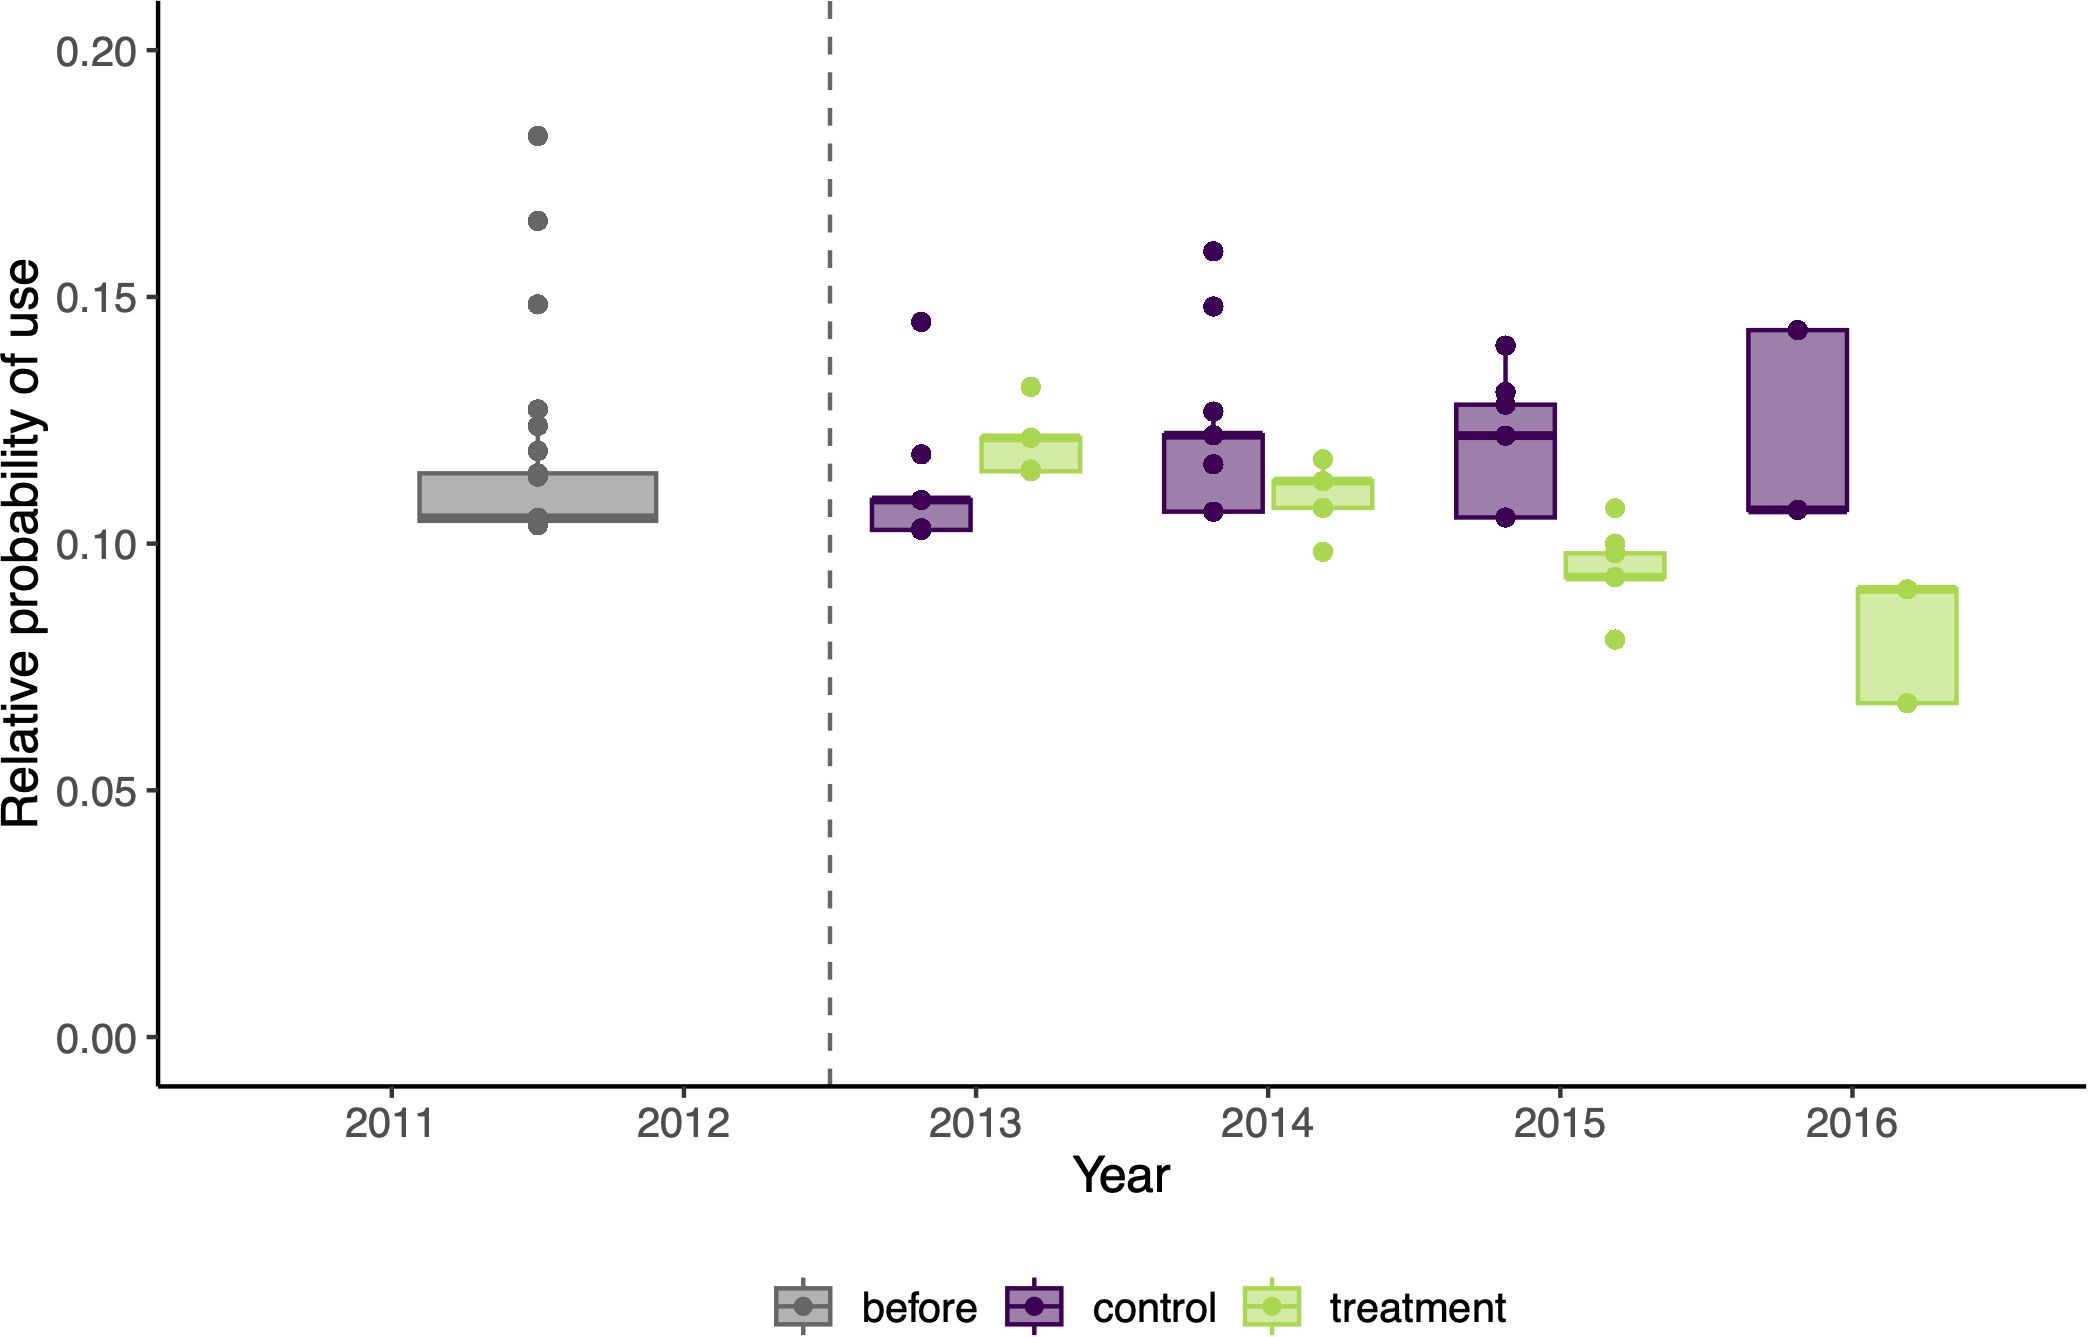
Figure 5. Estimated effect of the garbage-reduction treatment on the relative probability of use of black bears, predicted under the best supported model m4, over the years before and after implementation in Durango, Colorado. Boxplots represent the distribution of values for individual-years (1) before treatment implementation (grey) and (2) after treatment in control (purple) and treatment areas (green). The vertical dashed line shows the year of implementation of the treatment.
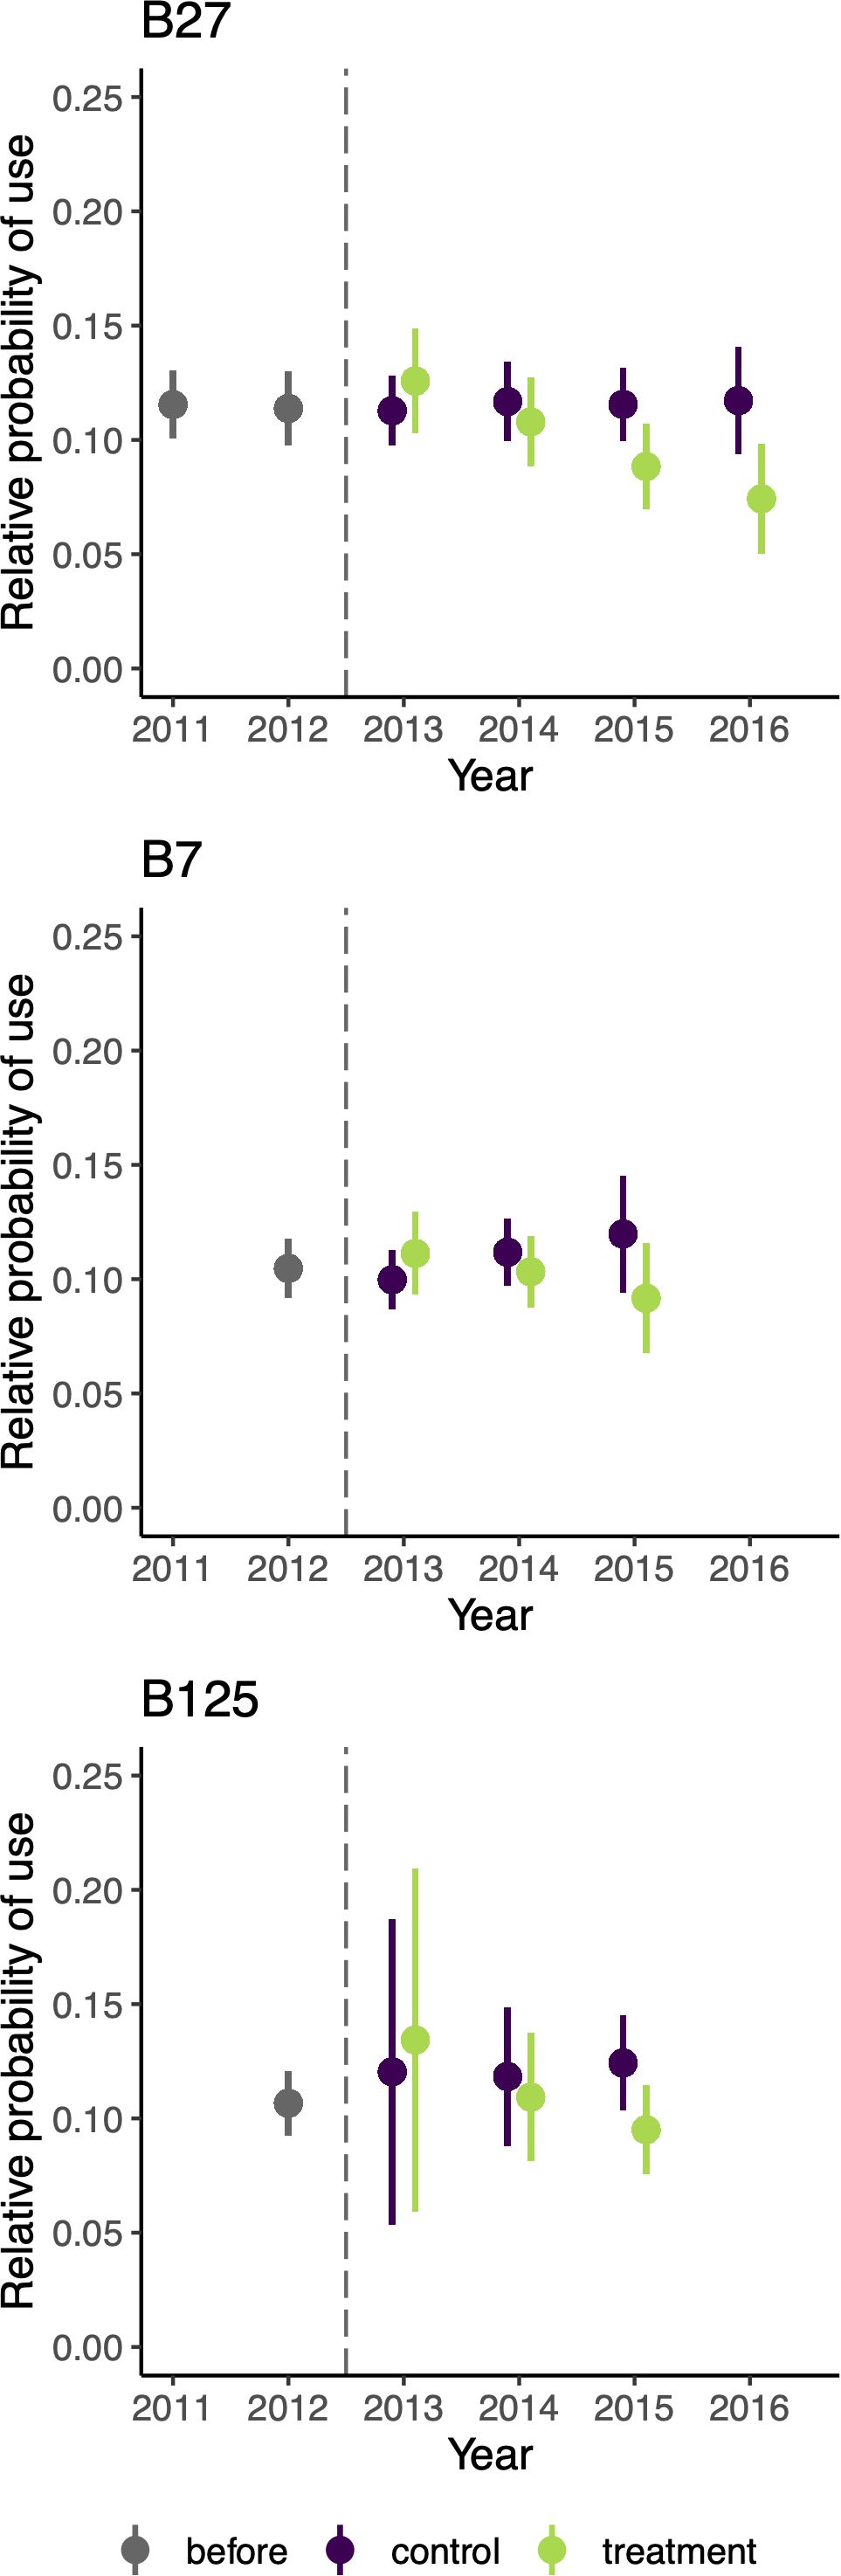
Figure 6. Estimated effect of the garbage-reduction treatment on the relative probability of use of black bears, predicted under the best supported model m4, over the years before and after implementation, for individuals with data available both before and more than 2 years after the treatment: B27 (top), B7 (center), and B125 (bottom). Predicted use is represented (1) before treatment implementation (grey) and (2) after treatment in control (purple) and treatment areas (green). Error bars show the 95% confidence intervals. The vertical dashed line shows the year of implementation of treatment.
To address our questions related to the effect of treatment on movement, we investigated the results of the next best supported hypothesis (m6, ΔAICc = 4.78, AICc weight = 0.08, coefficient estimates available in Supplementary Table S6). This hypothesis included an interactive effect of the garbage-reduction treatment and time since implementation on both resource selection and movement. This second-best model (m6) included estimating six additional parameters in comparison to the best hypothesis m4. The effect of treatment on the speed of collared bear movements was small and its direction varied over the years after implementation (Figure 7), thus not clearly confirming or refuting our hypotheses. The predicted straightness of steps remained constant in control areas but slightly increased in treatment areas over the years since implementation (Figure 7), supporting our hypotheses. However, the coefficients representing effects on straightness had 95% confidence intervals overlapping 0 (Supplementary Table S6). Overall, effects on movement were poorly supported (Table 2).

Figure 7. Estimated effect of the garbage-reduction treatment on the movement rates of black bears, including speed and straightness, predicted under the second-best supported model m6, over the years before and after implementation in Durango, Colorado. Boxplots represent the distribution of values for individual-years (1) before treatment implementation (grey) and (2) after treatment in control (purple) and treatment areas (green). The vertical dashed line shows the year of implementation of the treatment.
Other hypotheses including effects of natural food availability received little support relative to m4 and m6 (AICc weights ≤ 0.01).
4 Discussion
Our study provided insight into the fine-scale behavioral responses of black bears to wide-scale urban bear-proofing, suggesting bears perceived and reacted to this management intervention. Knowledge about the behavioral responses of animals, including resource selection (Greggor et al., 2020), movement (Avgar et al., 2013), and learning (Verzuh et al., 2024), can be indicators of success of management actions and can help advance wildlife conservation (Blumstein and Fernández-Juricic, 2004, 2010). In the case of the garbage-reduction experiment in Durango, we expected black bears to avoid treatment areas and increase movement rates, including speed and straightness, compared to control areas and to pre-implementation conditions (Dickie et al., 2020). Consistent with these predictions, bears avoided residential areas where garbage availability had been reduced and this avoidance response increased over time, suggesting learning. However, bear movement rates were not notably affected by the garbage reduction. While our inferences were based on a small number of collared female bears, they demonstrate the effectiveness of bear-resistant garbage containers in modifying black bear behavior in a way that reduces the risk of urban human-bear conflict.
Over the four years following the distribution of bear-resistant garbage containers in the treatment areas, the probability of use of the treatment sites by a bear slightly decreased from ~12% in 2013 to ~8% in 2016 (a decline of ~30%). In the same period, bear activity slightly increased in control areas (11% in 2013 and 12% in 2016). Following the approach-avoid framework (Greggor et al., 2020), bear-resistant garbage containers were effective at de-valuing trash as an attractant and at altering the economics of foraging decision-making. This is consistent with previous findings that the garbage reduction in Durango was effective at reducing the number of events of bears eating garbage (Johnson et al., 2018), and with previous studies that established that bear-proofing efforts helped reduce self-reported human-bear conflicts (Barrett et al., 2023) and the amount of human foods in bear diets (Hopkins et al., 2014). Importantly, our study suggests the mechanism driving these reductions in conflicts, i.e., the decline in bear use of bear-proofed areas due to a direct change in bear behavior. In addition, reduced bear activity in residential areas due to bear-resistant containers also likely alleviated non-garbage-related risks, including risks to people, domestic pets, and property as well as risks to bears via lethal control or vehicle collisions.
Containers employed in this study used a manual locking mechanism (refer to Supplementary Figure S1); therefore, effectiveness was dependent on resident compliance. During the post-treatment years (2013-2016), the average annual compliance rate in treatment areas was 71% (Johnson et al., 2018), which meant that some garbage was still available to bears. Currently, bear-resistant containers in Durango use an automatic locking mechanism that increases compliance rates (e.g., resident compliance when using automatically locking containers was 92% in Durango in 2021; C. Venumière-Lefebvre, Colorado State University, unpublished data, 2021). As a result, we expect the behavioral responses of bears to these new containers is likely stronger than those we estimated in our study.
Previous studies have determined that scarce natural food is an important driver of urban bear activity (Baruch-Mordo et al., 2014; Johnson et al., 2015) and conflicts (Zack et al., 2003; Laufenberg et al., 2018). Our results indicated that the effect of treatment was strongly influenced by time since implementation but not by interannual variations in the availability of natural foods. The four post-implementation years (i.e., 2013-2016) had variable mast availability (high: 2014, index = 25.4; low: 2015, index = 17.5) but were all moderate or good food years compared to a complete food failure year like 2012 (index = 5.6) (Johnson et al., 2018). Our finding that bear-resistant containers were effective even in years of lower food availability is encouraging. However, more research evaluating the effectiveness of these containers during food failure years is warranted considering their frequency is expected to increase with changes in global climate (Ummenhofer and Meehl, 2017; Li et al., 2025).
The time dependence of the selection response we observed is likely due to two factors: (1) a change in the individuals composing the population and (2) individual bear behavior change, suggesting learning or behavioral plasticity (Lee and Thornton, 2021). The composition of collared individual bears that used the study area shifted during the study period. For example, B51 used the study area only during the year prior to the implementation of garbage-reduction efforts (i.e., 2012) and the year just following it (i.e., 2013). In contrast, B124 and B480 used the study area only during the later years, after the treatment was implemented (i.e., 2015 and 2016, respectively) (Supplementary Table S1). However, black bears are also highly intelligent and capable of using spatial memory (Zamisch and Vonk, 2012) and learning foraging behavior (Mazur and Seher, 2008). When we plotted model predictions for three individuals with data both before and after implementation of the treatments (Figure 6), we observed that each bear reduced her activity in treatment areas over time; in contrast, no such decline was evident in the control areas. Despite the small sample size, this result potentially suggests individual learning, defined as the modification of an animal’s behavior in response to repeated positive or negative exposure (Shettleworth, 2010; Barrett et al., 2019). Indeed, Lewis et al. (2021) reflected on the challenge of measuring spatial learning in natural environments and suggested that it can be measured by improved performance (i.e., a change in behavior) as a function of time in the environment, such as in our study. Time indicates repeated exposure to the stimulus and the opportunity for bears to associate this stimulus (i.e., bear-resistant garbage containers) with the outcomes of behavior (i.e., lack of reward) (Sol et al., 2020; Lee and Thornton, 2021) likely driving our observed outcome.
Contrary to expectations, we did not find clear evidence that bears altered their movement rates (i.e., speed and straightness) in response to garbage-reduction efforts. Our results regarding the speed of individuals were inconclusive and straightness of bear steps increased in treatment areas, following our hypothesis, but not significantly. In reference to the four theoretical categories of behavioral responses outlined in Figure 2, our results suggest that bears might have responded to reduced garbage availability by altering their behavior along one dimension of our framework (i.e., resource selection) but not clearly along the other (i.e., movement rates). Results also suggest a shift in behavior away from the “forage” model, likely toward a “flee” response, but further analyses with more data could help clarify the movement response to treatment. Although animals are expected to increase their movement rates in response to reduced forage availability (Avgar et al., 2013), movement can be constrained by other factors, including energetic costs (Nevin and Gilbert, 2005), physical barriers impeding movement (e.g., roads, buildings, fences; Dickie et al., 2020), and unpredictable anthropogenic activities (Frid and Dill, 2002; Collins et al., 2022). As a result, multiple factors are likely operating simultaneously in complex urban landscapes, contributing to the lack of a clear and consistent movement response to the garbage-reduction treatment. Given that effects on movement rates are modeled in integrated step selection functions by interacting covariates with two movement parameters (i.e., log-step length and cosine of turn angles) (Avgar et al., 2016), and given our relatively restricted dataset, models testing hypotheses relating to movement were easily over-parameterized. Therefore, a larger dataset might be necessary to model the complex relationships driving bear movement responses.
In addition to quantifying the effect of the garbage reduction, we identified habitat covariates that were most predictive of bear activity in a developed landscape. As predicted, bears selected areas of high canopy cover, steep slopes, close to rivers and streams, and low elevations. Those areas were often vegetated and less developed and thus provided protection and food resources (Naiman and Rogers, 1997; Lyons et al., 2003; Johnson et al., 2015; Laufenberg et al., 2018). This selection for cover demonstrates the documented use of edges in heterogeneous anthropogenic landscapes by urban carnivores (Gehrt et al., 2010; Ordeñana et al., 2010; Leighton et al., 2022). In addition, bears selected areas of intermediate densities of development, following the urban intermediate disturbance hypothesis (Crooks, 2002; Gehrt et al., 2010). Specifically, bear activity peaked in residential neighborhoods with backyards, which offer a balance between anthropogenic food (e.g., garbage, birdseed, fruit trees) and risk (e.g., lower human activity than in commercial areas, smaller and quieter roads, and presence of vegetation cover in backyards) (Johnson et al., 2015; Evans et al., 2017; Laufenberg et al., 2018). This result supports the importance of targeting residential attractants in management actions to mitigate urban conflicts.
It is important to recognize that our dataset was limited to 16 adult female black bears, with seven of these collared individuals contributing to the reported effect of reduced garbage availability on resource selection. The focus on adult females was due to constraints inherent to our existing dataset, where adult females were initially targeted to estimate population dynamics of bears in the vicinity of Durango (Johnson et al., 2020). Further investigating effects of reducing anthropogenic attractants on bear resource selection using larger sample sizes or in different communities would help generalize our findings. In particular, evaluating the behavioral responses of male black bears to such alterations of anthropogenic resources availability would be insightful because males tend to have larger home ranges (Karelus et al., 2016) and longer activity periods (Lindzey and Meslow, 1976) than females. Although our behavioral results were restricted to adult female bears, notably, they closely aligned with trends of reduced conflicts during the same period, which were caused by bears of all sex and age classes in the study system (Johnson et al., 2018), suggesting that our findings may be relevant to these other segments of the bear population.
Evidence-based solutions to reduce human-carnivore conflicts are needed (Artelle et al., 2024), but it is often challenging to evaluate the effectiveness of different management actions. Experimental designs, which offer the most robust results, are difficult to conduct at the scales on which large carnivores operate. For example, the home range of an individual female black bear can average 20 km2 in size (Price et al., 2024); the total collar locations of the 16 bears included in our study from hyperphagia months covered 24 km2 (estimated from the median 95% minimum convex hull) or about five times the size of the control and treatment areas of our study. As a consequence, matching the scale of management actions to the behaviors of carnivores is often logistically and financially difficult. The experimental manipulation of attractants in Durango and the concurrent monitoring of black bear movement via GPS telemetry enabled a rare opportunity to evaluate the behavioral responses of bears to the garbage-reduction intervention.
Overall, our findings demonstrate that changes in residential garbage practices can be an effective management lever for reducing anthropogenic attractants in communities experiencing conflicts with bears. Although bear-resistant containers are expensive, our results indicate that they can measurably change the behavior of individual bears and that effectiveness is expected to increase over time, making it a strategic investment for communities, particularly if using automatically locking containers. In addition, human development-related mortality can cause population sinks or ecological traps for bears (Hostetler et al., 2009; Lamb et al., 2017; Johnson et al., 2020). Attractant management strategies such as the one implemented in Durango can help reduce bear use of developed areas and are likely to better maintain bear populations over time, especially considering likely increases in urbanization in the future.
Data availability statement
The data analyzed in this study is subject to the following licenses/restrictions: Data are owned by Colorado Parks and Wildlife and cannot be shared publicly. Anyone interested in accessing the dataset should contact Colorado Parks and Wildlife directly. Requests to access these datasets should be directed to Chuck Anderson, Y2h1Y2suYW5kZXJzb25Ac3RhdGUuY28udXM=. The code used to conduct the analysis is publicly available from GitHub at https://github.com/CassandreVL/bears-avoid-bear-proofed-neighborhoods.
Ethics statement
Ethical approval was not required for the study involving animals in accordance with the local legislation and institutional requirements because GPS location data of black bears in Durango was obtained from an existing dataset, owned by Colorado Parks and Wildlife. Initial data collection involving animals was approved by Colorado Parks and Wildlife; Animal Care and Use Protocol #01-2011.
Author contributions
CV-L: Investigation, Validation, Conceptualization, Software, Writing – original draft, Formal analysis, Project administration, Visualization, Methodology, Data curation. HJ: Writing – review & editing, Supervision, Conceptualization, Software, Investigation, Methodology, Funding acquisition, Project administration, Validation, Resources, Data curation. SB: Funding acquisition, Conceptualization, Supervision, Methodology, Resources, Writing – review & editing, Investigation. MA: Conceptualization, Resources, Writing – review & editing, Funding acquisition. KC: Writing – review & editing, Funding acquisition, Conceptualization, Resources, Supervision, Methodology.
Funding
The author(s) declare financial support was received for the research and/or publication of this article. This research was funded by Colorado Parks and Wildlife, the USDA National Wildlife Research Center and the Colorado State University Center for Human-Carnivore Coexistence.
Acknowledgments
We thank Colorado Parks and Wildlife and the City of Durango for supporting and facilitating the bear-proofing experiment. We also thank all the people that collected field data including K. Allen, C. Anton, G. Colligan, T. Day, R. Dorendorf, E. Dowling, M. Glow, M. Grode, A. Groves, C. Jager, P. Lundberg, A. May, L. Mengak, R. Much, S. Ogden, M. Preisler, G. Sanchez, L. Vander Vennon, K. Weber, A. Welander, R. Wilbur, and L. Willmarth. We thank C. Anderson and M. Vieira for facilitating access to the dataset. We thank M. Belotti, K. Horton, and T. Verzuh for their help with methodology and interpretation, and we thank L. Bailey, E. Brandell, J. Ivan, N. Jaffe, C. Schultz for providing constructive feedback on the manuscript. Finally, we thank R. Gonser, R. Jensen, and S. Petersen for their invitation to contribute to this journal issue, and the reviewers for reviewing our manuscript. Any use of trade, firm, or product names is for descriptive purposes only and does not imply endorsement by the U.S. Government.
Conflict of interest
The authors declare that the research was conducted in the absence of any commercial or financial relationships that could be construed as a potential conflict of interest.
Generative AI statement
The author(s) declare that no Generative AI was used in the creation of this manuscript.
Any alternative text (alt text) provided alongside figures in this article has been generated by Frontiers with the support of artificial intelligence and reasonable efforts have been made to ensure accuracy, including review by the authors wherever possible. If you identify any issues, please contact us.
Publisher’s note
All claims expressed in this article are solely those of the authors and do not necessarily represent those of their affiliated organizations, or those of the publisher, the editors and the reviewers. Any product that may be evaluated in this article, or claim that may be made by its manufacturer, is not guaranteed or endorsed by the publisher.
Supplementary material
The Supplementary Material for this article can be found online at: https://www.frontiersin.org/articles/10.3389/fevo.2025.1657106/full#supplementary-material
References
Abay G. Y., Bauer H., Gebrihiwot K., and Deckers J. (2011). Peri-urban spotted hyena (Crocuta crocuta) in Northern Ethiopia: diet, economic impact, and abundance. Eur. J. Wildl. Res. 57, 759–765. doi: 10.1007/s10344-010-0484-8
Akaike H. (1974). A new look at the statistical model identification. IEEE Trans. Autom. Control 19, 716–723. doi: 10.1109/TAC.1974.1100705
Alberti M. (2005). The effects of urban patterns on ecosystem function. Int. Reg. Sci. Rev. 28, 168–192. doi: 10.1177/0160017605275160
Artelle K. A., Johnson H. E., McCaffery R., Schell C. J., Williams T. D., and Wilson S. M. (2024). From causes of conflict to solutions: shifting the lens on human–carnivore coexistence research. Conserv. Sci. Pract. 6, e13239. doi: 10.1111/csp2.13239
Avgar T., Lele S. R., Keim J. L., and Boyce M. S. (2017). Relative selection strength: quantifying effect size in habitat- and step-selection inference. Ecol. Evol. 7, 5322–5330. doi: 10.1002/ece3.3122
Avgar T., Mosser A., Brown G. S., and Fryxell J. M. (2013). Environmental and individual drivers of animal movement patterns across a wide geographical gradient. J. Anim. Ecol. 82, 96–106. doi: 10.1111/j.1365-2656.2012.02035.x
Avgar T., Potts J. R., Lewis M. A., and Boyce M. S. (2016). Integrated step selection analysis: bridging the gap between resource selection and animal movement. Methods Ecol. Evol. 7, 619–630. doi: 10.1111/2041-210X.12528
Barrett M. A., Barrett S. E., Telesco D. J., and Orlando M. A. (2023). Human–black bear interactions and public attitudinal changes in an urban ordinance zone. Hum.-Wildl. Interact. 17, 86–98. doi: 10.2307/27316540
Barrett L. P., Stanton L. A., and Benson-Amram S. (2019). The cognition of ‘nuisance’ species. Anim. Behav. 147, 167–177. doi: 10.1016/j.anbehav.2018.05.005
Baruch-Mordo S., Breck S. W., Wilson K. R., and Theobald D. M. (2008). Spatiotemporal distribution of black bear-human conflicts in Colorado, USA. J. Wildl. Manage. 72, 1853–1862. doi: 10.2193/2007-442
Baruch-Mordo S., Wilson K. R., Lewis D. L., Broderick J., Mao J. S., and Breck S. W. (2014). Stochasticity in natural forage production affects use of urban areas by black bears: implications to management of human-bear conflicts. PLoS One 9, e85122. doi: 10.1371/journal.pone.0085122
Bateman P. W. and Fleming P. A. (2012). Big city life: carnivores in urban environments. J. Zool. 287, 1–23. doi: 10.1111/j.1469-7998.2011.00887.x
Beckmann J. P. and Berger J. (2003). Rapid ecological and behavioural changes in carnivores: the responses of black bears (Ursus americanus) to altered food. J. Zool. 261, 207–212. doi: 10.1017/S0952836903004126
Beckmann J. P. and Lackey C. W. (2008). Carnivores, urban landscapes, and longitudinal studies. Hum.-Wildl. Confl. 2, 168–174. doi: 10.2307/24875662
Blumstein D. T. and Fernández-Juricic E. (2004). The emergence of conservation behavior. Conserv. Biol. 18, 1175–1177. doi: 10.1111/j.1523-1739.2004.00587.x
Blumstein D. T. and Fernández-Juricic E. (2010). A primer of conservation behavior. 1st Edition (Sunderland, Massachusetts, USA: Sinauer Associates, Inc. Publishers).
Bombieri G., Delgado M. D. M., Russo L. F., Garrote P. J., López-Bao J. V., Fedriani J. M., et al. (2018). Patterns of wild carnivore attacks on humans in urban areas. Sci. Rep. 8, 17728. doi: 10.1038/s41598-018-36034-7
Boyce M. S., Vernier P. R., Nielsen S. E., and Schmiegelow F. K. A. (2002). Evaluating resource selection functions. Ecol. Model. 157, 281–300. doi: 10.1016/S0304-3800(02)00200-4
Brooks M. E., Kristensen K., van Benthem K. J., Magnusson A., Berg C. W., Nielsen A., et al. (2017). glmmTMB balances speed and flexibility among packages for zero-inflated generalized linear mixed modeling. R J. 9, 378. doi: 10.32614/RJ-2017-066
Collins A. C., Vickers T. W., and Shilling F. M. (2022). Behavioral responses to anthropogenic noise at highways vary across temporal scales. Front. Ecol. Evol. 10. doi: 10.3389/fevo.2022.891595
Colorado Parks and Wildlife (2023). Black bear overall range. Available online at: https://geodata.colorado.gov/datasets/50322b83e815436aadf588757822e72f_22/explore (Accessed October 3, 2024).
Crooks K. R. (2002). Relative sensitivities of mammalian carnivores to habitat fragmentation. Conserv. Biol. 16, 488–502. doi: 10.1046/j.1523-1739.2002.00386.x
Davison J., Roper T. J., Wilson C. J., Heydon M. J., and Delahay R. J. (2011). Assessing spatiotemporal associations in the occurrence of badger–human conflict in England. Eur. J. Wildl. Res. 57, 67–76. doi: 10.1007/s10344-010-0400-2
Dickie M., McNay S. R., Sutherland G. D., Cody M., and Avgar T. (2020). Corridors or risk? Movement along, and use of, linear features varies predictably among large mammal predator and prey species. J. Anim. Ecol. 89, 623–634. doi: 10.1111/1365-2656.13130
Ditmer M. A., Noyce K. V., Fieberg J. R., and Garshelis D. L. (2018a). Delineating the ecological and geographic edge of an opportunist: the American black bear exploiting an agricultural landscape. Ecol. Model. 387, 205–219. doi: 10.1016/j.ecolmodel.2018.08.018
Ditmer M. A., Rettler S. J., Fieberg J. R., Iaizzo P. A., Laske T. G., Noyce K. V., et al. (2018b). American black bears perceive the risks of crossing roads. Behav. Ecol. 29, 667–675. doi: 10.1093/beheco/ary020
Dormann C. F., Elith J., Bacher S., Buchmann C., Carl G., Carré G., et al. (2013). Collinearity: a review of methods to deal with it and a simulation study evaluating their performance. Ecography 36, 27–46. doi: 10.1111/j.1600-0587.2012.07348.x
Evans M. J., Rittenhouse T. A. G., Hawley J. E., and Rego P. W. (2017). Black bear recolonization patterns in a human-dominated landscape vary based on housing: new insights from spatially explicit density models. Landsc. Urban Plan. 162, 13–24. doi: 10.1016/j.landurbplan.2017.01.009
Fieberg J., Signer J., Smith B., and Avgar T. (2021). A ‘how to’ guide for interpreting parameters in habitat-selection analyses. J. Anim. Ecol. 90, 1027–1043. doi: 10.1111/1365-2656.13441
Forester J. D., Im H. K., and Rathouz P. J. (2009). Accounting for animal movement in estimation of resource selection functions: sampling and data analysis. Ecology 90, 3554–3565. doi: 10.1890/08-0874.1
Fortin D., Beyer H. L., Boyce M. S., Smith D. W., Duchesne T., and Mao J. S. (2005). Wolves influence elk movements: behavior shapes a trophic cascade in Yellowstone National Park. Ecology 86, 1320–1330. doi: 10.1890/04-0953
Frid A. and Dill L. M. (2002). Human-caused disturbance stimuli as a form of predation risk. Conserv. Ecol. 6, art11. doi: 10.5751/ES-00404-060111
Fusaro J. L., Conner M. M., Conover M. R., Taylor T. J., Kenyon M. W. Jr., Sherman J. R., et al. (2017). Comparing urban and wildland bear densities with a DNA-based capture-mark-recapture approach. Hum.-Wildl. Interact. 11, 50–63. doi: 10.2307/27315365
Galluzzi A., DonFrancesco V., Mastrantonio G., Sulli C., and Ciucci P. (2021). Cost of coexisting with a relict large carnivore population: impact of Apennine brown bears 2005–2015. Animals 11, 1453. doi: 10.3390/ani11051453
Gantchoff M. G., Hill J. E., Kellner K. F., Fowler N. L., Petroelje T. R., Conlee L., et al. (2020). Mortality of a large wide-ranging mammal largely caused by anthropogenic activities. Sci. Rep. 10, 8498. doi: 10.1038/s41598-020-65290-9
Garshelis D. L., Noyce K. V., Ditmer M. A., Coy P. L., Tri A. N., Laske T. G., et al. (2020). “Remarkable adaptations of the American black bear help explain why it is the most common bear: a long-term study from the center of its range,” in Bears of the World. Eds. Penteriani V. and Melletti M. (Cambridge: Cambridge University Press), 53–62. doi: 10.1017/9781108692571.006
Gehrt S. D., Riley S. P. D., and Cypher B. L. (2010). Urban carnivores: ecology, conflict, and conservation. (Baltimore: Johns Hopkins University Press). doi: 10.56021/9780801893896
Greggor A. L., Berger-Tal O., and Blumstein D. T. (2020). The rules of attraction: the necessary role of animal cognition in explaining conservation failures and successes. Annu. Rev. Ecol. Evol. Syst. 51, 483–503. doi: 10.1146/annurev-ecolsys-011720-103212
Grimm N. B., Faeth S. H., Golubiewski N. E., Redman C. L., Wu J., Bai X., et al. (2008). Global change and the ecology of cities. Science 319, 756–760. doi: 10.1126/science.1150195
Herrero S., Higgins A., Cardoza J. E., Hajduk L. I., and Smith T. S. (2011). Fatal attacks by American black bear on people: 1900–2009. J. Wildl. Manage. 75, 596–603. doi: 10.1002/jwmg.72
Homstol L., Raymond S., Edwards C., Hamilton A. N., and St. Clair C. C. (2024). Aversive conditioning increases short-term wariness but does not change habitat use in black bears associated with conflict. PLoS One 19, e0295989. doi: 10.1371/journal.pone.0295989
Hopkins J. B. (2013). Use of genetics to investigate socially learned foraging behavior in free-ranging black bears. J. Mammal. 94, 1214–1222. doi: 10.1644/13-MAMM-A-009.1
Hopkins J. B., Koch P. L., Ferguson J. M., and Kalinowski S. T. (2014). The changing anthropogenic diets of American black bears over the past century in Yosemite National Park. Front. Ecol. Environ. 12, 107–114. doi: 10.1890/130276
Hostetler J. A., Walter McCown J., Garrison E. P., Neils A. M., Barrett M. A., Sunquist M. E., et al. (2009). Demographic consequences of anthropogenic influences: Florida black bears in north-central Florida. Biol. Conserv. 142, 2456–2463. doi: 10.1016/j.biocon.2009.05.029
IUCN (International Union for Conservation of Nature). (2016). Ursus americanus (spatial data). The IUCN Red List of Threatened Species. Version 2024-2. (Accessed October 3, 2024).
Johnson H. E., Breck S. W., Baruch-Mordo S., Lewis D. L., Lackey C. W., Wilson K. R., et al. (2015). Shifting perceptions of risk and reward: dynamic selection for human development by black bears in the western United States. Biol. Conserv. 187, 164–172. doi: 10.1016/j.biocon.2015.04.014
Johnson H. E., Lewis D. L., and Breck S. W. (2020). Individual and population fitness consequences associated with large carnivore use of residential development. Ecosphere 11, 1–23. doi: 10.1002/ecs2.3098
Johnson H. E., Lewis D. L., Lischka S. A., and Breck S. W. (2018). Assessing ecological and social outcomes of a bear-proofing experiment: bear-proofing to reduce human-bear conflicts. J. Wildl. Manage. 82, 1102–1114. doi: 10.1002/jwmg.21472
Karelus D. L., McCown J. W., Scheick B. K., Kerk M. V. D., and Oli M. K. (2016). Home ranges and habitat selection by black bears in a newly colonized population in florida. Southeast. Nat. 15, 346. doi: 10.1656/058.015.0215
Klees Van Bommel J., Sun C., Ford A. T., Todd M., and Burton A. C. (2022). Coexistence or conflict: Black bear habitat use along an urban-wildland gradient. PLoS One 17, e0276448. doi: 10.1371/journal.pone.0276448
Lamb C. T., Mowat G., McLellan B. N., Nielsen S. E., and Boutin S. (2017). Forbidden fruit: human settlement and abundant fruit create an ecological trap for an apex omnivore. J. Anim. Ecol. 86, 55–65. doi: 10.1111/1365-2656.12589
Landy F. (Ed.) (2018). From urban national parks to natured cities in the global South: the quest for naturbanity (Singapore: Springer Singapore). doi: 10.1007/978-981-10-8462-1
Laufenberg J. S., Johnson H. E., Doherty P. F., and Breck S. W. (2018). Compounding effects of human development and a natural food shortage on a black bear population along a human development-wildland interface. Biol. Conserv. 224, 188–198. doi: 10.1016/j.biocon.2018.05.004
Lee V. E. and Thornton A. (2021). Animal cognition in an urbanised world. Front. Ecol. Evol. 9. doi: 10.3389/fevo.2021.633947
Leighton G. R. M., Bishop J. M., Merondun J., Winterton D. J., O’Riain M. J., and Serieys L. E. K. (2022). Hiding in plain sight: risk mitigation by a cryptic carnivore foraging at the urban edge. Anim. Conserv. 25, 244–258. doi: 10.1111/acv.12732
Lewis D. L., Baruch-Mordo S., Wilson K. R., Breck S. W., Mao J. S., and Broderick J. (2015). Foraging ecology of black bears in urban environments: guidance for human-bear conflict mitigation. Ecosphere 6, 1–18. doi: 10.1890/ES15-00137.1
Lewis M. A., Fagan W. F., Auger-Méthé M., Frair J., Fryxell J. M., Gros C., et al. (2021). Learning and animal movement. Front. Ecol. Evol. 9. doi: 10.3389/fevo.2021.681704
Li D., Belitz M., Campbell L., and Guralnick R. (2025). Extreme weather events have strong but different impacts on plant and insect phenology. Nat. Clim. Change 15, 321–328. doi: 10.1038/s41558-025-02248-7
Lindzey F. G. and Meslow E. C. (1976). Winter dormancy in black bears in Southwestern Washington. J. Wildl. Manage. 40, 408. doi: 10.2307/3799942
Lischka S. A., Teel T. L., Johnson H. E., and Crooks K. R. (2019). Understanding and managing human tolerance for a large carnivore in a residential system. Biol. Conserv. 238, 108189. doi: 10.1016/j.biocon.2019.07.034
Lyons A. L., Gaines W. L., and Servheen C. (2003). Black bear resource selection in the Northeast Cascades, Washington. Biol. Conserv. 113, 55–62. doi: 10.1016/S0006-3207(02)00349-X
Mazur R. and Seher V. (2008). Socially learned foraging behaviour in wild black bears, Ursus americanus. Anim. Behav. 75, 1503–1508. doi: 10.1016/j.anbehav.2007.10.027
McKinney M. L. (2006). Urbanization as a major cause of biotic homogenization. Biol. Conserv. 127, 247–260. doi: 10.1016/j.biocon.2005.09.005
Muff S., Signer J., and Fieberg J. (2020). Accounting for individual-specific variation in habitat-selection studies: efficient estimation of mixed-effects models using Bayesian or frequentist computation. J. Anim. Ecol. 89, 80–92. doi: 10.1111/1365-2656.13087
Multi-Resolution Land Characteristics consortium (2011). The National Land Cover Database. Available online at: https://www.mrlc.gov/ (Accessed January 28, 2025).
Naiman R. J. and Rogers K. H. (1997). Large animals and system-level characteristics in river corridors. BioScience 47, 521–529. doi: 10.2307/1313120
National Weather Service (2024). NOW Data. Available online at: https://www.weather.gov/wrh/Climate (Accessed October 7, 2024).
Nelson R. A., Folk G. E., Pfeiffer E. W., Craighead J. J., Jonkel C. J., and Steiger D. L. (1983). Behavior, biochemistry, and hibernation in black, grizzly, and polar bears. Bears Their Biol. Manage. 5, 284. doi: 10.2307/3872551
Nevin O. T. and Gilbert B. K. (2005). Measuring the cost of risk avoidance in brown bears: Further evidence of positive impacts of ecotourism. Biol. Conserv. 123, 453–460. doi: 10.1016/j.biocon.2005.01.007
Ordeñana M. A., Crooks K. R., Boydston E. E., Fisher R. N., Lyren L. M., Siudyla S., et al. (2010). Effects of urbanization on carnivore species distribution and richness. J. Mammal. 91, 1322–1331. doi: 10.1644/09-mamm-a-312.1
Ordinance O-2018-6 (2018). Available online at: https://library.municode.com/co/durango/ordinances/code_of_ordinances?nodeId=897032 (Accessed January 28, 2025).
Pelton M. R., Scott C. D., and Burghardt G. M. (1976). Attitudes and opinions of persons experiencing property damage and/or injury by black bears in the Great Smoky Mountains National Park. Bears Their Biol. Manage. 3, 157. doi: 10.2307/3872763
Poessel S. A., Breck S. W., Fox K. A., and Gese E. M. (2015). Anticoagulant rodenticide exposure and toxicosis in coyotes (Canis latrans) in the Denver Metropolitan Area. J. Wildl. Dis. 51, 265–268. doi: 10.7589/2014-04-116
Polisar J., Hoogesteijn R., Hoogesteijn A., Viana D. F. P., Chinchilla Valdiviezo S. J., Valderrama Vásquez C., et al. (2025). Sixty degrees of solutions: field techniques for human–jaguar coexistence. Animals 15, 1247. doi: 10.3390/ani15091247
Price L. E., Skelly B. P., Morrison E. E., Carpenter C. P., Ryan C. W., and Rota C. T. (2024). Female black bear home range and resource selection in relation to West Virginia mine lands. Wildl. Soc Bull. 48, e1522. doi: 10.1002/wsb.1522
Prokopenko C. M., Boyce M. S., and Avgar T. (2017). Characterizing wildlife behavioural responses to roads using integrated step selection analysis. J. Appl. Ecol. 54, 470–479. doi: 10.1111/1365-2664.12768
R Core Team (2024). R: a language and environment for statistical computing. Available online at: https://www.R-project.org/ (Accessed June 30, 2025).
Schell C. J., Dyson K., Fuentes T. L., Des Roches S., Harris N. C., Miller D. S., et al. (2020). The ecological and evolutionary consequences of systemic racism in urban environments. Science 369, eaay4497. doi: 10.1126/science.aay4497
Shettleworth S. J. (2010). Cognition, evolution, and behavior. 2nd Edn (New York: Oxford University Press).
Shochat E., Warren P., Faeth S., Mcintyre N., and Hope D. (2006). From patterns to emerging processes in mechanistic urban ecology. Trends Ecol. Evol. 21, 186–191. doi: 10.1016/j.tree.2005.11.019
Signer J., Fieberg J., and Avgar T. (2019). Animal movement tools (amt): R package for managing tracking data and conducting habitat selection analyses. Ecol. Evol. 9, 880–890. doi: 10.1002/ece3.4823
Sol D., Lapiedra O., and Ducatez S. (2020). “Cognition and adaptation to urban environments,” in Urban Evolutionary Biology. Eds. Szulkin M., Munshi-South J., and Charmantier A. (Oxford, England: Oxford University PressOxford), 253–267. doi: 10.1093/oso/9780198836841.003.0015
Soulsbury C. D. and White P. C. L. (2015). Human–wildlife interactions in urban areas: a review of conflicts, benefits and opportunities. Wildl. Res. 42, 541. doi: 10.1071/WR14229
Spencer R. D., Beausoleil R. A., and Martorello D. A. (2007). How agencies respond to human–black bear conflicts: a survey of wildlife agencies in North America. Ursus 18, 217–229. doi: 10.2192/1537-6176(2007)18[217:HARTHB]2.0.CO;2
Thurfjell H., Ciuti S., and Boyce M. S. (2014). Applications of step-selection functions in ecology and conservation. Mov. Ecol. 2, 4. doi: 10.1186/2051-3933-2-4
Ummenhofer C. C. and Meehl G. A. (2017). Extreme weather and climate events with ecological relevance: a review. Philos. Trans. R. Soc B Biol. Sci. 372, 20160135. doi: 10.1098/rstb.2016.0135
U.S. Census Bureau (2013). tl_2013_08067_linearwater. Available online at: https://www.census.gov/cgi-bin/geo/shapefiles/index.php?year=2013&layergroup=Water (Accessed March 26, 2025).
U.S. Census Bureau (2020). “RACE,” in Decennial census, DEC redistricting data (PL 94-171), table P1. Suitland, Maryland: U.S. Census Bureau. Available online at: https://data.census.gov/table/DECENNIALPL2020.P1?g=160XX00US0822035&y=2020.
U.S. Geological Survey (2024). The National Elevation Dataset. Available online at: https://www.usgs.gov/programs/national-geospatial-program (Accessed January 28, 2025).
Venumière-Lefebvre C. C., Breck S. W., and Crooks K. R. (2022). A systematic map of human-carnivore coexistence. Biol. Conserv. 268, 109515. doi: 10.1016/j.biocon.2022.109515
Verzuh T. L., Heuer K., and Merkle J. A. (2024). Leveraging how animals learn in conservation science: behavioral responses of reintroduced bison to management interventions. Conserv. Sci. Pract. 6, e13240. doi: 10.1111/csp2.13240
Zack C. S., Milne B. T., and Dunn W. C. (2003). Southern oscillation index as an indicator of encounters between humans and black bears in New Mexico. Wildl. Soc Bull. 31, 517–520. Available online at: https://www.jstor.org/stable/3784333.
Zajac R. M., Bruskotter J. T., Wilson R. S., and Prange S. (2012). Learning to live with black bears: a psychological model of acceptance. J. Wildl. Manage. 76, 1331–1340. doi: 10.1002/jwmg.398
Keywords: animal behavior, human-wildlife conflict and coexistence, learning, resource selection and movement, spatial ecology, urban ecology, Ursus americanus
Citation: Venumière-Lefebvre CC, Johnson HE, Breck SW, Alldredge MW and Crooks KR (2025) Bears avoid residential neighborhoods in response to the experimental reduction of anthropogenic attractants. Front. Ecol. Evol. 13:1657106. doi: 10.3389/fevo.2025.1657106
Received: 30 June 2025; Accepted: 26 August 2025;
Published: 22 September 2025.
Edited by:
Ryan Jensen, Brigham Young University, United StatesReviewed by:
Rachael Urbanek, University of North Carolina Wilmington, United StatesChris DePerno, North Carolina State University, United States
Copyright At least a portion of this work is authored by Heather E. Johnson and Stewart W. Breck on behalf of the U.S. Government and as regards Dr. Johnson, Dr. Breck and the U.S. Government, is not subject to copyright protection in the United States. Foreign and other copyrights may apply. This is an open-access article distributed under the terms of the Creative Commons Attribution License (CC BY). The use, distribution or reproduction in other forums is permitted, provided the original author(s) and the copyright owner(s) are credited and that the original publication in this journal is cited, in accordance with accepted academic practice. No use, distribution or reproduction is permitted which does not comply with these terms.
*Correspondence: Cassandre C. Venumière-Lefebvre, Y3ZlbnVtaWVyZS5sZWZlYnZyZUBnbWFpbC5jb20=
†ORCID: Cassandre C. Venumière-Lefebvre, orcid.org/0000-0002-8586-3176
Heather E. Johnson, orcid.org/0000-0001-5392-7676
Stewart W. Breck, orcid.org/0000-0003-3138-1929
Mathew W. Alldredge, orcid.org/0000-0002-7133-9621
Kevin R. Crooks, orcid.org/0000-0002-3742-4734