 Kenneth W. Zillig1,2*
 Jacqueline A. Fukumoto1
 Alexandra G. McInturf1,3
 Scott G. Burman1,4Anna E. Steel1Dennis E. Cocherell1
 Nann A. Fangue1*
- 1Wildlife, Fish and Conservation Biology, University of California, Davis, Davis, CA, United States
- 2Fish, Wildlife, and Conservation Biology, University of Minnesota, St. Paul, MN, United States
- 3Coastal Oregon Marine Experiment Station, Oregon State University, Newport, OR, United States
- 4Community Commission for Public Safety and Accountability, City of Chicago, Chicago, IL, United States
Sprint swimming performance in fishes is relatively understudied despite its critical role in predation attempts, prey evasion, spawning events, and overcoming hydraulic challenges. Sprint swimming is characterized by fast acceleration, over a short distance and of limited duration. The bulk of sprint performance research uses analysis of high-speed recordings of fish behavior. While behavioral video analysis has improved, it is still expensive in both processing time and computational resources, limiting the ability to develop reaction norms for sprint performance which necessitate large sample sizes. Here we present a laser-gated sprint performance chamber (SPC) that improves upon past designs by introducing an adjustable number of lasers (≤ 25) that facilitates greater resolution on sprint performance. Use of customized arrangements can facilitate measurement of novel performance metrics of interest to a range of key questions (e.g., fatigue rate, residual anaerobic capacity, and sprint stamina). Using this chamber we quantified the sprint velocity, residual anaerobic capacity, sprint stamina, and fatigue rate of rainbow trout (Oncorhynchus mykiss), a widely distributed and studied species. We directly compared the results measured by our device to high-speed camera data collected simultaneously and found the velocity estimates from the sprint chamber to be highly accurate (R2 = 0.97). We also compared the sprint performance of individual rainbow trout with their individual UCRIT, a commonly measured metric of aerobic swimming performance. We found little correlation between the two traits, indicating that fish capable of rapid sprint swimming are not necessarily fast sustained swimmers. Finally, we defined and quantified three novel traits of sprint swimming performance: relative anaerobic scope, sprint stamina (the number of sprint events that can be elicited prior to performance decline), and fatigue rate (the rate of decline associated with repeated sprinting). The SPC is an adjustable platform for quantifying understudied elements of fish swimming physiology, improving design of fish passage infrastructure, and facilitating discoveries in how sprint performance changes with environmental conditions.
Introduction
Fish swimming is a widely studied physiological and behavioral metric of organismal performance. As the primary method for locomotion, swimming performance is integral to the ecological fitness of fish species. Therefore, understanding the impacts of environmental stressors such as temperature, dissolved oxygen, or toxicants on swimming performance is crucial to interpreting species responses to environmental change.
The majority of swimming performance research in fishes is focused on measures of aerobic swimming performance, with methods designed to measure swimming endurance (Hammer, 1995; Ojanguren and Branta, 2000; Kieffer and May, 2020), maximum sustained swimming velocity (UCRIT; Brett, 1964; MacNutt et al., 2004; Tierney, 2011), and aerobic scope (Eliason et al., 2013; Zillig et al., 2023b, a). Aerobic swimming capacity is particularly relevant to questions of fish migration, and measurements of metabolic capacity via aerobic swim trials can provide insight into more opaque aspects of fish physiology [starvation response (Luo et al., 2013; Hvas, 2022), reproduction (Callaghan et al., 2021), specific dynamic action (Lo et al., 2022)]. Unlike aerobic metabolism, which offers oxygen consumption as a real-time proxy of activity, quantification of anaerobic metabolic activity requires measurement of metabolic byproducts (McDonald et al., 1998; McFarlane and McDonald, 2002). Anaerobic metabolism is fueled by the oxygen-independent process of glycolysis which generates ATP and lactate using a readily available store of glucose made available by glycogenolysis of glycogen. Additional ATP is made available by the processing of phosphocreatine, a rapidly consumed resource. During anaerobic swimming these fuels are then metabolized by both red and white muscle (Jayne and Lauder, 1993), unlike aerobic swimming with primarily engages the vascularized red muscle. Past work on anaerobic swimming performance has focused on quantifying the biochemical fuels (McDonald et al., 1998; McFarlane and McDonald, 2002; Pon et al., 2012), biomechanics (Frith and Blake, 1995; Hale et al., 2002), and neurology (Budick and O’Malley, 2000; Eaton et al., 2001; Tsvilling et al., 2012) of anaerobic swimming activity (i.e., fast-starts). The lack of an easily quantifiable proxy for anaerobic swimming performance likely limits the breadth of study of anaerobic physiology, and therefore expanding the methodology used to study this behavior may allow investigation of novel eco-physiological questions.
Fast starts, or burst swimming, may offer a solution to this challenge. These are a discrete anaerobic swimming action that are typified by fast acceleration, short distance and limited duration. In most species they can be disassembled into three distinct stages (Weihs, 1973). An initial preparatory stage is often defined by the body shape assumed by the fish (C- or S-shape). The subsequent second stage is initiated by the untensioning of the fish’s body, inducing the propulsion of the fast start. A third stage is then initiated and maintained as the fish rhythmically swims or glides.
Research on fast starts has focused on the first two stages (Domenici and Blake, 1997), resolving metrics such as turning kinematics (Domenici and Blake, 1993), response time, and acceleration (Domenici and Blake, 1991). The third phase of fast starts (hereafter referred to as a “sprint”) has been studied relatively less (e.g., Nelson et al., 2002; Nelson and Claireaux, 2005; Bellinger et al., 2018) despite its potential relevance to aspects of fish ecology and as an indicator of anaerobic performance. For instance, McInturf et al. (2022) found that the success of predatory interactions was associated with the relative performance of predator and prey sprint performance and that this relationship was temperature dependent. Specifically, warmer temperature reduced the number of burst events juvenile Chinook salmon (O. tshawytscha) could perform, while increasing those performed by largemouth bass (Micropterus salmoides). The thermal advantage in burst capacity exhibited by largemouth bass matched greater rates of observed predation under warm water conditions. Similarly, Handelsman et al. (2010) found that wild European sea bass (Dicentrarchus labrax) with faster sprinting performance were more likely to survive avian predatory events than those with slower sprinting performance. Sprint swimming may also be critical for reproductive fitness. For example, Nassau grouper (Epinephelus striatus) form large spawning aggregations where the reproductive success of males is partially dependent upon a spawning rush (Colin, 1992). Male fish capable of faster or more numerous sprints can fertilize more eggs by outcompeting rival males for proximity to spawning females. Likewise, transiting challenging hydraulic conditions (e.g., rapids, waterfalls, fish ladders, water diversions) during migration may rely as much on anaerobic capacity as aerobic performance (Hinch and Bratty, 2000; Gowans et al., 2003; Peake and Farrell, 2004; Castro-Santos, 2005; Brown et al., 2006; Pon et al., 2012; Mussen et al., 2013). Therefore, advances are needed to make measures of anaerobic metabolic capacity accessible to the field of fish ecology and conservation.
Aerobic metabolism is often likened to a monetary budget, whereby a fish’s rate of energy usage on different biological activities (e.g., growth, movement, reproduction etc.) is biologically constrained, leaving the fish with a budgetary challenge of how to allocate metabolic scope (Zillig, 2024). In most laboratory studies, it is assumed a fish will not run out of fuel for aerobic activity as both oxygen and biological fuels (e.g., fats, carbohydrates and proteins) are in ample supply [these resources may be constrained in field conditions which may be hypoxic or food limited (Luo et al., 2013; Duncan et al., 2020)]. In other words, a fish can only spend a fixed amount of energy per unit time, but it can keep spending energy as time progresses. Anaerobic metabolic activity is similar, with a maximum rate of anaerobic exertion which is dependent on the fish’s concentration of creatine, phosphokinase, and glycolytic enzymes, but there is also a limited amount of fuel available (e.g., cytoplasmic creatine, glucose and glycogen) and replenishing these energy resources requires time [i.e., excess post-exercise oxygen consumption, (Suski et al., 2006; Wang and Richards, 2011)]. Therefore, without recovery a fish can spend a fixed amount of energy anaerobically for only as long as there remain available anaerobic fuels. If we assume that the anaerobic capacity for activity and the amount of available anaerobic fuel are positively related (Driedzic and Hart, 1984; Clow et al., 2017; Driedzic, 2018), then with each additional unit of fuel utilized, a fish’s remaining anaerobic metabolic capacity will be diminished. It follows that by associating changes in anaerobic performance with the duration of anaerobic activity a residual anaerobic capacity (RAC) for activity can be estimated, comparable in interpretation to the widely measured aerobic scope. RAC could be derived by regressing performance against duration of anaerobic exertion and solving for a theoretical state where anaerobic activity is zero, similar to how standard metabolic rate is often estimated (Brett, 1964; but see Chabot et al., 2016 for limitations).
Quantifying anaerobic swimming performance and fast-start physiology in an ecological context is challenging due to a lack of high-throughput methodologies and non-destructive sampling methods that would enable measurement of anaerobic reaction norms across ecologically relevant conditions (e.g., temperature, salinity, ontogeny). Determination of anaerobic metabolic activity requires post-event measurement of metabolic byproducts either through destructive tissue analysis (McDonald et al., 1998; McFarlane and McDonald, 2002) or through measurement of excess post-exercise oxygen consumption (Zhang et al., 2018). Fish may also be chased in a confined space until some exhaustive endpoint is reached (e.g., unresponsiveness), however a limitation with all these approaches is assessing incremental anaerobic exertion through time. Consequently, the bulk of fast-start performance research uses analysis of high-speed recordings of fish behavior (Eaton and Emberley, 1991; Domenici and Blake, 1993; Marras et al., 2011; Trujillo et al., 2022). While behavioral video analysis has improved, it is also currently expensive in both processing time and computational resources which limits the collection of large sprint performance datasets.
In this study we present a modernized design for a laser-timed sprint performance chamber (SPC) which builds upon initial design by Nelson et al. (2002) to offer a non-destructive, high-throughput approach for measuring sprint swimming and associating it with the duration of anaerobic activity. We use rainbow trout (Oncorhynchus mykiss), a widely distributed and studied salmonid, as a case study to validate the accuracy of our updated SPC design. Rainbow trout have been extensively studied in regards to their aerobic swimming performance (Dickson and Kramer, 1971; Alsop and Wood, 1997; Jain et al., 1997; Farrell, 2008; McKenzie et al., 2012) with evidence for local adaptation in thermal physiology and aerobic metabolism (Chen et al., 2015; Verhille et al., 2016). There has also been some work studying their sprint physiology (Bellinger et al., 2014, 2018; McInturf et al., 2022) and fast-start response (Webb, 1976; Gamperl et al., 1991). Furthermore, we build upon past research studying the relationship between individual sprint swimming performance and aerobic sustained swimming performance (Nelson et al., 2002; Nelson and Claireaux, 2005; Vandamm et al., 2012) to assess whether quantifying sprint performance provides additional information on fish swimming performance beyond widely used traditional methods (i.e., UCRIT). We hypothesized that, because sprint swimming is a primarily anaerobic process and sustained swimming is a primarily aerobic process, these metrics would not be tightly linked and there could be a trade-off between the swimming methods (Reidy et al., 2000; Marras et al., 2013).
Materials and equipment
Sprint performance chamber description
The SPC was made of 9.5mm thick cast acrylic sheets and measures 200.7 cm long, 15.2 cm wide and 25.2 cm tall. The chamber has an internal width of 12.9 cm, a water fill depth of 17.8cm and total volume of ca. 46L (Figure 1), which was maintained at a consistent depth by an external overflow standpipe. Aerated water was supplied to the chamber from a 200L sump via a submersible pump (Danner Model 7, US). The sump was temperature controlled via a heat pump (Aqua Logic, DSHP-6, US) which was fed by a water pump (Aquatic Eco, SHE 1.7, US). This allows for precise control (± 0.1 °C) of the chamber temperature (Supplementary Figure 1).
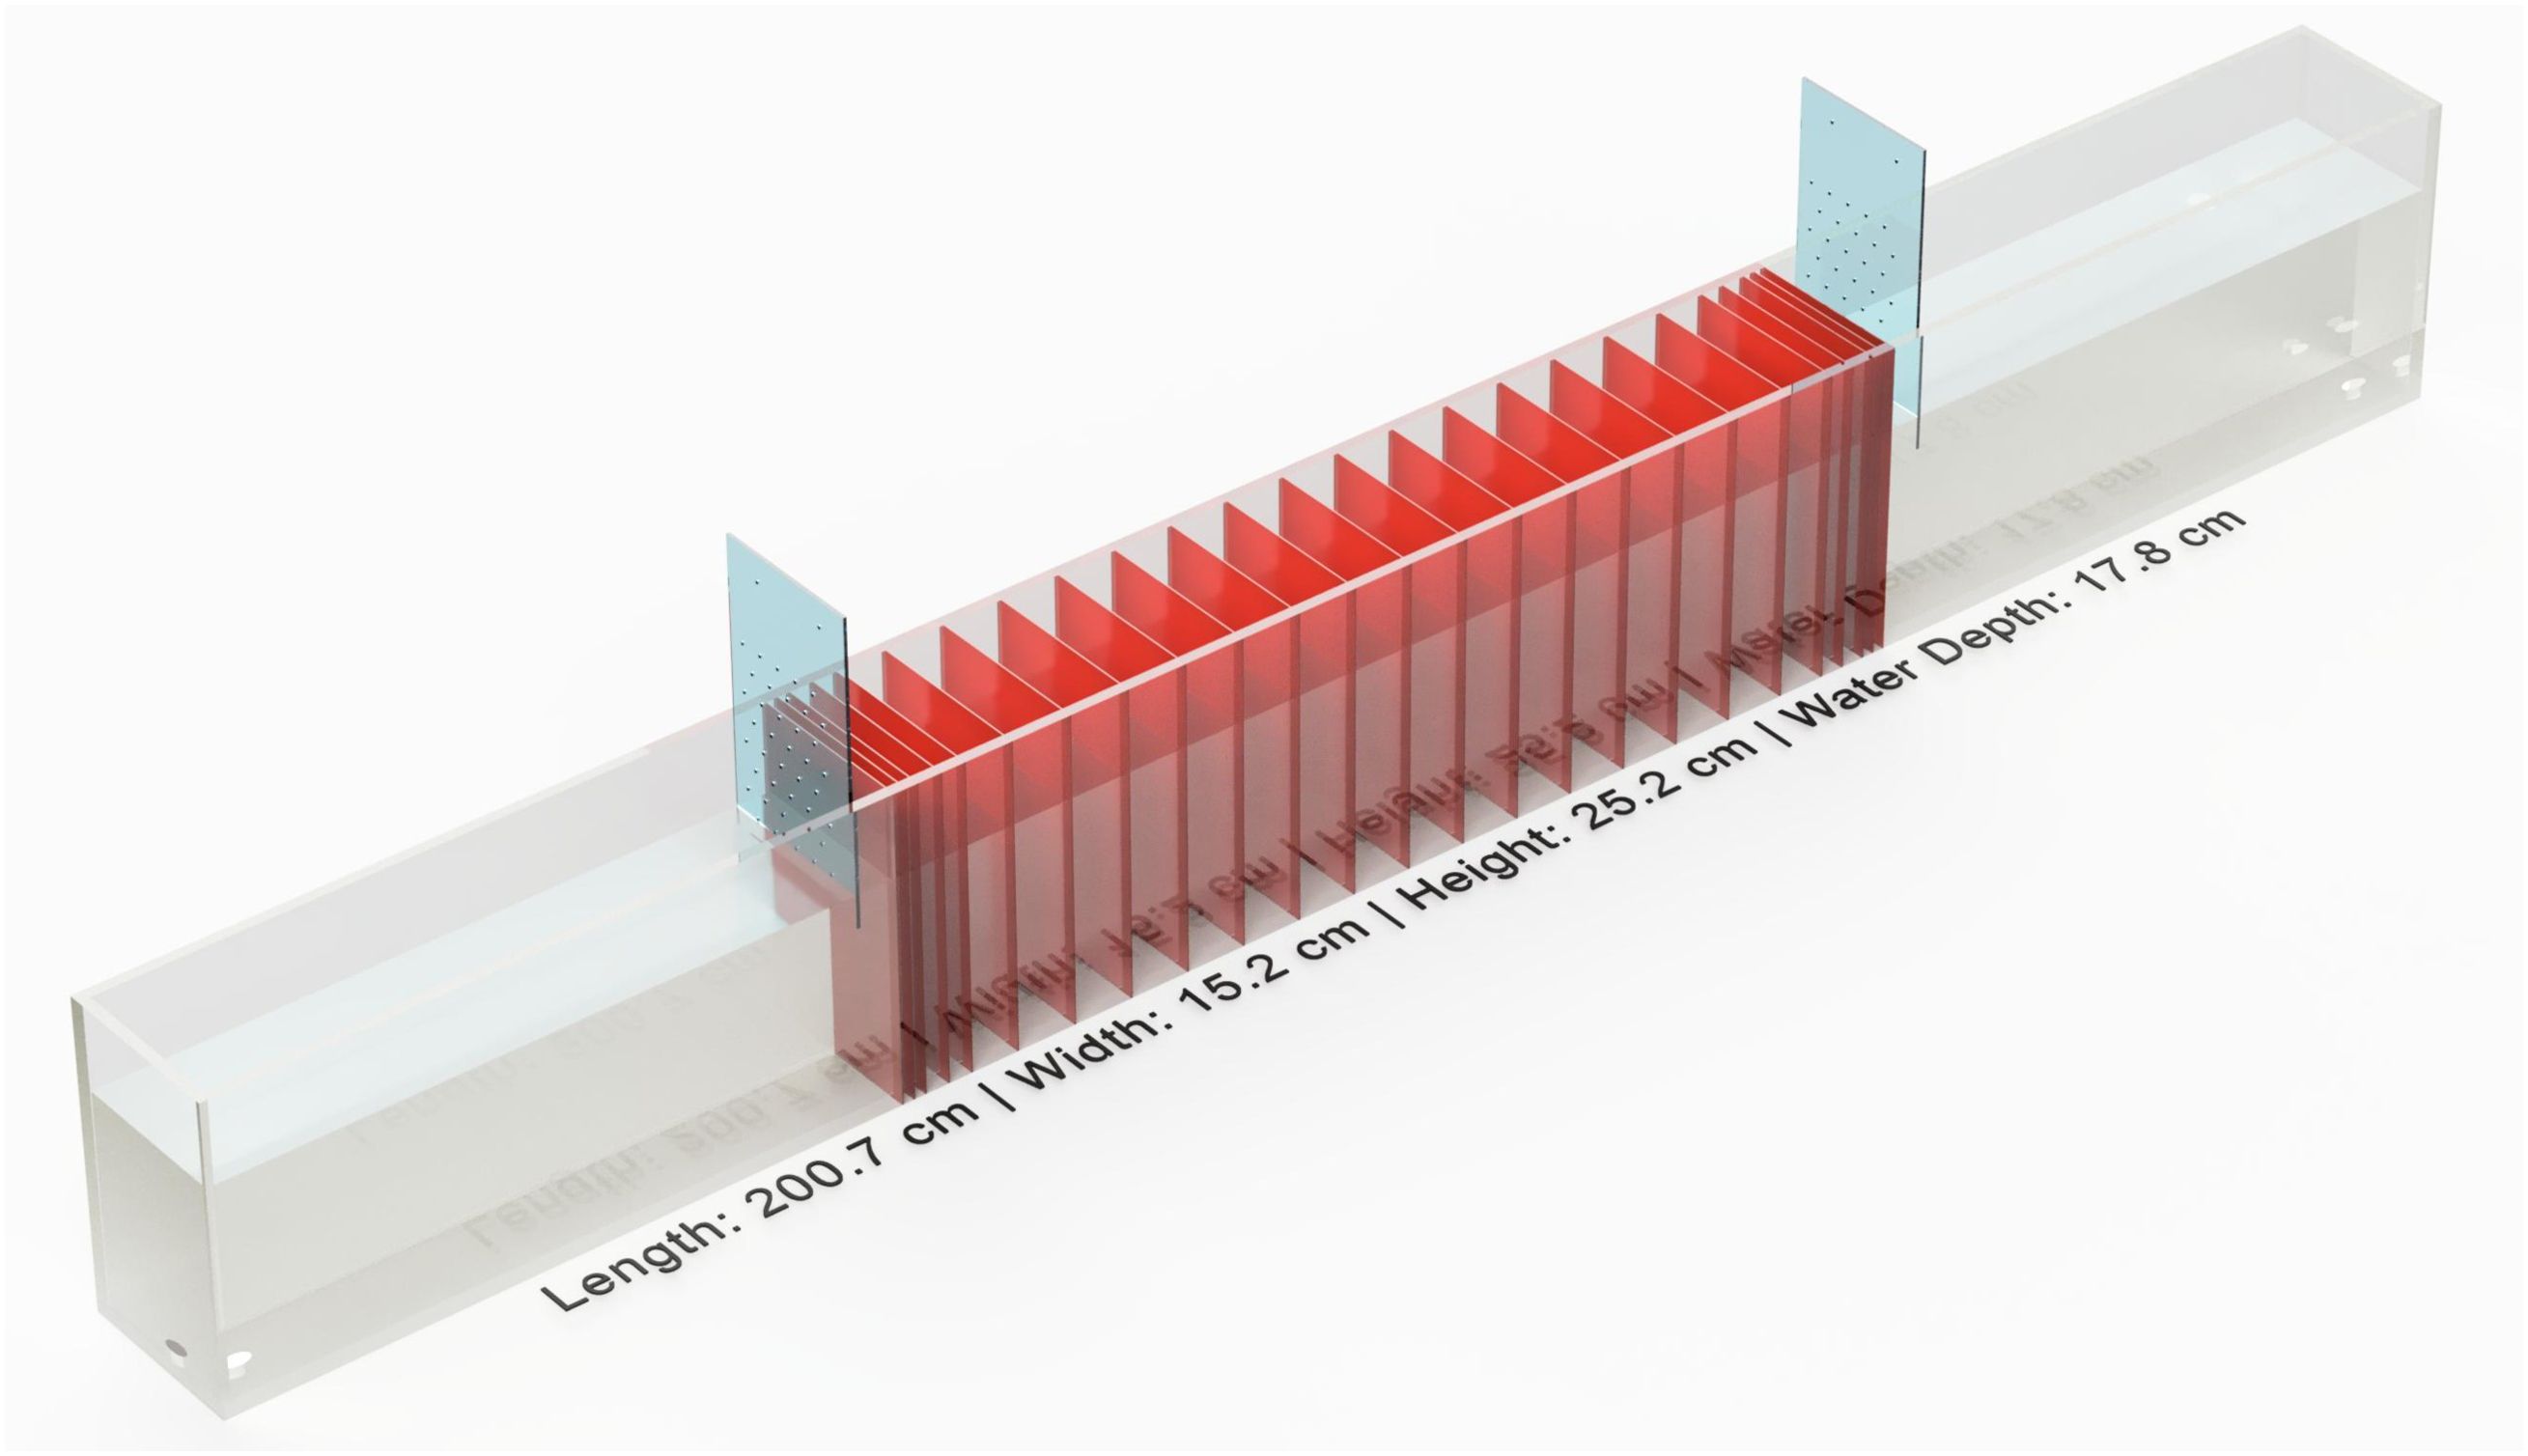
Figure 1. Sprint performance chamber. Full specifications can be found in Supplementary Image 3. Red panes indicate the location of laser beams. Each end constitutes the release chambers where fish wait pre- and post-sprint event. The blue panels slide up and down to open and close release chambers and are designed with small holes to maintain water circulation.
The first 50 cm of the SPC on either end served as alternating release chambers, where a fish would await a sprint stimulus. A fish was enclosed within one of the two ‘chambers’ by an acrylic panel that was lifted immediately prior to the sprint stimulus. Between the two release chambers was an array of 25 ‘laser-gates’ composed of a line laser (650 nm, Adafruit, 1057, US) and a corresponding detector array (Figure 1). Each detector array (Supplementary Figure 2) incorporated 13 individual detectors (Optek Technology, Inc., OPL562-OC, GB), wired in parallel and soldered to a custom-printed and drilled stripboard (Supplementary Appendix A). Sensors were powered using the 5v supply from a standard desktop computer power supply. The power supplied to each array was stabilized by a 150µF capacitor (Panasonic, EEU-FR1A151B, JP). A 1K Ohm pull-up resistor (Vishay Intertechnology, FR2500001001FR500, US) was added to each board to prevent a floating voltage signal. The detectors send a binary voltage signal in response to the presence (value = 1) or absence (value = 0) of the laser hitting the detector. We connected the sensing pin to a GPIO (general-purpose in/out) pin of a Raspberry Pi (Model: A+ V1.1). When a laser beam was obstructed the signal change from the array triggered the raspberry Pi to record the time (µs).
Laser-gates were spaced so that a fish encountered a greater density of gates nearest to the release chambers. Distances between gates were symmetrical from the midpoint of the chamber, allowing bidirectional sprints with the same arrangement of inter-laser distances (Supplementary Figure 3). Experiments were recorded by two overhead cameras (GoPro CHDHX-801, US) which filmed at 240 frames per second. These cameras observed the first 9–10 gates on either side of the chamber and were used to assess the accuracy of the laser system.
Raspberry Pi set-up
Sprint trials were initiated by booting the Raspberry Pi and running a Python script which enabled data collection and output of an initial timing dataset. The Raspberry Pi ran a Raspbian OS (version ‘stretch’) which was modified to disable the majority of interfaces and therefore reduce latency of the GPIO pins. Additionally, all the specialized GPIO pins were disabled (e.g., Secure SHell) so that they were usable as standard GPIOs.
Initial analysis of the sprint event occurred on the Raspberry Pi via the Python (v 3.5.3) script using the packages ‘re’, ‘time’ and ‘RPi.GPIO’ (Van Rossum, 2020; Croston, 2022). The script ran the necessary checks, managed the trial, and produced a data frame containing relative timings when each laser was obscured (Figure 2). During a trial each laser can only be obscured once, and when obscured the Raspberry Pi records the time of that event. After the sprint event the Python script calculates the difference in time between when the first laser-gate was triggered and when each subsequent gate was triggered, producing a vector of times for that sprint event. At the culmination of a sprint trial, which may involve many sprint events, the Python script returns a.csv file with one row for each sprint event. Each row contains the sprint event number, which side of the chamber the fish started from, the number of seconds since the start of the trial, and then the time each gate was broken relative to the first gate.
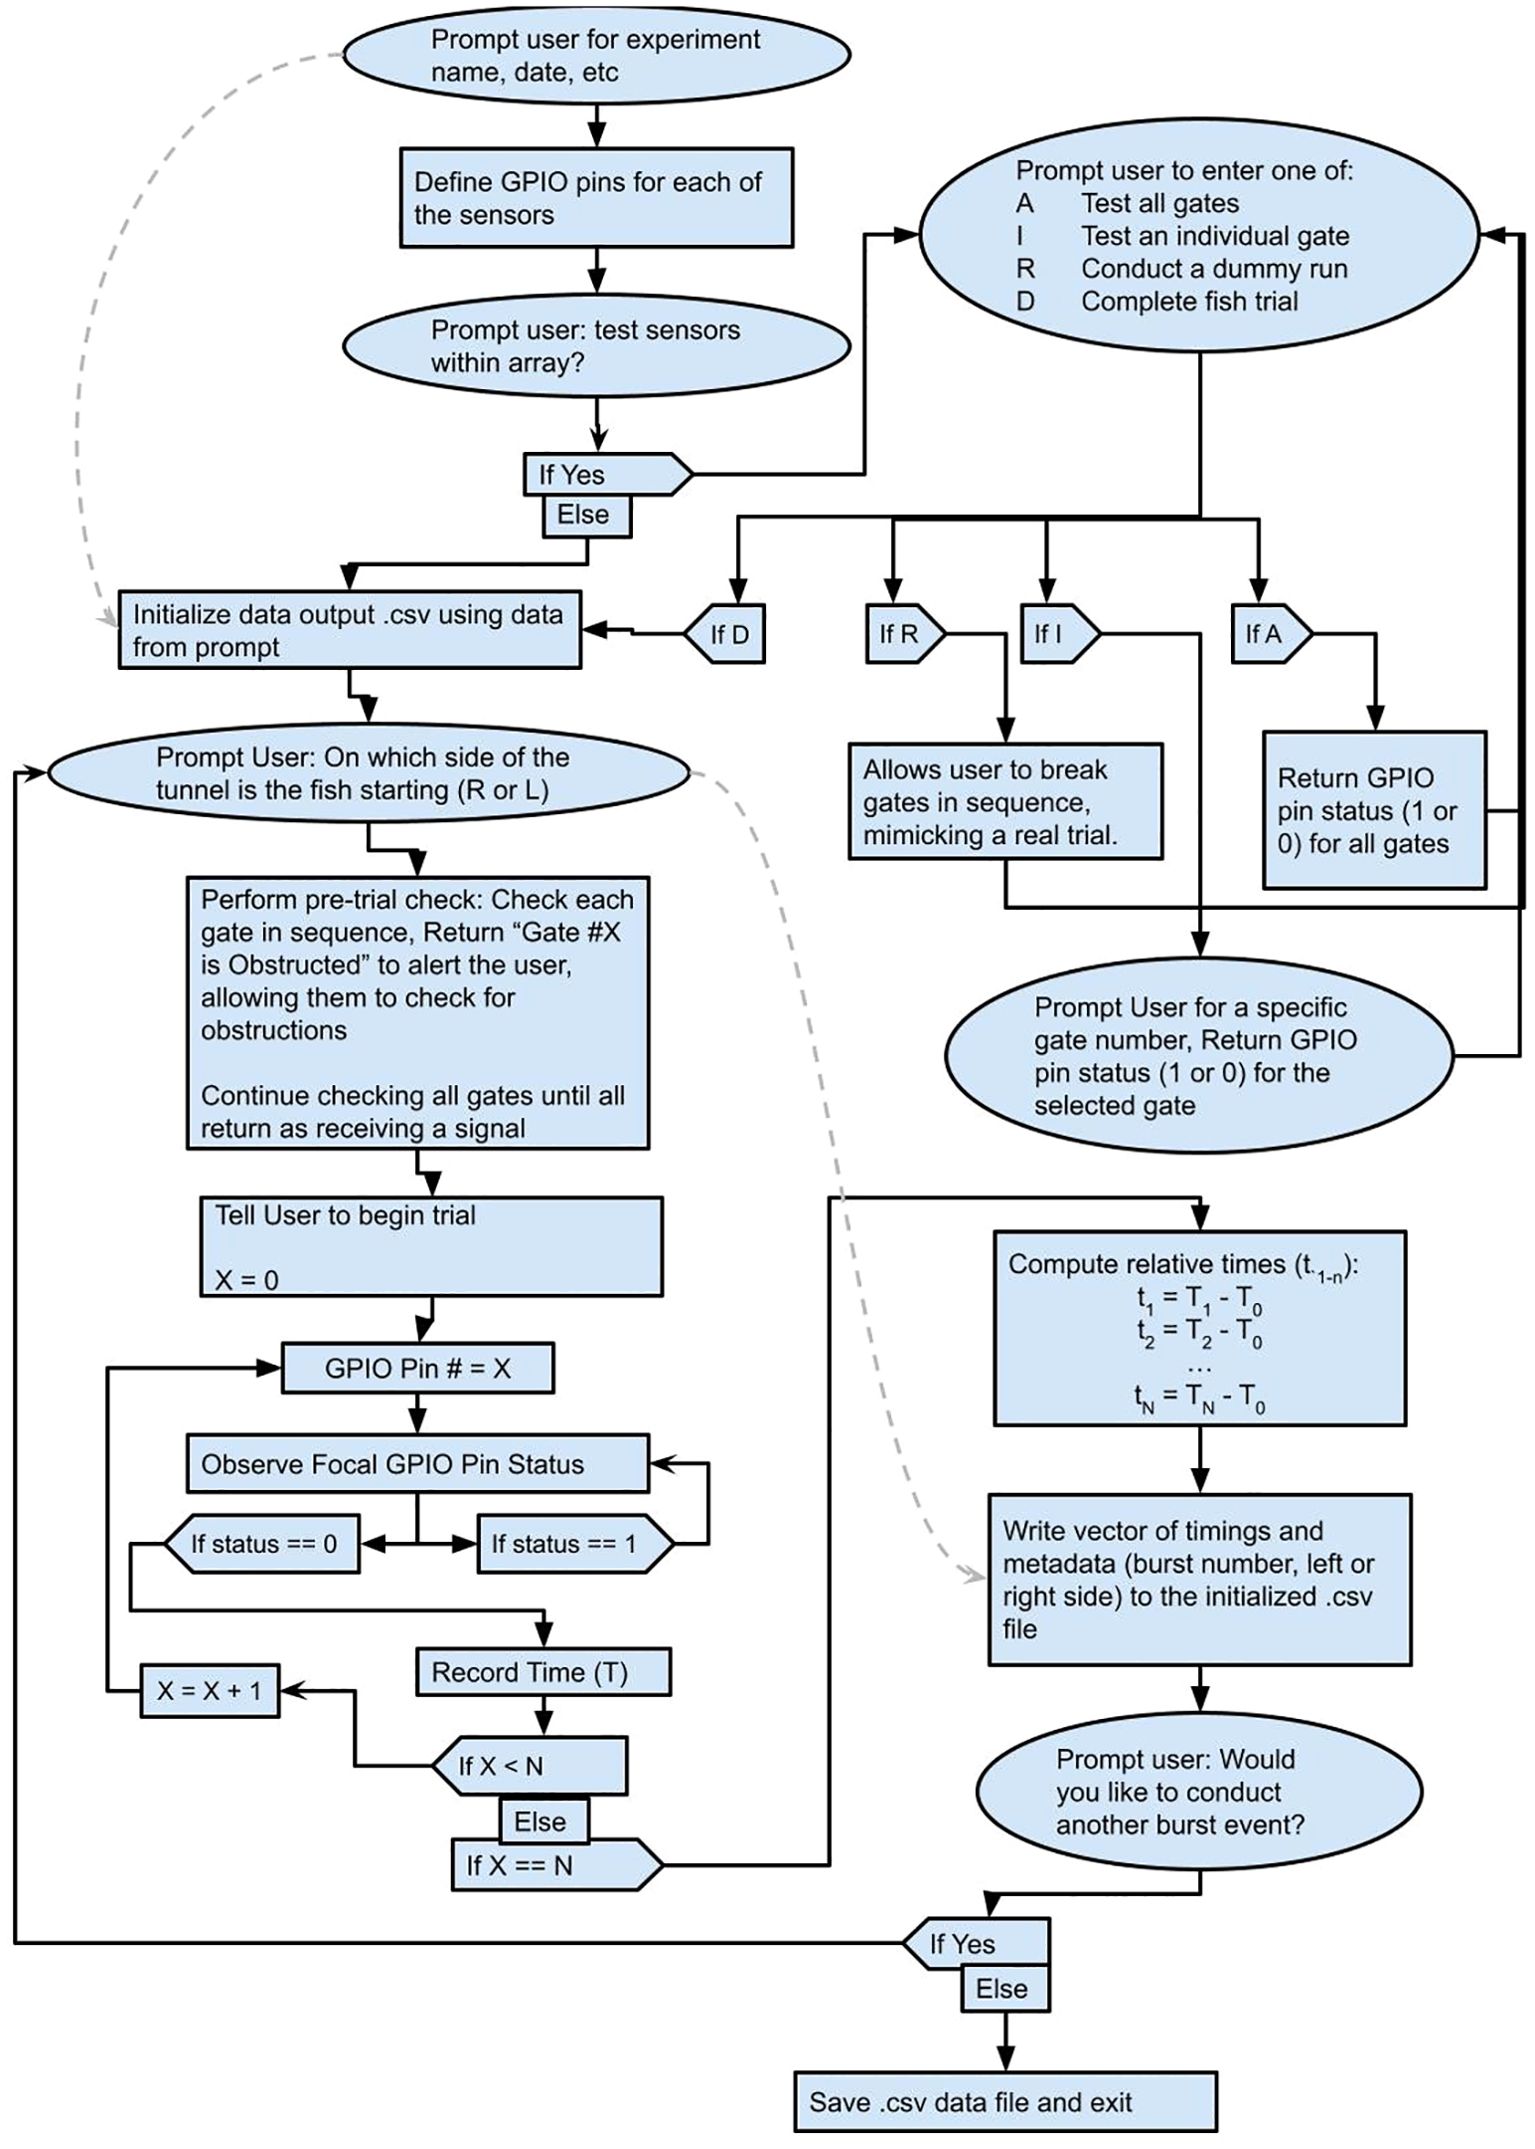
Figure 2. Flow of Control (FoC) Diagram showing the processing occurring onboard the Raspberry Pi using the Python Script. Solid lines indicate the flow of the code, while dashed grey lines indicate where user entered values are incorporated. ‘X” indicates a specific gate number, ‘N’ indicates the total number of gates (typically 25), ‘T’ indicates local time onboard the raspberry pi and ‘t’ indicates time relative to the breaking of the first gate (T0). This FoC captures one sprint trial, which may include several sprint events.
Using the.csv file output by the Raspberry Pi we calculated the velocity of the fish as it transited between pairs of gates. Using 25 lasers there are 300 different pairs of laser-gates, hereafter referred to as segments. We limited the analysis to segments which were between 5 cm and 20cm (inclusive) in length, for a maximum of 84 analyzed segments. Past research has used at most 8 laser-gates, and subsequently a maximum set of 28 segments, many of which may be quite long (Nelson et al., 2002, 2008). The increased resolution provided by additional lasers theoretically improves the capability of this SPC to quantify sprint performance metrics.
Fish velocity was calculated based on the length of a segment (cm) and the time (seconds) it took the fish to transit that segment. Computer malfunction, misaligned lasers and human error could lead to gates triggering erroneously. For each sprint event, we identified erroneously fired gates by selecting segments with velocities greater than 2000 cm/s (~80 BL s-1), determined the laser-gate which triggered erroneously and then discarded all segments calculated using that laser-gate. A histogram of segment velocity was used to identify this cutoff as one that removed extreme values without infringing upon possible fish performance (Supplementary Figure 4).
Calculating sprint performance metrics
Due to the high number of laser-gates and corresponding segments there are a range of potential methods for estimating sprint capacity. We evaluated several potential methods for summarizing the data and calculating different sprint metrics (Table 1). For each sprint event we applied several mathematic transformations to the set of segment velocities to calculate different sprint metrics (Table 1). Sprint metrics differ in the specific segments and the number of segments included. For instance, PEAK_SPEED includes only the fastest reported segment, while AVE_SPEED_TOP_10P calculates the mean velocity of the fastest 10% of segments. We propose that a measure of burst swim velocity needs to be accurate, repeatable, and capture a high velocity performance. A swim velocity which lacks in any of these three categories would not serve as a useful indicator of anaerobic performance. Therefore, we evaluated each sprint metric for accuracy against the camera-measured velocities, repeatability among individuals, and finally its tendency to return high velocities.
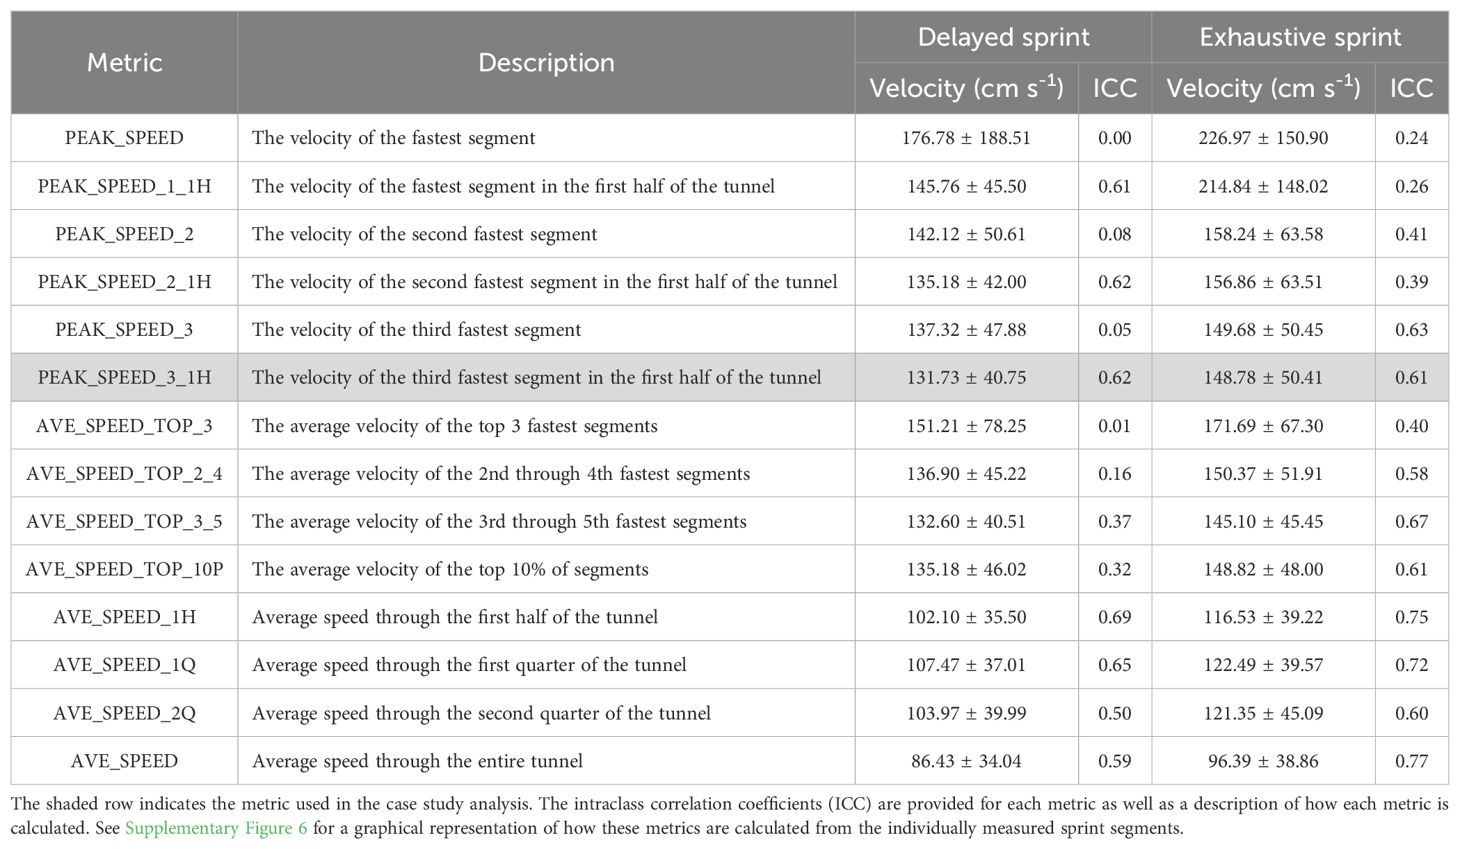
Table 1. Summary metrics of sprint performance with mean (± Standard Deviation) of the velocity measured via the Delayed or Exhaustive Sprint protocol.
In addition to sprint metrics of overall velocity (described above), the exhaustive sprint protocol (described in detail below) elicited sequential sprint events with minimal or no recovery in between. Assessing sprint performance without recovery allows us to assume that a fish’s sprint performance is an observation on its anaerobic metabolic capacity. We extend this relationship to estimate a fish’s anaerobic metabolic scope via a presumed relationship between sprint performance (velocity), and ordinal sprint event number (proxy for duration of anaerobic activity). This conceptual relationship is provided in Equation 1 where RACS is the velocity of a sprint event and S is the integer count of sprint events. We use this performance per event relationship to relate three novel sprint performance traits: fatigue rate, residual anaerobic capacity (RAC), and sprint stamina (Figure 3). Fatigue rate is defined as the change in sprint velocity with a unit increase in the number of sprint events and is equal to the coefficient a in Equation 1. Total anaerobic capacity (RAC0) is a special case of the RAC and is represented as the sprint velocity when a fish is at a theoretical state of no exertion (S = 0), or the y-intercept in Figure 3. Finally, sprint stamina is an estimate of how many sprint events are necessary before performance is reduced to a threshold amount (e.g., 20% of RAC0).
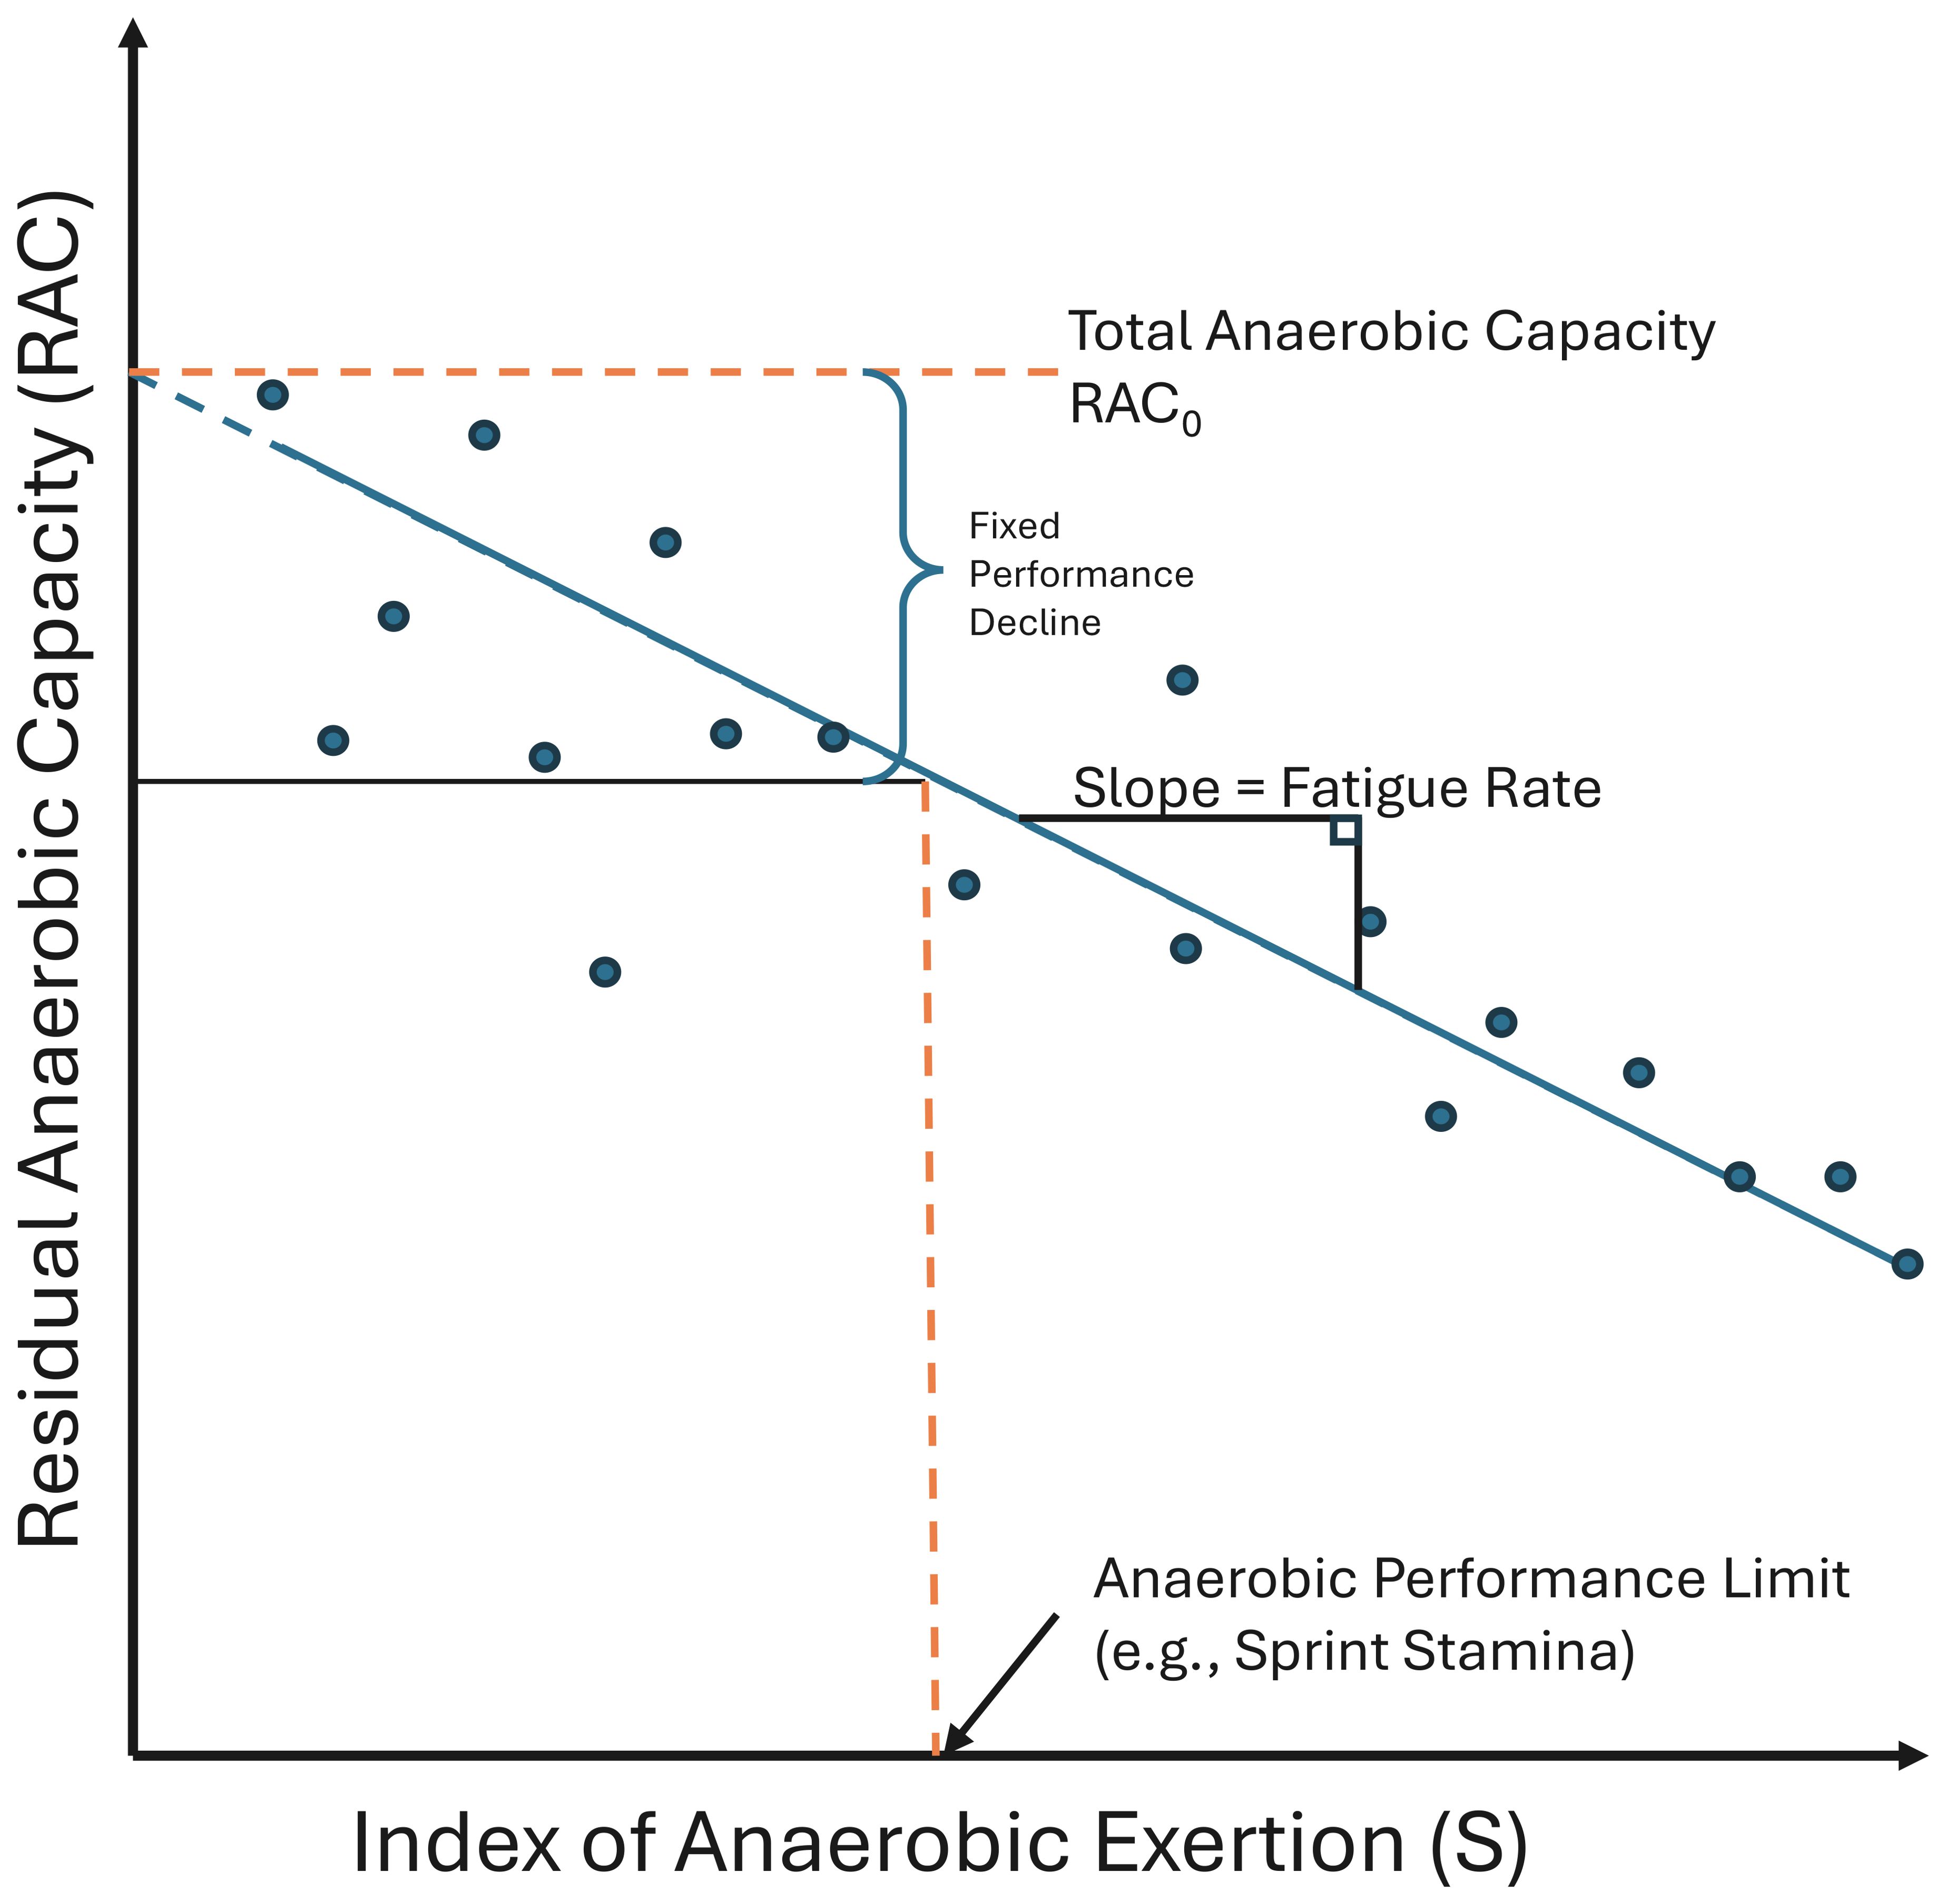
Figure 3. Conceptual diagram of Residual Anaerobic Capacity (RAC) representing three novel anaerobic performance traits. Each point represents the performance of an individual anaerobic event (e.g., fish sprint swim). A linear relationship between RAC and the index of anaerobic exertion (S) determines a fatigue rate. This relationship can likewise be used to determine the Total Anaerobic Capacity, a special case of RAC, when the index of anaerobic exertion is zero. A measure of stamina can be calculated as the index of anaerobic exertion which yields a set decrease in RAC.
Methods
Fish husbandry
Yearling rainbow trout were donated from the American River Hatchery (Gold River, CA) by the California Department of Fish and Wildlife in September of 2020 and transported to the Center for Aquatic Biology and Aquaculture at the University of California, Davis. Fish were maintained at 18 °C in a 870L tank with flow-through, aerated water from a dedicated well, and provided ad libitum rations of a commercial trout feed (Skretting Feed). In June 2021, 3 to 4 weeks prior to swim trials, rainbow trout (n=36) were tagged with passive integrated transponder (PIT) tags (Oregon RFID, 8mm FDX-B, USA) inserted into the dorsal musculature. Fish were anesthetized prior to PIT tag insertion in a buffered solution of tricaine methanesulfonate (MS-222: 150 mg L-1 buffered with 420 mg sodium bicarbonate). Afterward, fish were recovered in fresh, aerated water then transferred to an 870L tank and held at 18 °C. Rainbow trout were provided a pellet diet at a feed rate of 1% wet mass daily. At the time of the swim performance trials fish weighed 234.8 ± 63.9 g (µ ± S.D.) and had a standard length of 24.7± 1.6 cm (µ ± S.D.).
Experimental timeline
In the present study, swim performance trials occurred over 47–50 days, with individual fish participating in five rounds of trials. Six fish were unable to complete all five trial rounds. The first round was a UCRIT trial (n = 30), followed by four rounds of sprint trials (n = 28, 26, 26, 24 for each sequential round), alternating between the delayed or exhaustive sprint protocols (Figure 4). The sequence of trials was the same for all fish.
Figure 4. Timeline of swim performance trials, including swim trial type (UCRIT, Delayed or Exhaustive Protocol) and ranges of the time interval between trials across all rainbow trout tested.
Prior to each trial, fish were fasted for approximately 24 hours in an insulated tank (200 L) with aerated flow-through water at their acclimation temperature (18 °C). After each experimental trial (Figure 4) fish were returned to an identical recovery tank. Fish were given approximately 24 hours to recover before being handled to measure mass (± 0.1 g), as well as standard, fork, and total lengths (± 0.1 cm). Fish were then returned to the main holding tank for a minimum of three days until their next trial.
Conducting a sprint trial
Based on existing literature (Nelson et al., 2002; Bellinger et al., 2018), we adapted a general methodology for conducting a sprint trial and then developed two variations (hereafter, delayed and exhaustive sprint protocols, detailed descriptions below). During exhaustive sprint protocols we had one experimenter who managed the computer interface (manager) and another who initiated sprint events and prepared the fish and chamber for repeated sprints (handler). When implementing the delayed burst protocol a single experimenter could fill both rolls. The two sprint protocols differed in the amount of acclimation time and time allotted between burst events (further details below).
Prior to conducting a burst event, the SPC was filled with temperature-controlled, aerated water from the sump. Once the tunnel was full, the water inflow was reduced to ~ 5 ml/s to keep the water-level and temperature stable. Then a randomized process determined whether the fish started in the right or left starting chamber. The handler gently transferred the fish from a transport bucket into the selected starting chamber. The fish was left for its protocol-determined acclimation period while the manager initiated the Python script and entered trial metadata. The script also tested each gate for signal reception, providing an opportunity for experimenters to ensure all laser-gates were aligned prior to the trial. When all laser-gates were aligned and the fish’s acclimation period had expired, the manager initiated the sprint event on the computer, after which any interruptions in the laser-gates were recorded into the datafile. The handler then startled the fish to encourage it to sprint into the tunnel. For the present study the stimulus was a light touch to the fish’s caudal peduncle by the handler. Overhead high-speed (240 fps) video was used to validate the accuracy of the Raspberry Pi system. After the trial, fish were gently removed from the SPC by net or hand and placed into a transport bucket and returned to a recovery tank. The following day, fish were weighed and standard, fork, and total length were measured before being returned to the general housing tank.
Delayed sprint protocol
The Delayed sprint protocol sought to elicit several high-velocity sprints from a given fish by providing the fish time to recover from prior sprint events. This protocol modified the general methodology described above by providing an initial 30-minute acclimation period prior to any sprint events and 5-minute breaks between sprint events (comparable to Nelson and Claireaux, 2005; Nelson et al., 2015). Six sprint events were elicited from each fish in the delayed sprint protocol.
Exhaustive sprint protocol
The exhaustive sprint protocol sought to capture any fatigue-associated decline in sprint performance by initiating repeated sprint events as rapidly as possible. This protocol modified the general methodology described above by providing an initial 5-minute acclimation period and initiating subsequent sprint events as quickly as the fish and tunnel could be made ready. In a given trial fish were stimulated to sprint between 10 and 25 times. The trial was concluded after 25 attempted sprint events or if a fish refused to sprint a total of three times. The mean time between sprint events was 20.4 s with 95% of sprint events occurring between 6.4 and 44.3 seconds after the prior sprint. This inter-sprint duration was not standardized as it depended on the fish’s return to a starting chamber.
Sustained swimming performance protocols
Modified UCRIT test protocol
We compared an individual fish’s sprint velocity performance with its maximum sustained swim velocity using a modified UCRIT test (Farrell, 2008). UCRIT tests were set up by placing a fish in one of two identical 30 L swim tunnels (Loligo, DK) chamber (14 x 14 x 46 cm). The two tunnels were connected via a shared sump (200L). The sump temperature was controlled by a heat pump (Delta Star: DSHP-5, US) and water was supplied to the swim tunnels via a submersible pump (Ehiem: 600, DE). Water in each tunnel was continually flushed and aerated during UCRIT trials. Swim tunnel velocity was controlled via a DAQ-M (Loligo, DK) and AutoResp™ software which controlled a variable frequency drive (Loligo, DK). Swim tunnel velocities were calibrated to the variable frequency drive output at seven setpoints (39 to 114 cm/s, R2 >.998) using a flow meter (Hontzcsh, DE).
Fish were acclimated for 30 minutes prior to beginning the swim trial (Peake et al., 1997; Coughlin et al., 2020). The UCRIT test was executed by increasing the water velocity in a stepwise manner (Brett, 1964; Farrell, 2008), increasing the speed 5 cm sec-1 every 5 minutes. This was done until the force of the water pinned the fish within the tunnel (unable to sustain swimming and at least ⅓ of their body was against the rear screen). Fishes’ cross-sectional area was less than 10% thus a solid-blocking correction was not applied (Bell and Terhune, 1970).
Fish coped with increasing water velocity and fatigue by resting on the rear screen or continuing to swim with their tail touching the rear screen (tail-prop swimming) which could artificially increase the ultimate UCRIT measure. The re-swim protocol addressed instances when the fish exhibited continuous tail-prop swimming or frequent but not sustained rear-screen contact. If the fish was continuously tail-prop swimming, it was encouraged to swim back into the water column (without any screen contact) by turning off the flow of the swim tunnel and giving the fish 1–2 seconds to move off the rear screen before turning the flow back on. These were defined as re-swim attempts. Within a speed increment, a fish would be given two re-swim attempts. Fish were allotted two re-swim attempts per speed increment regardless of re-swim breaks in prior increments. If a fish returned to rest on the rear screen a third time within the speed increment the trial was ended.
We calculated UCRIT using the approach described by Brett (1964) using Equation 2.
VP is fastest velocity (cm s-1) maintained for 300 seconds, t1 is the number of seconds the fish swam at its final velocity prior to becoming pinned, t2 is the interval length (300 seconds) and Vi is the incremental velocity step (5 cm s-1).
Mathematical analyses
Sprint tunnel validation
To validate the output of the SPC we calculated velocity based upon high-speed camera footage. We used footage of fish participating in the first round of delayed sprint trials and focused upon a fish initiating a sprint and transiting the first 9–10 gates of the tunnel. Frame numbers were added to each frame in the video using the software FFmpeg v 4.1 (Tomar, 2006). Using these frame numbers, we identified the frame in which each sequential laser was first visible reflecting off the fish’s rostrum. We converted these frame counts into times by using the camera-reported framerate of 239.76 frames per second. This produced a camera-based timing dataset identically formatted to the laser-based output. Both timing datasets were used to calculate velocity across each combination of laser-gates (e.g., gate 0 vs. gate 5, gate 0 vs. gate 6, gate 1 vs. gate 6). These two datasets, laser-calculated velocities and camera-calculated velocities, were regressed against one another using a linear mixed effect model with a random intercepts and slopes attributed to each individual sprint event and each individual fish to account for non-independence (multiple sprint segments from one sprint event, multiple events per fish).
Assessing sprint velocity metrics
We constructed a data set containing our 14 sprint metrics (Table 1) for each sprint event recorded (n = 21,654 measurements of sprint performance) and used a linear mixed effect model to assess whether the direction of travel, the summary sprint metric, or the sprint protocol (delayed or exhaustive) influenced the reported velocity. This model included a random intercept for each fish. This model included two interactions, one between direction of travel and sprint metric and another between direction of travel and sprint protocol. We used the output of this model containing all 14 sprint metrics to determine our selected sprint metric to be used in the rest of the analysis (see Selection of an Optimal Metric below). To evaluate the influence of protocol type and potential for learning, we built a GLMM with our selected sprint metric (PEAK_SPEED_3_1H) as the response variable and protocol type and trial number (1st or 2nd) as categorical predictor variables, as well as a random intercept for each individual fish.
Novel sprint performance metrics
In addition to metrics of overall burst velocity, the exhaustive burst protocol elicited burst events without recovery. This allowed us to describe three novel metrics of repeated burst performance. Our first measure was fatigue rate and is defined as the decline in burst velocity over sequential burst events. The second is relative anaerobic scope which is estimated by the maximum burst velocity for a given fish when its prior burst exertion is equal to zero (e.g., in a well-rested state), and the third is burst capacity which estimates how many burst events a fish can elicit before a set decline in burst velocity. We calculated these three measures for each fish individually using two modeling approaches.
The first implemented a linear mixed effect model regressing sprint velocity against sequential sprint events and additional interaction with a categorical specific to each fish and burst trial. For each individual fish’s trial, we calculated the regression coefficient with sprint event as a fish’s fatigue rate, the corresponding predicted y-intercept was interpreted as a fish’s total anaerobic capacity, and the sprint event number by which modeled velocity declined by 20% was taken as an estimate of sprint stamina.
The second strategy used segmented linear regression (R package segmented; [Muggeo, 2008]). This approach fit two segments, an initial ‘sprinting’ segment and a following ‘fatigued’ segment. Sprint velocity presumably declines with repeated sprint events during the ‘sprinting’ segment and the slope of this decline is the fatigue rate metric. The ‘fatigued’ segment was marked by a more gradual or flat velocity decline as the fish had little to no anaerobic capacity remaining. We assigned the estimated breakpoint of the segmented regression as a fish’s sprint stamina. We assigned the total anaerobic capacity as the y-intercept of the ‘sprinting’ segment. Unlike our fully linear approach, each fish was analyzed individually due to the limitations of the segmented package.
We assessed the repeatability of sprint performance across individuals using the intraclass correlation coefficient (ICC) of linear mixed effect models between a sprint trait (total anaerobic capacity, sprint stamina or fatigue rate) and trial number with a random intercept for each fish. These models were fitted using the R package brms (Bürkner, 2017, 2018). ICC values range from 0 to 1 with 0 being no repeatability and 1 being perfect repeatability (Hayes and Jenkins, 1997; Bell et al., 2009; Koo and Li, 2016). Interpreting repeatability is inherently subjective and system-dependent, and we considered ICC values above 0.6 as indicative of useful repeatability.
We also assessed the relationships between UCRIT and a fish’s average maximum sprint speed or fatigue rate to assess whether fish that are fast, sustained swimmers are also fast sprint swimmers or resistant to anaerobic fatigue. This was done by regressing individual fish’s sprint velocity or fatigue rate against UCRIT in a linear mixed-effect model with a random effect for each individual.
Results
Velocity validation
The regression of the camera-based velocity and the laser-based velocity (4705 sprint segments across 155 sprint events from 28 fish) had an estimated correlation of 0.96 and an R2 of 0.97 (Figure 5), indicating a high level of precision and accuracy of the raspberry PI monitored SPC. The fish’s direction of travel through the chamber did not have a significant effect on the reported velocity (estimated effect: -1.8, 95% CI -5.4 to 1.9 cm sec-1) and no interactions with any of the specific sprint metrics were significant. Across the dataset of all burst events (N = 21,654), the fatigue protocol elicited on average slower burst events (effect: -7.5, 95% CI -9.26 to -5.66 cm sec-1) but this is a function of the greater number of burst events when fish were exhausted occurring during the fatigue protocol. If we assess only a fish’s fastest burst event within a single trial, this relationship is reversed (see below).

Figure 5. Accuracy of laser calculated velocities relative to velocities calculated via high-speed overhead cameras. Red line and gray shaded ribbon indicate the relationship and standard error calculated from the best fitting model, while the equation and r2 describe the model. The thick dashed line represents 100% accuracy, while the dotted lines bound an error of 10% between camera timing and laser timings.
While overall accuracy of the SPC was high, individual gates did occasionally misfire producing excessively high velocity estimates. We identified these sources of error by excluding calculated segment velocities greater than 2000 cm/s. A total of 118,333 segments were analyzed across all analyzed sprint events (N = 1543). We identified 207 instances of gates that triggered in error which resulted in 294 (0.25%) segments eclipsing our velocity threshold, with an average velocity of 1.01e5± 2.17e4 cm/s. We then excluded any sprint segment which relied upon an erroneous gate to quantify velocity (n = 1,631, 1.38%), not just those which eclipsed our 2000 cm/s threshold.
Selection of an optimal sprint metric
Of the 14 sprint metrics quantified (Table 1), there were consistent differences in overall sprint velocity estimates as well as the repeatability of those estimates within the four trials conducted for each individual trout. The PEAK_SPEED metric and others that included PEAK_SPEED as part of an average (e.g., AVE_SPEED_TOP_3) generally reported the fastest velocities and were the least repeatable. Both results are likely due to occasional and subtly erroneous segments that yield an unusually fast velocity, thereby increasing the estimated sprint velocity and reducing repeatability within an individual. Sprint metrics that incorporated more data, such as the metric which averages all instantaneous velocities in the entire tunnel (AVE_SPEED), or in just the first half (AVE_SPEED_1H), were the most repeatable but also produced the slowest sprint estimates. Regardless of the metric calculated, trials conducted using the exhaustive sprint protocol generally produced overall faster sprint estimates and had greater ICC values (i.e., were more repeatable). We attribute this phenomena to the greater number of burst events measured using the exhaustive protocol (μ=6.0 vs μ=24.4), allowing greater opportunity for an individual to elicit its ‘fastest’ performance.
For analysis of rainbow trout sprint swimming performance and subsequent comparisons with UCRIT we selected PEAK_SPEED_3_1H as our metric of sprint velocity. This metric is the 3rd fastest segment recorded in the first half of the SPC and was selected due to both its higher reported velocities and high ICC (>0.61). We chose to limit our observations to the first half of the tunnel due to some user-induced erroneous timings during the first round of Delayed Sprint trials; the operator manually triggered gates if fish did not swim all the way to the receiving chamber, but this unintentionally produced artificially fast velocities in some trials. The protocol was changed for later trials, and PEAK_SPEED_3 and PEAK_SPEED_3_1H report the nearly the same average velocity (first round: 151.12 vs. 149.80 cm sec-1, second round: 148.14 vs. 147.68 cm sec-1, respectively) and nearly the same ICC (0.63 vs. 0.61) across the two rounds of exhaustive sprint trials, indicating that measurements observed in the first half of the tunnel are a good substitute for observations across the entire length.
Sprint swimming performance
The mean (± SD) rainbow trout sprint velocities, calculated as PEAK_SPEED_3_1H for each round of sprint trials ranged from 125.38 ± 36.18 cm sec-1 to 149.80 ± 33.06 cm sec-1 (Table 2). The sprint velocity was greater when using the exhaustive sprint protocol than when using the delayed sprint protocol. Sprint events (n =1218 individually measured sprint events) during exhaustive sprint trials were initiated 20.4 ± 23.8 seconds apart (µ ± SD). An average of 24.6 ± 1.3 sprint events were elicited by fish during exhaustive sprint trials. Three fish did not complete the maximum 25 sprint events and instead refused to sprint three times, thereby ending the trial.
Table 2. Swim performance metrics and fish sizes of rainbow trout (Oncorhynchus mykiss) tested in UCRIT, Delayed and Exhaustive Sprint trials.
Sprint fatigue
Our approach to calculating the fatigue rate was challenged by variable fish performance. We expected fish would exhibit a general decline in sprint velocity after repeated sprinting, and that the rate of this decline would become more gradual or plateau near the end of the trial. However, the relationship between sprint count and sprint velocity was more varied than expected (Supplementary Figure 5), and subsequently our estimates of sprint stamina and fatigue are coarse. Our first approach assumed a linear relationship between sequential sprint event and sprint velocity (Figure 6), while our second implemented segmented linear regression to account for the potential of fish tiring and then plateauing in performance (Table 3). The linear approach yielded more consistent estimates of sprint stamina (number of burst events yield a 20% decline in modeled sprint velocity), fatigue rate (rate of decline in modeled sprint velocity) and relative aerobic scope (modeled y-intercept) when consistency was defined as both among fish (smaller interquartile range) and between the two rounds of exhaustive trials. Despite this greater consistency the estimated total anaerobic capacity was consistently underestimated by an average of 31 ± 12% (µ ± SD), when compared to the maximum sprint velocities calculated using PEAK_SPEED_3_1H. The segmented approach did not estimate total anaerobic scope any more accurately (mean error 29 ± 29%) and was far more variable in its estimates of sprint stamina and fatigue rate. Estimated rates of fatigue using the linear approach were faster (-1.62 ± 1.23 cm sec-1 per sprint) than when estimating via segmented linear regression (-1.50 ± 16.43 cm sec-1 per sprint) and sprint stamina was correspondingly greater when using the linear versus segmented approach (18 sprint events vs. 11 respectively). Sprint stamina did not exhibit high repeatability when estimated using the linear approach (ICC: 0.07) or when using the segmented approach (ICC: 0.09). A fish’s fatigue rate also did not exhibit high repeatability when estimated using either the linear (ICC: 0.06) or segmented approach (ICC: 0.04).
Figure 6. Modeled linear fatigue rate of 50 sprint trials of Rainbow Trout (n = 26 individuals). Points represent the sprint velocity (cm sec) of 1203 spring events (n = 16 to 26 spring events per trial). Light grey lines are the visualized fatigue rate for each sprint trial, while the red line is the overall fatigue rate (-1.54 cm sec-1 event-1).
Table 3. Metrics of Sprint Fatigue (bolded) estimated using two approaches.
UCRIT performance
Rainbow trout exhibited a modified UCRIT of 59.8 ± 12.3 cm sec-1. Fish increased in length and mass over the course of the experiment (Table 2). The average fish fork length during UCRIT trials was 25.6 ± 1.7 cm (234.4 ± 55.9 g) and 26.8 ± 2.3 cm (247.7 ± 70.6 g) in the final round of exhaustive sprints. For each fish we regressed UCRIT against the sprint velocity averaged across the exhaustive and delayed sprint trials. Sprint velocity was non-significantly associated with UCRIT (p = 0.167). We also regressed UCRIT against our two measures of fatigue rate. The relationships were non-significant for both the linear (β = 0.28, p =0.85) and segmented (β = 0.01, p = 0.90) approaches.
Discussion
Sprint swimming is an essential component of fish performance and ecology (Mussen et al., 2013; Castro-Santos et al., 2022; McInturf et al., 2022). However, limitations of extant methodologies prevent the high-throughput processing necessary to test the impact of environmental characteristics on this burst swimming as well as assessing additional anaerobic traits.
Rainbow trout case-study
We evaluated the sprint swim response of captive rainbow trout using a laser-timed sprint performance chamber monitored by a Raspberry Pi and consisting of 25 laser gates. Validation of our device using high-speed cameras demonstrated a high level of accuracy when using our array of 25 lasers, and this method also allowed for quantification of fish sprint stamina and fatigue rate.
Our results indicate that rainbow trout (24.7 ± 1.9 cm standard length, µ ± S.D) sprint at ~ 6 LB sec-1. This velocity is lower than those reported in rainbow trout experiments using camera-based fast-start methodology (7.3 Lb sec-1, 20.4 - 29.6 cm total length; [Webb, 1976]) or sprint events elicited in a swim tunnel (6.5 -7.5 LB sec-1; 11.5 ± 0.1 cm fork length, [Osachoff et al., 2014]). These differences could stem from methodological variations. In camera-based methods the units of time and distance over which velocity could be measured are smaller, limited by the framerate and resolution of the film. Our method was limited by the distance between the lasers (minimum 1cm). We found that estimating velocity over smaller segments (1-3cm) yielded higher reported velocities but also greater disagreement with the overhead cameras (discussed below). Another possible source of this discrepancy could be due to the test arena. Work conducted by Webb (1976) allowed fish to sprint in any direction in the horizontal plane, while our device requires fish to sprint in a straight line down the tunnel. While rainbow trout were observed to have a small turning angle while sprinting (Webb, 1976; Domenici and Blake, 1997) sprinting out of alignment with the direction of the tunnel would reduce the measured velocity. Similarly, in fast-start work using a swim tunnel, the current of the tunnel orients the fish to the direction of travel and fish are able to sprint against this current continuously, possibly achieving higher speeds than in a SPC of 2m length. Fish size is also an important determinant of sprint velocity. Bellinger et al. (2018) quantified sprint swimming performance of juvenile rainbow trout (Length 5–9 cm) and report relative sprint velocities of 8 to 14 Lb s-1. While these values are much higher than our measured velocities this is likely due to the allometric effects of fish size on swimming velocity (scaling exponent = 0.43, Vogel, 2008), where smaller fish will exhibit greater length-specific velocities than larger fish. Work by McInturf et al. (2022) using juvenile Chinook salmon (5.8 ± 0.5 cm in fork length) in a smaller SPC, similar to the one described presently, found similar velocities (13.4 ± 4.5 LB s-1) to those reported for juvenile rainbow trout. Finally, maximum swim velocity has been found to exhibit allometric scaling with length-specific values being greater for smaller organisms than for larger ones (Vogel, 2008), however, the attributed scaling exponent for this relationship itself varies with fish size from 1.09 (organisms <10cm) to 0.45 (organisms >10cm).
Considering that sprint swimming is utilized as an escape response, a predatory strategy, or to navigate or avoid challenging hydraulic conditions (Mussen et al., 2013; Castro-Santos et al., 2022; McInturf et al., 2022), understanding the rate at which fish lose performance is important. Our results indicate that rainbow trout sprint velocity is reduced after repeated sprint swims. There was, however, high variability in the breakpoint for our segmented fatigue analysis, suggesting that perhaps 25 sprint events does not capture a theoretical plateau in sprint velocity. Under this hypothesis, the linear fatigue analysis may best represent the gradual loss of sprint speed with repeated sprinting, providing an approximate fatigue rate of -1.40 cm sec-1 sprint event-1. McFarlane and McDonald (2002) repeatedly sprinted rainbow trout but did not find evidence of fatigue rate. However, they provided each fish a 30-min respite between sprint events and only conducted eight sprint events per fish, whereas in the present study fish were sprinted more than 10 times (maximum of 25) and with rests between sprints averaging less than 30 seconds. Our quantification of fatigue rate is made possible by the novel symmetrical design of the SPC which facilitates rapid, repeated sprint events. Future work will be necessary to develop more robust methods of describing fatigue rate and linking this trait to aspects of fish rearing history, physiology, and biomarkers of anaerobic metabolism (e.g., concentrations of lactate or phosphocreatine in the glycolytic muscles). Finally, the fatigue rate could be influenced by the ratio of chamber length to fish length. Experiments conducted with higher fish length to tunnel length ratios will have the fish traveling further with each burst event and so fatigue rates would be expected to increase with this travel ratio. Therefore, care should be taken if extrapolating this metric across experimental set-ups.
Our measure of UCRIT (60.71 ± 12.08 cm sec-1, 2.50 ± 0.55 Lb sec-1) is comparable to UCRIT of rainbow trout found in other studies which ranged from approximately 1.5 to 5 BL s-1 (Jain et al., 1997; Coughlin et al., 2020; Zupa et al., 2021), although differences in both fish size and trial temperature influence these data. We found a non-significant, near-zero, association (β = 0.17, p = 0.794) between a fish’s UCRIT and its sprint velocity (PEAK_SPEED_3_1H). In other words, a fish capable of fast sustained swimming is not inherently a fast-sprinting fish, a result shared in similar research on European sea bass (Dicentrarchus labrax [Claireaux et al., 2007; Marras et al., 2013]) and blacknose dace (Rhinichthys atratulus [Nelson et al., 2008], although note species’ plasticity [Nelson et al., 2015]). This differs from past work on Atlantic Cod (Gadus morhua [Reidy et al., 2000]) which found a positive association between UCRIT and sprint velocity in an SPC, implying that independence of these swimming modes (aerobic vs. anaerobic) may be species specific. However, this same study found a negative association between UCRIT and sprint performance when measured in a swim tunnel indicating that methodological approach may have important implications for the determination of sprint performance.
There was no significant correlation between our novel trait of fatigue rate and UCRIT. This non-association could be explained by differences in fish musculature, as fast starts or sprint behavior requires the use of fast-twitch muscle fibers (white muscle), while sustained aerobic swimming (UCRIT) uses highly vascularized red-muscle before relying upon white muscle. Future work which more directly links swimming performance with relative abundance of muscle types is needed to contextualize how the fatigue rate metric associates with the depletion of endogenous energy stores in white muscle and the accrual of metabolic waste products. Additionally, thermal acclimation has been shown to differentially alter the power output and contractile speed of rainbow trout muscle fibers (Coughlin et al., 2020) with warm acclimated fish exhibiting reduced performance at cold temperatures, relative to cold-acclimated counterparts. Future work testing trout acclimated to a range of temperatures would allow determination of relationships between muscle physiology and aerobic and sprint swimming performance.
Sprint tunnel methodology
Our design for a SPC improved upon past methodology, incorporating a greater number of lasers which facilitated greater resolution on sprint performance as well as novel laser arrangements facilitating quantification of novel performance metrics (e.g., fatigue rate, sprint stamina, residual anaerobic capacity). Additionally, our device allows for considerably quicker and higher throughput (>30 individuals per day) by eliminating the post-processing and analysis of camera footage. However, challenges are still present. For example, alignment of lasers is essential for accurate data collection and lasers could shift out of alignment over time and use. Our software included a pre-trial check which would determine which gates, if any, were out of alignment and alert the user so they could be corrected quickly. Water droplets, or subsequent mineral deposits could obscure lasers and care had to be taken to clean the chamber walls as necessary.
We found that human operators, despite training, can vary in the force and speed of stimulus to the fish. Therefore, we kept the role of handler the same across all sprint performance trials to minimize any inter-operator variation. Likewise, different species of fish can vary in their behavior within the SPC. Research by McInturf et al. (2022) which used this chamber (and a scaled version for juvenile salmonids) found that different species of fish required different methods of stimulation. Largemouth bass and rainbow trout had to be physically touched to stimulate a sprint event, while juvenile Chinook salmon (O. tshawytscha) could be stimulated by disturbing the water behind them with a probe. Past work on sprint performance has used electric shock (Webb, 1976; Gamperl et al., 1991), physical disturbance (Domenici and Blake, 1991), or physical contact (Reidy et al., 2000) and work on additional species will require determination of which stimulus method is the most controlled, appropriate, and repeatable.
The body size, body shape, and behavioral tendencies of fish are relevant to many aspects of locomotion with consequences for fish passage and fish capture (Castro-Santos et al., 2022). Likewise, the accurate measurement of fish burst performance may require alterations to the design or operation of the SPC that reflects differences in species morphology and behavior. It is possible for fish to jump during a sprint, and therefore miss a gate, or for small benthic fish to evade the laser-gates entirely. This can be improved by increasing the density of lasers on the array, securing a lid to prevent jumping, and/or allowing the SPC code to tolerate gates which are ‘missed’. In the present experiment, rainbow trout were too large to elude detection making these approaches unnecessary.
Finally, we used discrete laser-gates due to their low cost and ease of use, however alternative technological approaches could improve data resolution. For example, Lidar (Light Detection and Ranging) could be used to track the movement of a fish with finer spatial and temporal resolution but would require more complex post-processing and greater cost. Likewise, proximity sensors, which detect changes in electromagnetic resistance, could offer increased resolution but would be challenging to calibrate. The visibility of the lasers made it straightforward to calibrate and pair with the overhead high-speed cameras as well as design software and conduct data analysis for the current study. While not continuous, the placement of lasers is flexible and multiple configurations could be used to produce segments of different lengths and relative positions. By altering the distances between lasers, experimenters can customize the SPC to answer specific research questions. We have not validated distances shorter than 1 cm, because a fish could cover a 1 cm distance in 2–3 frames of our high-speed camera, and therefore our ability to assess the accuracy of the tunnel at this small distance was imprecise. Observation using a camera with higher framerate would enable evaluation of the SPC accuracy across smaller distances.
Future applications
Sprint swimming performance is an understudied aspect of fish ecophysiology and we believe further research into this trait will be useful for addressing fish responses to environmental change. Our SPC offers an affordable, adjustable, platform for tailoring the evaluation of sprint performance to specific species and environmental conditions. The arrangement of laser-gates can be customized for the assessment of different traits (e.g., mirrored for sprint stamina or fatigue, clustered for acceleration) or to increase resolution on burst performance. The size of the chamber can be scaled to accommodate a range of fish sizes and has been used to assess the sprint performance ranging from small salmonids (1.79 g) to largemouth bass (Micropterus salmoides; 227.1 g; McInturf et al., 2022) and the rainbow trout in the present experiment (234.8 g). This design would also be well suited to the assessment of sprint velocity of larger fish because the accuracy of the SPC increases when measuring over larger distances, as do the challenges of traditional methods of high-speed filming. The SPC is suitable for field deployment, as the power requirements for the single-board computers and associated pumps are low and could be run off a generator or battery. Likewise, the duration of trials is short (10–15 minutes for the exhaustive sprint protocol) facilitating high throughput, allowing wild-caught fish to be quickly returned to the environment.
Our SPC design presents the opportunity to study the connection between sprint performance and anaerobic metabolism by measuring changes in sprint speed as a fish is tested repeatedly without recovery. Anaerobic fatigue has been associated with a decline in ATP available in white muscle (McFarlane and McDonald, 2002) and future work could correlate sequential sprint events with ATP consumption to investigate anaerobic metabolic rates. While both of our approaches to estimating fatigue rate and sprint stamina exhibited broad variation, we found that a single linear regression approach performed better and could likely be improved with changes to the exhaustive sprint protocol. For instance, we would recommend continuing trials until fish become notably unresponsive to the stimulus as opposed to an arbitrary cap of 25 events. Additionally, conducting trials on fish exposed to different rearing conditions (e.g., temperature, food availability, dissolved oxygen) would allow determination of whether fatigue rate and sprint stamina are responsive to environmental traits and therefore useful in broader assessments of fish fitness.
In the future, quantification of sprint performance and capacity may be informative in the development of technology for facilitating fish passage (Castro-Santos, 2005; Cooke et al., 2020; Zielinski and Freiburger, 2021) or preventing entrainment (Poletto et al., 2015; Ercan et al., 2017; Steel et al., 2022) where hydraulic conditions can be engineered to be within the physical capacity of wild fish. Furthermore, quantifying and describing sprint behavior may be necessary for understanding the effect of environmental conditions (e.g., temperature: [Bellinger et al., 2018; Davis et al., 2019], toxicants: [Mundy et al., 2020]) or interpopulation variation and domestication (Bellinger et al., 2014, 2018) on fish physiology and ecology. Finally, models of fish movement, habitat usage and migration can be improved with more detailed understanding of the peak speeds fish can elicit and the environmental conditions which impact fish performance.
Data availability statement
The datasets presented in this study can be found in online repositories. The names of the repository/repositories and accession number(s) can be found below: Dryad: https://datadryad.org/dataset/doi:10.25338/B8NH1X?public=true.
Ethics statement
The animal study was approved by UC Davis Institutional Animal Care and Use Committee Protocol #23949. The study was conducted in accordance with the local legislation and institutional requirements.
Author contributions
KZ: Conceptualization, Data curation, Formal analysis, Funding acquisition, Investigation, Methodology, Project administration, Resources, Software, Supervision, Validation, Visualization, Writing – original draft, Writing – review & editing. JF: Funding acquisition, Investigation, Writing – review & editing. AM: Conceptualization, Funding acquisition, Investigation, Methodology, Project administration, Writing – review & editing. SB: Conceptualization, Methodology, Resources, Software, Writing – original draft, Writing – review & editing. AS: Investigation, Writing – original draft, Writing – review & editing. DC: Project administration, Resources, Writing – review & editing. NF: Conceptualization, Funding acquisition, Project administration, Resources, Supervision, Writing – original draft, Writing – review & editing.
Funding
The author(s) declare financial support was received for the research and/or publication of this article. This research was funded with the Lloyd W. Swift Student Support Scholarship and the University of California, Agricultural Experiment Station (NAF, 2098-H). Alexandra G. McInturf acknowledges funding from California Sea Grant’s Delta Science Fellowship (grant number 19054). This publication is (partially) funded by the Cooperative Institute for Climate, Ocean, & Ecosystem Studies (CIOCES) under NOAA Cooperative Agreement NA20OAR4320271, Contribution No. 2023-1329. Additional partial funding was provided by the State Water Resources Control Board of California Standard Agreement (20-036-300).
Acknowledgments
Leanne Pearl and Mikayla Debarros for parts descriptions and Gabe Singer for insights into SPC design. Research animals were donated from the American River Hatchery (Gold River, CA) by California Department of Fish and Wildlife. We thank two anonymous reviewers for their helpful feedback.
Conflict of interest
The authors declare that the research was conducted in the absence of any commercial or financial relationships that could be construed as a potential conflict of interest.
Correction note
This article has been corrected with minor changes. These changes do not impact the scientific content of the article.
Generative AI statement
The author(s) declare that no Generative AI was used in the creation of this manuscript.
Any alternative text (alt text) provided alongside figures in this article has been generated by Frontiers with the support of artificial intelligence and reasonable efforts have been made to ensure accuracy, including review by the authors wherever possible. If you identify any issues, please contact us.
Publisher’s note
All claims expressed in this article are solely those of the authors and do not necessarily represent those of their affiliated organizations, or those of the publisher, the editors and the reviewers. Any product that may be evaluated in this article, or claim that may be made by its manufacturer, is not guaranteed or endorsed by the publisher.
Supplementary material
The Supplementary Material for this article can be found online at: https://www.frontiersin.org/articles/10.3389/fevo.2025.1659194/full#supplementary-material
References
Alsop D. H. and Wood C. M. (1997). The interactive effects of feeding and exercise on oxygen consumption, swimming performance and protein usage in juvenile rainbow trout (Oncorhynchus mykiss). J. Exp. Biol. 200, 2337–2346. doi: 10.1242/jeb.200.17.2337
Bell A. M., Hankison S. J., and Laskowski K. L. (2009). The repeatability of behaviour: a meta-analysis. Anim. Behav. 77, 771–783. doi: 10.1016/j.anbehav.2008.12.022
Bell W. H. and Terhune L. D. B. (1970). Water Tunnel Design for Fisheries Research (Nanaimo, British Columbia (B.C.): Fishereis Research Board of Canada Biological Station).
Bellinger K. L., Thorgaard G. H., and Carter P. A. (2014). Domestication is associated with reduced burst swimming performance and increased body size in clonal rainbow trout lines. Aquaculture. 420-421, 154–159. doi: 10.1016/j.aquaculture.2013.10.028
Bellinger K. L., Thorgaard G. H., and Carter P. A. (2018). Complex relationships among rearing temperature, growth, and sprint speed in clonal lines of rainbow trout. Can. J. Fish. Aquat. Sci. 75, 1868–1877. doi: 10.1139/cjfas-2017-0218
Brett J. R. (1964). The respiratory metabolism and swimming performance of young sockeye salmon. J. Fish. Res. Board. Can. 21, 1183–1226. doi: 10.1139/f64-103
Brown R. S., Geist D. R., and Mesa M. G. (2006). Use of electromyogram telemetry to assess swimming activity of adult spring chinook salmon migrating past a columbia river dam. T. Am. Fish. Soc. 135, 281–287. doi: 10.1577/T05-223.1
Budick S. A. and O’Malley D. M. (2000). Locomotor repertoire of the larval zebrafish: swimming, turning and prey capture. J. Exp. Biol. 203, 2565–2579. doi: 10.1242/jeb.203.17.2565
Bürkner P.-C. (2017). brms: An R package for Bayesian multilevel models using Stan. J. Stat. Soft. 80, 1–27. doi: 10.18637/jss.v080.i01
Bürkner P.-C. (2018). Advanced Bayesian multilevel modeling with the R package brms. R. J. 10, 395. doi: 10.32614/RJ-2018-017
Callaghan T. J., White C. R., and Turschwell M. P. (2021). Oxygen stress and reproduction do not impede aerobic performance in adult eastern mosquitofish (Gambusia holbrooki). Environ. Biol. Fish. 104, 143–154. doi: 10.1007/s10641-021-01065-z
Castro-Santos T. (2005). Optimal swim speeds for traversing velocity barriers: an analysis of volitional high-speed swimming behavior of migratory fishes. J. Exp. Biol. 208, 421–432. doi: 10.1242/jeb.01380
Castro-Santos T., Goerig E., He P., and Lauder G. V. (2022). “Applied aspects of locomotion and biomechanics,” in Fish physiology (Oxford: Elsevier), 91–140. doi: 10.1016/bs.fp.2022.04.003
Chabot D., Steffensen J. F., and Farrell A. P. (2016). The determination of standard metabolic rate in fishes. J. Fish. Biol. 88, 81–121. doi: 10.1111/jfb.12845
Chen Z., Snow M., Lawrence C. S., Church A. R., Narum S. R., Devlin R. H., et al. (2015). Selection for upper thermal tolerance in rainbow trout (Oncorhynchus mykiss Walbaum). J. Exp. Biol. 218, 803–812. doi: 10.1242/jeb.113993
Claireaux G., Handelsman C., Standen E., and Nelson J. A. (2007). Thermal and temporal stability of swimming performance in the european sea bass. Physiol. Biochem. Zool. 80, 186–196. doi: 10.1086/511143
Clow K. A., Short C. E., and Driedzic W. R. (2017). Low levels of extracellular glucose limit cardiac anaerobic metabolism in some species of fish. J. Exp. Biol. 220, 2970–2979. doi: 10.1242/jeb.159582
Colin P. L. (1992). Reproduction of the Nassau grouper, Epinephelus striatus (Pisces: Serranidae) and its relationship to environmental conditions. Environ. Biol. Fish. 34, 357–377. doi: 10.1007/BF00004740
Cooke S. J., Cech J. J., Glassman D. M., Simard J., Louttit S., Lennox R. J., et al. (2020). Water resource development and sturgeon (Acipenseridae): state of the science and research gaps related to fish passage, entrainment, impingement and behavioural guidance. Rev. Fish. Biol. Fish. 30, 219–244. doi: 10.1007/s11160-020-09596-x
Coughlin D. J., Wilson L. T., Kwon E. S., and Travitz L. S. (2020). Thermal acclimation of rainbow trout myotomal muscle, can trout acclimate to a warming environment? Comp. Biochem. Phys. A. 245, 110702. doi: 10.1016/j.cbpa.2020.110702
Croston B. (2022). A python module to control the GPIO on a Raspberry Pi. Available online at: https://sourceforge.net/projects/raspberry-gpio-python/ (Accessed February 01, 2020).
Davis B. E., Hansen M. J., Cocherell D. E., Nguyen T. X., Sommer T., Baxter R. D., et al. (2019). Consequences of temperature and temperature variability on swimming activity, group structure, and predation of endangered delta smelt. Freshw. Biol. 64, 2156–2175. doi: 10.1111/fwb.13403
Dickson I. W. and Kramer R. H. (1971). Factors influencing scope for activity and active and standard metabolism of rainbow trout (Salmo gairdneri). J. Fish. Res. Board. Can. 28, 587–596. doi: 10.1139/f71-082
Domenici P. and Blake R. W. (1991). The kinematics and performance of the escape response in the angelfish (Pterophyllum eimekei). J. Exp. Biol. 156, 187–205. doi: 10.1242/jeb.156.1.187
Domenici P. and Blake R. W. (1993). Escape trajectories in angelfish (Pterophyllum eimekei). J. Exp. Biol. 177, 253–272. doi: 10.1242/jeb.177.1.253
Domenici P. and Blake R. W. (1997). The kinematics and performance of fish fast-start swimming. J. Exp. Biol. 200, 1165–1178. doi: 10.1242/jeb.200.8.1165
Driedzic W. R. (2018). Low plasma glucose limits glucose metabolism by RBCs and heart in some species of teleosts. Comp. Biochem. Physiol. Part B.: Biochem. Mol. Biol. 224, 204–209. doi: 10.1016/j.cbpb.2017.08.002
Driedzic W. R. and Hart T. (1984). Relationship between exogenous fuel availability and performance by teleost and elasmobranch hearts. J. Comp. Physiol. B. 154, 593–599. doi: 10.1007/BF00684413
Duncan M. I., James N. C., Potts W. M., and Bates A. E. (2020). Different drivers, common mechanism; the distribution of a reef fish is restricted by local-scale oxygen and temperature constraints on aerobic metabolism. Conserv. Physiol. 8, coaa090. doi: 10.1093/conphys/coaa090
Eaton R. C. and Emberley D. S. (1991). How stimulus direction determines the trajectory of the mauthner-initiated escape response in a teleost fish. J. Exp. Biol. 161, 469–487. doi: 10.1242/jeb.161.1.469
Eaton R. C., Lee R. K. K., and Foreman M. B. (2001). The Mauthner cell and other identified neurons of the brainstem escape network of fish. Prog. Neurobiol. 63, 467–485. doi: 10.1016/S0301-0082(00)00047-2
Eliason E. J., Clark T. D., Hinch S. G., and Farrell A. P. (2013). Cardiorespiratory collapse at high temperature in swimming adult sockeye salmon. Conserv. Physiol. 1, cot008–cot008. doi: 10.1093/conphys/cot008
Ercan A., Kavvas M. L., Carr K., Hockett Z., Bandeh H., Mussen T. D., et al. (2017). Hydraulics near unscreened diversion pipes in open channels: large flume experiments. JAWRA 53, 431–441. doi: 10.1111/1752-1688.12503
Farrell A. P. (2008). Comparisons of swimming performance in rainbow trout using constant acceleration and critical swimming speed tests. J. Fish. Biol. 72, 693–710. doi: 10.1111/j.1095-8649.2007.01759.x
Frith H. R. and Blake R. W. (1995). The mechanical power output and hydromechanical efficiency of northern pike (Esox lucius) fast-starts. J. Exp. Biol. 198, 1863–1873. doi: 10.1242/jeb.198.9.1863
Gamperl A. K., Schnurr D. L., and Stevens E. D. (1991). Effect of a sprint-training protocol on acceleration performance in rainbow trout (Salmo gairdneri). Can. J. Zool. 69, 578–582. doi: 10.1139/z91-087
Gowans A. R. D., Armstrong J. D., Priede I. G., and Mckelvey S. (2003). Movements of Atlantic salmon migrating upstream through a fish-pass complex in Scotland. Ecol. Fresw. Fish. 12, 177–189. doi: 10.1034/j.1600-0633.2003.00018.x
Hale M. E., Long JR. J. H., McHenry M. J., and Westneat M. W. (2002). Evolution of behavior and neural control of the fast-start escape response. Evolution 56, 993–1007. doi: 10.1111/j.0014-3820.2002.tb01411.x
Hammer C. (1995). Fatigue and exercise tests with fish. Comp. Biochem. Phys. A. 112, 1–20. doi: 10.1016/0300-9629(95)00060-K
Handelsman C., Claireaux G., and Nelson J. A. (2010). Swimming ability and ecological performance of cultured and wild european sea bass (Dicentrarchus labrax) in coastal tidal ponds. Physiol. Biochem. Zool. 83, 435–445. doi: 10.1086/651099
Hayes J. P. and Jenkins S. H. (1997). Individual variation in mammals. J. Mammal. 78, 274–293. doi: 10.2307/1382882
Hinch S. G. and Bratty J. (2000). Effects of swim speed and activity pattern on success of adult sockeye salmon migration through an area of difficult passage. T. Am. Fish. Soc. 129, 598–606. doi: 10.1577/1548-8659(2000)129<0598:EOSSAA>2.0.CO;2
Hvas M. (2022). Swimming energetics of Atlantic salmon in relation to extended fasting at different temperatures. Conserv. Physiol. 10, coac037. doi: 10.1093/conphys/coac037
Jain K. E., Hamilton J. C., and Farrell A. P. (1997). Use of a ramp velocity test to measure critical swimming speed in rainbow trout (Onchorhynchus mykiss). Comp. Biochem. Phys. A. 117, 441–444. doi: 10.1016/S0300-9629(96)00234-4
Jayne B. C. and Lauder G. V. (1993). Red and white muscle activity and kinematics of the escape response of the bluegill sunfish during swimming. J. Comp. Physiol. A 173, 495–508. doi: 10.1007/BF00193522
Kieffer J. D. and May L. E. (2020). Repeat UCrit and endurance swimming in juvenile shortnose sturgeon (Acipenser brevirostrum). J. Fish. Biol. 96, 1379–1387. doi: 10.1111/jfb.14306
Koo T. K. and Li M. Y. (2016). A guideline of selecting and reporting intraclass correlation coefficients for reliability research. J. Chiro. Med. 15, 155–163. doi: 10.1016/j.jcm.2016.02.012
Lo V. K., Martin B. T., Danner E. M., Cocherell D. E., Cech J. J. Jr., and Fangue N. A. (2022). The effect of temperature on specific dynamic action of juvenile fall-run Chinook salmon, Oncorhynchus tshawytscha. Conserv. Physiol. 10, coac067. doi: 10.1093/conphys/coac067
Luo Y., Wang W., Zhang Y., Huang Q., and Lim D. (2013). Effects of starvation on the excess post-exercise oxygen consumption of juvenile Nile tilapia (Oreochromis niloticus). Mar. Freshw. Behav. Phy. 45, 333–342. doi: 10.1080/10236244.2012.750059
MacNutt M. J., Hinch S. G., Farrell A. P., and Topp S. (2004). The effect of temperature and acclimation period on repeat swimming performance in cutthroat trout. J. Fish. Biol. 65, 342–353. doi: 10.1111/j.0022-1112.2004.00453.x
Marras S., Killen S. S., Claireaux G., Domenici P., and McKenzie D. J. (2011). Behavioural and kinematic components of the fast-start escape response in fish: individual variation and temporal repeatability. J. Exp. Biol. 214, 3102–3110. doi: 10.1242/jeb.056648
Marras S., Killen S. S., Domenici P., Claireaux G., and McKenzie D. J. (2013). Relationships among Traits of Aerobic and Anaerobic Swimming Performance in Individual European Sea Bass Dicentrarchus labrax. PloS One 8, e72815. doi: 10.1371/journal.pone.0072815
McDonald D. G., McFarlane W. J., and Milligan C. L. (1998). Anaerobic capacity and swim performance of juvenile salmonids. Can. J. Fish. Aquat. Sci. 55, 1198–1207. doi: 10.1139/f98-002
McFarlane W. J. and McDonald D. G. (2002). Relating intramuscular fuel use to endurance in juvenile rainbow trout. Physiol. Biochem. Zool. 75, 250–259. doi: 10.1086/341815
McInturf A. G., Zillig K. W., Cook K., Fukumoto J., Jones A., Patterson E., et al. (2022). In hot water? Assessing the link between fundamental thermal physiology and predation of juvenile Chinook salmon. Ecosphere 13, 1–19. doi: 10.1002/ecs2.4264
McKenzie D. J., Höglund E., Dupont-Prinet A., Larsen B. K., Skov P. V., Pedersen P. B., et al. (2012). Effects of stocking density and sustained aerobic exercise on growth, energetics and welfare of rainbow trout. Aquaculture 338–341, 216–222. doi: 10.1016/j.aquaculture.2012.01.020
Muggeo V. M. R. (2008). segmented: an R package to fit regression models with broken-line relationships. R. News 8, 20–25. Available online at: https://journal.r-project.org/articles/RN-2008-004/.
Mundy P. C., Carte M. F., Brander S. M., Hung T.-C., Fangue N., and Connon R. E. (2020). Bifenthrin exposure causes hyperactivity in early larval stages of an endangered fish species at concentrations that occur during their hatching season. Aquat. Toxicol. 228, 105611. doi: 10.1016/j.aquatox.2020.105611
Mussen T. D., Cocherell D., Hockett Z., Ercan A., Bandeh H., Kavvas M. L., et al. (2013). Assessing juvenile chinook salmon behavior and entrainment risk near unscreened water diversions: large flume simulations. T. Am. Fish. Soc. 142, 130–142. doi: 10.1080/00028487.2012.720633
Nelson J. A., Atzori F., and Gastrich K. R. (2015). Repeatability and phenotypic plasticity of fish swimming performance across a gradient of urbanization. Environ. Biol. Fish. 98, 1431–1447. doi: 10.1007/s10641-014-0369-x
Nelson J. A. and Claireaux G. (2005). Sprint swimming performance of juvenile european sea bass. T. Am. Fish. Soc. 134, 1274–1284. doi: 10.1577/T04-087.1
Nelson J. A., Gotwalt P. S., Reidy S. P., and Webber D. M. (2002). Beyond Ucrit: matching swimming performance tests to the physiological ecology of the animal, including a new fish ‘drag strip.’. Comp. Biochem. Phys. A. 133, 289–302. doi: 10.1016/S1095-6433(02)00161-7
Nelson J. A., Gotwalt P. S., Simonetti C. A., and Snodgrass J. W. (2008). Environmental Correlates, Plasticity, and Repeatability of Differences in Performance among Blacknose Dace (Rhinichthys atratulus) Populations across a Gradient of Urbanization. Physiol. Biochem. Zool. 81, 25–42. doi: 10.1086/523304
Ojanguren A. F. and Branta F. (2000). Thermal dependence of swimming endurance in juvenile brown trout. J. Fish. Biol. 56, 1342–1347. doi: 10.1111/j.1095-8649.2000.tb02147.x
Osachoff H. L., Osachoff K. N., Wickramaratne A. E., Gunawardane E. K., Venturini F. P., and Kennedy C. J. (2014). Altered burst swimming in rainbow trout Oncorhynchus mykiss exposed to natural and synthetic oestrogens. J. Fish. Biol. 85, 210–227. doi: 10.1111/jfb.12403
Peake S. J. and Farrell A. P. (2004). Locomotory behaviour and post-exercise physiology in relation to swimming speed, gait transition and metabolism in free-swimming smallmouth bass(Micropterus dolomieu). J. Exp. Biol. 207, 1563–1575. doi: 10.1242/jeb.00927
Peake S., McKinley R. S., and Barth C. (1997). Effect of recovery parameters on critical swimming speed of juvenile rainbow trout (Oncorhynchus mykiss). Can. J. Zool. 75, 1724–1727. doi: 10.1139/z97-800
Poletto J. B., Cocherell D. E., Mussen T. D., Ercan A., Bandeh H., Kavvas M. L., et al. (2015). Fish-protection devices at unscreened water diversions can reduce entrainment: evidence from behavioural laboratory investigations. Conserv. Physiol. 3, cov040. doi: 10.1093/conphys/cov040
Pon L. B., Hinch S. G., Suski C. D., Patterson D. A., and Cooke S. J. (2012). The effectiveness of tissue biopsy as a means of assessing the physiological consequences of fishway passage. River. Res. Applic. 28, 1266–1274. doi: 10.1002/rra.1508
Reidy S. P., Kerr S. R., and Nelson J. A. (2000). Aerobic and anaerobic swimming performance of individual Atlantic cod. J. Exp. Biol. 203, 347–357. doi: 10.1242/jeb.203.2.347
Steel A. E., Nguyen T., Cocherell D. E., Carr K. J., Bell H., Peterson A., et al. (2022). Experimental evaluation of louver guidance efficiency for green sturgeon (Acipenser medirostris). River. Res. Applic. 38, 1609–1619. doi: 10.1002/rra.4032
Suski C. D., Killen S. S., Kieffer J. D., and Tufts B. L. (2006). The influence of environmental temperature and oxygen concentration on the recovery of largemouth bass from exercise: implications for live–release angling tournaments. J. Fish. Biol. 68, 120–136. doi: 10.1111/j.0022-1112.2006.00882.x
Trujillo J. E., Bouyoucos I., Rayment W. J., Domenici P., Planes S., Rummer J. L., et al. (2022). Escape response kinematics in two species of tropical sharks: short escape latencies and high turning performance. J. Exp. Biol. 225 (18), jeb166009. doi: 10.1242/jeb.243973
Tsvilling V., Donchin O., Shamir M., and Segev R. (2012). Archer fish fast hunting maneuver may be guided by directionally selective retinal ganglion cells. Eur. J. Neurosci. 35, 436–444. doi: 10.1111/j.1460-9568.2011.07971.x
Vandamm J. P., Marras S., Claireaux G., Handelsman C. A., and Nelson J. A. (2012). Acceleration performance of individual european sea bass dicentrarchus labrax measured with a sprint performance chamber: comparison with high-speed cinematography and correlates with ecological performance. Physiol. Biochem. Zool. 85, 704–717. doi: 10.1086/666463
Verhille C. E., English K. K., Cocherell D. E., Farrell A. P., and Fangue N. A. (2016). High thermal tolerance of a rainbow trout population near its southern range limit suggests local thermal adjustment. Conserv. Physiol. 4, 1–12. doi: 10.1093/conphys/cow057
Vogel S. (2008). Modes and scaling in aquatic locomotion. Integr. Comp. Biol. 48, 702–712. doi: 10.1093/icb/icn014
Wang Y. and Richards J. G. (2011). “Anaerobic metabolism in fish,” in Encyclopedia of Fish Physiology (Oxford: Elsevier), 129–135. doi: 10.1016/B978-0-323-90801-6.80025-7
Webb P. W. (1976). The effect of size on the fast-start performance of rainbow trout Salmo gairdneri, and a consideration of piscivorous predator-prey interactions. J. Exp. Biol. 65, 157–177. doi: 10.1242/jeb.65.1.157
Weihs D. (1973). The mechanism of rapid starting of slender fish1. BIR 10, 343–350. doi: 10.3233/BIR-1973-10308
Zhang Y., Claireaux G., Takle H., Jørgensen S. M., and Farrell A. P. (2018). A three-phase excess post-exercise oxygen consumption in Atlantic salmon Salmo salar and its response to exercise training. J. Fish. Biol. 92, 1385–1403. doi: 10.1111/jfb.13593
Zielinski D. P. and Freiburger C. (2021). Advances in fish passage in the Great Lakes basin. J. Great. Lakes. Res. 47, S439–S447. doi: 10.1016/j.jglr.2020.03.008
Zillig K. W. (2024). “Temperature and fish biology: Insights from metabolism,” in Encyclopedia of Fish Physiology (Oxford: Elsevier), 47–61. doi: 10.1016/B978-0-323-90801-6.00175-0
Zillig K. W., FitzGerald A. M., Lusardi R. A., Cocherell D. E., and Fangue N. A. (2023a). Intraspecific variation among Chinook Salmon populations indicates physiological adaptation to local environmental conditions. Conserv. Physiol. 11, coad044. doi: 10.1093/conphys/coad044
Zillig K. W., Lusardi R. A., Cocherell D. E., and Fangue N. A. (2023b). Interpopulation variation in thermal physiology among seasonal runs of Chinook salmon. Can. J. Fish. Aquat. Sci. 00, 1–13. doi: 10.1139/cjfas-2022-0133
Keywords: fast-start, rainbow trout, anaerobic and aerobic physiology, swimming performance, locomotion
Citation: Zillig KW, Fukumoto JA, McInturf AG, Burman SG, Steel AE, Cocherell DE and Fangue NA (2025) A laser-equipped chamber for the assessment of sprint swimming traits in fishes. Front. Ecol. Evol. 13:1659194. doi: 10.3389/fevo.2025.1659194
Received: 03 July 2025; Accepted: 15 August 2025;
Published: 02 September 2025; Corrected: 16 September 2025.
Edited by:
Nathan Wolf, Alaska Pacific University, United StatesReviewed by:
Edward Mager, University of North Texas, United StatesRachel Crawford, National Institute of Water and Atmospheric Research Ltd (NIWA), New Zealand
Copyright © 2025 Zillig, Fukumoto, McInturf, Burman, Steel, Cocherell and Fangue. This is an open-access article distributed under the terms of the Creative Commons Attribution License (CC BY). The use, distribution or reproduction in other forums is permitted, provided the original author(s) and the copyright owner(s) are credited and that the original publication in this journal is cited, in accordance with accepted academic practice. No use, distribution or reproduction is permitted which does not comply with these terms.
*Correspondence: Kenneth W. Zillig, a3ppbGxpZ0B1bW4uZWR1; Nann A. Fangue, bmFmYW5ndWVAdWNkYXZpcy5lZHU=