 Huaizhen Peng
 Huachao Lou2
- 1College of Landscape Architecture & Hunan Big Data Engineering Research Center of Natural Protected Areas Landscape Resources & Institute of Urban and Rural Landscape Ecology, Central South University of Forestry and Technology, Yuelushan Laboratory Carbon Sinks Forests Variety Innovation Center, Changsha, China
- 2Management Committee of Hangzhou Campus, Zhejiang Normal University, Jinhua, China
Introduction: Rapid urbanization has driven extensive land use changes, thereby undermining the stability and sustainability of ecosystems. This highlights the need for refined ecological zoning to strengthen environmental governance and spatial management in urban agglomerations.
Methods: This study uses the Changsha–Zhuzhou–Xiangtan urban agglomeration as a case study, a rapidly urbanizing region in central China that lies at the intersection of montane and lowland ecosystems, making it highly sensitive to both urbanization and climate-induced changes. It examines the spatiotemporal evolution of landscape ecological risk (LER) and the ecological health index (EHI) in response to land use changes from 2000 to 2020 and subsequently delineates ecological zoning. Furthermore, it simulates future land use changes under multiple scenarios for the period 2030–2050 to assess the dynamics of future zoning.
Results: From 2000 to 2020, forest remained the dominant land use, followed by cultivated land and construction land. During this period, 1,029.37 km² of cultivated land and 890.88 km² of forest were converted. The total converted area of cultivated land remained relatively stable across both phases. LER was primarily concentrated at medium and medium–low risk levels. The areas classified as low, medium–low, and medium risk decreased in both phases, with reductions of 784.24 km² in the early period and 3,266.91 km² in the later period. The EHI values declined from 0.555 in 2000 to 0.543 in 2010 and 0.518 in 2020. Forest, water body, and grassland all exhibited downward trends, while construction land showed the most pronounced decline, with a 22.15% reduction. Between 2000 and 2020, the spatial overlap between ecological zones and legally protected areas shifted notably. The ecological control zone transitioned 19,875 km² to the Strict ecological conservation zone and 18,175 km² to the ecological enhancement zone. Under future scenarios, the ecological control zone is projected to expand, with hotspots extending significantly and cold spots contracting slightly. By contrast, Ecological conservation zones are expected to shrink, with hotspots becoming more fragmented and cold spots declining more substantially.
Conclusions: This study offers a scientific foundation for ecological zoning management, supporting coordinated regeneration and the sustainable development of human–land systems in rapidly urbanizing regions.
1 Introduction
With the acceleration of global urbanization, China’s urbanization rate has risen from 36.2% in 2000 to 66.16% in 2023 (Xie et al., 2020). Under the combined pressures of urban expansion and suburban sprawl, regional land use patterns have undergone significant changes, adversely affecting the structure, functions, and processes of natural ecosystems. These impacts are reflected in heightened landscape ecological risks and declining ecosystem stability (Wu et al., 2024a). In the context of global climate change and intensified human activities, relying on a single ecological approach is insufficient to balance economic development with ecological conservation (Wu et al., 2020). Instead, a comprehensive approach that considers both external risk disturbances and internal ecosystem health is required to understand their interactions (Wang et al., 2023a). Ecological zoning, combined with differentiated functional assessments and targeted management strategies, is therefore critical for identifying ecological problems and promoting regional ecological sustainability (Li et al., 2024b).
Landscape Ecological Risk (LER) refers to the degree and uncertainty of disturbances to ecosystem structure, function, and processes caused by industrial development, climate change, and population growth (Gou et al., 2021). Its assessment aims to detect potential hazards and provide a spatially explicit representation of ecological risks (Wang et al., 2021). Common approaches include source–sink models and landscape pattern index analysis. The former captures the dynamics of risk sources, sinks, and exposure–response processes, but often oversimplifies ecosystem interactions and neglects the interdependence of structural and functional components (Wu et al., 2021). The latter evaluates ecosystem changes by examining the coupling between landscape patterns and ecological processes, effectively reflecting spatial integrity and complexity (Liu et al., 2020). However, a single landscape index rarely captures the full spectrum of risks, particularly those arising from interactions between natural, social, and ecological systems. To address this, integrated assessment frameworks that incorporate natural, socio-economic, and landscape dimensions have been proposed. For instance, Zhao (Zhao et al., 2022) developed a three-dimensional framework that integrates multi-source data to improve risk identification. Gao (Gao et al., 2021) and Lin (Lin and Wang., 2023) demonstrated that ecological risks are jointly driven by natural and anthropogenic factors across regions. Yan (Yan et al., 2021) confirmed the practical value of such integrated frameworks in ecological planning, conservation, and management.
Rising ecological risks accelerate the decline of ecosystem services and ecosystem health, posing challenges to regional sustainability (Sun et al., 2020). The Ecosystem Health Index (EHI), which reflects the stability of ecosystem structure and function, plays a critical role in guiding ecological restoration at regional scales (Du et al., 2023). Most studies adopt multi-indicator integration frameworks. Among them, the VOR model proposed by Costanza (Costanza et al., 1997) is widely used. Yet, given the complexity of ecosystems, health assessments must incorporate both natural and anthropogenic drivers. The VORS model, which accounts for human demand for ecosystem services, has thus been applied extensively to analyze ecosystem health and support sustainable development planning (Kesgin Atak and Ersoy Tonyaloğlu, 2020; Chen et al., 2020c; Chen et al., 2024a). For instance, Qing (Qing et al., 2024) and Lv (Lv et al., 2023) coupled human activity intensity with EHI and found that ecologically healthy areas are often highly sensitive to human disturbances. Further research has shown that ecosystem health is influenced by climate conditions, vegetation cover, landscape patterns, socio-economic development, and land use (Zhu and Cai, 2023; Lin et al., 2024a; Li et al., 2024a). At the regional scale, dominant drivers vary considerably. In Guizhou’s karst areas, socio-economic factors exert stronger impacts (Xu et al., 2017), while in urban cores, the expansion of construction land is the primary determinant (Han et al., 2024).
The composition, structure, and function of land use directly shape both LER and EHI. Existing research (UI Din and Mak, 2021; Bikis et al., 2025) demonstrates that construction land expansion increases ecological risks, especially in developing countries. Forest loss reduces carbon storage capacity, accelerates greenhouse gas emissions, and weakens resilience, thereby degrading ecosystem health. Consequently, analyzing the spatial coupling and interactive mechanisms between LER and EHI under varying land use patterns is essential. As a key tool for ecological governance, ecological zoning supports ecosystem service protection, degraded land restoration, and differentiated management strategies (Yang et al., 2024). Research on ecological zoning management has been extensive (Sadeghi et al., 2023; Xie et al., 2024; Wang et al., 2025; Lin et al., 2024b; Wang et al., 2024; Peng et al., 2025). For instance, Li (Li T, et al., 2020a) emphasized that ecological management should integrate resilience evolution, mechanisms, and assessments to strengthen socio-ecological resilience. Zhou (Zhou et al., 2025) and colleagues proposed the ESV–LER functional zoning system from the perspectives of human well-being and ecological security, providing references for improving ecological management efficiency. However, studies that integrate ecological risks with regeneration potential to forecast future conditions and formulate adaptive strategies remain scarce. Most are single-focused: Bao (Bao et al., 2022) and Zhao (Zhao et al., 2024) applied scenario simulations to explore future ecological risks and ecosystem health, while Wang (Wang et al., 2022a) suggested optimizing land use structures from a risk perspective to enhance carrying capacity and reduce ecological deficits. Against this backdrop, predicting future land use patterns under the combined influences of human activity and climate change, assessing their impacts on LER and EHI, and constructing forward-looking ecological zoning frameworks are critical for setting conservation priorities and guiding ecological management.
The Changsha-Zhuzhou-Xiangtan Urban Agglomeration (CZXUA), a core region of China’s integrated urban development strategy, experienced rapid urbanization, rising from 40.30% in 2000 to 78.00% in 2022—well above the national average. Compared with other major urban clusters such as Beijing–Tianjin–Hebei, the Yangtze River Delta, and the Pearl River Delta, the CZXUA exhibits a “central-radial plus clustered” spatial structure. Its unique landscape, characterized by interlaced hills, rivers, and lakes, has been heavily affected by urban expansion, leading to losses of cultivated land, forest, and wetlands. This has intensified landscape fragmentation, reduced ecosystem recovery capacity, and created a highly heterogeneous ecological risk pattern. Such complexity highlights the limitations of single-dimensional ecological assessments and underscores the need for integrated approaches. Therefore, this study takes the CZXUA as its research area, delineates ecological zones using LER and EHI as indicators, and constructs an ecological zoning framework for land use simulation under SSP–RCPs scenarios. The aim is to analyze the evolution trends of ecological zoning within the region’s dynamic development, thereby enhancing regional risk defense and service provision capabilities and promoting the coordinated development of human-land relations. The specific objectives of this study are to: (1) examine the spatiotemporal variation of LER and EHI from 2000 to 2020; (2) delineating ecological zones based on the coupling relationship between LER and EHI; and (3) predict the evolution of ecological zones in 2030, 2040, and 2050 under different SSP–RCP scenarios, and provide practical recommendations for future regional development.
2 Materials and methods
2.1 Study area
The Changsha–Zhuzhou–Xiangtan Urban Agglomeration (CZXUA) is located in central China (26°03′N–28°40′N, 111°53′E–114°15′E) and functions as the core growth pole of economic development and urbanization in Hunan Province. It covers an area of approximately 28,000 km². By 2023, the total population had reached 17.07 million, with a regional GDP of 2.07 trillion yuan, accounting for more than 40% of the provincial total. The region is characterized by complex topography dominated by hills and basins, forming a spatial structure of “one core, two sub-centers, and a green heart.” Changsha serves as the primary core, Zhuzhou and Xiangtan act as secondary cores, and the ecological green heart lies at their convergence (Figure 1). Mountainous areas are primarily distributed in the west and southeast, where the Luoxiao–Mufu mountain range forms a critical ecological barrier. Legally protected areas are mainly concentrated in You, Chaling, Yanling, Liuyang, and Xiangxiang, with a total coverage of 3,392.89 km², representing 12.12% of the region. The Special Ecological Protection Zone (green heart) spans 529.79 km². Despite rapid economic growth, urbanization, and industrialization, the region has experienced severe ecological disturbances, including cadmium pollution in Liuyang (2009), thallium pollution in the Xiang River in Hengyang (2020), and thallium pollution in the Leishui River basin (2025). These events underscore the vulnerability of the regional ecosystem and highlight the necessity of advancing ecological zoning research.
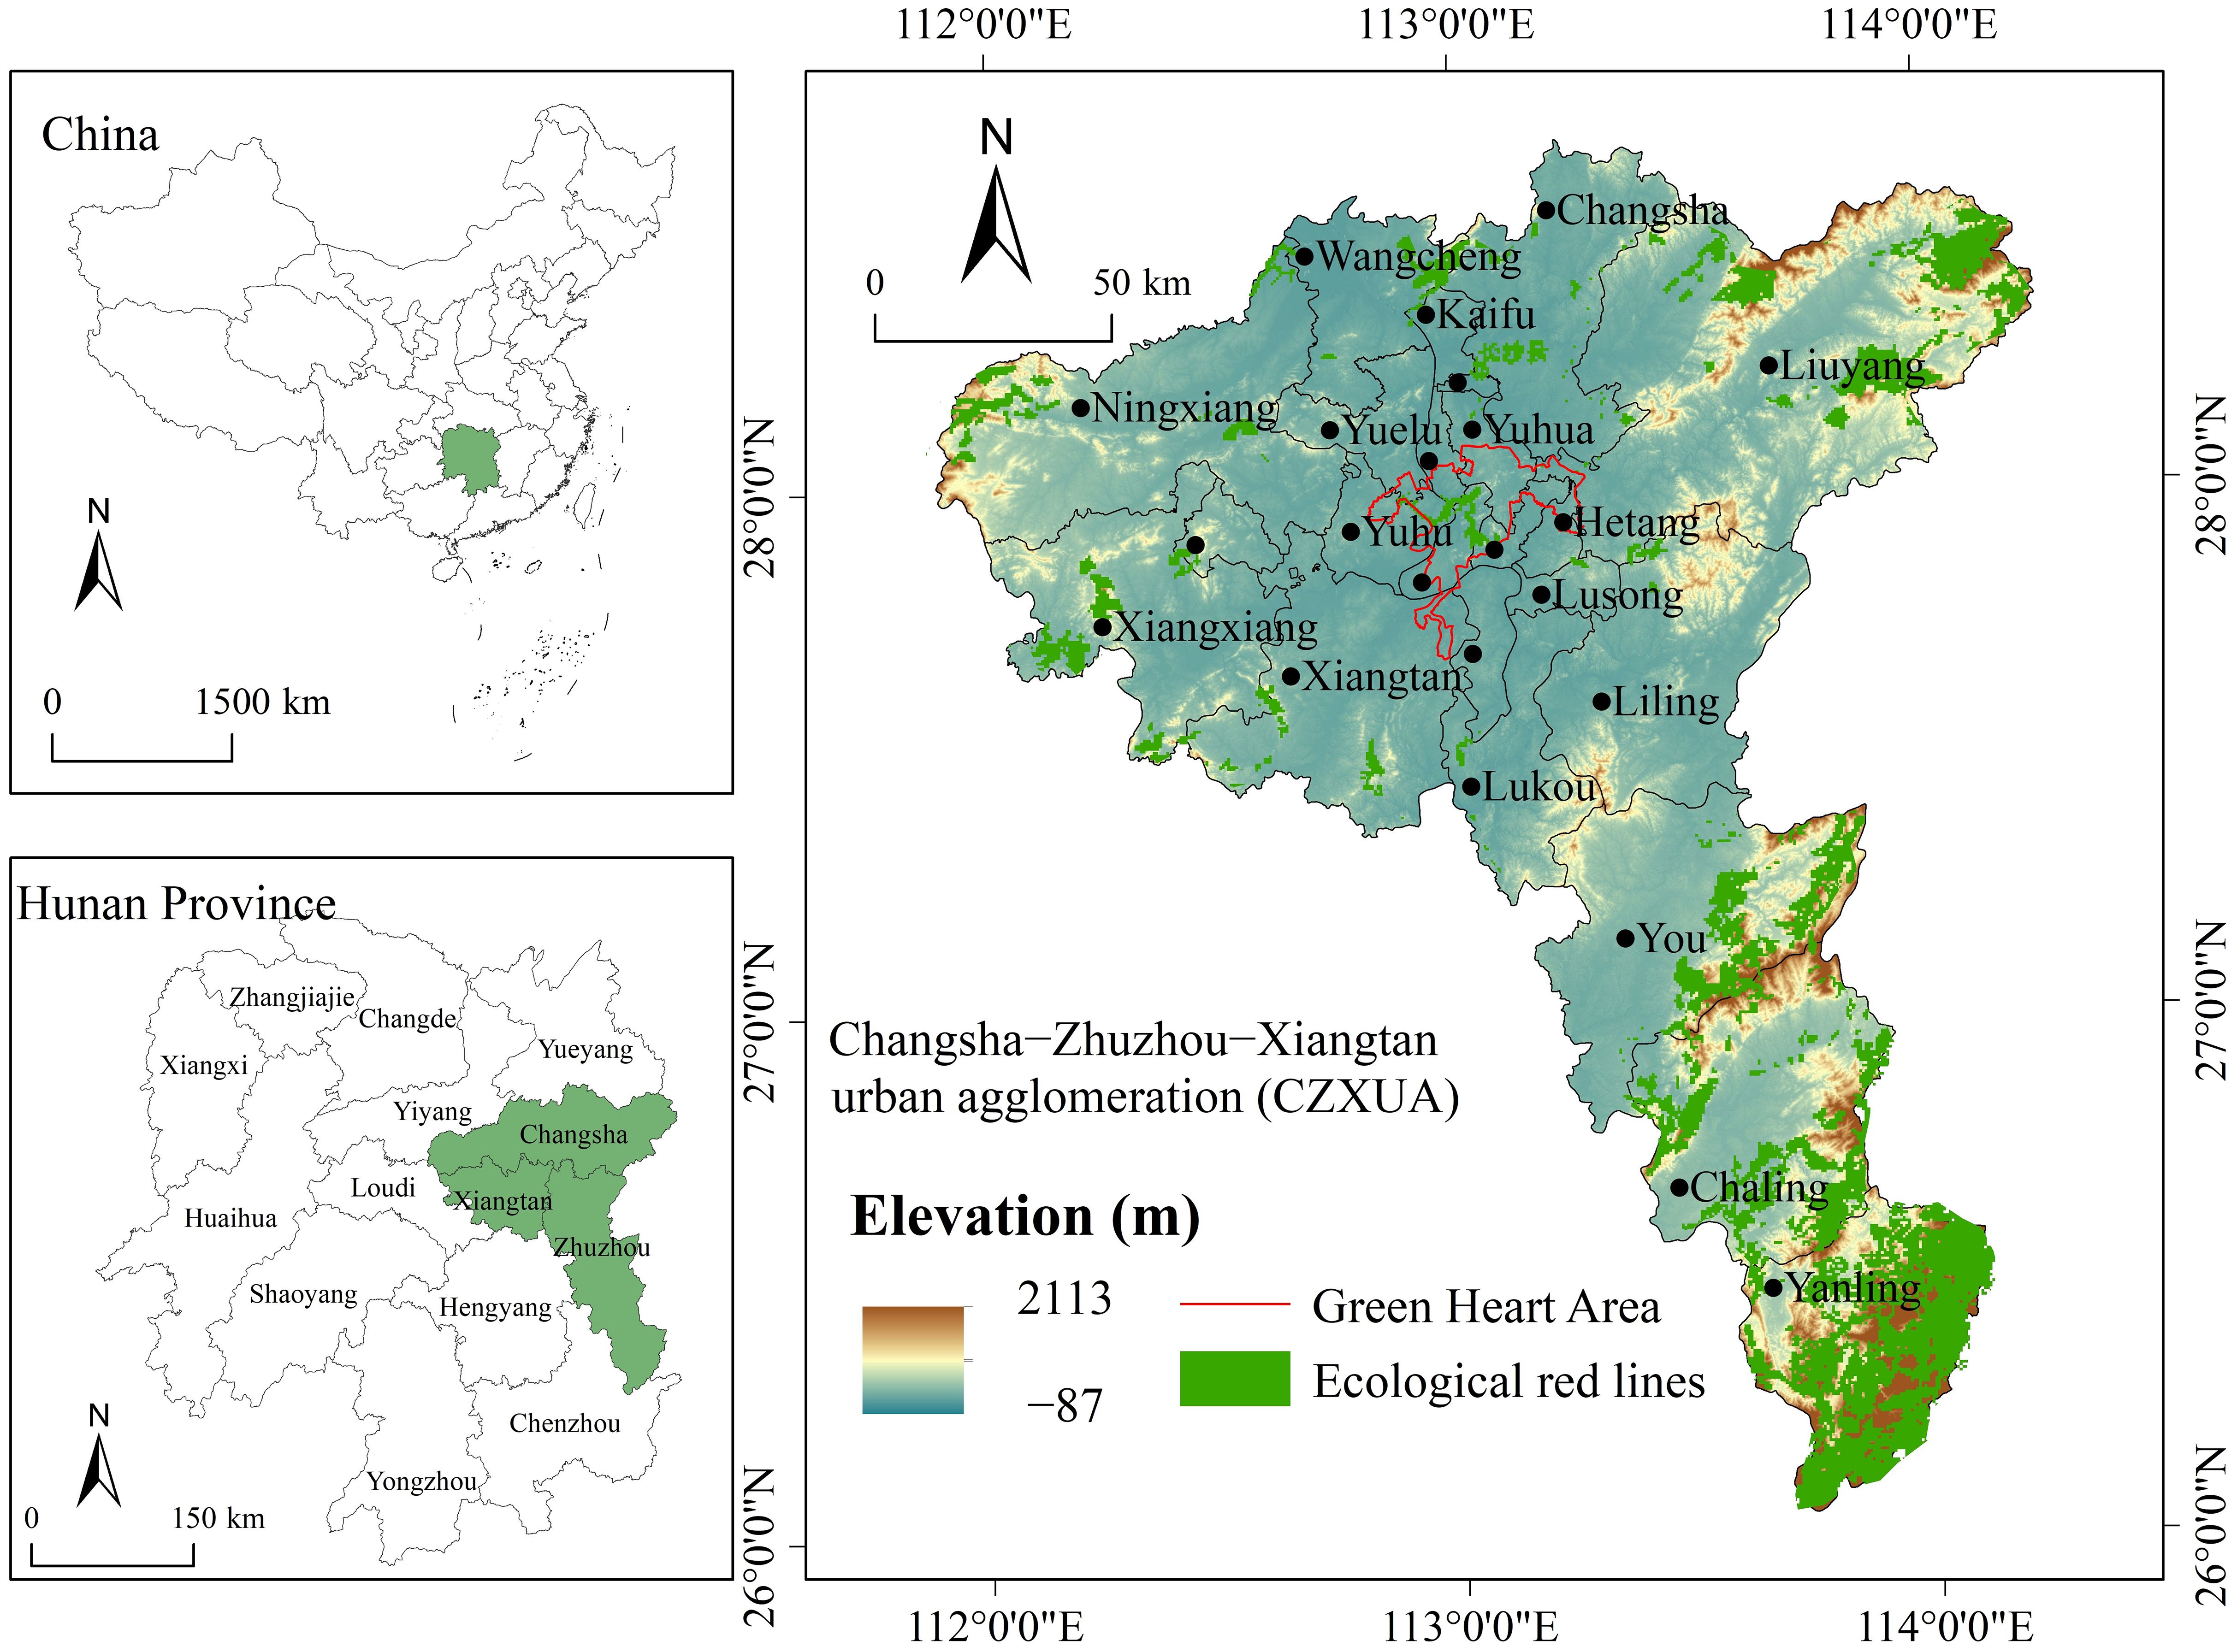
Figure 1. Location and elevation of the Changsha–Zhuzhou–Xiangtan urban agglomeration (CZXUA) in Hunan Province, China.
2.2 Data sources and pre-processing
This study employed a multidimensional dataset encompassing land use, socioeconomic, climatic, and ecological variables (Table 1). The core variables include land use (2000, 2010, 2020), GDP, population, precipitation, temperature, vegetation cover, PM2.5, land surface temperature, soil type, nighttime light, net primary productivity (NPP), and NDVI. To ensure spatial consistency, all raster data were projected to the WGS-1984-UTM-49N coordinate system. Vector data (e.g., transportation networks) were rasterized to match raster resolution. For datasets with varying resolutions, bilinear or nearest-neighbor interpolation was applied to unify the resolution at 50 m. Missing or anomalous values were corrected using the mode of surrounding raster cells or the mean of adjacent cells. The years 2000 and 2010 were used as baseline data for model construction, and 2020 land use data were employed for validation. Model performance was evaluated using Overall accuracy and the Kappa coefficient. Sensitivity analysis was conducted by adjusting neighborhood weights and system parameters to enhance model robustness.
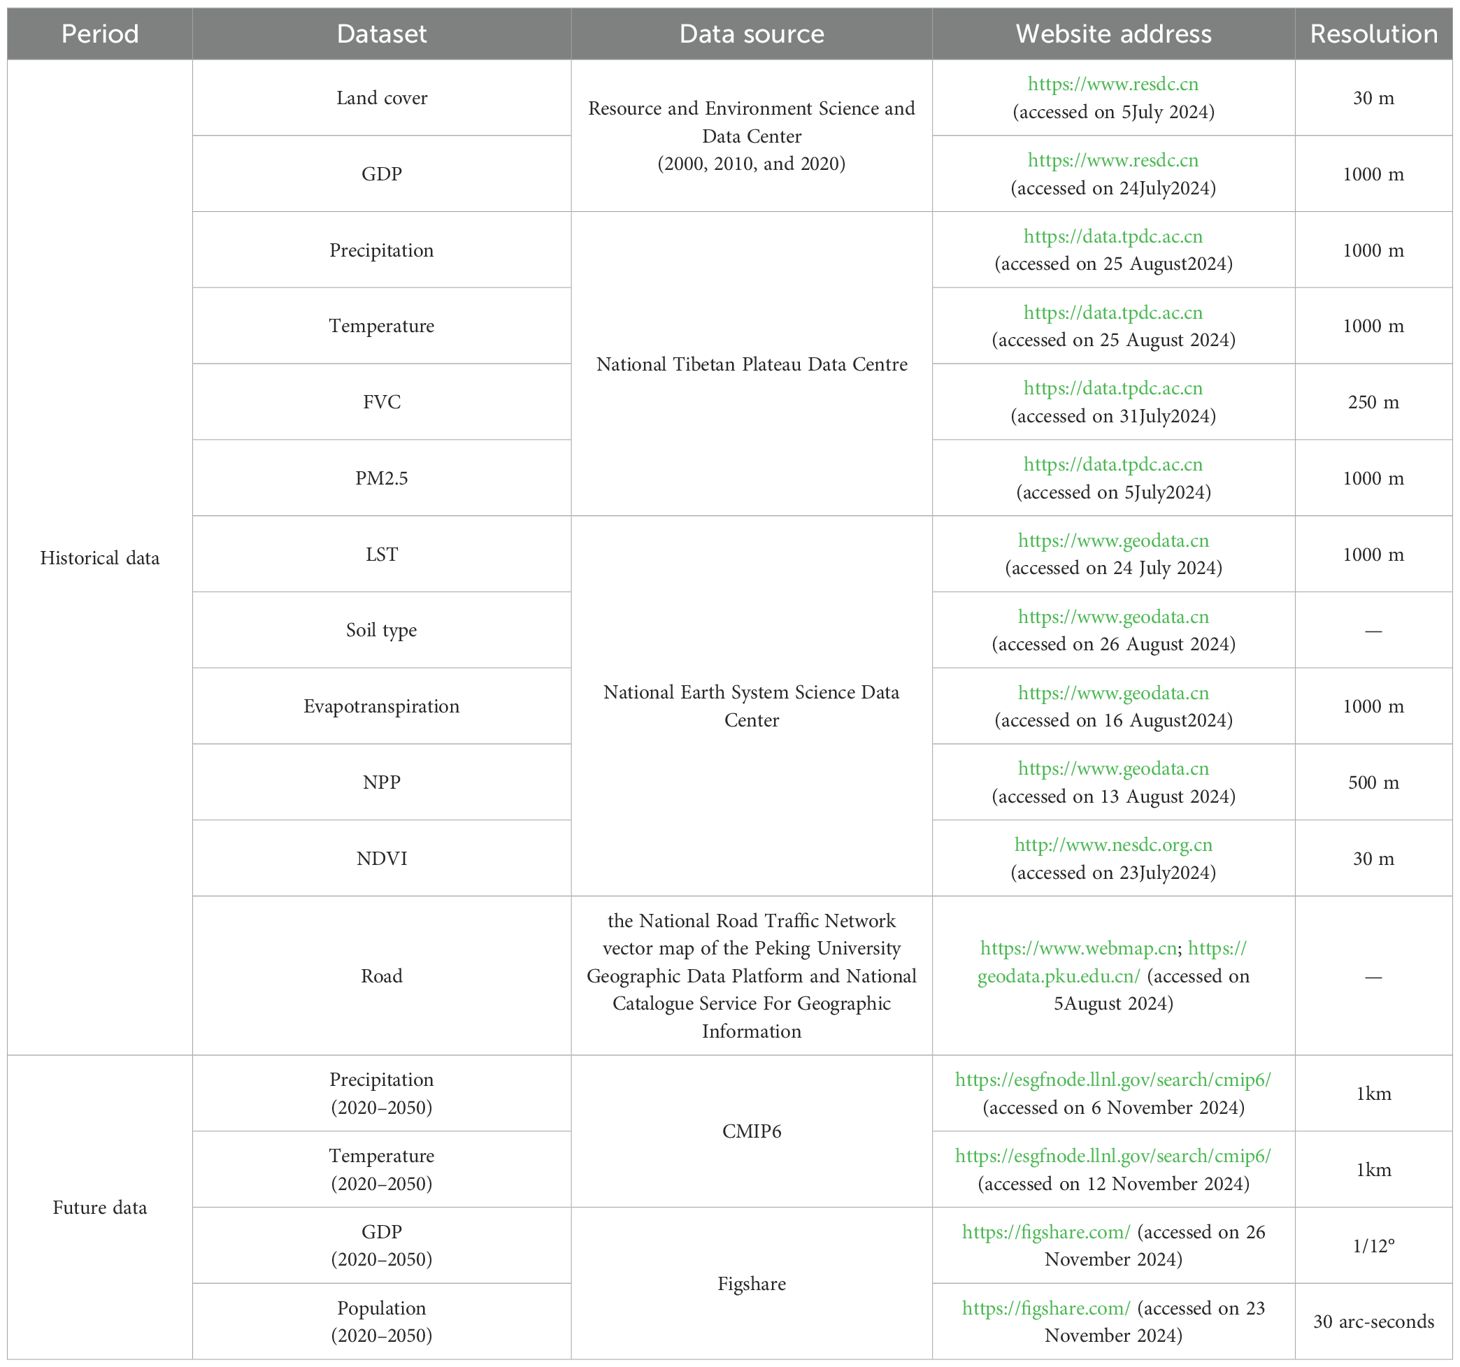
Table 1. Data and materials.
2.3 Methods
This study selects indicators from four dimensions—geographical foundations, landscape patterns, human activities, and natural disasters—to construct an ecological risk assessment system. The Analytic Hierarchy Process (AHP) and the Standard Correlation Weight Analysis Method (CRITIC) are employed to determine the weights of each indicator, thereby constructing an ecological risk assessment system to comprehensively evaluate Landscape Ecological Risk (LER). To assess the Ecosystem Health Index (EHI), a VORS model is established, incorporating vitality (EV), organization (EO), resilience (ER), and ecosystem services (ES). Based on this framework, Z-score standardization is applied to analyze the spatiotemporal evolution of ecological zoning for the years 2000, 2010, and 2020. Using 2020 land use data, an SD-PLUS model is developed by integrating natural, population, meteorological, and economic variables to simulate land use distribution under multiple scenarios for 2030, 2040, and 2050. LER and EHI values are then calculated for each scenario, and the corresponding ecological zoning patterns are analyzed. Finally, based on the historical evolution and projected future trends of ecological zoning, targeted zoning strategies and optimization recommendations are proposed to support sustainable management and high-quality ecological development. The overall workflow of this study is shown in Figure 2.
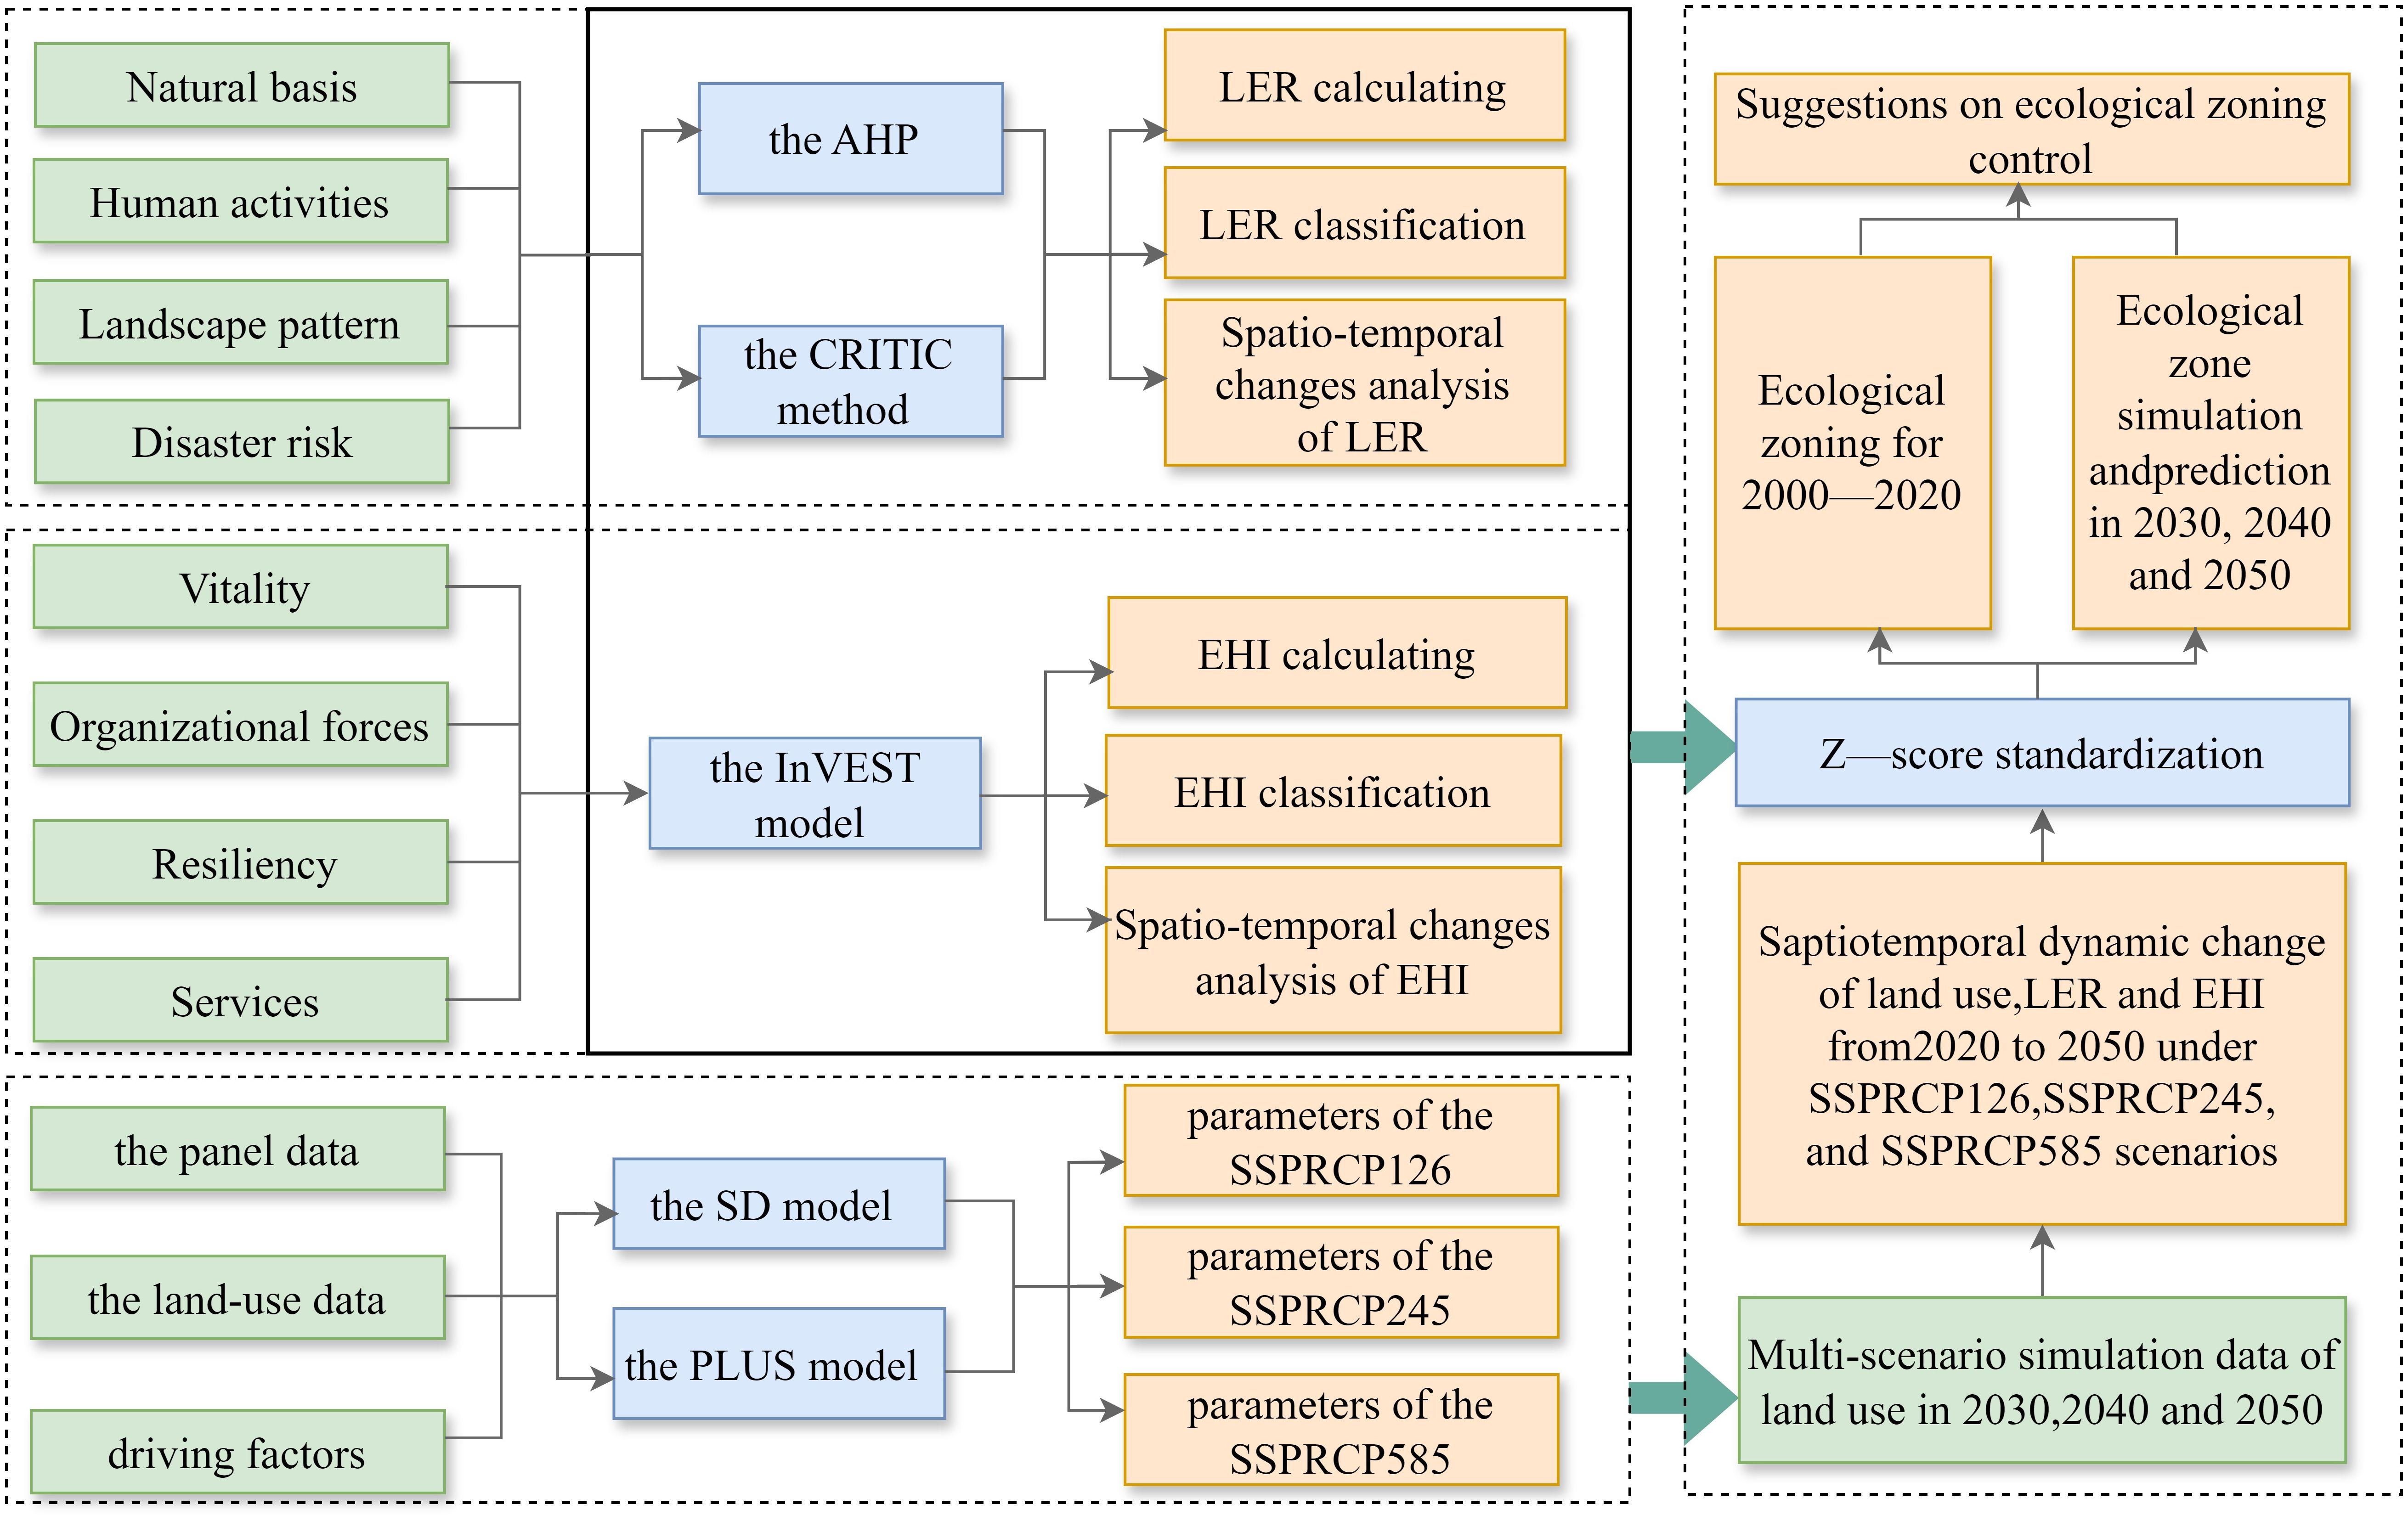
Figure 2. The workflow of this study.
2.3.1 Landscape ecological risk assessment
Urban agglomerations are typical compound systems integrating nature, society, and economy, facing the interactive impacts of multidimensional driving factors. Their ecological risks are characterized by multiple sources of input, exposure diffusion, and complex disturbance mechanisms (Babí, 2023). This study follows the principles of systematics, quantifiability, and relevance to ecological processes. It constructs an indicator system from the dual perspectives of natural constraints and human activity disturbances, comprising four categories of elements: geographical foundation, landscape pattern, human activities, and natural disasters. This forms an information-closed network of “natural foundation constraints–landscape functional responses–anthropogenic disturbance pressures–disaster risk feedbacks,” which is used to delineate the spatial differentiation characteristics of landscape ecological risk.
In the geographical foundation elements, topographic position index, terrain relief, and soil type are selected to represent the terrain stability and soil foundation conditions of ecosystems. The topographic position index and terrain relief can reflect the potential risks of erosion and geological disasters (Li et al., 2020c), while soil type influences habitat quality and ecosystem regulation capacity through its carbon sequestration ability and resistance to erosion. In the landscape pattern elements, the landscape disturbance index, NDVI, Shannon’s diversity index, and contagion index are chosen to reflect the structural stability of the system. The former indicates the degree of landscape disturbance (commonly calculated using patch density, landscape division index, and landscape separation index), while the latter three respectively reflect the extent of vegetation coverage, landscape heterogeneity, and integrity, all of which are negatively correlated with landscape ecological risk (Yan et al., 2021). The human activity elements cover population aggregation pressure, economic pressure (GDP), air pollution pressure (PM2.5), energy consumption pressure (nighttime light intensity), transportation network pressure, and land use pressure, which collectively depict the ecological stress caused by urbanization. These dynamic factors directly reflect environmental pollution, infrastructure load, and fragmentation of the ecological base (Mentaschi et al., 2022). In the natural disaster elements, geological disasters, rainstorm flooding, and land surface thermal environment are selected to characterize the system’s threshold for collapse. Geological disasters describe the risks of extreme climate events such as landslides and debris flows, rainstorm flooding reflects the risk of flooding caused by extreme precipitation, and the land surface thermal environment reveals the urban heat island effect, with higher land surface temperatures indicating potential ecological risks (Jing et al., 2021).
To eliminate the dimensional effects of different indicators, all indicators are processed using range standardization, with a value range of [0,1] (Table 2). In the weight assignment, the final weights of the indicators are derived by averaging the Analytic Hierarchy Process (AHP) and the Standard Correlation Weight Analysis Method (CRITIC) methods (Zhang et al., 2023b). AHP constructs a judgment matrix based on pairwise comparisons, calculates the weight vector, and passes the consistency test (CR = 0.0516, meeting the standard CR< 0.1); CRITIC objectively assigns weights based on the standard deviation and Pearson correlation coefficient matrix. The combination of these two methods effectively reduces subjective intervention, enhances the scientific and rational nature of indicator weighting, and thereby improves the reliability and explanatory power of the ecological risk assessment.
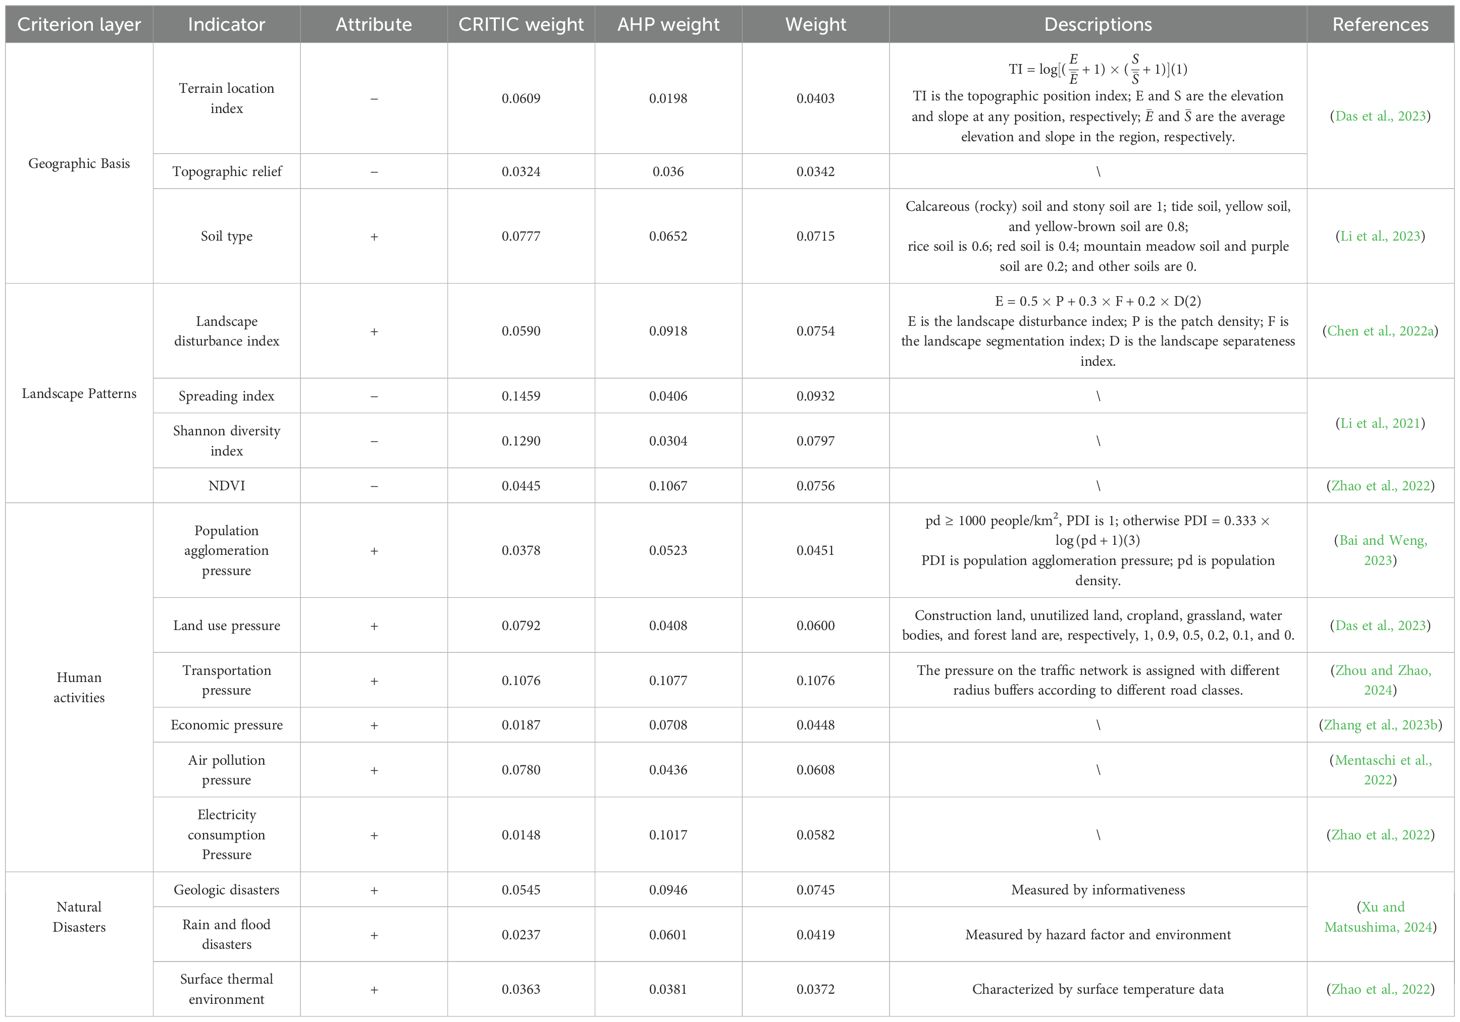
Table 2. Integrated ecological risk assessment system.
2.3.2 Ecological health assessment
The study refers to the improved ecosystem health assessment model (Peng et al., 2011) and combines the assessment of ecosystem service functions to evaluate the ecosystem health level of the study area (Equations 4-5).
Where: EHI represents Ecosystem Health Index; PH represents the health of ecosystem structure and organization; ESV represents Ecosystem Service Value, which includes carbon sequestration, habitat quality, water retention, and soil conservation services. These services are calculated using the InVEST 3.14 model, normalized, and then summed to obtain the overall ecosystem service value (Tian et al., 2021). EV, EO, and ER represent the vitality, organization, and resilience of the ecosystem, respectively.
Vitality is the metabolism or primary productivity of the ecosystem, characterized by Net Primary Productivity (NPP) as an indicator of ecosystem vitality. Organization force is the quantity and diversity of interactions among various components of the ecosystem, evaluated using Landscape Heterogeneity (LH), Landscape Connectivity (LC), and Landscape Morphology (IPC) (Equation 6).
Where: SHDI is the Shannon Diversity Index; AMPFD is the Area-Weighted Mean Patch Fractal Dimension; PD is the Patch Density; CONTAG is the Contagion Index; PD1 and PD2 are the patch densities of water bodies and forest landscapes, respectively. COHESION1 and COHESION2 are the contagion indices of water bodies and forest landscapes, respectively.
Resilience is the ability of an ecosystem to maintain its functions and structures in the face of external risk disturbances (Jiang et al., 2024). The study sets a resilience coefficient based on the difficulty of recovery for different land use types, and represents the ecosystem’s resilience as the weighted sum of the areas of each land use type and their respective ecological recovery coefficients (Equation 7) (Lei et al., 2023).
Where: ER represents the Ecosystem Resilience; A represents the total area of land use; Ai represents the area of the i type of land use. represents the ecological recovery coefficient of the i type of land use. The ecological recovery coefficients for cultivated land, forest, grassland, waterbody, construction land, and bare land are 0.3, 0.8, 0.6, 0.8, 0.2, and 1, respectively (Pan et al., 2021).
2.3.3 Ecological zoning
Z-score standardization transforms data with different units and scales into a standard normal distribution, effectively eliminating dimensional disparities among indicators and improving their comparability (Wu et al., 2022). In this study, Z-score standardization is used to construct a two-dimensional coordinate system, with LER on the vertical axis and EHI on the horizontal axis. Based on this framework, the study area is divided into four ecological zones: Strict Ecological Protection Zone (High risk, High health): Ecosystems with high functions but under significant external stress. These areas require enhanced ecological protection and risk control; Ecological Control Zone (High risk, Low health): Fragile ecosystems with high-risk exposure, which are priority intervention and key control areas; Ecological Conservation Zone (Low risk, High health): Areas with stable ecosystem functions and low risk exposure. These zones should be preserved to maintain ecological stability; Ecological Enhancement Zone (Low risk, Low health): Degraded ecosystems with low external pressure but high potential for restoration, representing key areas for ecological improvement. This zoning approach captures the interaction between ecological conditions and risk disturbances, highlights spatial heterogeneity, and provides a scientific basis for differentiated ecological management and targeted conservation policies. The Z-score standardization calculation formula is (Equations 8-10).
where, represents the value of LER or EHI for each grid cell; represents the average value of LER or EHI for the entire study area; s represents the standard deviation of LER or EHI for the entire study area; n represents the total number of grid cells.
2.3.4 Scenario design based on CMIP6
The Coupled Model Intercomparison Project Phase 6 (CMIP6) recommends the use of Shared Socioeconomic Pathways (SSPs) and Representative Concentration Pathways (RCPs) to simulate the combined effects of socio-economic and climatic changes on land use patterns (Chen et al., 2020a; Riahi et al., 2017; van Vuuren et al., 2011). This study adopted three SSP–RCP scenarios—SSP126, SSP245, and SSP585—to explore potential trajectories of socioeconomic development and climate change and to analyze the spatiotemporal evolution of ecosystems under multiple futures. SSP126 represents a low-emission sustainable development pathway, assuming slow population growth, coordinated economic–environmental development, and limited climate change. SSP245 represents a medium-emission pathway, assuming moderate population growth, economic expansion, and climate change, consistent with current trends. SSP585 represents a high-emission pathway, assuming rapid population growth, intensified industrialization, high energy dependence, and strong warming with precipitation variability. The SSP–RCP combinations incorporate four drivers: population, GDP, precipitation, and temperature. GDP projections are derived from global SSP datasets (Murakami et al., 2021). Population data are obtained from China’s kilometer-scale grid dataset (Chen et al., 2020b). Climate variables (precipitation and temperature) are based on future kilometer-scale climate grids for China under SSP–RCP pathways (Chen and Ning, 2024b). The analysis was conducted at a high-resolution grid scale. Land use policies and management practices were assumed constant, while short-term shocks from sudden socioeconomic or extreme climate events were excluded. Based on these assumptions, multiple future development trajectories were constructed to support land use simulations and ecosystem response assessments (Table 3).
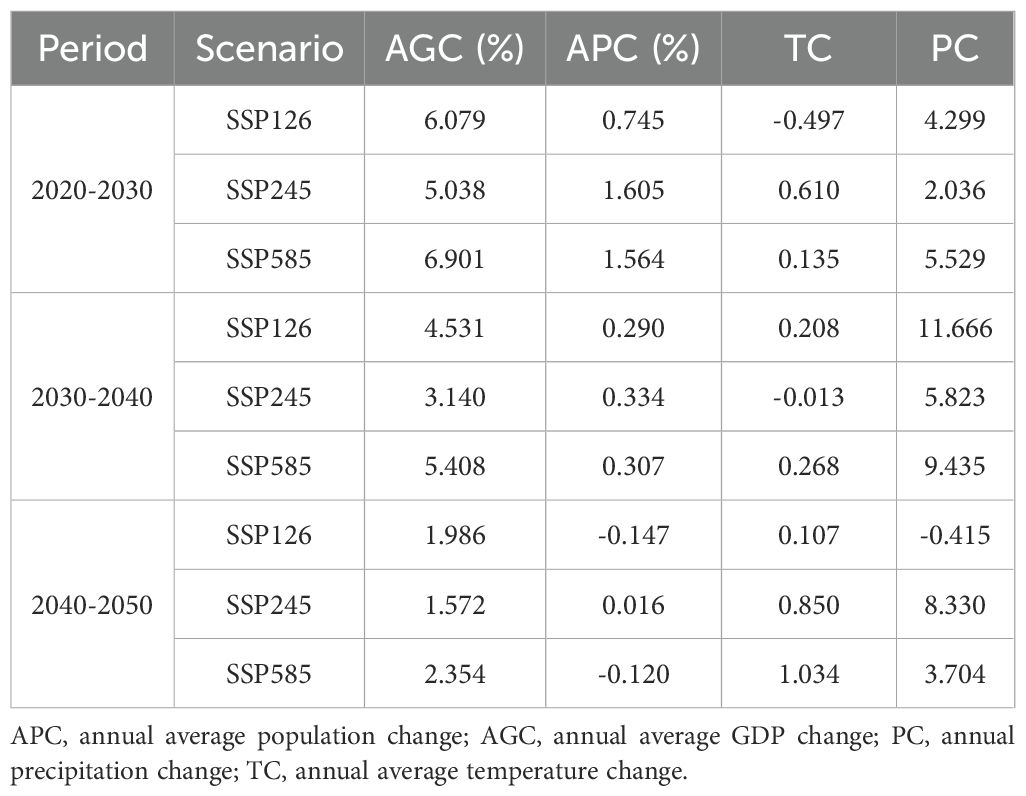
Table 3. Variable setting indifferent climate scenarios during 2020–2050.
2.3.5 SD model
Among simulation models, the Markov model effectively predicts changes in land use quantity and spatial distribution (Tan et al., 2019), while system dynamics (SD) models are particularly suitable for capturing system complexity, nonlinear interactions, and temporal evolution, offering strong support for scenario analysis and decision-making (Wang et al., 2022b).The System Dynamics (SD) model is used to capture the nonlinear relationships between socio-economic development and land use change by representing causal feedback mechanisms among multiple driving factors (Song et al., 2024). It includes four key subsystems: economic, population, climate, and land use (Figure 3). The economic subsystem simulates the influence of infrastructure investment on the expansion of construction land, which in turn reduces ecological land. The population subsystem reflects changes in urban-rural migration and associated consumption demands. The climate subsystem captures the direct effects of temperature and precipitation changes on habitat quality and ecosystem stability. The land use subsystem integrates feedback from population and economic growth, driving the conversion among different land use. Based on the dynamics of land use transformation, a system dynamics model was developed using Vensim PLE x64. The simulation spans from 2000 to 2050, with a one-year time step. The period from 2000 to 2020 is used for historical simulation and model calibration. Simulation results show that the average relative error between simulated and actual land use values is less than 2%. The SD model demonstrates high accuracy in reproducing land use change and is suitable for forecasting future land use demand. Ultimately, the model is driven by population, climate, and GDP scenario data for the period 2021–2050 to derive future land use demands under different scenarios.
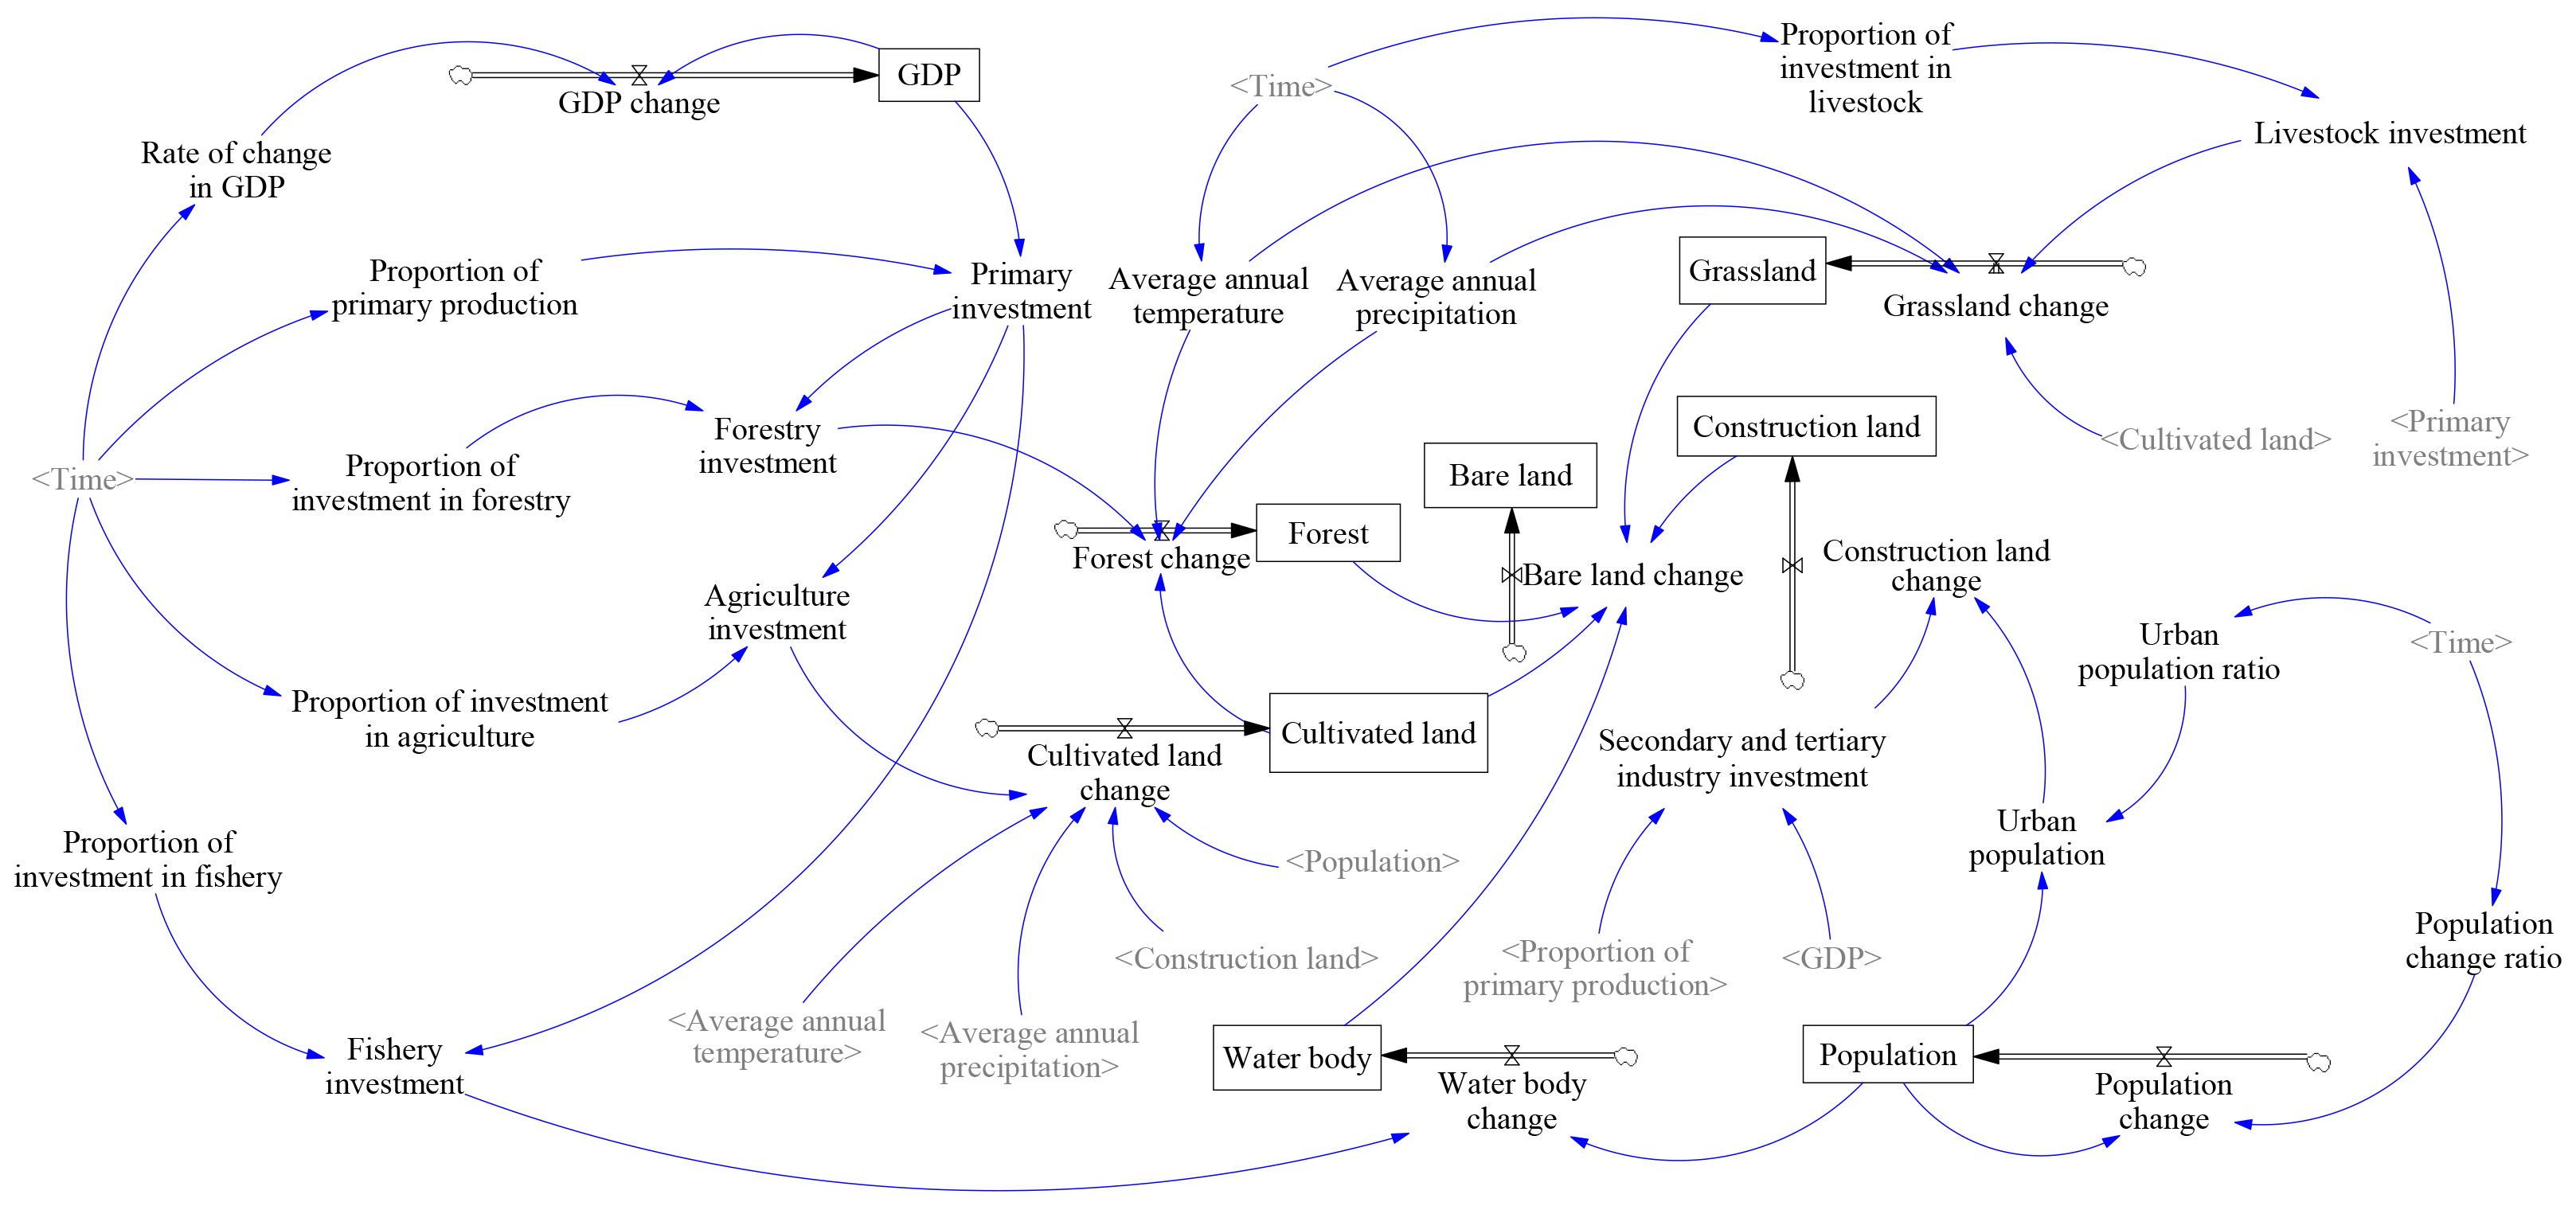
Figure 3. The causal feedback loops diagram of the system dynamics model for LUCC under the joint influence of socio-economic and environmental factors. The factors inside the box represent state variables (e.g., GDP, population, and land types), while the flow tools represent rate variables (e.g., population growth rate, GDP growth rate). The terms in parentheses refer to auxiliary variables (e.g., forestry investment, fisheries investment) or shadow variables (e.g., time), and the arrows indicate causal relationships between the variables.
2.3.6 PLUS model
Compared with traditional models such as CA–Markov, CLUE-S, and FLUS, the Patch-generating Land Use Simulation (PLUS) model—enhanced with a Random Forest algorithm—demonstrates superior explanatory power and spatial accuracy in modeling land use drivers, making it highly applicable to ecological zoning in complex regions (Liang et al., 2021). The Patch-generating Land Use Simulation (PLUS) model consists of two integrated sub-modules. The first is the rule-mining module based on the Land Expansion Analysis Strategy (LEAS), which identifies the relationships between land use changes and driving factors. This module uses land use data from two time points and applies the Random Forest algorithm to extract the influence of each driving factor on land use transitions, thereby estimating the probability of expansion for different land uses. The second module is the Cellular Automata simulation module, driven by the Cellular Automata Random Seeds (CARS) algorithm. It integrates pixel-based neighborhood weights, land use transition matrices, and patch generation rules to simulate future land use patterns. This approach enables the spontaneous emergence and expansion of land use patches under spatiotemporal dynamics. This study incorporates land use demand predictions from the SD model and applies four categories of driving factors in the PLUS model: Natural environmental factors: elevation (DEM), slope, soil type, NDVI; Socio-economic factors: nighttime light (NTL), population (POP), GDP; Transportation factors: distances to residential areas, government seats, highways (national, provincial, expressway, county), railways, and subway/light rail lines; Climate factors: evapotranspiration, annual average precipitation, and temperature. These variables are used to spatially allocate land use demand under different future scenarios. Model accuracy was evaluated using the Kappa coefficient, Overall accuracy, and the Figure of Merit (FoM), while Moran’s I index was applied to assess the robustness of spatial predictions.
3 Results
3.1 Ecological zoning construction
3.1.1 Spatial and temporal distribution of land use
Throughout 2000, 2010, and 2020, forest remained the dominant land use, covering 63.79%, 62.99%, and 62.28% of the study area, respectively, followed by cultivated land and construction land (Figures 4a–c). Cultivated land, forest, and grassland showed gradual declines, with cultivated land experiencing the largest reduction (7.45%). Construction land expanded markedly (60.20%), primarily around core urban areas, reflecting rapid urbanization and infrastructure development. Grassland area decreased by 3.20%, indicating moderate disturbance to natural ecosystems. Although the overall changes in grassland and bare land were relatively limited, the proportion of bare land increased significantly by 42.72%, likely due to intensified construction activities and expanded engineering land use. From 2000 to 2020, substantial land use conversions occurred within the study area, with cultivated land experiencing the most pronounced transformation. The cumulative area converted from cultivated land reached 1,029.37 km², primarily into construction land (555.65 km²) and forest (394.97 km²). Forest also exhibited considerable conversion, with a cumulative loss of 890.88 km², mainly transformed into construction land (466.22 km²) and cultivated land (362.87 km²). Other land use categories underwent relatively minor conversions (less than 100 km²), exerting limited influence on the overall spatial pattern.
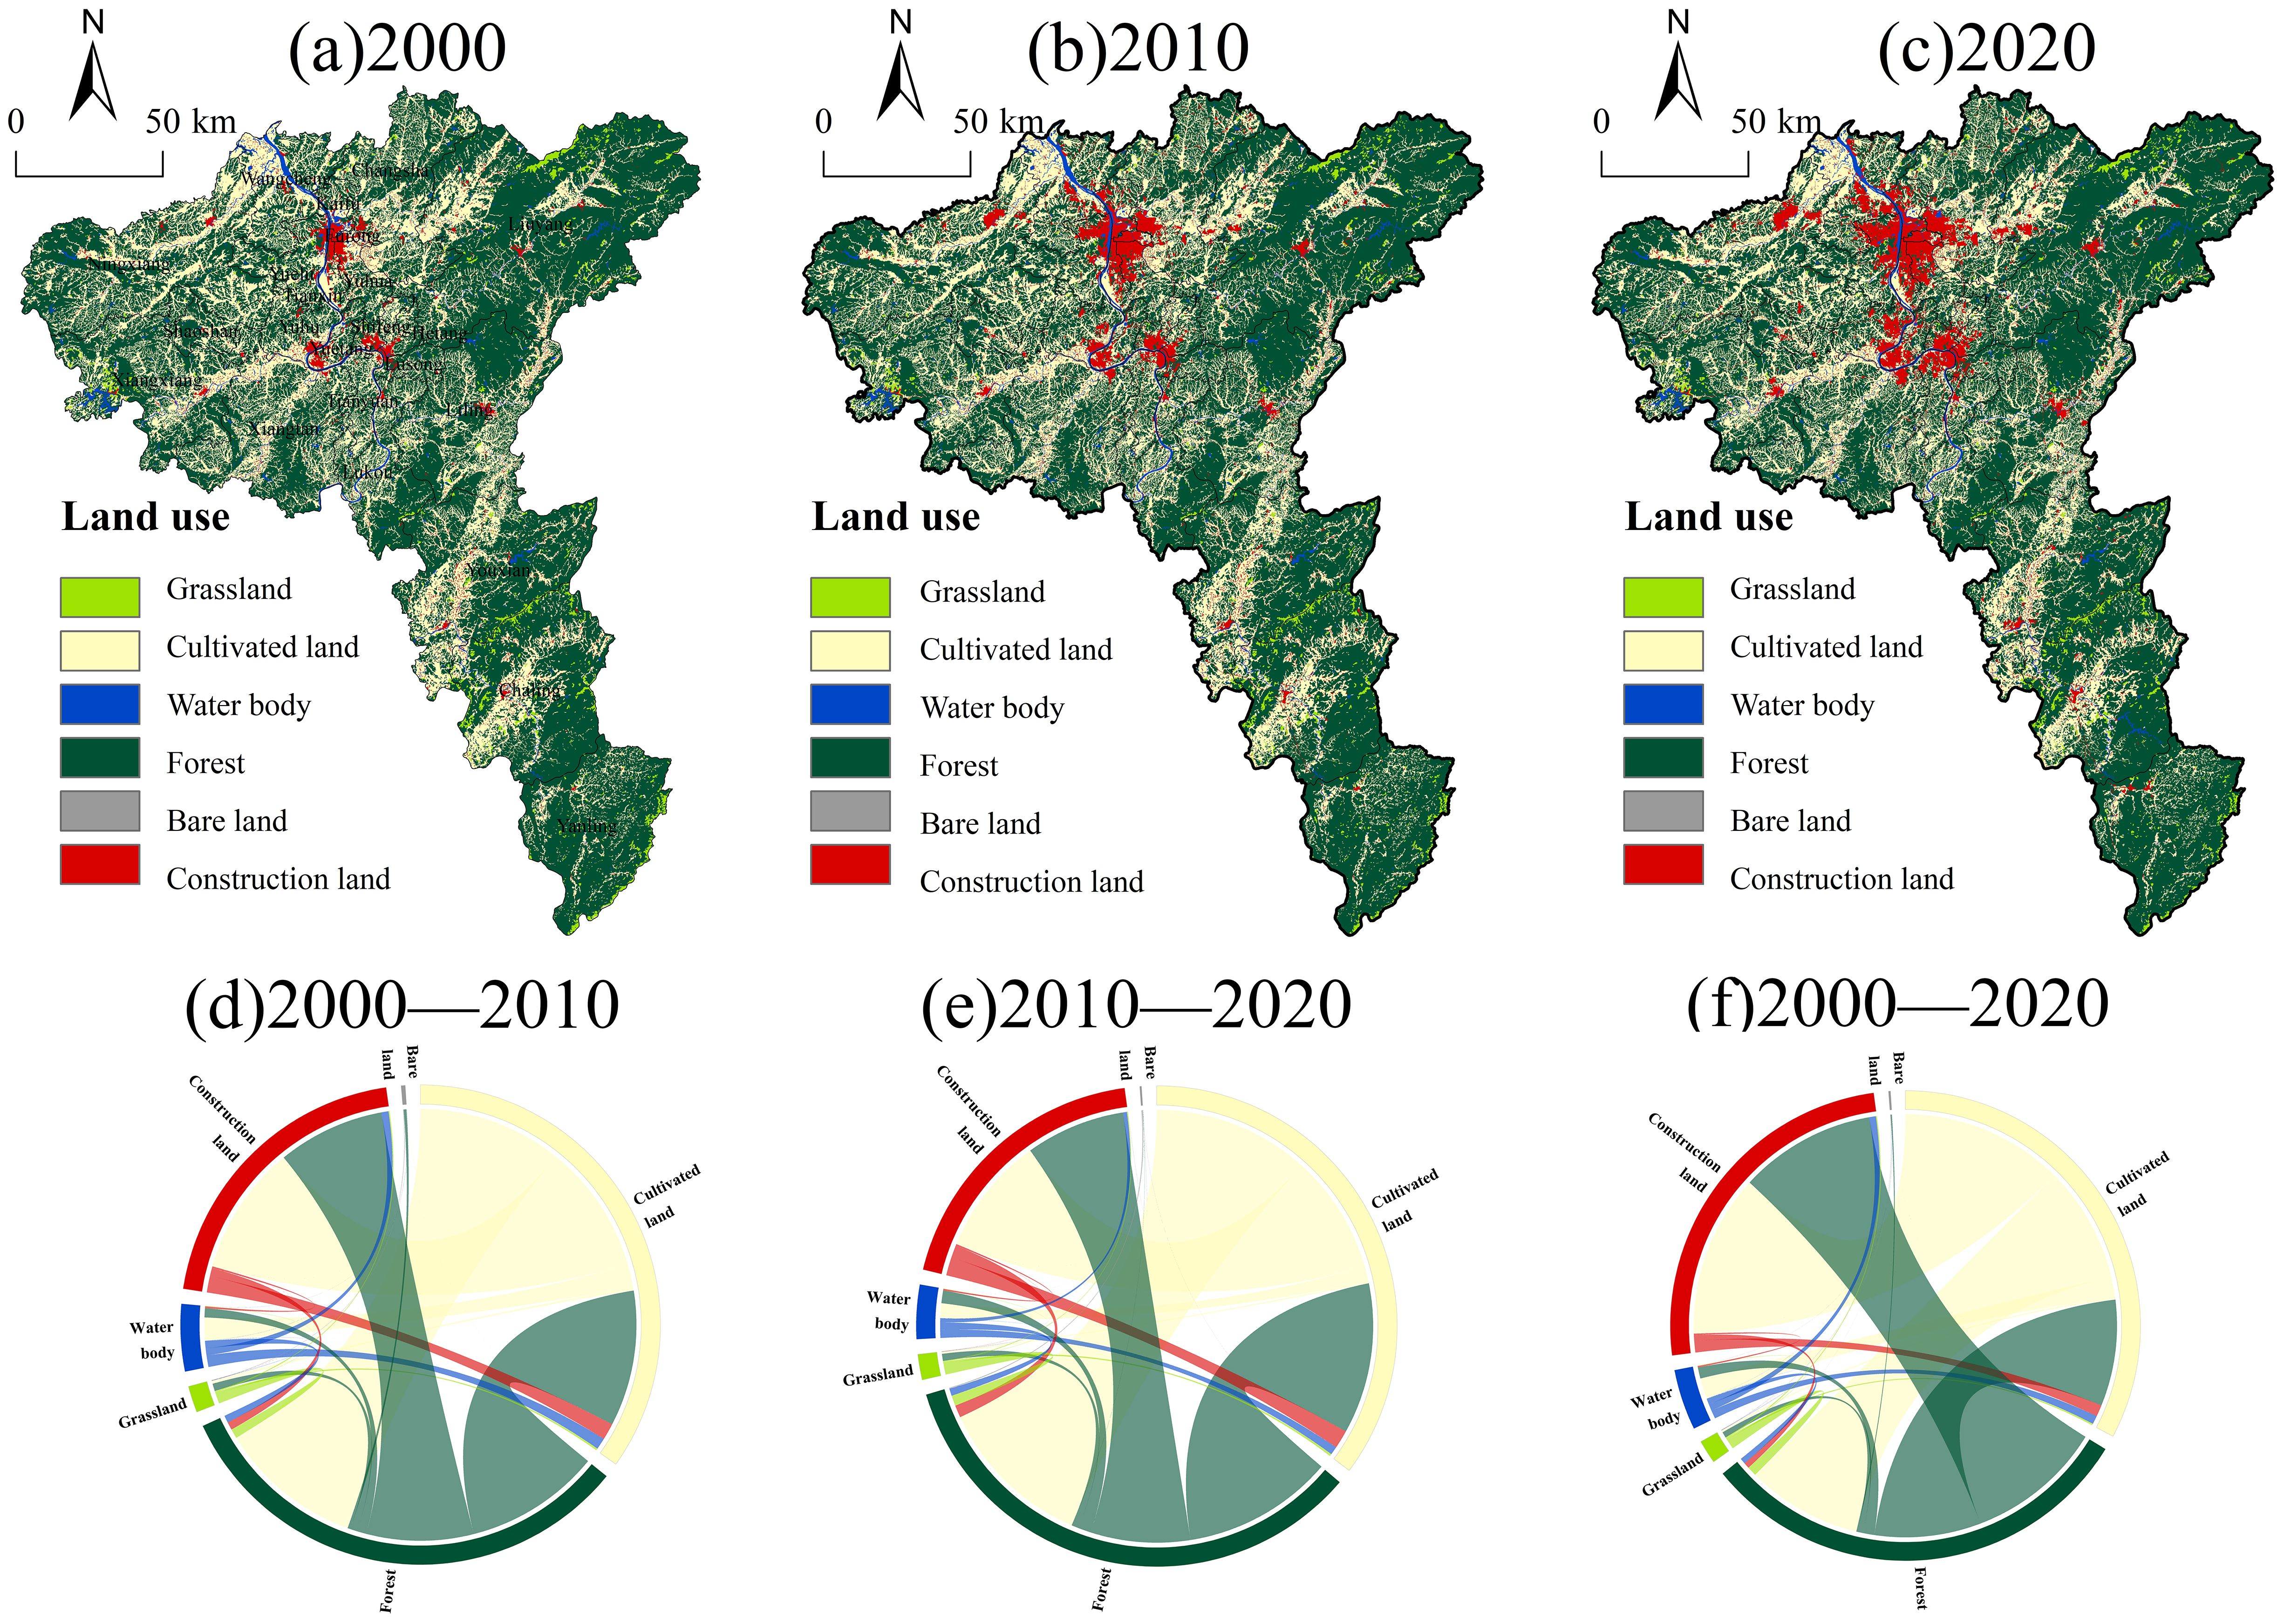
Figure 4. Spatial distribution of land use types in the study area from 2000 to 2020 (a–c). Land Use Transitions from 2000 to 2010, 2010 to 2020, and 2000 to 2020 (d–f).
To further illustrate the dynamics of land use change, land use transition chord diagrams were generated for the periods 2000–2010 and 2010–2020 (Figures 4d–f). The results indicate that the total converted area of cultivated land in both phases remained nearly constant (712.36 km² and 711.22 km², respectively), suggesting that the intensity of cultivated land conversion has consistently remained at a high level over the past two decades. From 2000 to 2010, cultivated land was primarily converted to construction land (accounting for 47.80% of the total converted area), reflecting how rapid urbanization drove industrial development and sustained demand for construction land. From 2010 to 2020, the area of cultivated land converted to construction land decreased (19.29 km²), while the area converted to forest increased (39.42 km²). This shift may have been influenced by ecological civilization policies, under which some cultivated land was incorporated into ecological restoration and afforestation projects. At the same time, regional development entered a phase of structural optimization and stock adjustment, slowing the expansion of construction land. Overall, while the land use pattern characterized by “equal emphasis on development and ecology” has somewhat alleviated the pressure of cultivated land conversion into construction land, the overall trend of cultivated land reduction driven by urbanization remains significant. Consequently, the issue of land resource scarcity is becoming increasingly prominent.
3.1.2 Spatial and temporal distribution of LER
Landscape Ecological Risk (LER) was classified into five levels using the natural breaks method (Table 4). By analyzing changes in the area of each risk level, the study examined the spatiotemporal evolution of LER under multi-factorial drivers and identified its spatial distribution patterns. Results show that LER was predominantly characterized by medium and medium-low risk levels. These two categories accounted for 76.97%, 74.40%, and 63.48% of the total area in 2000, 2010, and 2020, respectively, reflecting a consistent downward trend (a total decrease of 13.49%) and indicating a gradual increase in ecological risk. From 2000 to 2010 and from 2010 to 2020, the areas of low, medium-low, and medium risk declined by 784.24 km² and 3,266.91 km², respectively. Compared with the first period, the second period saw area reductions that were 3.18, 2.39, and 10.69 times larger for low, medium-low, and medium risk levels, respectively—indicating that medium risk areas experienced the most pronounced decline. Meanwhile, medium-high and high risk areas expanded continuously. Between 2010 and 2020, medium-high and high risk zones increased by 2,247.41 km² and 1,019.50 km², respectively—7.0 and 2.2 times the increase observed from 2000 to 2010. This highlights medium-high risk as the dominant expanding category, with ecological risk spreading across a wider area and ecosystem stability facing increasing threats. These findings underscore the need for enhanced ecological protection and restoration efforts in medium and high risk zones to improve regional ecological resilience.
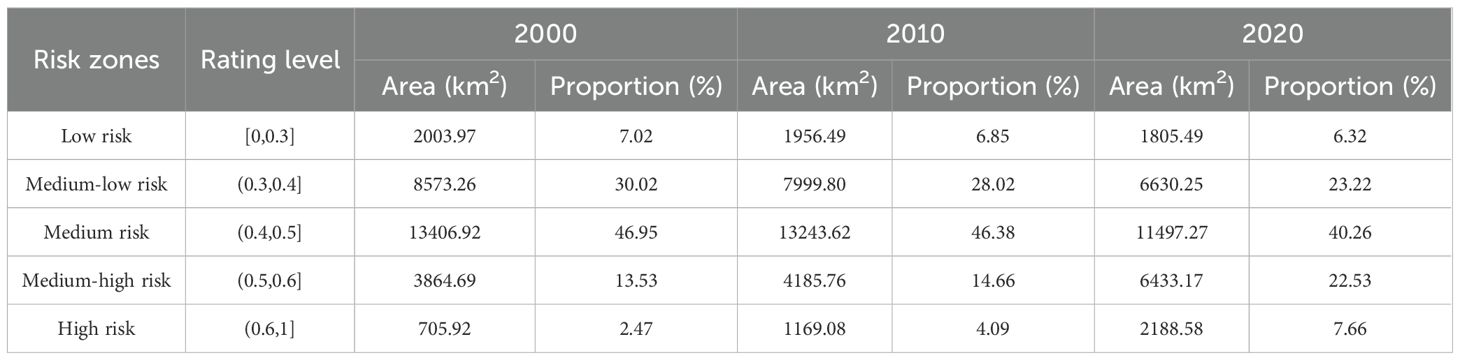
Table 4. Classification, area and proportion of landscape ecological risk in the study area from 2000 to 2020.
In terms of spatial distribution (Figure 5), the mean LER values in 2000, 2010, and 2020 were 0.423, 0.431, and 0.453, respectively, showing a spatial pattern of “high in the center, low at the edges.” High risk zones were mainly concentrated in central urban areas (such as Furong District), typically in clustered or strip-shaped formations. These zones align with dense construction land and major transportation infrastructure, indicating strong impacts from human activities and economic development. By 2020, high risk zones had expanded outward, further intensifying the imbalance between urban growth and ecological protection. Medium-high and medium risk areas were mainly distributed in transitional zones between urban cores and peripheral counties, such as Yuhua District. The LER value in Yuhua increased from 0.525 in 2000 to 0.611 in 2020. During this period, industrial restructuring and infrastructure expansion led to rapid population growth and increased construction density, exacerbating ecosystem disturbance. Some medium risk zones consequently shifted to medium-high risk due to economic spillover effects. Medium-low and low-risk areas were largely found in outer counties such as Liuyang, Chaling, and Yanling, which possess strong ecological foundations. For example, Yanling County maintains 85.67% forest coverage, with well-preserved natural landforms and stable landscape structures, and is subject to minimal anthropogenic interference. This further confirms the critical role of ecological land (especially forest) in maintaining landscape stability and mitigating ecological risk.
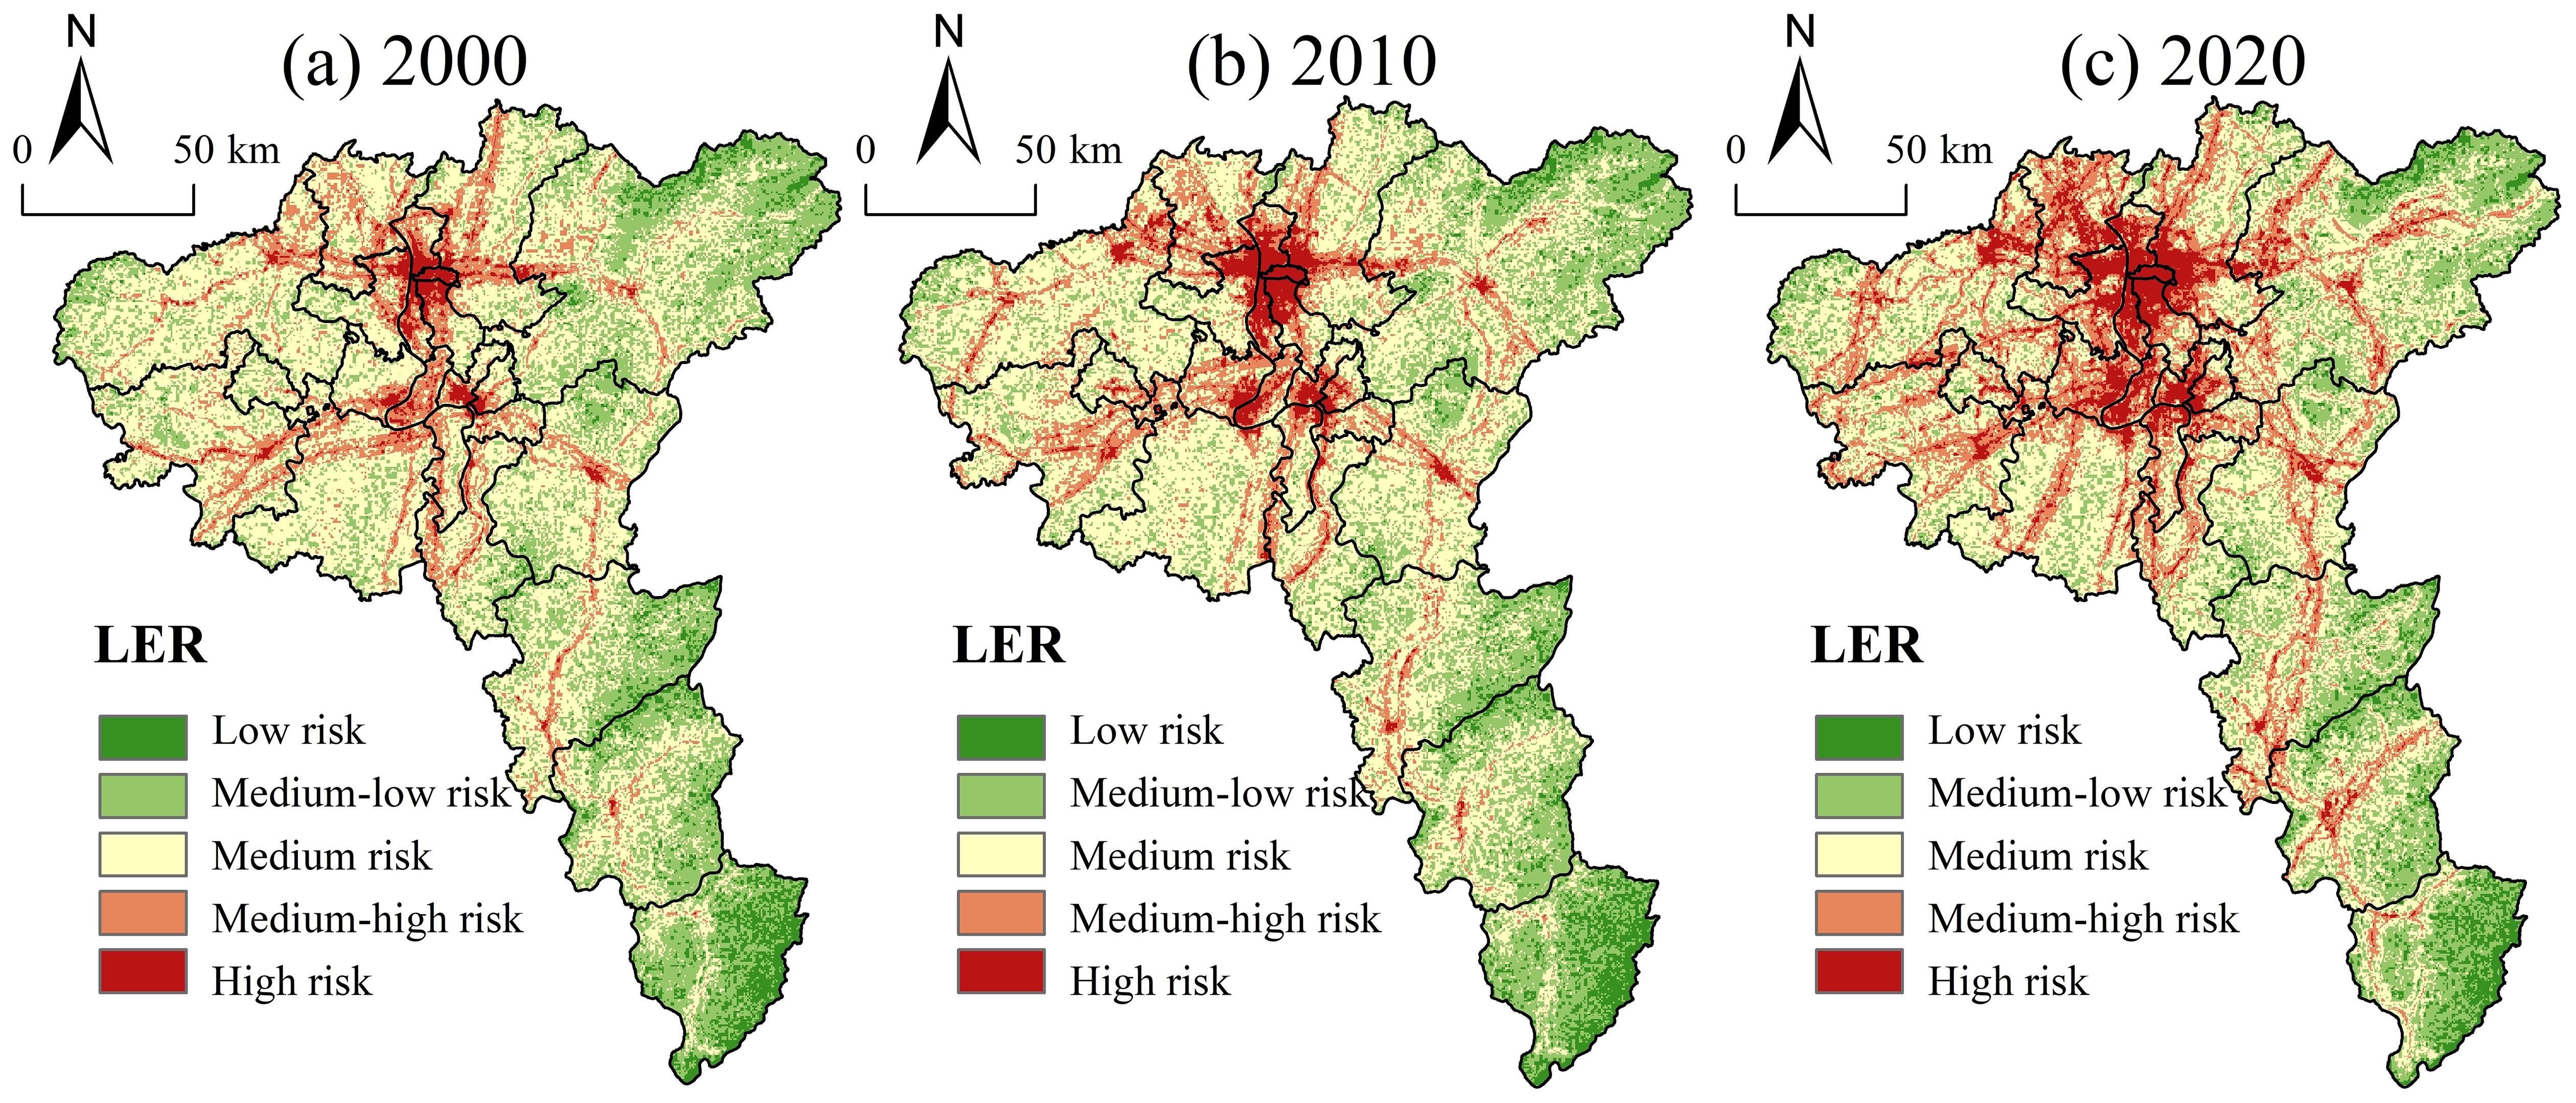
Figure 5. Distribution of landscape ecological risk levels in the study area (a–c).
3.1.3 Spatial and temporal distribution of EHI
The Ecosystem Health Index (EHI) was classified into five levels using the natural breaks method to identify its spatial distribution characteristics (Figure 6). Overall, ecosystem health exhibited a spatial pattern of “low in the center, high at the edges.” High and medium-high EHI values were mainly distributed in peripheral areas such as Liuyang, Yanling, and Chaling, where forest and grassland dominate, and ecosystem stability remains strong. Medium and medium-low levels were concentrated in the transitional zones between urban centers and outlying counties, accounting for 52.40%, 57.64%, and 63.68% of the area in 2000, 2010, and 2020, respectively. These areas are primarily composed of cultivated land, forming the ecological matrix of the region. However, they have become increasingly fragmented under urban expansion, leading to a continuous decline in ecosystem health. Low EHI values were mainly concentrated in the core urban districts, such as Furong District, where construction land dominates. Under the combined pressures of rapid economic growth and population concentration, these areas exhibited significantly lower EHI levels than surrounding regions. The mean EHI values in the study area declined from 0.555 in 2000 to 0.543 in 2010 and 0.518 in 2020. The 2.16% decrease from 2000 to 2010 may be attributed to the implementation of the CZXUA integration strategy in 1997, which accelerated economic development and construction land expansion, compressing ecological space despite limited ecological degradation at that stage. The subsequent 4.60% decline between 2010 and 2020 may relate to the accelerated urban integration process, the accumulation of prior ecological risks, and delayed ecological restoration measures.
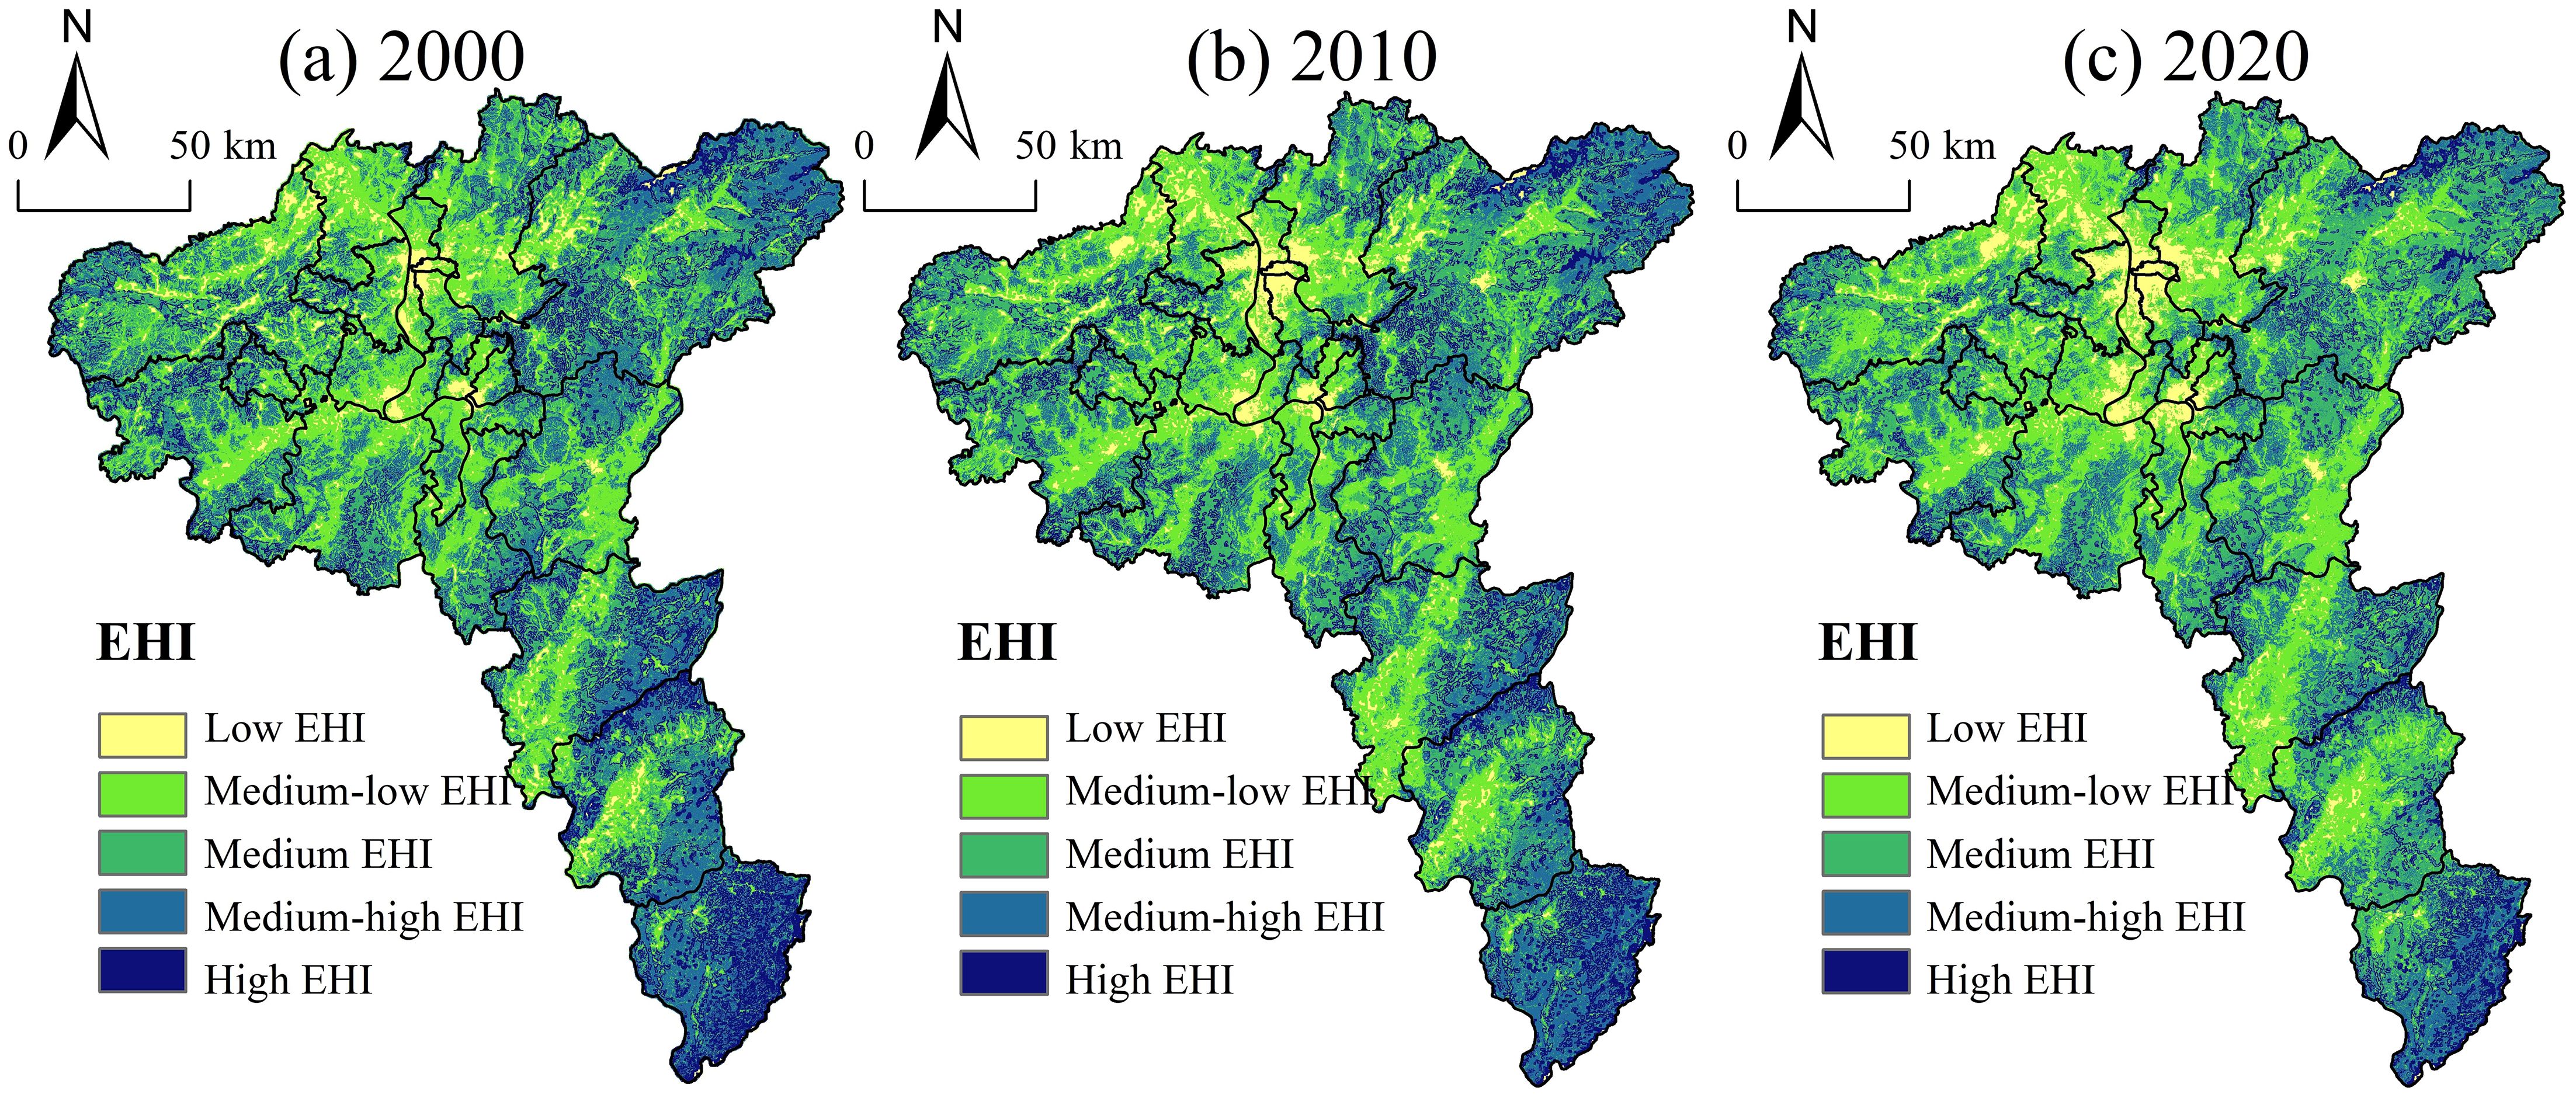
Figure 6. Spatial distribution of ecosystem health levels in the study area (a–c).
From the perspective of land use, EHI generally exhibited a declining trend between 2000 and 2020 (Figure 7). The EHI of forest, water body, and grassland decreased by 6.29%, 4.21%, and 1.97%, respectively, with forest showing the most significant decline. This may be attributed to the combined effects of natural disasters (wildfires, pests, extreme weather, and soil degradation) and anthropogenic pressures (illegal logging and construction encroachment). The EHI of cultivated land increased initially—possibly due to the positive effects of ecological protection measures such as nature reserves, ecological redlines, and afforestation programs—but later declined as the long-term effectiveness of these measures diminished. The EHI of bare land first declined due to urban infrastructure expansion, then improved as a result of vegetation recovery through ecological restoration initiatives. Construction land consistently exhibited a sharp decline in EHI, with a total decrease of 22.15%. This was driven by the continuous expansion of built-up areas, the reduction of ecological land, and the resulting degradation of ecosystem services such as water retention, soil conservation, and habitat quality. Consequently, the stability and resilience of the ecosystem structure weakened, leading to a significant drop in overall ecosystem health.
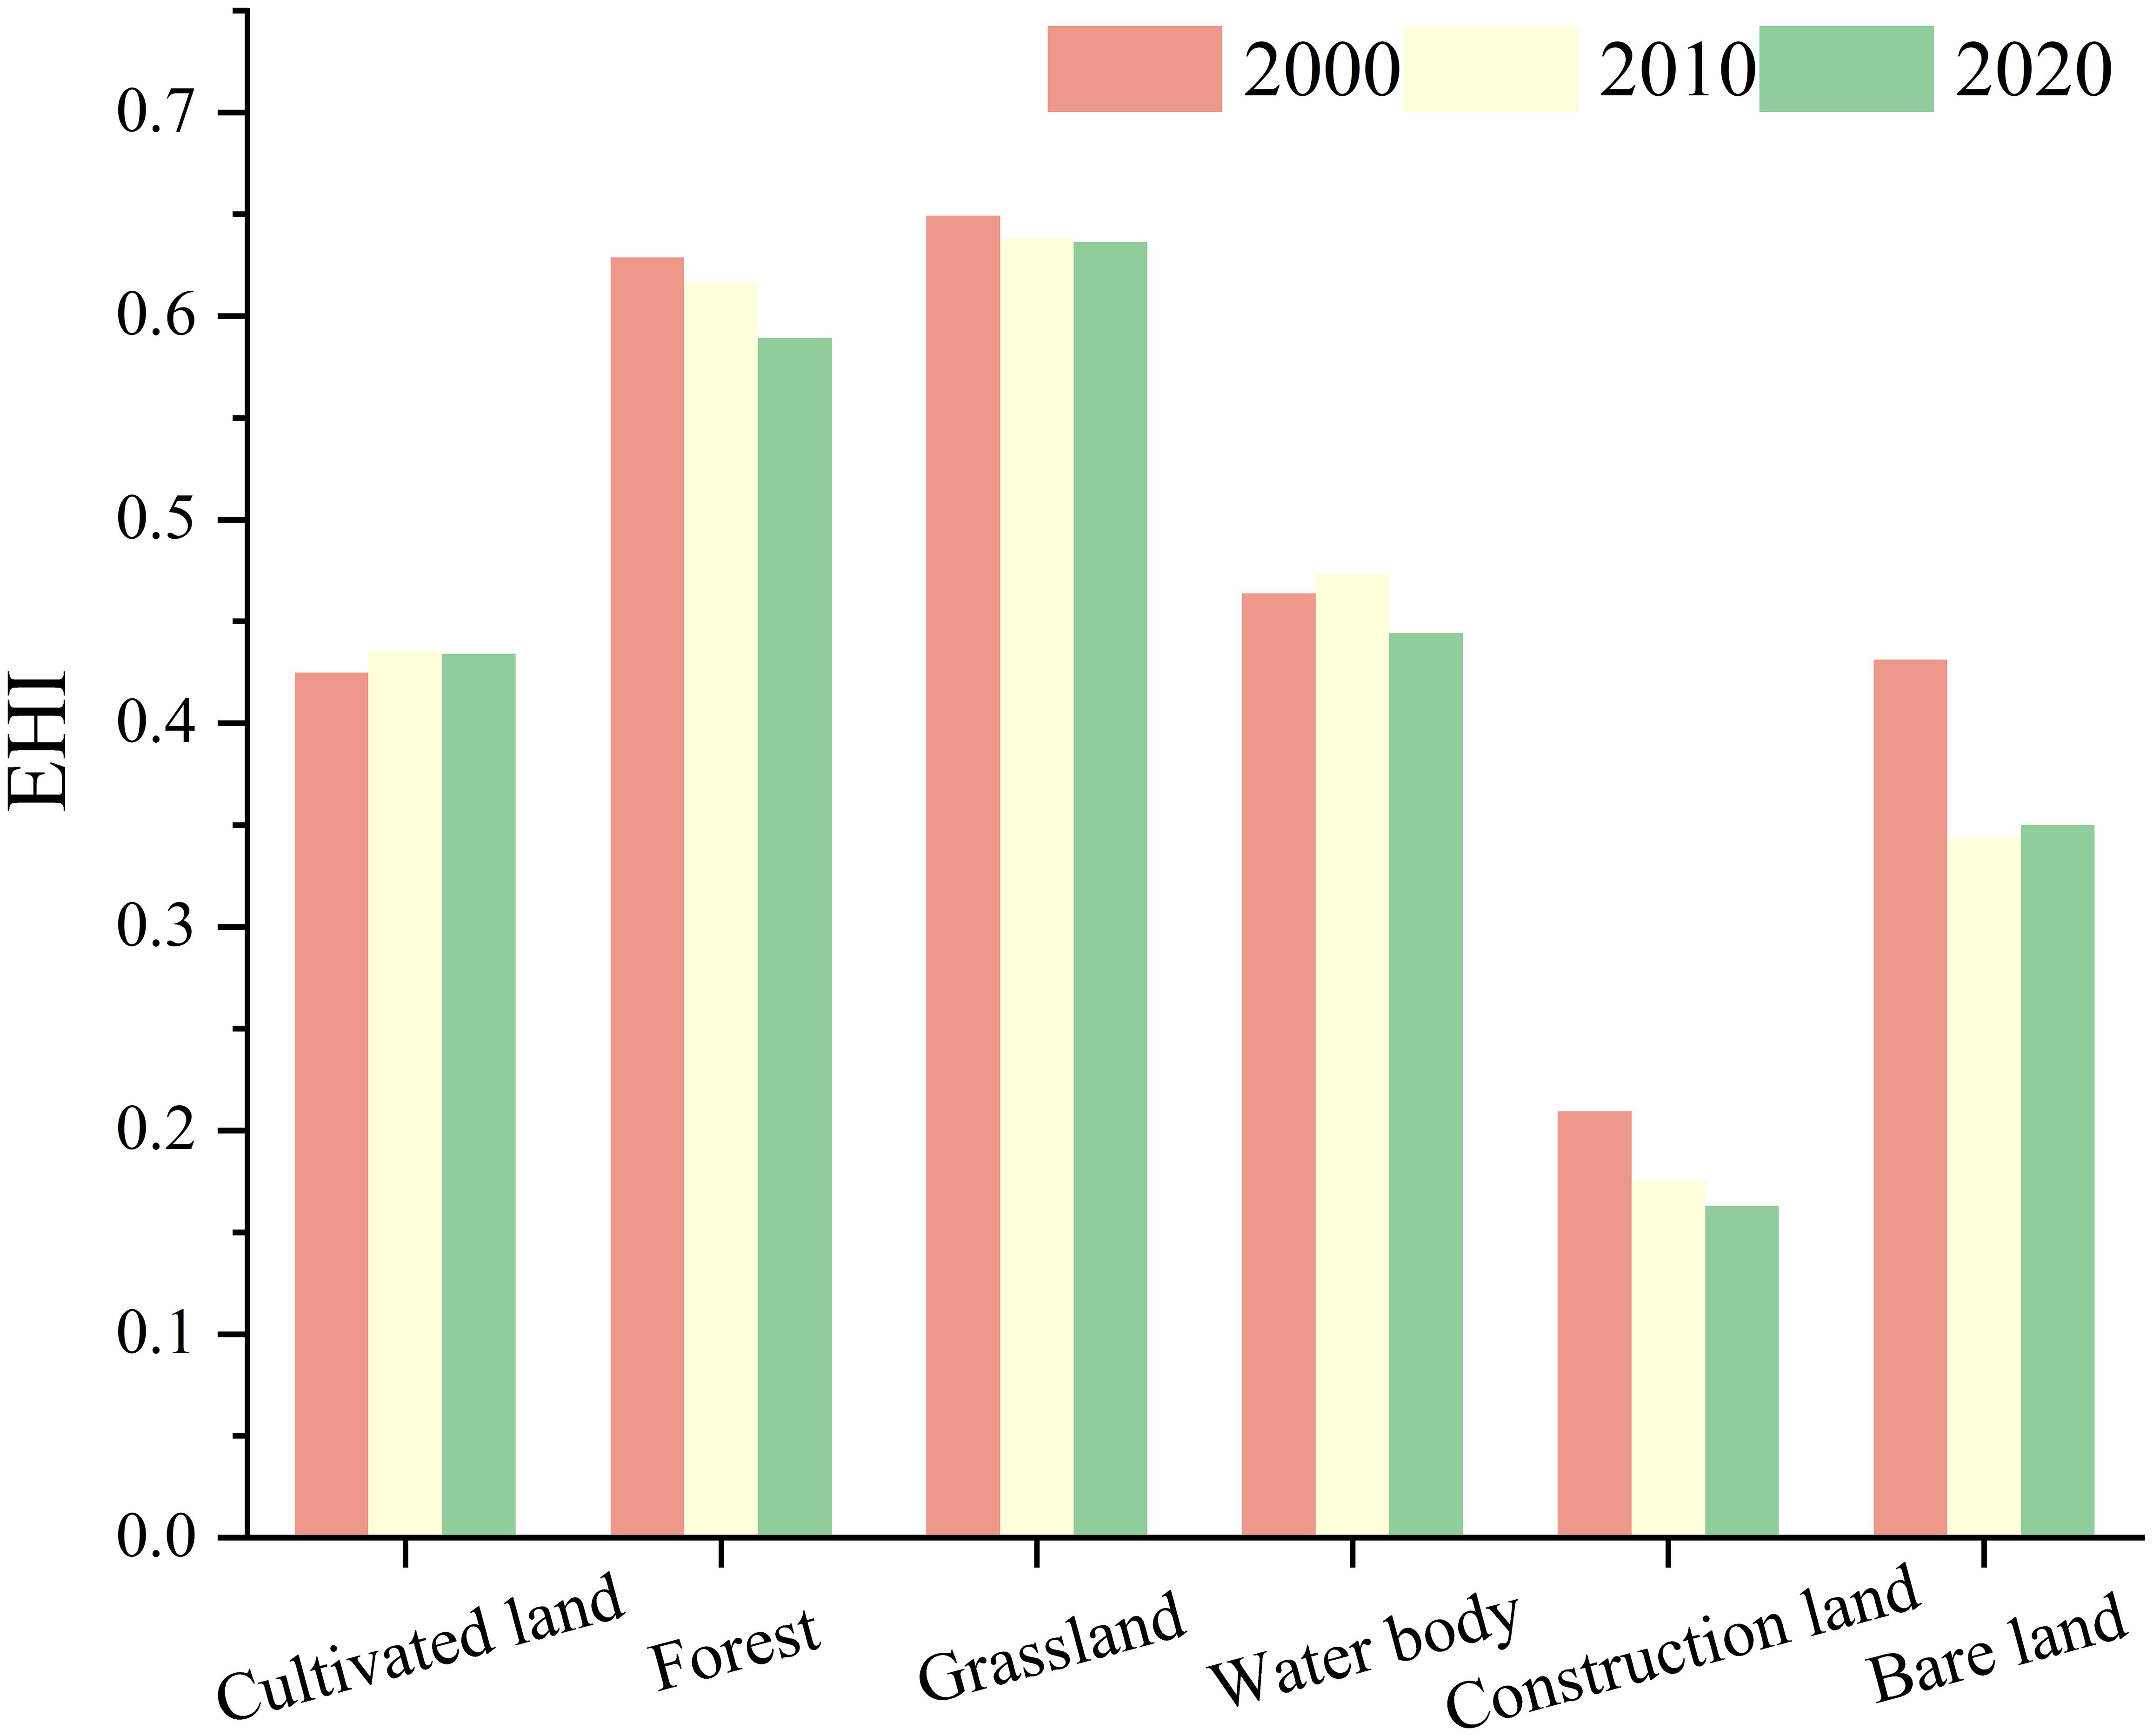
Figure 7. Ecological health indices for different land use.
3.1.4 Characteristics of the spatial and temporal evolution of ecological zones
Based on the standardized Z-scores of LER and EHI, ecological zones were delineated using zero as the classification threshold (Figures 8a–c). The study area was categorized into four functional zones: Ecological Conservation Zone (Low LER—High EHI), Ecological Control Zone (High LER—Low EHI), Strict Ecological Protection Zone (High LER—High EHI), and Ecological Enhancement Zone (Low LER—Low EHI) (Table 5).
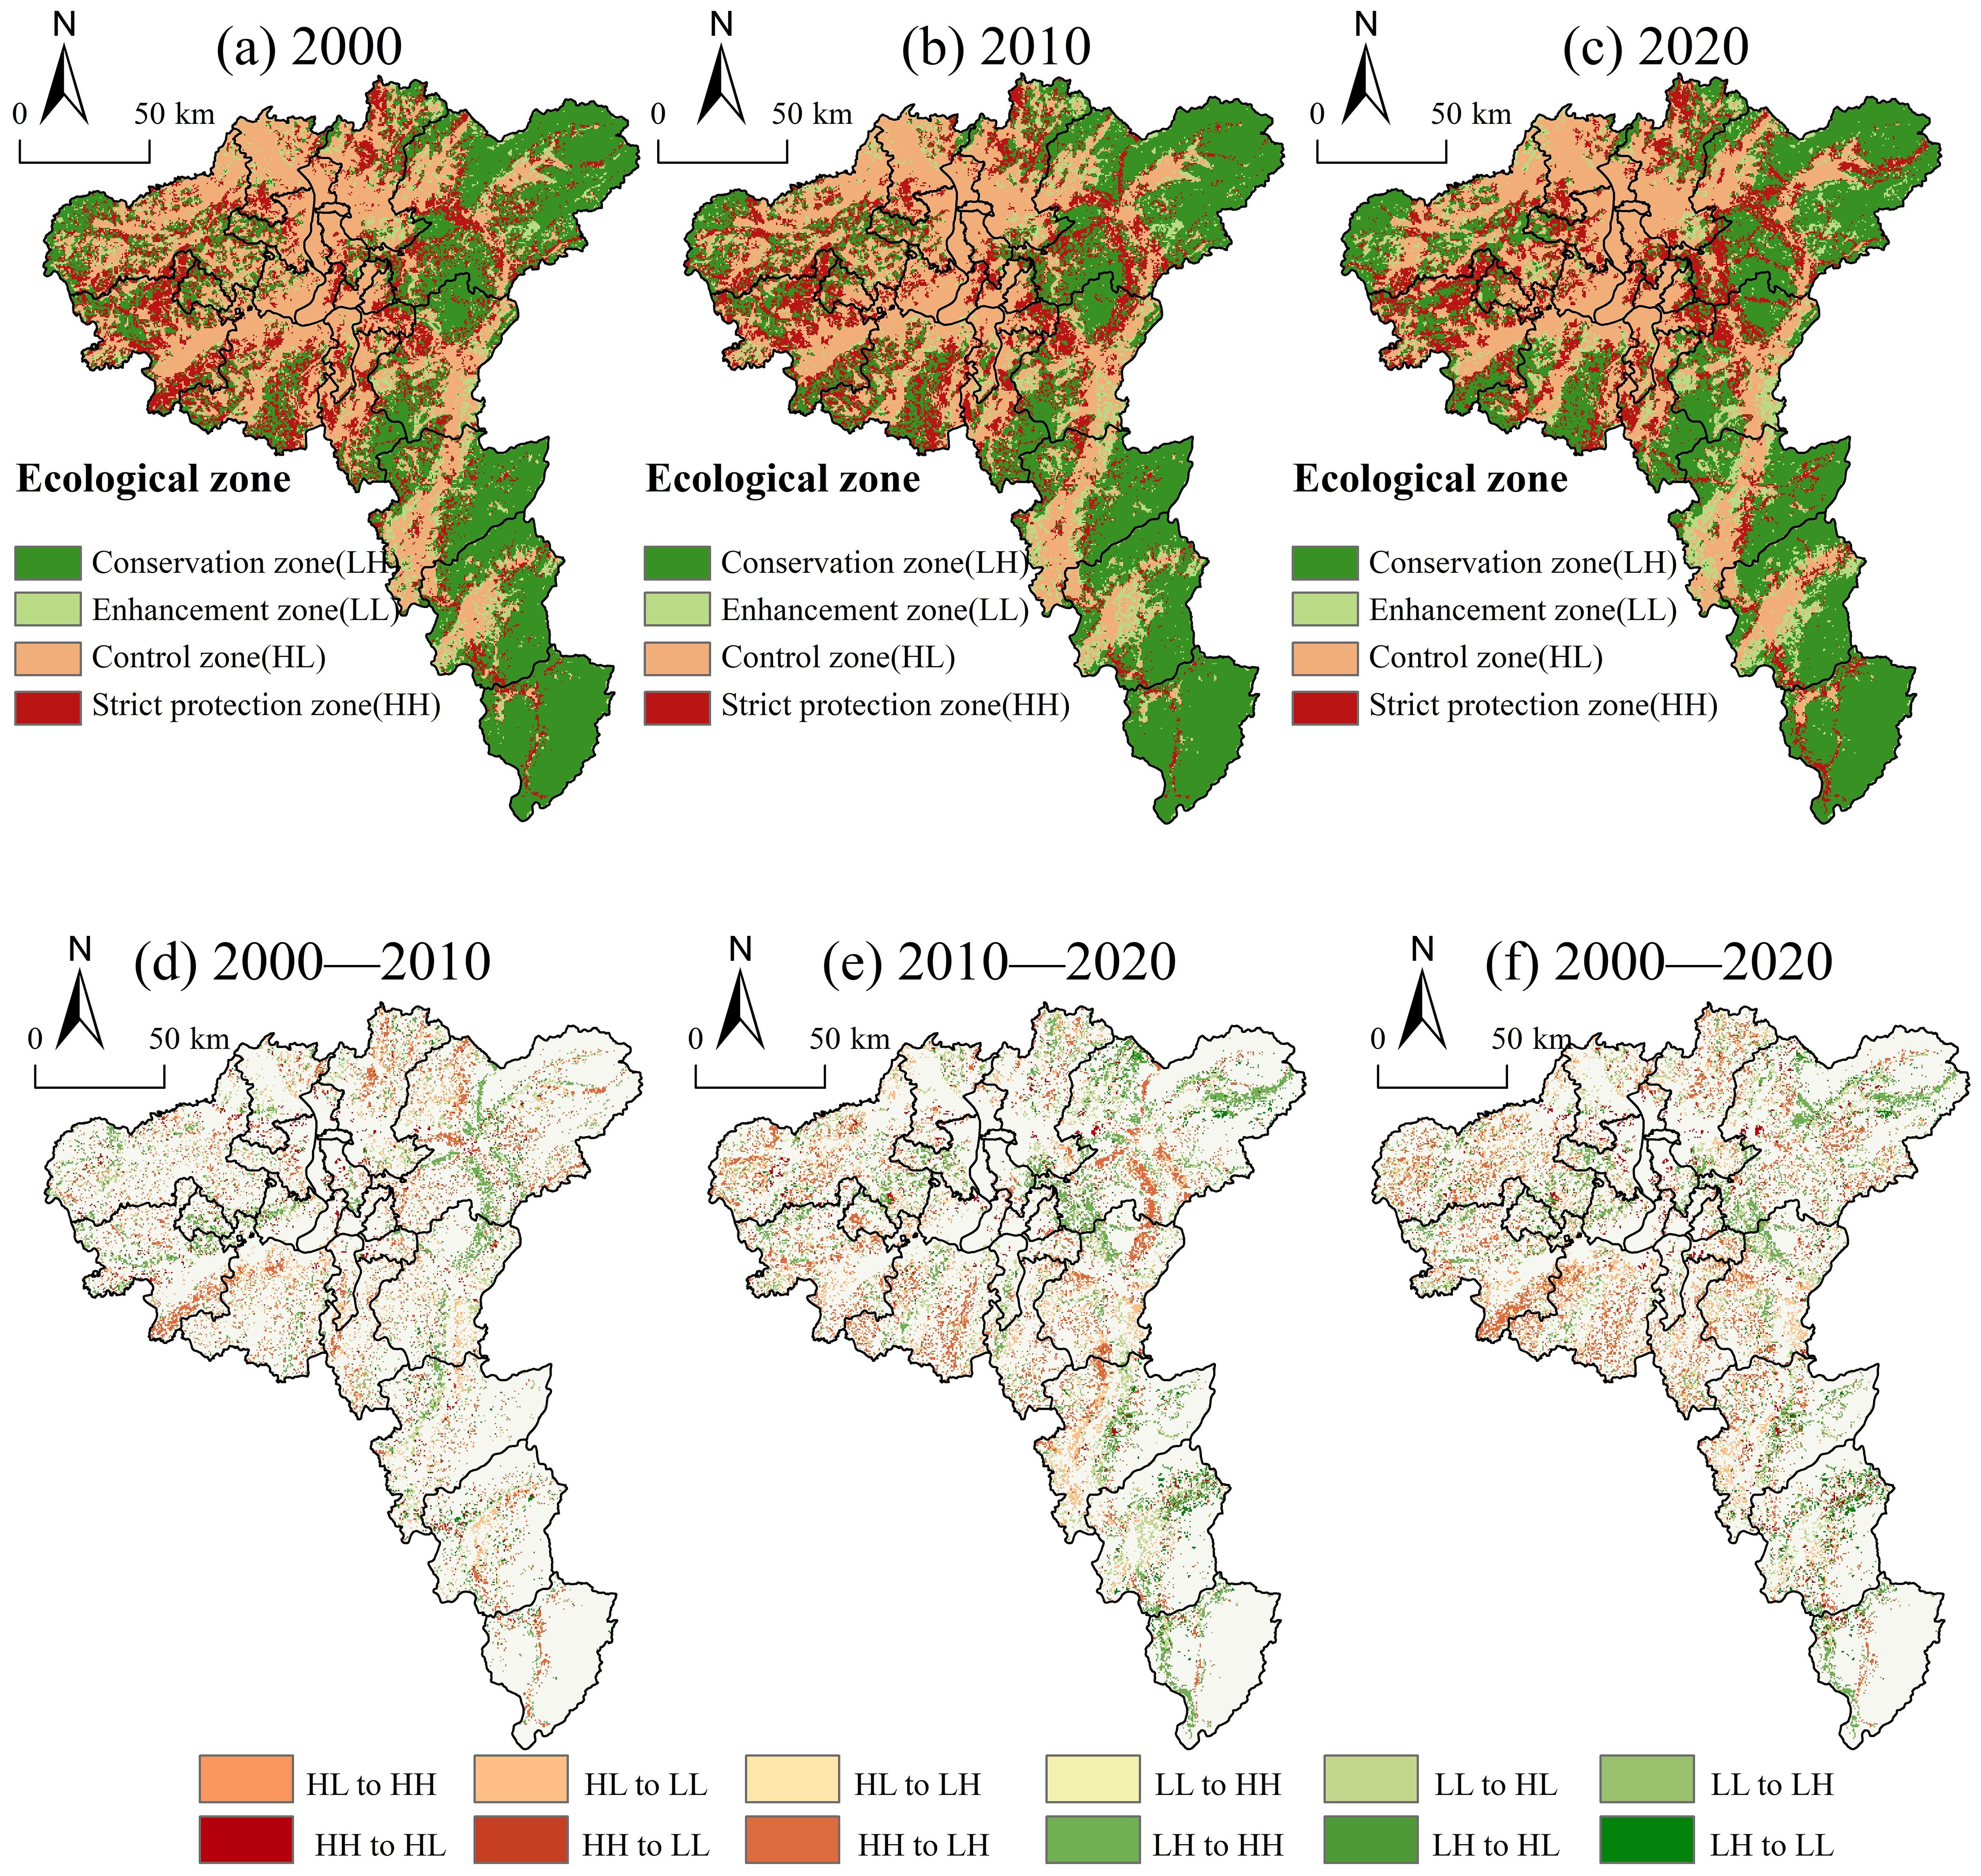
Figure 8. Spatial distribution of ecological zones in the study area from 2000 to 2020 (a–c), Interconversion between different ecological zones during the periods 2000–2010, 2010–2020, and 2000–2020 (d–f).
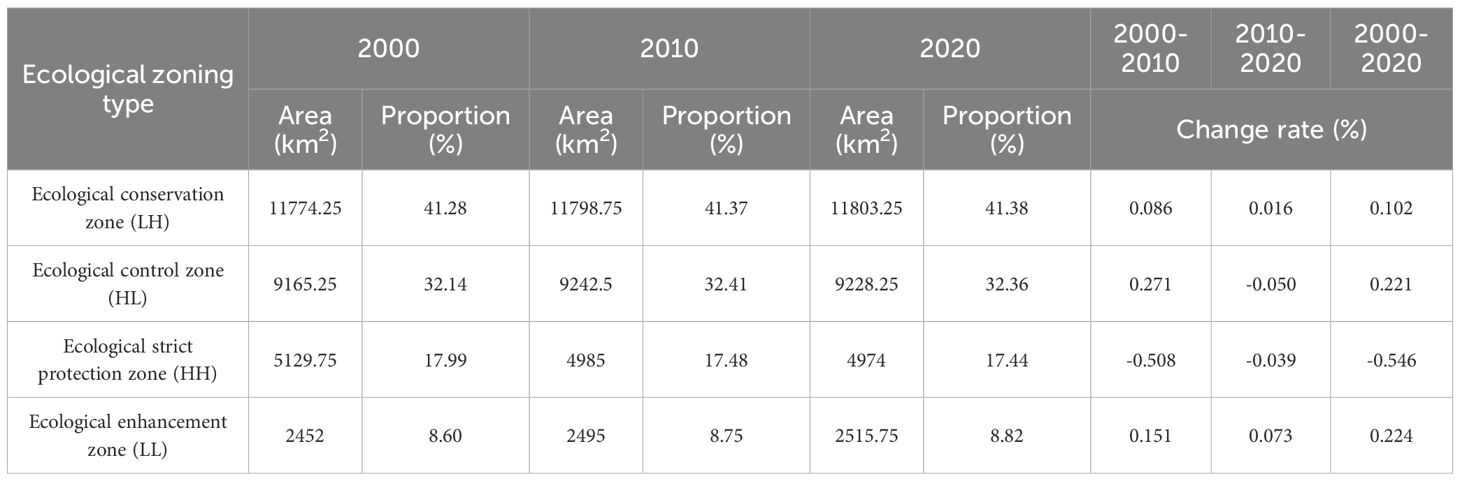
Table 5. Statistics on the ecological zoning of the study area from 2000 to 2020.
In terms of overall spatial structure, the Ecological Conservation Zone accounted for 41.28%, 41.37%, and 41.38% of the total area in 2000, 2010, and 2020, respectively. This zone is primarily located in peripheral counties with rich ecological resources (e.g., Yanling and Chaling), dominated by forest and grassland. These areas experience minimal human disturbance, have high vegetation coverage, stable ecosystem structures, and provide significant ecological services. The overlapping areas and proportions with statutory protected areas were 2,641.97 km² (22.06%), 2,669.47 km² (22.63%), and 2,608.64 km² (22.10%), respectively. This indicates that the overlap between ecological conservation red lines and ecological conservation zones remained consistently high with minimal fluctuation, thereby supporting the stability of ecosystems and ecological service functions.
The Ecological Control Zone is the second largest, comprising 32.14%, 32.41%, and 32.36% of the area in 2000, 2010, and 2020, respectively. It is mainly distributed in the central and northern parts of the core urban areas and is characterized by construction and cultivated land. Under the pressure of urban expansion and population concentration, this zone experiences reduced ecological space, increased landscape fragmentation, and weakened ecosystem function, contributing to heightened ecological security risks. The overlapping areas and proportions with legally designated protected zones were 306.34 km² (3.34%), 292.99 km² (3.17%), and 295.30 km² (3.20%), respectively. The fluctuating proportions reflect urban expansion and land use changes within the ecological control zone, highlighting the need to strengthen coordination between ecological conservation and land use management.
The Strict Ecological Protection Zone showed a decreasing trend, accounting for 17.99%, 17.48%, and 17.44% of the area in 2000, 2010, and 2020, respectively. It is mainly located in the transitional zones surrounding the urban core and is dominated by cultivated land. The ecosystem in this region faces degradation risks, requiring particular attention to ecological fragility and fragmentation issues. The overlapping areas with legally designated protected areas were 330.39 km² (6.44%), 258.39 km² (5.18%), and 312.19 km² (6.28%), respectively. The notable fluctuations indicate that the extent of legally protected areas has been influenced by urbanization processes and development policies during specific periods. Accordingly, efforts should focus on restoring and safeguarding ecological functions within strictly protected areas.
The Ecological Enhancement Zone has the smallest proportion, covering 8.72%, 8.52%, and 8.69% of the total area in 2000, 2010, and 2020, respectively. It is mainly distributed in areas such as You County, dominated by a mix of forest and cultivated land. This zone lies between Ecological Conservation and Control zones and serves as a key regulatory area with potential for ecological recovery and functional restoration. The overlapping areas with legally designated protected zones were 159.04 km² (6.49%), 172.03 km² (6.89%), and 176.76 km² (7.03%), respectively. The continuous increase in these proportions demonstrates that the implementation of ecological conservation policies has strengthened ecological restoration potential and functions in this region.
From a temporal perspective (Figures 8d–f), notable spatial transitions occurred among the ecological zones. The Ecological Control Zone experienced the largest transition to the Strict Ecological Protection Zone, with a cumulative transfer of approximately 19,875 km². However, the rate of this transition slowed between 2010 and 2020, showing a 22.64% decrease compared to the 2000–2010 period. These transitions were concentrated at the edges of urban cores, where ecological risk control has been insufficient and EHI continues to decline, indicating limited effectiveness of ecological restoration. The second largest transition occurred from the Ecological Control Zone to the Ecological Enhancement Zone, totaling approximately 18,175 km². From 2010 to 2020, the transition volume decreased by 69.70% compared to the previous decade, primarily in non-core marginal areas. This suggests partial relief of landscape risks, but slow progress in ecological health restoration. The Ecological Conservation Zone showed a high transition frequency. Between 2010 and 2020, the volume of outflow transitions exceeded the inflow during 2000–2010 by 56.89%, indicating increasing instability in regional ecosystems. This trend underscores the urgent need to reinforce ecological redline protections and implement targeted restoration strategies to preserve ecological integrity.
3.2 Ecological zoning construction under multi-scenarios
3.2.1 Simulation of land use change under different scenarios
Using land use data from 2000 to 2020 as a baseline, this study projected the area and proportion of each land use for the years 2030, 2040, and 2050 under three scenarios: SSP126, SSP245, and SSP585 (Table 6). In all scenarios, forest remains the dominant land use, accounting for approximately 60% of the total area, followed by cultivated land at around 28%. Construction land continues to expand across all scenarios, with average annual increases of 0.59% (SSP126), 0.30% (SSP245), and 0.40% (SSP585). Among them, the SSP585 scenario produces the largest area of construction land by 2050 (2,664.94 km²), reflecting the significant land pressure imposed by a high-emission, high-urbanization development trajectory. Although construction land grows most rapidly under the SSP126 scenario, its final projected extent is smaller than that under SSP585. This outcome may be attributed to the SSP126 pathway’s emphasis on ecological protection and low emissions, aiming to accommodate urban growth while safeguarding natural ecosystems. Cultivated land, grassland, and water body show a consistent declining trend across scenarios. This is primarily due to the encroachment of construction land, coupled with indirect effects of climate change and land degradation on grassland and aquatic ecosystems. Among all land uses, the decline in cultivated land is the most pronounced, with average annual decreases of 0.57% (SSP126), 0.10% (SSP245), and 0.25% (SSP585) projected for 2030, 2040, and 2050, respectively.
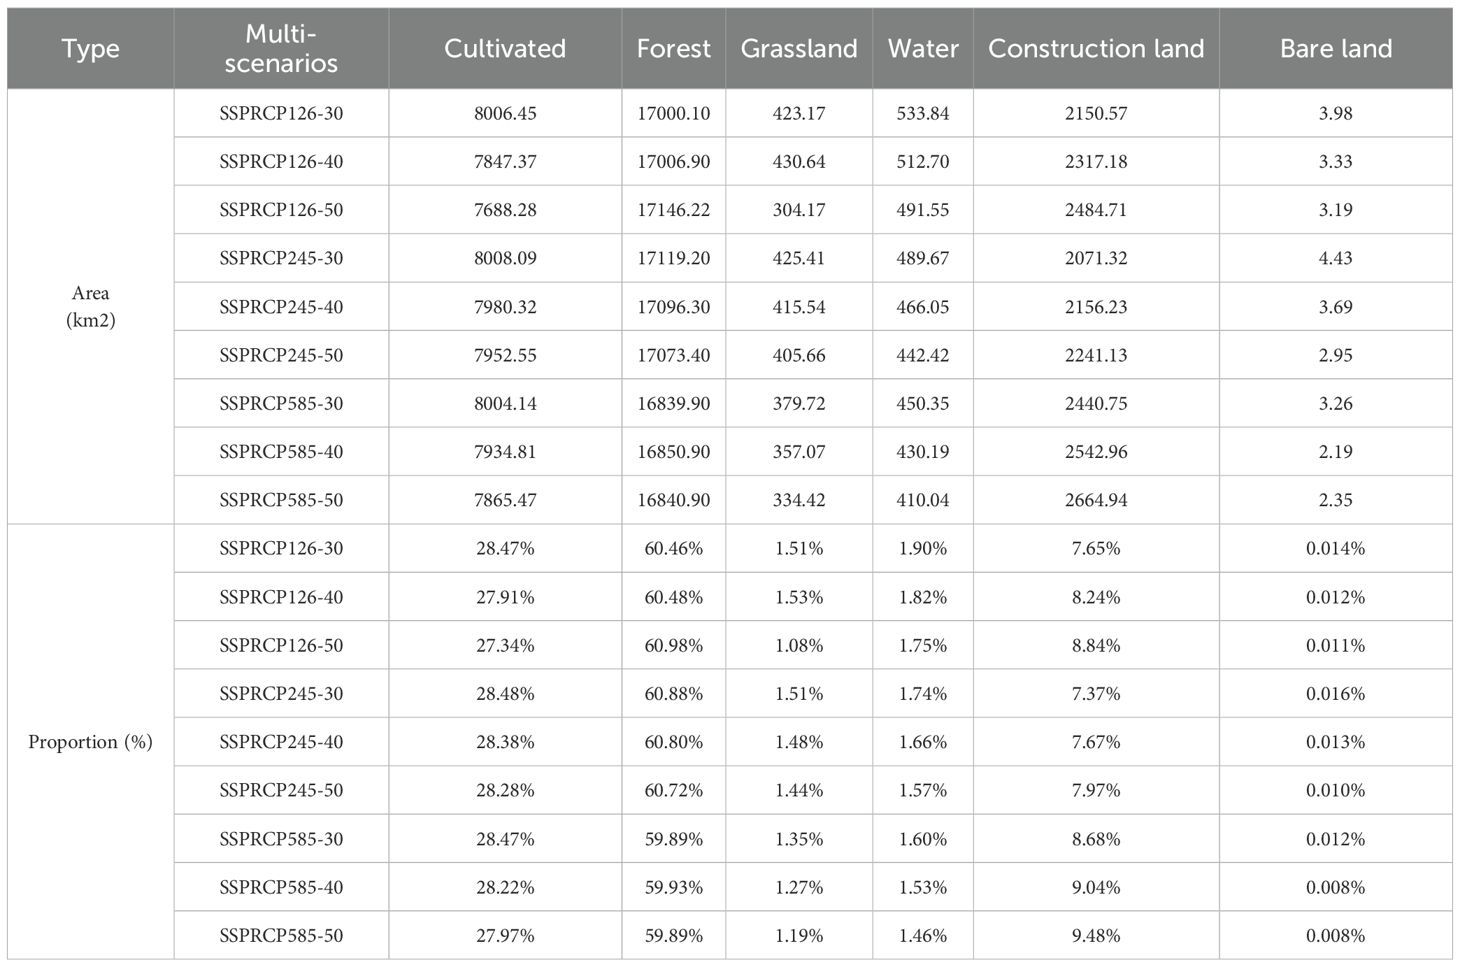
Table 6. Area and proportion of land use types in 2030, 2040, and 2050 under multiple scenarios.
Spatial analysis of land use transitions from 2020 to 2050 (Figure 9) reveals that most land conversion under all scenarios involves transformation into construction land, with forest being the most affected. The expansion of construction land is concentrated on the urban periphery, typically along transportation corridors and infrastructure belts, forming an outward expansion pattern that reflects the spatial coupling of urban growth and transportation development. Compared to 2020, the net increase in construction land by 2050 is 850.98 km² (SSP126), 607.40 km² (SSP245), and 1,031.21 km² (SSP585). Concurrently, the forest area converted to other uses is 366.13 km² (SSP126), 438.95 km² (SSP245), and 671.45 km² (SSP585). These figures indicate that urban expansion poses a substantial threat to ecosystem integrity and reflects the intensifying impact of socio-economic development on natural landscapes. Specifically, under SSP126, cultivated land is converted to both forest and construction land, suggesting a balance between urban expansion and ecological restoration. Forest remains relatively stable within core urban areas but is more frequently converted in peripheral counties, primarily to construction and cultivated land. Under SSP245 and SSP585, cultivated land is predominantly converted to construction land, indicating that medium to high intensity urbanization is accelerating the loss of agricultural land. Forest is also increasingly converted to construction land, especially in the hilly eastern and southern regions, suggesting that urban construction pressure is encroaching upon ecologically sensitive zones and intensifying land use conflicts.
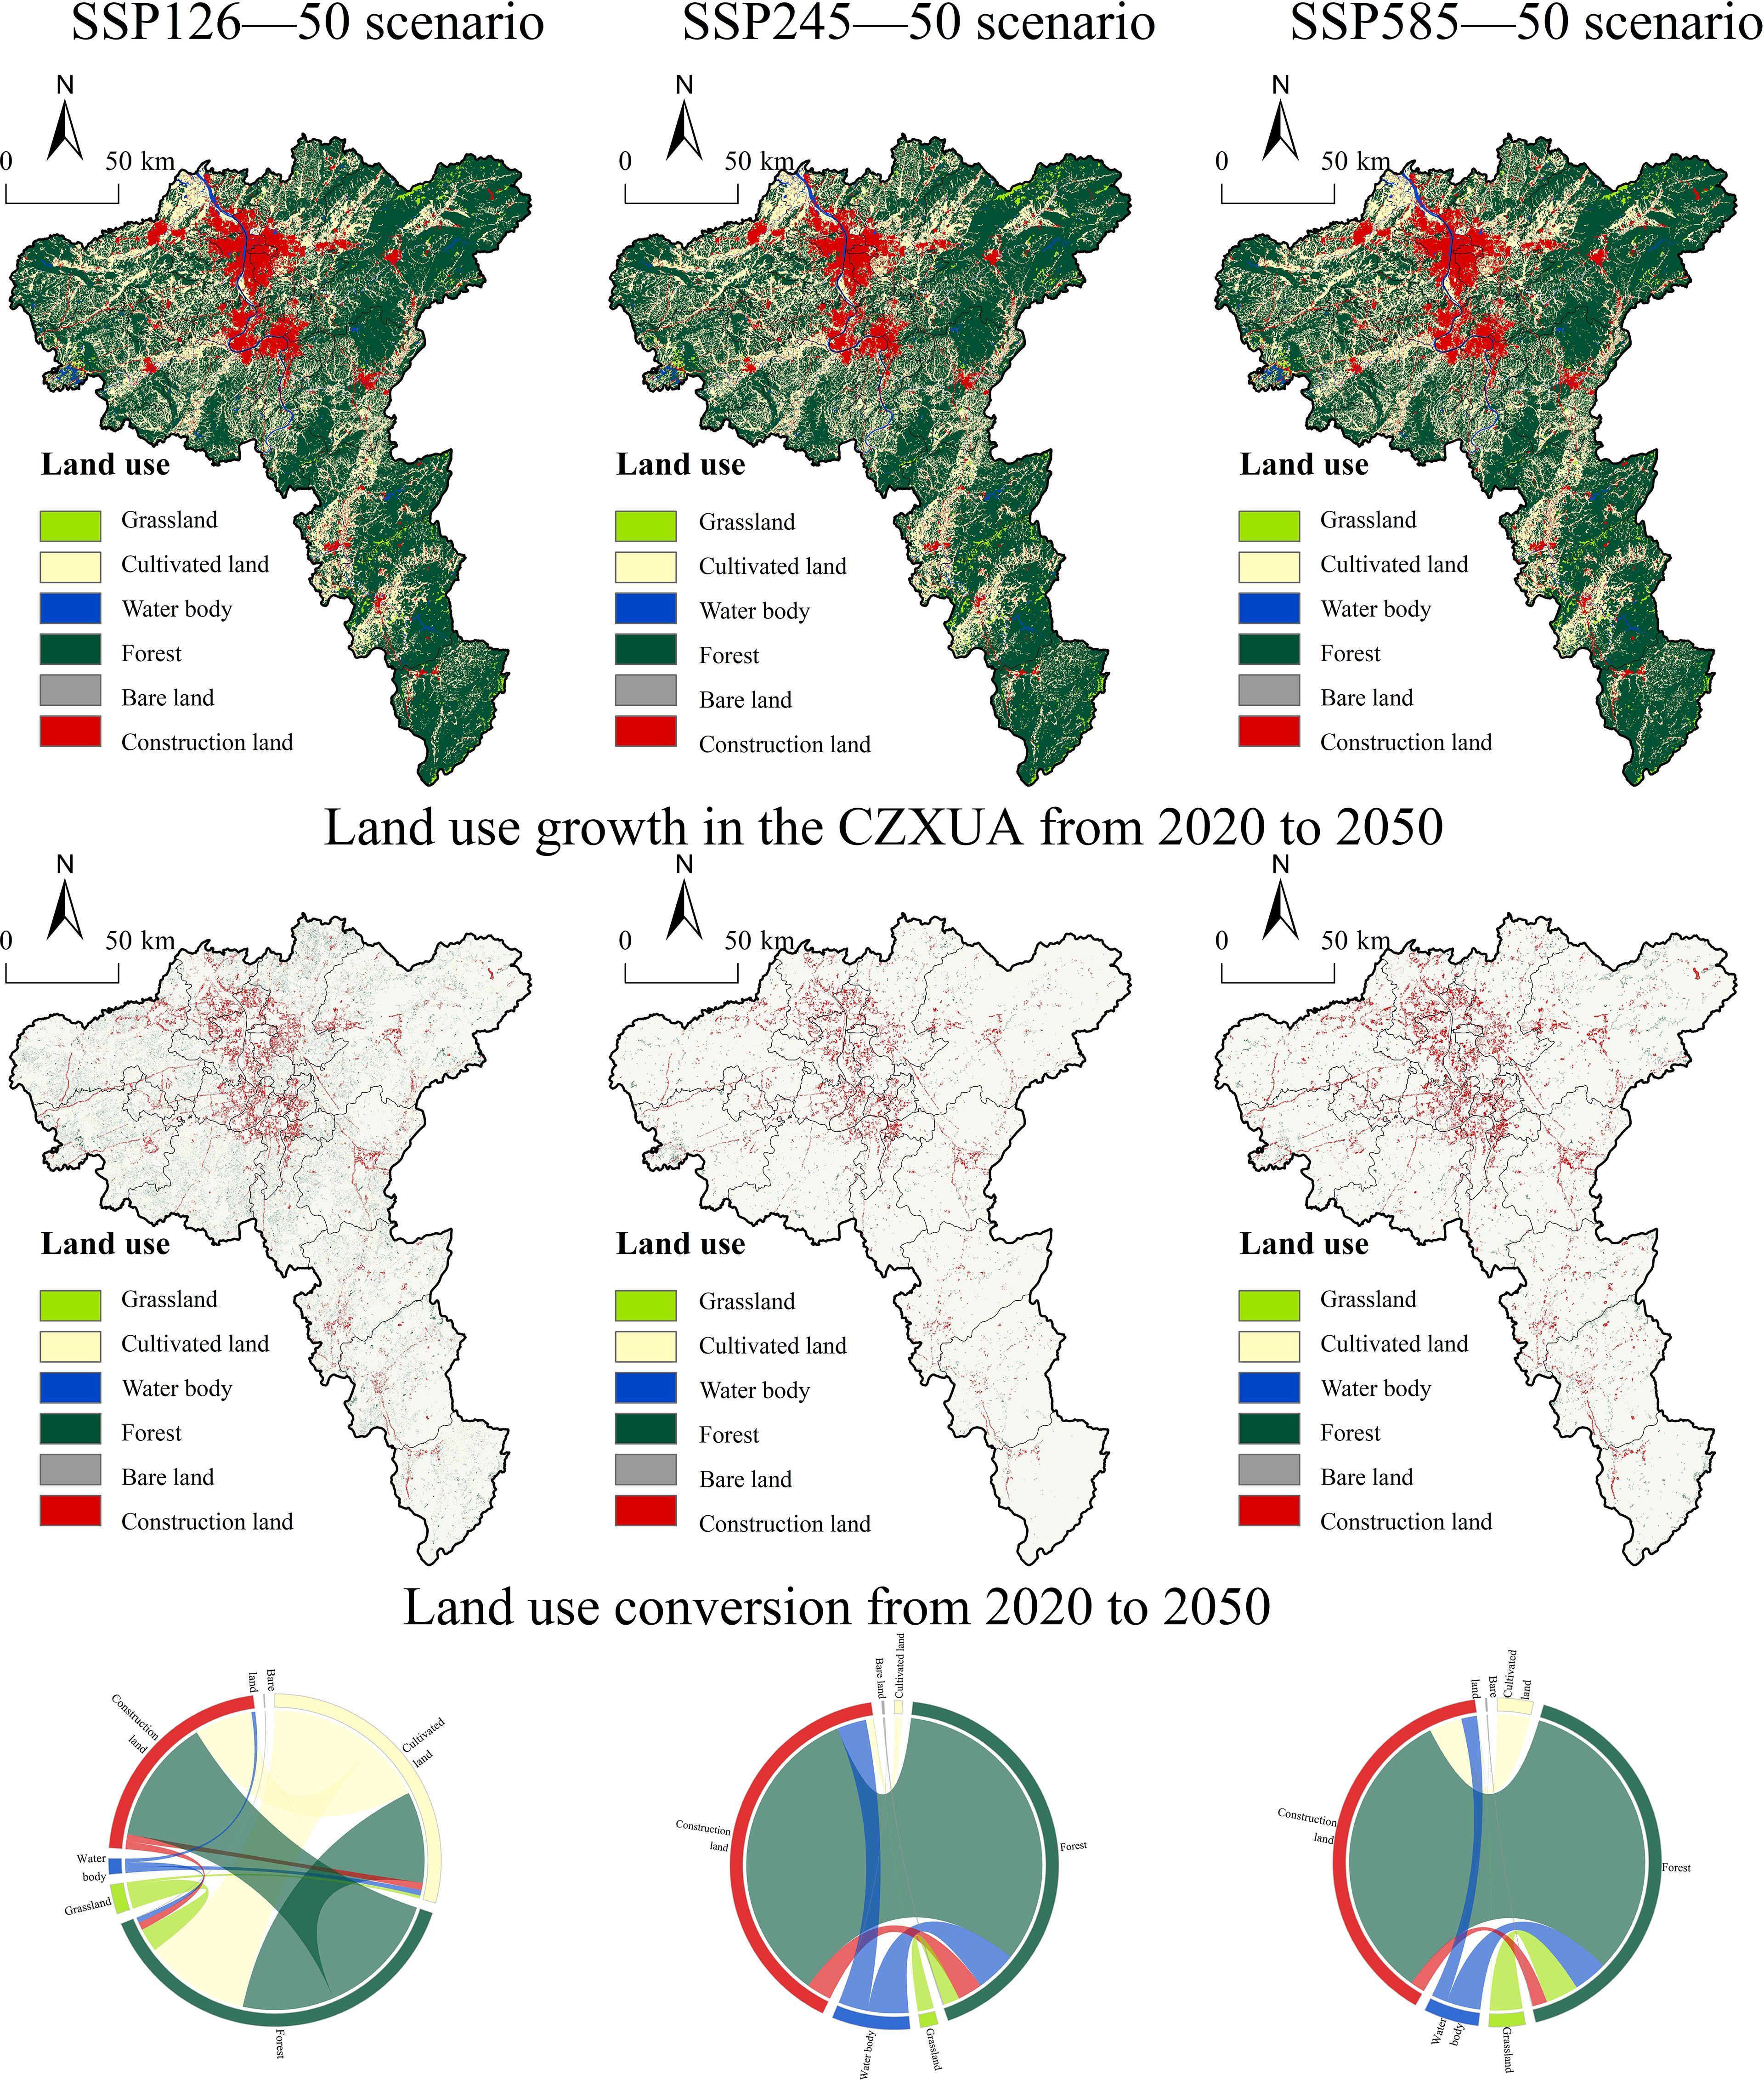
Figure 9. Spatial distribution of land use type transitions from 2020 to 2050.
3.2.2 Ecological zoning simulation
Based on land use simulation results for 2030, 2040, and 2050 under multiple scenarios, the LER and the EHI were recalculated to construct the spatial distribution of future ecological zoning (Figure 10). This study reveals the evolution characteristics of ecological spatial structures under different SSP–RCP scenarios. Compared to 2020, the Ecological Control Zone exhibits an overall expansion trend across all scenarios, with an average area increase of 4.90%. In contrast, the Ecological Enhancement Zone, Strict Ecological Protection Zone, and Ecological Conservation Zone show decreasing trends, with average reductions of 2.63%, 1.23%, and 1.04%, respectively.
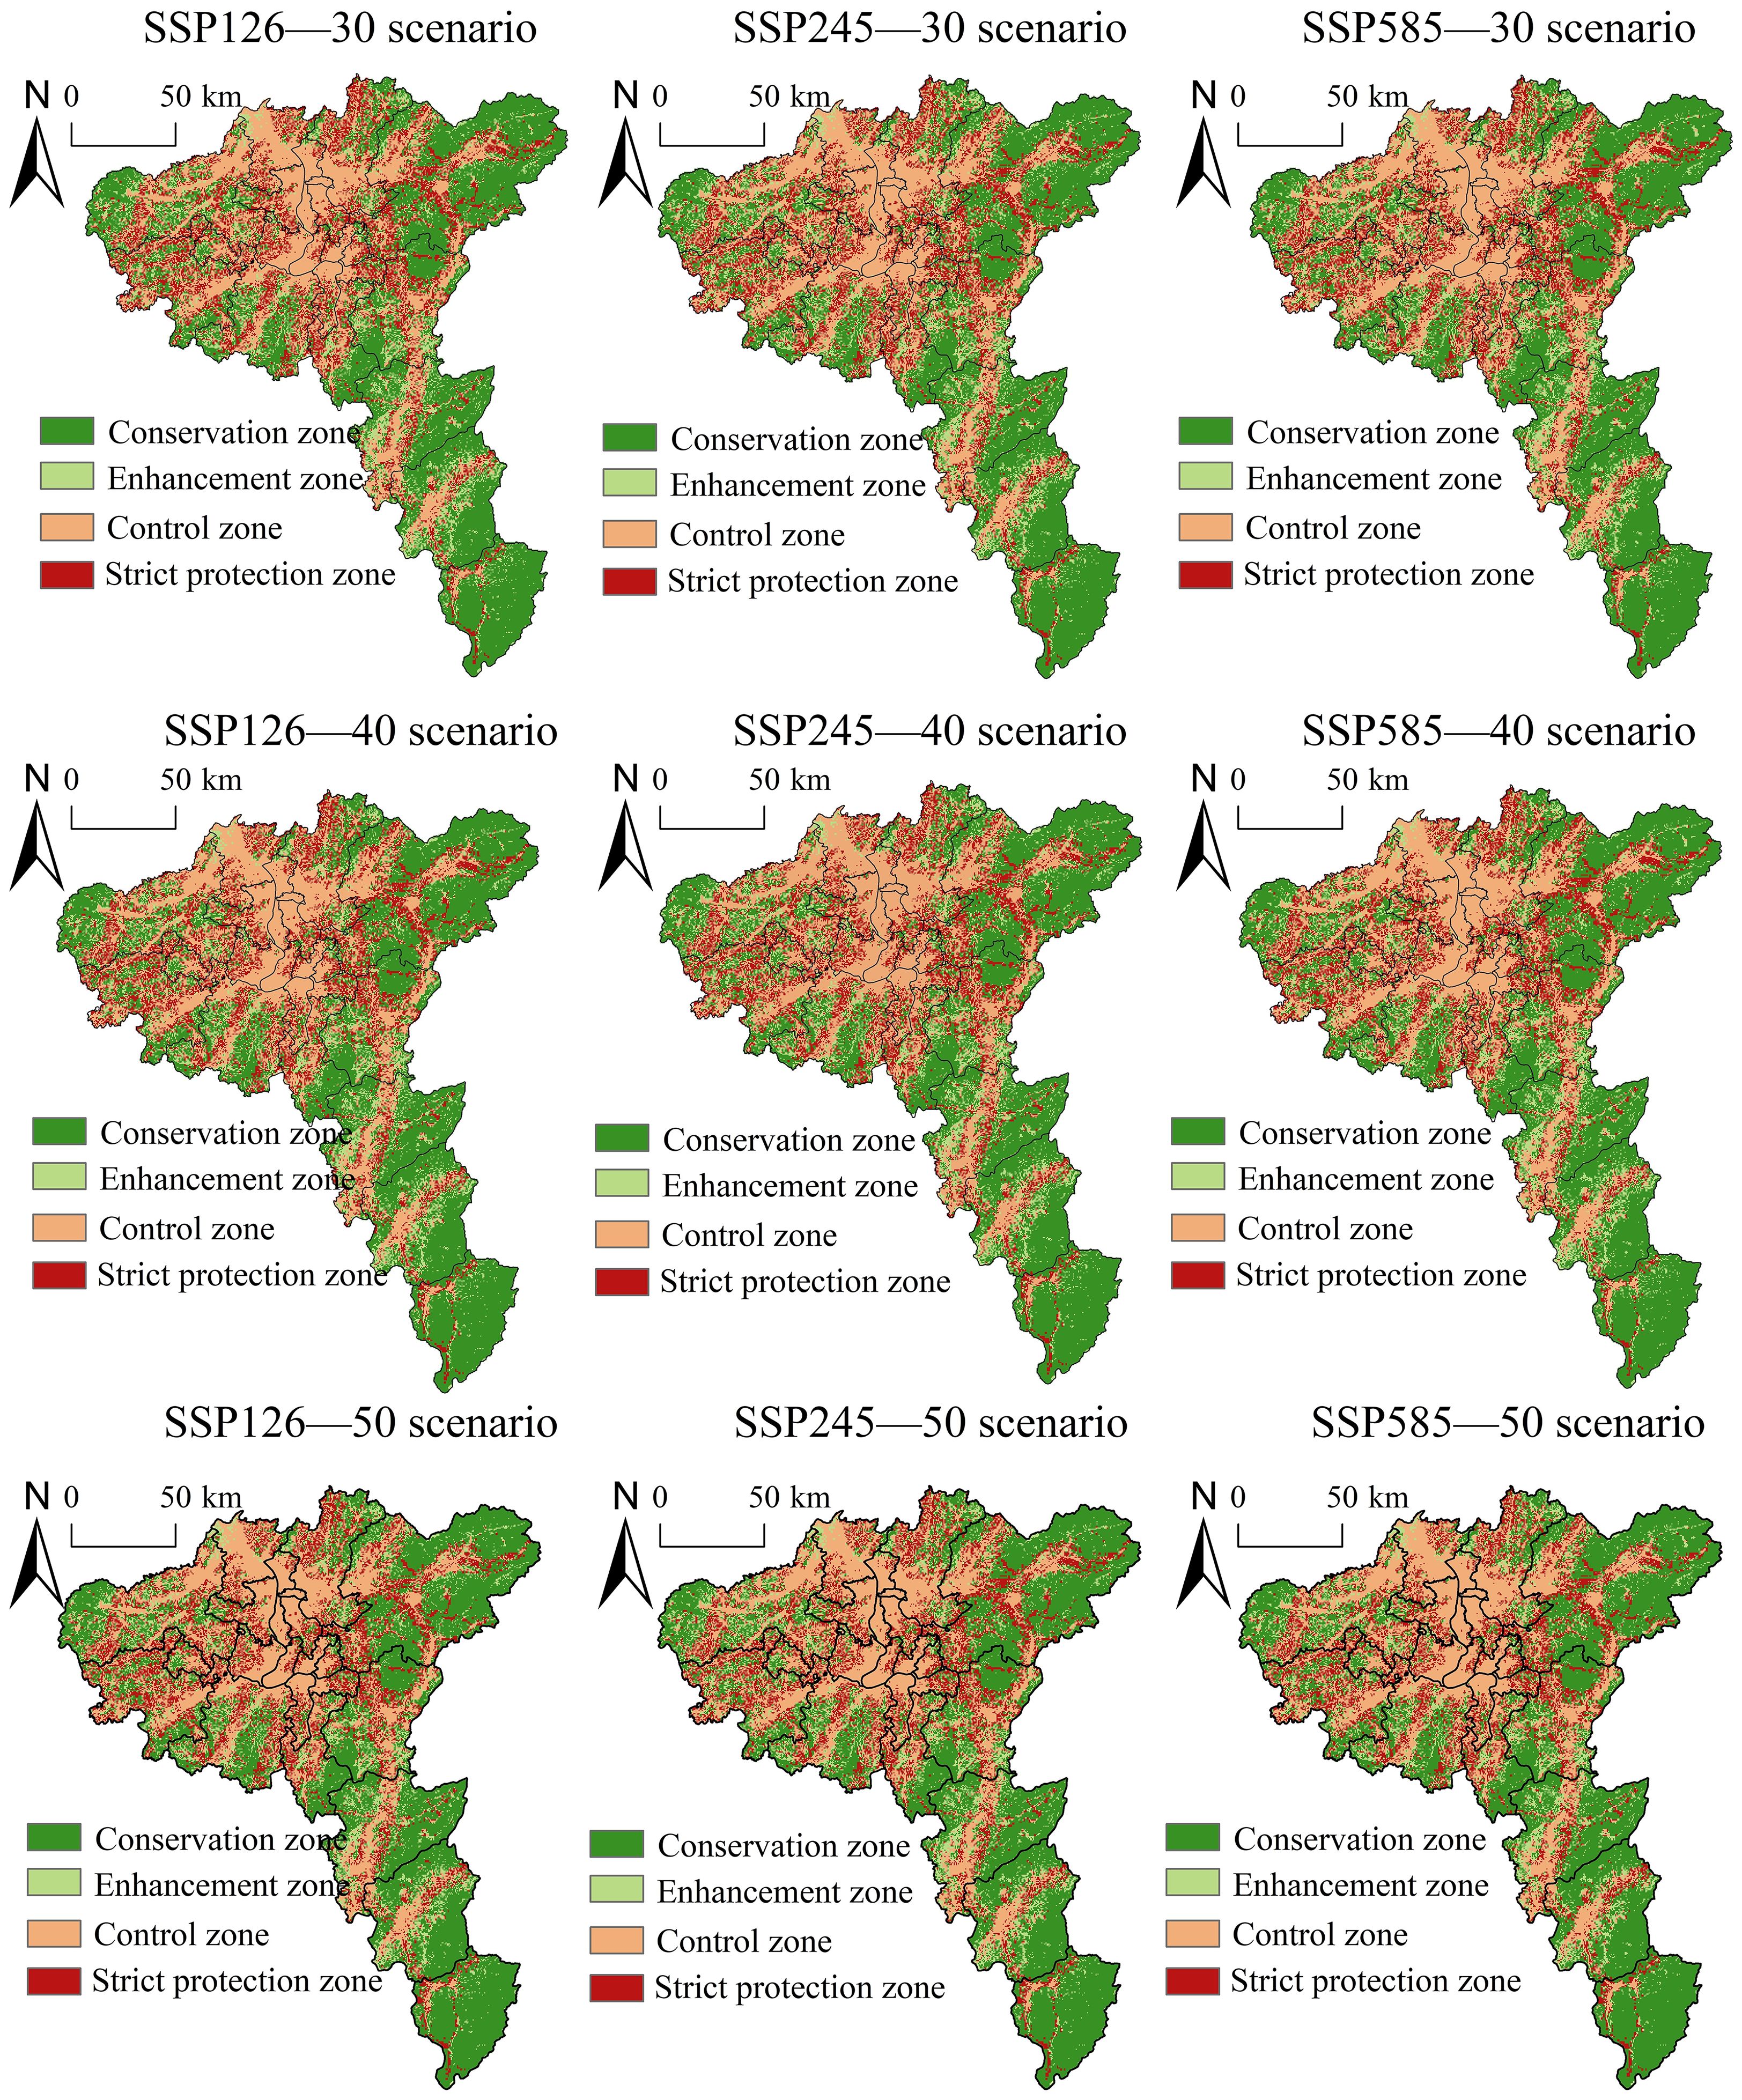
Figure 10. Spatial distribution patterns of ecological zones under multiple scenarios.
Further analysis of the phased changes under each scenario reveals the following: The ecological control zone exhibits varying area changes across different scenarios. Under SSP126, it first contracts by 60.25 km² (2030–2040) and then expands by 32.50 km² (2040–2050). Under SSP245, it continuously contracts, decreasing by 38.50 km². Under SSP585, it shows a phased expansion pattern—first shrinking by 7.75 km², then increasing by 26.00 km². The relatively stable trend under SSP126 and SSP245 is linked to stricter ecological policies that constrain urban expansion. In contrast, the SSP585 scenario reflects higher urban development pressure and weaker ecological controls, leading to an increase in ecological risk and the expansion of the control zone. As the largest and most ecologically stable zone (>40%), the Ecological Conservation Zone serves as a natural ecological buffer dominated by forest. Under SSP126, it increases by 167.50 km² from 2030 to 2040, followed by a slight contraction of 8.75 km² from 2040 to 2050. In the SSP245 and SSP585 scenarios, the Ecological Conservation Zone continues to expand, with total increases of 175.50 km² and 166.50 km², respectively, suggesting that moderate to high development paths can still accommodate the preservation of core ecological areas under certain land-use controls. A strict Ecological Protection Zone between conservation areas and urban development is highly sensitive to ecological disturbance. The Strict Ecological Protection Zone decreases in all scenarios: by 0.21% under SSP126, 0.04% under SSP245, and 0.34% under SSP585, relative to 2020. The sharpest decline occurs in SSP585, where accelerated urban boundary expansion causes spatial compression, ecological degradation, and rising risk levels in already vulnerable zones. The Ecological Enhancement Zone is mainly found in fragmented patches along the edges of the conservation zone. In all scenarios, its area decreases steadily: by 0.09% (SSP126), 0.14% (SSP245), and 0.18% (SSP585). Due to its low ecosystem health status, the forest is more susceptible to conversion into construction land, resulting in limited ecological restoration potential and continuous spatial loss.
To further reveal spatial distribution differences in ecological zoning across multiple scenarios, this study analyzes the center of gravity distribution, migration trajectories, and hot and cold spot regions for the ecological control zone and ecological conservation zone (Figure 11). The center of gravity for the ecological control zone is located in Yutang District, Xiangtan City. Under SSP126 and SSP585 scenarios, the migration direction shifts from northwest to southeast, whereas under SSP245 it reverses from southeast to northwest, with migration speeds increasing across all scenarios. The standard deviation ellipse rotation angle across scenarios is approximately 150°, with the major axis about 1.4 times the minor axis, indicating pronounced northwest-to-southeast diffusion associated with urban economic gradient zones. Hotspot areas are concentrated in Changsha, Liuyang, and Chaling, with more extensive regional expansion under SSP585 than under SSP126. Cold spots are mainly located in You County, with regional changes under SSP585 showing weaker contraction compared to SSP126. These results suggest that the expansion of construction land and industrial agglomeration significantly affects the ecological conservation zone. The center of gravity for ecological conservation zones is located in Liling City. Under the SSP126 scenario, its migration direction is from northwest to southeast. Under the SSP245 and SSP585 scenarios, the migration direction shifts to northwest to southwest, with the latter showing a faster migration rate. The standard deviation ellipse rotation angle across scenarios is approximately 160°, with the major axis about 1.6 times the minor axis. This reflects pronounced northwest-to-southeast diffusion, consistent with regional mountain and river distributions. Hotspot areas are relatively dispersed across scenarios, though You, Yanling, and Chaling show persistent expansion. Cold spots are most evident in Liuyang and contract with increasing emission intensity. These findings indicate that ecological conservation zones are shaped by the combined influence of natural geography, human activities, and ecological policies. Therefore, analyzing the spatial response mechanisms of ecological zoning under different development pathways is essential for designing ecological zoning governance and protection policies, and for promoting more coordinated human–land relationships in the region.
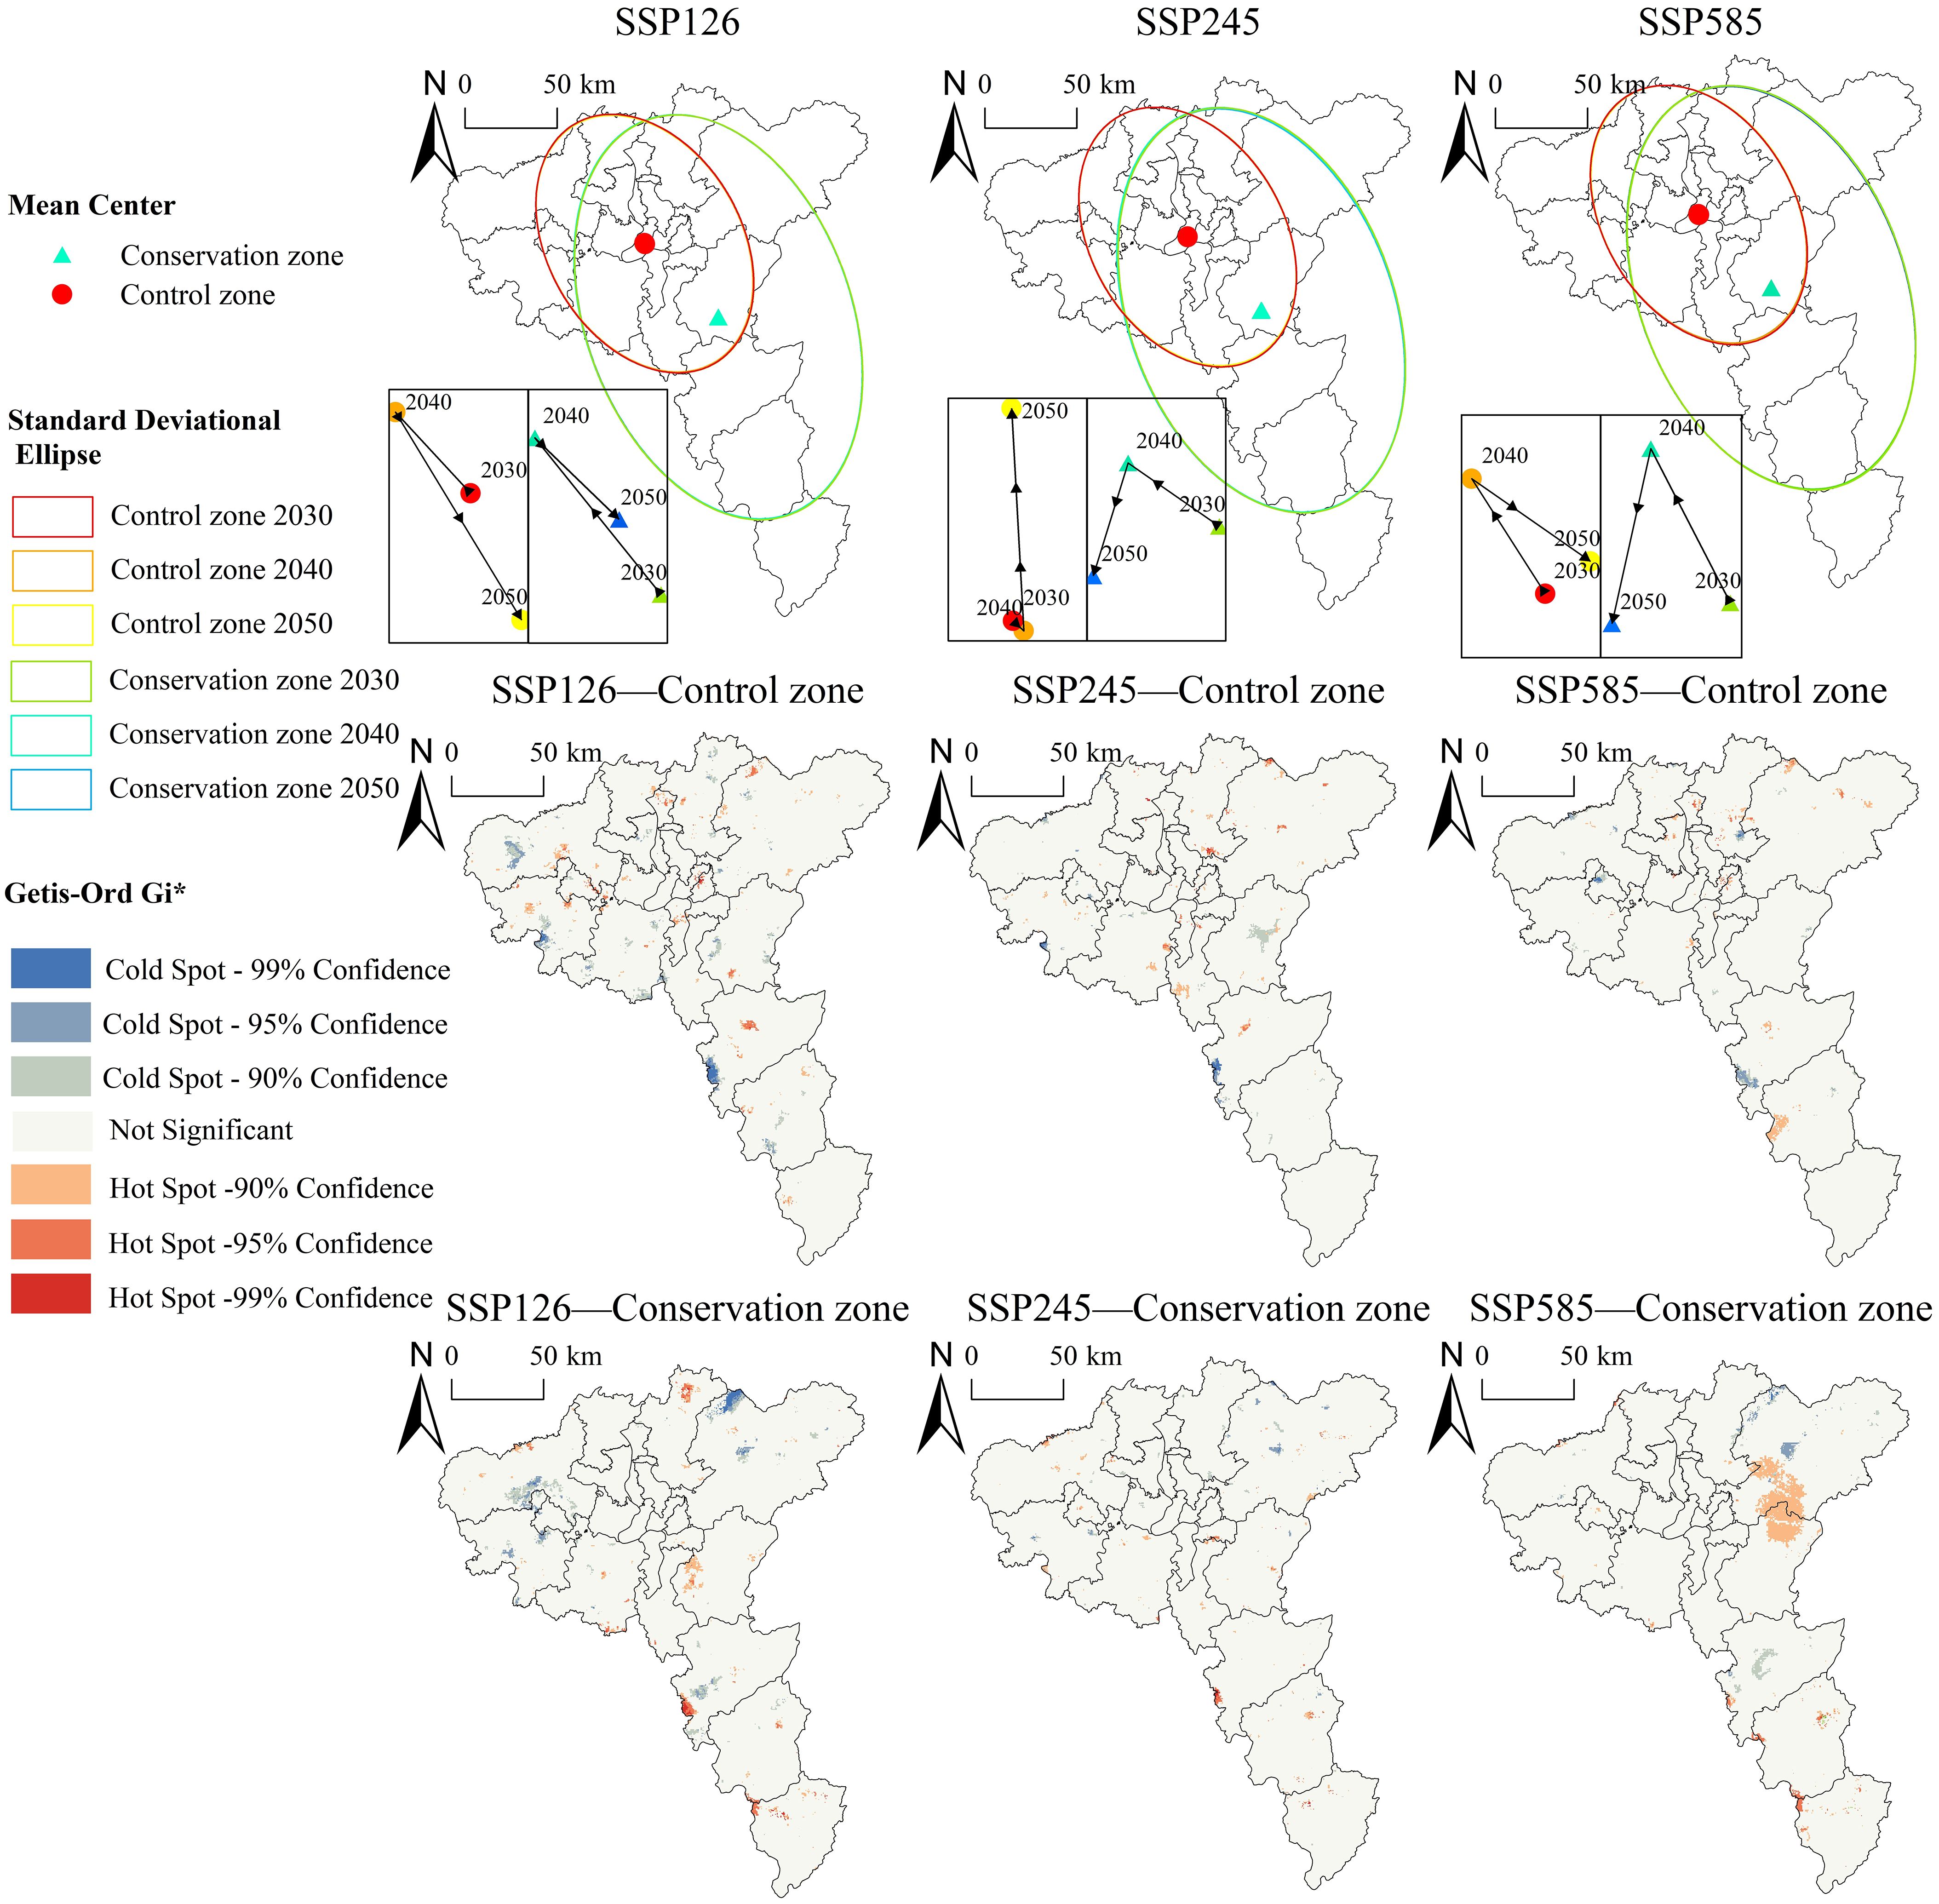
Figure 11. Distribution of centroid locations, movement trajectories, and hot/cold spot areas in ecological control zones and ecological conservation zones under multiple scenarios.
3.3 Ecological zoning control measures
Based on the characteristics, historical evolution, and projected trends of ecological zones, this study proposes targeted control strategies to support regional sustainable development and enhance ecosystem resilience.
The ecological control zone covers a relatively large area with high urbanization levels, characterized by dense population and concentrated economic activities. This spatial concentration exerts substantial pressure on the surrounding ecological environment, leading to landscape fragmentation and heightened ecological risks. Under all SSP scenarios—particularly SSP585—this zone is projected to expand, thereby intensifying potential ecological threats. To address these challenges, the zone should leverage its spatial structure of “central core with radial extensions and clustered satellite districts” to promote intensive and efficient land use in surrounding areas. A zoning-based and classified land use management system should be established, coupled with strict controls on construction intensity. It is also essential to delineate urban growth boundaries and ecological buffer zones based on scientific assessments. Furthermore, the implementation of ecological risk assessment and early warning mechanisms will be crucial for strengthening the zone’s capacity to cope with intensive development and preventing further ecological degradation.
The ecological conservation zone serves as a vital barrier for maintaining regional ecological security, characterized by relatively stable structures and fully functional ecosystems. To maximize its ecological advantages, green economic activities—such as camellia oil cultivation and eco-tourism—should be promoted to foster synergies between ecological protection and local economic development. At the same time, site-specific green infrastructure should be developed, ecological corridors and networks constructed, and landscape connectivity strengthened to improve ecosystem self-regulation and resilience.
The Strict ecological conservation zone is highly vulnerable to disturbances from urban expansion due to the sensitivity and fragility of its ecosystems. Strengthening environmental protection policies is essential to support ecological restoration and risk mitigation. A robust protection framework should be implemented, incorporating comprehensive risk prevention and control systems, stricter enforcement of ecological redlines, and stringent regulation of construction activities. In addition, an integrated ecological management system should be developed for transitional urban–rural areas to enhance their buffering capacity and ecological barrier functions.
The ecological enhancement zone experiences relatively low levels of human disturbance and land use intensity, yet it possesses significant ecological restoration potential. Across all scenarios, however, its area is projected to decline, and its spatial distribution is expected to become increasingly fragmented due to encroachment from surrounding zones. To counter this trend, a strategy that integrates natural succession with moderate human intervention is recommended. Low-disturbance land use approaches—such as green agriculture and ecological forestry—should be encouraged. In addition, land consolidation and the restoration of fragmented patches are necessary to strengthen ecological recovery and enhance the provision of ecosystem services.
4 Discussion
4.1 LER response to land use change under multiple scenarios
Under the interaction of human activities and natural processes, changes in land use composition, structure, and function directly affect the level of LER, highlighting the close relationship between land use dynamics and LER’s spatial–temporal patterns (Guo et al., 2024). The study employed a combined subjective and objective weighting method to comprehensively calculate the weight values for each evaluation factor, ensuring both the comprehensiveness and objectivity of weight assignment (Zhang et al., 2023b).
This study finds that forest consistently dominates the land use structure (approximately 60%) and corresponds to regions with predominantly medium and medium-low LER. This indicates the risk-buffering function of forests, consistent with the findings of Li (Li et al., 2025) and Liu (Liu and Tang., 2024). The former emphasizes forest stability and resistance to disturbance, while the latter argues that the loss of ecological land (forest, grassland, and water body) compromises hydrological functions and ecosystem services, posing a threat to ecological security. Wu (Wu et al., 2022) also demonstrates that forest possess strong structural stability and ecological connectivity, enabling self-regulation under pressure. Scenarios oriented toward sustainability (SSP126) preserve more ecological land and show slower increases in ecological risk. Under SSP245, 16.52% of the area falls within high and medium-high risk levels, with 63.94% of the land still classified as ecological land. This suggests that moderate land development and strong ecological protection policies (e.g., ecological redlines) help maintain ecosystem resilience and suppress systemic degradation. Li (Li et al., 2020b) further confirms that projected LER increases are closely linked to land use and climate change, supporting the reliability of the scenario-based simulations presented in this study. This is consistent with the findings of Wang (Wang and Zhang, 2023b), which confirmed that policy interventions, ecological conservation efforts, and technological innovations can effectively enhance land intensification and mitigate ecological risks.
From 2000 to 2020, the area of construction land expanded from 650.17 km² to 1,633.74 km², representing an increase of 60.20%. Under the SSP585 scenario, the expansion of construction land by 1.63 times by 2050 leads to ecological patch fragmentation caused by imbalanced land conversion and ecological regulation. The increase and outward spread of medium-to-high risk zones indicate that the expansion of construction land is a key driver of the rising LER value. This aligns with the findings of Shaker UI Din (UI Din and Mak, 2021) and Addis Bikis (Bikis et al., 2025). Zhang (Zhang et al., 2023a) also emphasized that urban expansion occupies portions of cultivated land, forest, and grassland, thereby triggering soil erosion and contamination, increasing landscape heterogeneity, and exacerbating ecological risks.
4.2 EHI response to land use change under multiple scenarios
The expansion of construction land and the reduction of ecological land are the primary drivers of regional ecosystem health deterioration (Saifullah et al., 2016). From 2000 to 2020, construction land expanded 2.52 times. This process was partly stimulated by the region’s designation as a national pilot zone for ecological reform in 2007, which spurred rapid economic growth but simultaneously intensified ecological land fragmentation (forest, grassland, and water bodies), thereby weakening ecosystem structure and resilience. Consequently, the EHI was dominated by low and medium-low levels, particularly in urban cores and expanding peri-urban areas. This pattern corroborates the findings of Zhu (Zhu et al., 2025) and Chen (Chen, et al., 2022b). The former highlighted that urbanization heightens land use pressure, causing ecological resource loss and patch fragmentation, while the latter reported cold spot aggregation in economic core areas dominated by construction land.
Simulation results indicate that future expansion of construction land will continue to erode ecological land across all SSP scenarios, leading to further degradation of ecosystem health. This outcome aligns with Tu (Tu et al., 2023) and Wu (Wu et al., 2024b), whose studies in the Greater Bay Area demonstrated that land development under SSP scenarios degrades habitat quality and ecological security. Under SSP126 and SSP245, more than 66% of the study area remains within medium and medium-high EHI levels, suggesting a relatively robust ecosystem structure and recovery potential. By contrast, SSP585 exhibits the most pronounced deterioration, with medium-low EHI areas increasing by 2.83%. Construction land is projected to expand to 1.42, 1.32, and 1.56 times its 2020 extent under SSP126, SSP245, and SSP585, respectively, further reducing ecosystem organization and service functions. This is consistent with Pan (Pan et al., 2020), who argued that urban expansion leads to a decline in ecosystem organization and service functions, thereby causing a continuous decline in EHI, which also confirms the accuracy of the results of this study. Similar evidence has been reported elsewhere: Yimuranzi (Yimuranzi et al., 2023) identified construction land expansion as the primary cause of ecological quality decline in the northern foothills of the Tianshan Mountains, while Zhang (Zhang et al., 2023c) emphasized that ecological land enhances connectivity among habitat patches and strengthens ecosystem vitality and service functions by increasing vegetation cover.
4.3 Advantages and applicability
Research integrating the SD-PLUS model facilitates the assessment of land-use changes and the prediction of future spatial distributions. The SD model simulates shifts in land use under different scenarios, while the PLUS model dynamically analyzes spatial patterns of land use. Their combination enables long-term land-use simulations under SSP-RCP scenarios. Compared with the direct use of the LUH2 dataset (spatial resolution 0.25°) (Kim et al., 2018), the SD-PLUS model generates higher-resolution land use projections, thereby capturing finer details of local land use dynamics and ecosystem changes. The model’s land use simulation results were validated against actual 2020 land use data, yielding a Kappa coefficient of 0.833 (Kappa > 0.8) and an overall accuracy of 0.912. These results indicate high simulation precision and reliability in modeling both land use structure types and spatial distribution patterns. Based on existing research (Wang and Zhang, 2023b), with ecological red lines as constraints, and using 1.25 times and 1.68 times the existing road network plus new expressways as driving factors, we simulated the structural types and spatial distribution of land use in 2050 under the SSP585 scenario. The results showed that both the Kappa coefficient and the overall accuracy exceeded 0.93, while Moran’s I index (for construction land) remained stable at around 0.83. This demonstrates that the model has high simulation accuracy and a relatively stable spatial distribution, providing reliable predictive outcomes. Given that the coarse resolution of global SSP–RCP scenarios may introduce significant uncertainty in regional-scale studies, we improved, adjusted, and localized the SSP-RCP scenarios based on prior research (Zhong et al., 2023). The land-use expansion ratio was applied as the transition matrix, while major river basins (areas > 0.8 km²), important ecological health patches, and connectivity patches (ecological corridors) were set as constraints. This approach enhances the model’s ability to capture regional ecological processes and spatial heterogeneity, thereby improving the plausibility and applicability of the prediction results.
By simulating future ecological zoning across multiple scenarios, potential ecological risk areas and their evolutionary trends can be effectively identified, providing support for establishing a dynamic and precise spatial control system and regional sustainable development (Lyu et al., 2022; Liu et al., 2019). This study employs LER and EHI as complementary perspectives for assessing ecosystem status, respectively capturing ecosystem sensitivity to external disturbances and the internal stability of the system (Zhang et al., 2025). The expansion of construction land leads to landscape fragmentation and habitat loss, which elevates LER. Simultaneously, the reduction of cultivated land and the fragmentation of forests weaken ecosystem service functions, resulting in a decline in EHI levels (Chen and Ning., 2024b). In the main urban area and surrounding regions, this compounding effect of “rising risk and declining health” is particularly evident, forming a coupled pattern of high risk and low health. In contrast, while forested areas in peripheral mountainous regions act as natural barriers, intensifying human disturbances have pushed natural carrying capacity to its limits. This is particularly evident in fragmented, steep-sloped marginal zones where severe soil erosion and land degradation pose critical challenges to regional ecological security. Under the SSP126 scenario, limiting the expansion of construction land effectively mitigates the upward trend of LER, resulting in an average EHI reduction of 6.25%. Under the SSP245 scenario, risk and health exhibit a more complex and contradictory relationship. Under the SSP585 scenario, rapid urbanization accelerates ecological risks and significantly damages ecological health, with an average EHI reduction of 8.97%. This indicates a tighter negative coupling between the two indicators, confirming that land use dynamics are the core driver of the coupled evolution of LER and EHI. Moreover, the underlying mechanisms of this coupling differ significantly across development pathways.
4.4 Limitation
First, although LER assessments comprehensively account for factors such as economic development and population density, the driving mechanisms of LER vary greatly across regions. A unified indicator system struggles to fully capture regional characteristics. Future research should integrate environmental factors (e.g., proximity of industrial land and construction land, urban form, and frequency of ecological pollution incidents) with socioeconomic factors (e.g., agricultural output, industrial output, and land utilization rates) to establish a more comprehensive evaluation framework. Ecological zoning research based on the dual dimensions of LER and EHI effectively reflects risk sensitivity and system stability but omits critical elements such as ecological service value and socio-ecological resilience. Future research should develop a multidimensional coupled indicator system integrating LER–EHI–ESV–REI. By employing methods such as geographically weighted regression (GWR) and random forest, it will be possible to explore the spatial patterns, driving mechanisms, and spillover effects of ecological zoning in greater depth. This approach will enhance both the theoretical foundation and the practical application of ecological zoning assessments.
Second, to focus on climate–economic scenario simulations, the transportation network component within the SD-PLUS model was parameterized using static data from 2020. Although policy documents such as the Hunan Provincial Territorial Spatial Plan (2021–2035), the Changsha–Zhuzhou–Xiangtan Ecological Green Heart High-Level Protection and High-Quality Development Plan (2024–2035), the Hunan Provincial Expressway Network Plan (2024–2035), and the Hunan Provincial Highway Network Layout Plan (2021–2050) were incorporated, and sensitivity tests were conducted to strengthen model robustness and predictive validity, some uncertainty remains. Future research could adopt kernel density methods to calculate urban road network density expansion rates, thereby improving prediction accuracy.
Third, SSP-RCP data are provided at a kilometer-level spatial resolution, which makes it difficult to capture fine-scale local variations. Scenario projections inherently involve uncertainty, and actual developments may deviate from simulated trajectories. The relationship between land use and ecological responses depends on empirical models that cannot fully incorporate all ecological processes and nonlinear feedbacks. In addition, both the data and models themselves contain inherent errors and uncertainties. Future studies should consider integrating high-resolution remote sensing imagery and refined socioeconomic data, employing multi-source fusion techniques to improve simulation accuracy and decision-support capacity.
5 Conclusions
This study assessed land use changes, LER, and EHI from 2000 to 2020 in the CZXUA and projected future ecological zoning patterns under SSP126, SSP245, and SSP585 scenarios. The main conclusions are as follows:
From 2000 to 2020, land use was dominated by forest (accounting for more than 60% of the total area), followed by cultivated land and construction land. The cumulative area of cultivated land transferred out reached 1,029.37 km², mainly converted into construction land (555.65 km²) and forest (394.97 km²). Forest was the second most transferred type, with a cumulative area of 890.88 km², mainly converted into construction land (466.22 km²) and cultivated land (362.87 km²). Other land use exhibited relatively small conversion magnitudes. The total area of cultivated land converted in the two study phases remained almost unchanged (712.36 km² and 711.22 km², respectively). In the earlier phase, cultivated land was primarily converted into construction land, whereas in the later phase, the area converted to construction land decreased while forest conversion increased.
LER was mainly characterized by medium and medium-low risk levels, accounting for 76.98%, 74.40%, and 63.48% of the total area, respectively. The areas of low, medium-low, and medium risk gradually declined, while the area of medium-high risk continued to expand. The spatial distribution of LER showed a pattern of “high in the center and low at the edges.” High-risk areas were concentrated in the central urban construction zones, with patches distributed in clumps and strips, largely consistent with construction land and transportation networks. Medium-high and medium risk areas were located in the transitional zones between urban centers and peripheral counties, while medium-low and low-risk areas were found in peripheral counties with stronger ecological foundations.
The spatial distribution of EHI presented a concentric structure of “low in the center and high at the edges.” High and medium-high values were concentrated in peripheral counties dominated by forest and grassland. Medium and medium-low values, dominated by cultivated land, accounted for more than 52% of the total area, forming the core of the regional ecological pattern. Low values were mainly concentrated in central urban districts dominated by construction land. Overall, ecological health declined from 2000 to 2020. The EHI of forest, water body, and grassland decreased by 6.29%, 4.21%, and 1.97%, respectively, with forest showing the most severe degradation. The EHI of cultivated land first increased and then decreased, while bare land showed the opposite trend. The EHI of construction land continuously declined, with a total reduction of 22.15%.
During 2000–2020, the proportion of Ecological conservation zones remained above 40%. The overlapping area and proportion with legally designated protected areas remained high with minimal fluctuations, contributing to ecosystem stability and ecological services. Ecological control zones ranked second in area proportion, with 19,875 km² and 18,175 km² transferred to Strict ecological conservation zones and ecological enhancement zones, respectively. However, their overlapping areas and proportions with statutorily protected areas fluctuated, highlighting the need for enhanced coordination between ecological conservation and land use management. Strict ecological conservation zones experienced a continuous decline in area proportion, with more pronounced fluctuations in overlapping areas and proportions with statutory protected areas, requiring close monitoring of ecological restoration and protection functions. Ecological enhancement zones accounted for the smallest proportion, but their overlapping areas and proportions with legally designated protected areas continuously increased, indicating that strengthened ecological conservation efforts are gradually restoring ecological functions.
Under future scenarios, ecological control zones are projected to expand, with hotspot areas showing notable growth and cold spot areas experiencing reduced contraction. Urban expansion boundaries and ecological buffer zones should be delineated based on their “central-radial + clustered distribution” spatial structure, while ecological risk assessment and early warning systems should be established. Ecological conservation zones are projected to shrink, with hotspots becoming more dispersed and cold spots contracting more significantly. Local ecological resources should be utilized to foster a green economy, develop ecological corridors and networks, and improve patch connectivity and system self-regulation. Strict ecological conservation zones require strengthened conservation policies and red-line constraints, with rigorous protection and risk prevention systems. Ecological enhancement zones should integrate natural succession with moderate human intervention, promoting low-disturbance agroforestry and habitat restoration to enhance ecological service provision and system recovery capacity.
Data availability statement
The original contributions presented in the study are included in the article/supplementary material. Further inquiries can be directed to the corresponding authors.
Author contributions
HP: Visualization, Formal Analysis, Writing – review & editing, Writing – original draft, Methodology, Software, Conceptualization. HL: Writing – review & editing, Formal Analysis, Visualization. YZ: Writing – review & editing, Investigation, Visualization. WW: Writing – review & editing, Formal Analysis, Validation. QH: Data curation, Conceptualization, Writing – review & editing. PL: Funding acquisition, Writing – review & editing, Supervision. YY: Supervision, Writing – review & editing, Funding acquisition, Project administration.
Funding
The author(s) declare financial support was received for the research, authorship, and/or publication of this article. This research was funded by the Key Disciplines of State Forestry Administration of China (No. 21 of Forest Ren Fa, 2016); and the Hunan Province”Double First-Class”Cultivation discipline of China (No. 469 of Xiang Jiao Tong, 2018); National Long-term Research Base for Landscape Architecture in Qingxiu Mountain, Guangxi Nanning (No. 96 of Forestry Science and Technology Development, 2021); Postgraduate Scientific Research Innovation Project of Hunan Province(grant number CX20240712); Central South University of Forestry and Technology 2024 Graduate Student Science and Technology Innovation Fund (grant number 2024CX01009).
Acknowledgments
We would like to thank the reviewers and editors for their valuable comments.
Conflict of interest
The authors declare that the research was conducted in the absence of any commercial or financial relationships that could be construed as a potential conflict of interest.
Generative AI statement
The author(s) declare that no Generative AI was used in the creation of this manuscript.
Any alternative text (alt text) provided alongside figures in this article has been generated by Frontiers with the support of artificial intelligence and reasonable efforts have been made to ensure accuracy, including review by the authors wherever possible. If you identify any issues, please contact us.
Publisher’s note
All claims expressed in this article are solely those of the authors and do not necessarily represent those of their affiliated organizations, or those of the publisher, the editors and the reviewers. Any product that may be evaluated in this article, or claim that may be made by its manufacturer, is not guaranteed or endorsed by the publisher.
References
Babí Almenar J., Petucco C., Sonnemann G., Geneletti D., Elliot T., Rugani B., et al. (2023). Modelling the net environmental and economic impacts of urban nature-based solutions by combining ecosystem services, system dynamics and life cycle thinking: An application to urban forests. Ecosystem Services. 60, 101506. doi: 10.1016/j.ecoser.2022.101506
Bai H. N. and Weng L. F. (2023). Ecological security pattern construction and zoning along the China-Laos Railway based on the potential-connectedness-resilience framework. Ecol. Indic. 146, 109773. doi: 10.1016/j.ecolind.2022.109773
Bao T. T., Wang R. F., Song L. H., Liu X. J., Zhong S. W., Liu J., et al. (2022). Spatio-temporal multi-scale analysis of landscape ecological risk in Minjiang river basin based on adaptive cycle. Remote Sens. 14, 5540. doi: 10.3390/rs14215540
Bikis A., Engdaw M., Pandey D., and Pandey B. K. (2025). The impact of urbanization on land use land cover change using geographic information system and remote sensing: a case of Mizan Aman City Southwest Ethiopia. Sci. Rep. 15, 12014. doi: 10.1038/s41598-025-94189-6, PMID: 40199909
Chen G. Z., Li X., Liu X. P., Chen Y. M., Liang X., Leng J. Y., et al. (2020a). Global projections of future urban land expansion under shared socioeconomic pathways. Nat. Commun. 11, 537. doi: 10.1038/s41467-020-14386-x, PMID: 31988288
Chen W. X., Gu T. C., Xiang J. W., Luo T., Zeng J., and Yuan Y. H. Y. (2024a). Ecological restoration zoning of territorial space in China: An ecosystem health perspective. J. Environ. Manage. 364, 121371. doi: 10.1016/j.jenvman.2024.121371, PMID: 38879965
Chen Y., Guo F., Wang J., Cai W., Wang C., and Wang K. (2020b). Provincial and gridded population projection for China under shared socioeconomic pathways from 2010 to 2100. Sci. Data 7, 1–13. doi: 10.1038/s41597-020-0421-y, PMID: 32152299
Chen W. X., Liu Z. L., Li J. F., Ran D., and Zeng J. (2020c). Mapping the spatial relationship between ecosystem services and urbanization in the middle reaches of the Yangtze River Urban Agglomerations. Acta Ecologica Sin. 40, 5137–5150. doi: 10.5846/stxb201809212065
Chen Q. B. and Ning Y. (2024b). Projecting LUCC dynamics and ecosystem services in an emerging urban agglomeration under SSP-RCP scenarios and their management implications. Sci. Total Environ. 949, 175100. doi: 10.1016/j.scitotenv.2024.175100, PMID: 39084394
Chen X. D., Yang Z. P., Wang T., and Han F. (2022a). Landscape ecological risk and ecological security pattern construction in world natural heritage sites: A case study of Bayinbuluke, Xinjiang, China. ISPRS Int. J. Geo-Inf. 11, 328. doi: 10.3390/ijgi11060328
Chen W. X., Zhao X. L., Zhong M. X., Li J. F., and Zeng J. (2022b). Spatiotemporal evolution patterns of ecosystem health in the Middle Reaches of the Yangtze River Urban Agglomerations. Acta Ecologica Sin. 42, 138–149. doi: 10.5846/stxb202012093142
Costanza R., d'Arge R., de Groot R., Farber S., Grasso M., Hannon B., et al. (1997). The value of the world's ecosystem services and natural capital. Nature 387, 253–260. doi: 10.1038/387253a0
Das M., Das A., and Mandal A. (2023). Exploring the factors affecting urban ecological risk: A case from an Indian mega metropolitan region. Geosci. Front. 14, 101488. doi: 10.1016/j.gsf.2022.101488
Du L. D., Dong C., Kang X. C., Qian X. L., and Gu L. X. (2023). Spatiotemporal evolution of land cover changes and landscape ecological risk assessment in the Yellow River Basin 2015–2020. J. Environ. Manage 332, 117149. doi: 10.1016/j.jenvman.2022.117149, PMID: 36808004
Gao B. B., Li C., Wu Y. M., Zhen K. J., and Wu Y. (2021). Landscape ecological risk assessment and influencing factors in ecological conservation area in Sichuan-Yunnan provinces, China. Chin. J. Appl. Ecol. 32, 1603–1613. doi: 10.13287/j.1001-9332.202105.018, PMID: 34042354
Gou M. M., Li L., Ouyang S., Wang N., La L. M., Liu C. F., et al. (2021). Identifying and analyzing ecosystem service bundles and their socioecological drivers in the Three orges Reservoir Area. J. Clean. Prod. 307, 127208. doi: 10.1016/j.jclepro.2021.127208
Guo J. P., Li F. Y. H., Tuvshintogtokh I., Niu J. M., Li H. X., Shen B. B., et al. (2024). Past dynamics and future prediction of the impacts of land use cover change and climate change on landscape ecological risk across the Mongolian plateau. J. Environ. Manage. 355, 120365. doi: 10.1016/j.jenvman.2024.120365, PMID: 38460328
Han P. Y., Hu H. Z., Zhou J. Y., Wang M., and Zhou Z. X. (2024). Integrating key ecosystem services to study the spatio-temporal dynamics and determinants of ecosystem health in Wuhan’s central urban area. Ecol. Indic. 166, 112352. doi: 10.1016/j.ecolind.2024.112352
Jiang S. W., Feng F., Zhang X. N., Xu C. Y., Jia B. Q., and Lafortezza R. (2024). Ecological transformation is the key to improve ecosystem health for resource-exhausted cities: A case study in China based on future development scenarios. Sci. Total Environ. 921, 171147. doi: 10.1016/j.scitotenv.2024.171147, PMID: 38395169
Jing P. Q., Zhang D. H., Ai Z. M., and Guo B. (2021). Natural landscape ecological risk assessment based on the three-dimensional framework of pattern-process ecological adaptability cycle: a case in Loess Plateau. Acta Ecol. Sin. 41, 7026–7036. doi: 10.5846/stxb202012173213
Kesgin Atak B. and Ersoy Tonyaloğlu E. (2020). Monitoring the spatiotemporal changes in regional ecosystem health: a case study in Izmir, Turkey. Environ. Monit Assess. 192, 385. doi: 10.1007/s10661-020-08357-4, PMID: 32435904
Kim H., Rosa I. M., Alkemade R., Leadley P., Hurtt G., Popp A., et al. (2018). A protocol for an intercomparison of biodiversity and ecosystem services models using harmonized land-use and climate scenarios. Geosci. Model. Dev. 11, 4537–4562. doi: 10.5194/gmd-114537-2018
Lei J. J., Li C. S., and Yang W. N. (2023). Ecosystem health assessment and approaches to improve Sichuan Province based on an improved vigor organization resilience model. Ecol. Indic. 155, 110925. doi: 10.1016/j.ecolind.2023.110925
Li T., Dong Y. X., and Liu Z. H. (2020a). A review of social-ecological system resilience: Mechanism, assessment and management. Sci. Total Environ. 723, 138113. doi: 10.1016/j.scitotenv.2020.138113, PMID: 32224405
Li S. K., He W. X., Wang L., Zhang Z., Chen X. Q., Lei T. C., et al. (2023). Optimization of landscape pattern in China Luojiang Xiaoxi basin based on landscape ecological risk assessment. Ecol. Indic. 146, 109887. doi: 10.1016/j.ecolind.2023.109887
Li X. P., Li S. S., Zhang Y. F., O’Connor P. J., Zhang L. W., and Yan J. P. (2021). Landscape ecological risk assessment under multiple indicators. Land 10, 739. doi: 10.3390/land10070739
Li S. Y., Miao L. J., Jiang Z. H., Wang G. J., Gnyawali K. R., Zhang J., et al. (2020b). Projected drought conditions in Northwest China with CMIP6 models under combined SSPs and RCPs for 2015–2099. Adv. Climate Change Res. 11, 210–217. doi: 10.1016/j.accre.2020.09.003
Li Y. Y., Qin L., Wang Y. H., Liu H., Zhang M., and Hao H. G. (2024a). Ecosystem health assessment of the largest lake wetland in the Yellow River basin using an improved vigor-organization-resilience-services model. Ecol. Indic. 166, 112539. doi: 10.1016/j.ecolind.2024.112539
Li R. W., Sun J., Han G. D., Qi Z. X., Li Y. H., Chen J. H., et al. (2025). Ecological risks linked with ecosystem services in the upper reach of the Yellow River under global changes. J. Integr. Agric. 24, 966–983. doi: 10.1016/j.jia.2024.09.015
Li W. J., Wang Y., Xie S. Y., Sun R. H., and Cheng X. (2020c). Impacts of landscape multifunctionality change on landscape ecological risk in a megacity, China: a case study of Beijing. Ecol. Indic. 117, 106681. doi: 10.1016/j.ecolind.2020.106681
Li H. Q., Zhu Y. L., Tang Y. J., and Song M. J. (2024b). Ecological zoning based on value-risk in the Wuling Mountains Area of Hunan Province. Sustainability 16, 1397. doi: 10.3390/su16041397
Liang X., Guan Q. F., Clarke K. C., Liu S. S., Wang B. Y., and Yao Y. (2021). Understanding the drivers of sustainable land expansion using a patch-generating land use simulation (PLUS) model: a case study in Wuhan, China. Comput. Environ. Urban 85, 101569. doi: 10.1016/j.compenvurbsys.2020.101569
Lin X. and Wang Z. T. (2023). Landscape ecological risk assessment and its driving factors of multi-mountainous city. Ecol. Indic. 146, 109823. doi: 10.1016/j.ecolind.2022.109823
Lin X., Wang Z. T., and Bao Y. (2024a). Integrating ecosystem stress into the assessment of ecosystem health in karst areas and exploring its driving factors. Ecol. Indic. 167, 112662. doi: 10.1016/j.ecolind.2024.112662
Lin Y. Y., Xu X. B., Tan Y., and Chen M. K. (2024b). Multi-scalar assessment of ecosystem-services supply and demand for establishing ecological management zoning. Appl. Geogr. 172, 103435. doi: 10.1016/j.apgeog.2024.103435
Liu Y. X., Li T., Zhao W. W., Wang S., and Fu B. J. (2019). Landscape functional zoning at a county level based on ecosystem services bundle: Methods comparison and management indication. J. Environ. Manage. 249, 109315. doi: 10.1016/j.jenvman.2019.109315, PMID: 31442906
Liu H. and Tang D. W. (2024). Ecological zoning and ecosystem management based on landscape ecological risk and ecosystem services: A case study in the Wuling mountain area. Ecol. Indic. 166, 112421. doi: 10.1016/j.ecolind.2024.112421
Liu Z. H., Zhang G. J., and Fu F. J. (2020). Assessing landscape ecological risk based on landscape pattern and services in Guangzhou during 1990–2015. Acta Ecologica Sin. 40, 3295–3302. doi: 10.5846/stxb201903060425
Lv T. Y., Zeng C., Lin C. X., Liu W. P., Cheng Y. J., and Li Y. B. (2023). Towards an integrated approach for land spatial ecological restoration zoning based on ecosystem health assessment. Ecol. Indic. 147, 110016. doi: 10.1016/j.ecolind.2023.110016
Lyu R., Clarke K. C., Tian X., Zhao W., Pang J., Zhang J., et al. (2022). Land Use Zoning Management to Coordinate the Supply–Demand Imbalance of Ecosystem Services: A Case Study in the City Belt Along the Yellow River in Ningxia, China. Front. Environ. Sci., 10, 911190. doi: 10.3389/fenvs.2022.911190
Mentaschi L., Duveiller G., Zulian G., Corbane C., Pesaresi M., Maes J., et al. (2022). Global long-term mapping of surface temperature shows intensified intra-city urban heat island extremes. Glob. Environ. Change 72, 102441. doi: 10.1016/j.gloenvcha.2021.102441
Murakami D., Yoshida T., and Yamagata Y. (2021). Gridded GDP projections compatible with the five SSPs (Shared socioeconomic pathways). Front. Built Environ. 7. doi: 10.3389/fbuil.2021.760306
Pan Z. Z., He J. H., Liu D. F., and Wang J. W. (2020). Predicting the joint effects of future climate and land use change on ecosystem health in the Middle Reaches of the Yangtze River Economic Belt, China. Appl. Geogr. 124, 102293. doi: 10.1016/j.apgeog.2020.102293
Pan Z. Z., He J. H., Liu D. F., Wang J. W., and Guo X. N. (2021). Ecosystem health assessment based on ecological integrity and ecosystem services demand in the Middle Reaches of the Yangtze River Economic Belt, China. Sci. Total Environ. 774, 144837. doi: 10.1016/j.scitotenv.2020.144837
Peng H. Z., Lou H. C., Liu Y. F., He Q. Y., Zhang M. M., and Yang Y. (2025). Spatial and temporal evolution assessment of landscape ecological resilience based on adaptive cycling in Changsha–Zhuzhou–Xiangtan Urban agglomeration, China. Land 14, 709. doi: 10.3390/land14040709
Peng J., Wang Y. L., Wu J. S., Shen H., and Pan Y. J. (2011). Research progress on evaluation frameworks of regional ecological sustainability. Chin. Geogr. Sci. 21, 496–510. doi: 10.1007/s11769-011-0490-0
Qing L., Fan H. H., Zhang F. Q., Chen W. B., Xia Y. P., and Yan B. (2024). The dominant role of human activity intensity in spatial pattern of ecosystem health in the Poyang Lake ecological economic zone. Ecol. Indic. 166, 112347. doi: 10.1016/j.ecolind.2024.112347
Riahi K., van Vuuren D. P., Kriegler E., Edmonds J., O’Neill B. C., Fujimori S., et al. (2017). The Shared Socioeconomic Pathways and their energy, land use, and greenhouse gas emissions implications: An overview. Global Environ. Change 42, 153–168. doi: 10.1016/j.gloenvcha.2016.05.009
Sadeghi S. H., Chamani R., Silabi M. Z., Tavosi M., Katebikord A., Darvishan A. K., et al. (2023). Watershed health and ecological security zoning throughout Iran. Sci. Total Environ. 905, 167123. doi: 10.1016/j.scitotenv.2023.167123, PMID: 37741382
Saifullah M., Li Z. J., Li Q. L., Zaman M., and Hashim S. (2016). Quantitative estimation of the impact of precipitation and land surface change on hydrological processes through statistical modeling. Adv. Meteorology 1, 6130179. doi: 10.1155/2016/6130179
Song J., Aishan T., and Ma X. (2024). Coupled water-habitat-carbon nexus and driving mechanisms in the Tarim River Basin: A multi-scenario simulation perspective. Ecol. Indic. 167, 112649. doi: 10.1016/j.ecolind.2024.112649
Sun M. Y., Li X. H., Yang R. J., Zhang Y., Zhang L., Song Z. W., et al. (2020). Comprehensive partitions and different strategies based on ecological security and economic development in Guizhou Province, China. J. Clean. Prod. 274, 122794. doi: 10.1016/j.jclepro.2020.122794
Tan J. B., Li A. N., Lei G. B., and Xie X. Y. (2019). A SD-MaxEnt-CA model for simulating the landscape dynamic of natural ecosystem by considering socio-economic and natural impacts. Ecol. Model. 410, 108783. doi: 10.1016/j.ecolmodel.2019.108783
Tian P., Li J. L., Cao L. D., Pu R. L., Gong H. B., Liu Y. C., et al. (2021). Impacts of reclamation derived land use changes on ecosystem services in a typical gulf of eastern China: A case study of Hangzhou bay. Ecol. Ind. 132, 108259. doi: 10.1016/j.ecolind.2021.108259
Tu W., Gao W., Li M. X., Yao Y., He B., Huang Z. D., et al. (2023). Spatial cooperative simulation of land use-population-economy in the Greater Bay Area, China. Int. J. Geographical Inf. Sci. 38, 381–406. doi: 10.1080/13658816.2023.2285459
UI Din S. and Mak H. W. L. (2021). Retrieval of land-use/land cover change (LUCC) maps and urban expansion dynamics of Hyderabad, Pakistan via landsat datasets and support vector machine framework. Remote Sens. 13, 3337. doi: 10.3390/rs13163337
van Vuuren D. P., Edmonds J., Kainuma M., Riahi K., Thomson A., Hibbard K., et al. (2011). The representative concentration pathways: An overview. Climatic Change 109, 5–31. doi: 10.1007/s10584-011-0148-z
Wang S. Q., Chen Y. Y., Jin H. Y., and Li Y. G. (2024). Ecological management zoning based on the causation between ecological risk and ecosystem services in the Gaoligong Mountain. Ecol. Indic. 167, 112673. doi: 10.1016/j.ecolind.2024.112673
Wang Z. Y., Gao Y., Wang X. R., Lin Q., and Li L. (2022a). A new approach to land use optimization and simulation considering urban development sustainability: A case study of Bortala, China. Sustain. Cities Soc. 87, 104135. doi: 10.1016/j.scs.2022.104135
Wang Z. Y., Li X., Mao Y. T., Li L., Wang X. R., and Lin Q. (2022b). Dynamic simulation of land use change and assessment of carbon storage based on climate change scenarios at the city level: A case study of Bortala, China. Ecol. Indic. 134, 108499. doi: 10.1016/j.ecolind.2021.108499
Wang H., Liu X. M., Zhao C. Y., Chang Y. P., Liu Y. Y., and Zang F. (2021). Spatial-temporal pattern analysis of landscape ecological risk assessment based on land use/land cover change in Baishuijiang National nature reserve in Gansu Province, China. Ecol. Indic. 124, 107454. doi: 10.1016/j.ecolind.2021.107454
Wang L. J., Luo G. Y., Ma S., Wang H. Y., Jiang J., and Zhang J. G. (2023a). Integrating landscape ecological risk into ecosystem service value assessment: A case study of Nanjing City. China. Ecol. Indic. 154, 110625. doi: 10.1016/j.ecolind.2023.110625
Wang J., Wang J. M., and Zhang J. N. (2025). Optimization of landscape ecological risk assessment method and ecological management zoning considering resilience. J. Environ. Manage. 376, 124586. doi: 10.1016/j.jenvman.2025.124586, PMID: 39970672
Wang Y. and Zhang L. (2023b). The impact of technology innovation on urban land intensive use in China: evidence from 284 cities in China. Sustainability 15, 3801. doi: 10.3390/su15043801
Wu B. F., Fu Z. J., Fu B. J., Yan C. Z., Zeng H. W., and Zhao W. W. (2024a). Dynamics of land cover changes and driving forces in China’s drylands since the 1970 s. Land Use Policy 140, 107097. doi: 10.1016/j.landusepol.2024.107097
Wu Y. Z., Gu C. Z., and Zhang Y. N. (2022). Towards sustainable management of urban ecological space: A zoning approach hybridized by ecosystem service value and ecological risk assessment. Land 11, 1220. doi: 10.3390/land11081220
Wu Y. F., Wang J. B., and Gou A. P. (2024b). Research on the evolution characteristics, driving mechanisms and multi-scenario simulation of habitat quality in the Guangdong-Hong Kong-Macao greater bay based on multi-model coupling. Sci. Total Environ. 924, 171263. doi: 10.1016/j.scitotenv.2024.171263, PMID: 38417519
Wu X., Zhang J. J., Geng X. L., Wang T., Wang K., and Liu S. D. (2020). Increasing green infrastructure-based ecological resilience in urban systems: A perspective from locating ecological and disturbance sources in a resource-based city. Sustain. Cities Soc. 61, 102354. doi: 10.1016/j.scs.2020.102354
Wu J. S., Zhu Q. L., Qiao N., Wang Z. Y., Sha W., Luo K. Y., et al. (2021). Ecological risk assessment of coal mine area based on “source-sink” landscape theory – A case study of Pingshuo mining area. J. Cleaner Production 295, 126371. doi: 10.1016/j.jclepro.2021.126371
Xie H. L., He Y. F., Choi Y., Chen Q. R., and Cheng H. (2020). Warning of negative effects of land use changes on ecological security based on GIS. Sci. Total Environ. 704, 135427. doi: 10.1016/j.scitotenv.2019.135427, PMID: 31812412
Xie Y. Y., Zhu Q. C., Bai H., He H. Z., and Zhang Y. (2024). Combining ecosystem service value and landscape ecological risk to subdivide the riparian buffer zone of the Weihe River in Shaanxi. Ecol. Indic. 166, 112424. doi: 10.1016/j.ecolind.2024.112424
Xu M. L. and Matsushima H. (2024). Multi-dimensional landscape ecological risk assessment and its drivers in coastal areas. Sci. Total Environ. 908, 168183. doi: 10.1016/j.scitotenv.2023.168183, PMID: 37939967
Xu Y. Q., Zhou B. T., Yu L., Shi Y., and Xu Y. (2017). Temporal-spatial dynamic pattern of forest ecosystem service value affected by climate change in the future in China. Acta Ecologica Sin. 38, 1952–1963. doi: 10.5846/stxb201703210482
Yan Y. C., Ju H. R., Zhang S. R., and Chen G. K. (2021). The construction of ecological security patterns in coastal areas based on landscape ecological risk assessment—A case study of Jiao Dong Peninsula, China. Int. J. Environ. Res. Public Health 18, 12249. doi: 10.3390/ijerph182212249, PMID: 34832002
Yang Z. K., Zhang X. S., Hu X. R., and Zhou X. W. (2024). Spatial-temporal evolution of agricultural carbon balance at township scale and carbon compensation zoning: A case study of Guangshui City, Hubei Province. Land 13, 820. doi: 10.3390/land13060820
Yimuranzi A., Alimujiang K., Liang H. W., Zhang X. L., Zhao Y. Y., and Wei B. H. (2023). Evaluation of ecological space and ecological quality changes in urban agglomeration on the northern slope of the Tianshan Mountains. Ecol. Indic. 146, 109896. doi: 10.1016/j.ecolind.2023.109896
Zhang Y. L., Hu X. J., Wei B. J., Zhang X., Tang L., Chen C. Y., et al. (2023a). Spatiotemporal Exploration of Ecosystem Service Value, Landscape Ecological Risk, and Their Interactive Relationship in Hunan Province, Central-South China, over the past 30 Years. Ecol. Indic. 156, 111066. doi: 10.1016/j.ecolind.2023.111066
Zhang H. T., Liu Y. C., Li J. L., Tian P., Zhong J., and Gong H. B. (2023b). Evaluation and analysis of coastal complex ecological resilience based on multidimensional data: A case study of East China Sea. Ecol. Indic. 155, 110981. doi: 10.1016/j.ecolind.2023.110981
Zhang P., Liu L., Yang L. W., Zhao J., Li Y. Y., Qi Y. Y., et al. (2023c). Exploring the response of ecosystem service value to land use changes under multiple scenarios coupling a mixed-cell cellular automata model and system dynamics model in Xi'an, China. Ecol. Indic. 147, 110009. doi: 10.1016/j.ecolind.2023.110009
Zhang J. Y., Qiao X. N., Yang Y. J., Liu L., Li Y. L., and Zhao S. N. (2025). Ecological security driving mechanisms and optimization of zoning in Chinese urban agglomerations: A case study of the central plains urban agglomeration. Ecol. Indic. 171, 113190. doi: 10.1016/j.ecolind.2025.113190
Zhao Y., He L., Bai W. Q., He Z. W., Luo F., and Wang Z. F. (2024). Prediction of ecological security patterns based on urban expansion: A case study of Chengdu. Ecol. Indic. 158, 111467. doi: 10.1016/j.ecolind.2023.111467
Zhao Y., Tao Z., Wang M. N., Chen Y. H., Wu R., and Guo L. (2022). Landscape ecological risk assessment and planning enlightenment of Songhua river basin based on multi-source heterogeneous data fusion. Water 14, 4060. doi: 10.3390/w14244060
Zhong Y. Q., Zhang X. X., Yang Y. F., and Xue M. H. (2023). Optimization and simulation of mountain city land use based on MOP-PLUS model: A case study of Caijia cluster, Chongqing. ISPRS Int. J. Geo-Information 12, 451. doi: 10.3390/ijgi12110451
Zhou X., Ji G. H., Wang F., and Ji X. (2025). Identification and simulation of ecological zoning in the Yangtze River Delta (YRD) urban agglomeration based on Ecological Service Value (ESV)–Landscape Ecological Risk (LER). J. Cleaner Production 516, 145778. doi: 10.1016/j.jclepro.2025.145778
Zhou Y. P. and Zhao X. C. (2024). Spatial relationship between human activity intensities and ecosystem services value in Changsha-Zhuzhou-Xiangtan urban agglomeration. China Environ. Sci. 44, 2948–2960. doi: 10.19674/j.cnki.issn1000-6923.20240017.003
Zhu Q. and Cai Y. L. (2023). Integrating ecological risk, ecosystem health, and ecosystem services for assessing regional ecological security and its driving factors: Insights from a large river basin in China. Ecol. Indic. 155, 110954. doi: 10.1016/j.ecolind.2023.110954
Keywords: landscape ecological risk, ecosystem health, ecological zoning, land use simulation, SD-PLUS model, SSP-RCPs multi-scenario
Citation: Peng H, Lou H, Zhang Y, Wang W, He Q, Liu P and Yang Y (2025) Study of identification and simulation of ecological zoning through integration of landscape ecological risk and ecosystem health. Front. Ecol. Evol. 13:1662739. doi: 10.3389/fevo.2025.1662739
Received: 09 July 2025; Accepted: 09 October 2025;
Published: 30 October 2025.
Edited by:
João de Deus Vidal Jr., Leipzig University, GermanyReviewed by:
Hugo Wai Leung Mak, Hong Kong University of Science and Technology, Hong Kong SAR, ChinaPeng Du, Liaoning Normal University, China
Copyright © 2025 Peng, Lou, Zhang, Wang, He, Liu and Yang. This is an open-access article distributed under the terms of the Creative Commons Attribution License (CC BY). The use, distribution or reproduction in other forums is permitted, provided the original author(s) and the copyright owner(s) are credited and that the original publication in this journal is cited, in accordance with accepted academic practice. No use, distribution or reproduction is permitted which does not comply with these terms.
*Correspondence: Ying Yang, eWFuZy15aW5nQGNzY2VjLmNvbQ==; Polang Liu, dDE5OTcwMjA1QGNzdWZ0LmVkdS5jbg==