 Menghao Yang1
 Lianhai Cao
- 1College of Surveying and Geo-informatics, North China University of Water Resources and Electric Power, Zhengzhou, China
- 2School of Water Conservancy, North China University of Water Resources and Electric Power, Zhengzhou, China
- 3Key Research Institute of Yellow River Civilization and Sustainable Development and Yellow River Civilization by Provincial and Ministerial Co-construction of Collaborative Innovation Center, Henan University, Kaifeng, China
Exploring and predicting the interaction between ecosystem services (ESs) and human well-being (HWB) is essential for understanding Human-Natural system coupling and sustainable development. Existing studies often use a cascading framework to delineate the transmission of ESs system to HWB system, but rarely reveal the interaction between the two systems. In this study, we treated ESs and HWB as two large systems and investigated the interactive coercing relationship in the Yellow River Basin (YRB) from both the system and subsystem levels. Initially, we estimated ecosystem services value (ESV) for each province in the YRB using the revised equivalent factor method, and evaluated the level of HWB by GRA-TOPSIS model. Subsequently, we analyzed the interactive coercing relationship between ESV and HWB utilizing the coupling coordination degree (CCD) model. Finally, we predicted the development trajectory of the coupled system in the next 20 years. From 2000 to 2020, ESV increased in Qinghai, Sichuan, Gansu, Ningxia, Shaanxi and Shandong, but decreased in Shanxi, Henan, and Inner Mongolia. HWB overall showed a positive upward trend. At the subsystem level, regulation service was the dominant function, and the health and safety well-being was lower than other well-being, but the mental fulfillment well-being improving most slowly. System-level CCD between ESV and HWB has been rising and will continue to do so. The relationship between support service and HWB in Shandong deteriorated, and the relationship between the ESV and HWB in Gansu exhibited a serious lag in ESV and will remain in an uncoordinated state for the next 20 years. Our approaches and results have guiding significance for promoting the coordinated development of HWB and ESs and substantiating the SDGs.
1 Introduction
Since the 21st century, human activities have become a key force driving changes in the Earth’s system (Liu, 2020; Fu et al., 2022; Wang et al., 2024). In the process of entering the “Anthropocene” epoch, residents’ living standards have gradually improved, and the happiness derived from ecological environment benefits has increased (Liu et al., 2023; Ulrich et al., 2023). However, rapid economic development and explosive population growth have led to increasing demands on natural resources, resulting in serious ecological degradation and a continuous decline in ecosystem services (ESs). These changes, in turn, directly or indirectly affects human well-being (HWB) (Grimm et al., 2008; Luo et al., 2019; Sitotaw et al., 2025). The contradiction between deteriorating ecosystems and growing human demand is intensifying, thereby threatening SDGs progress (Wood et al., 2018); these goals aim to ensure global prosperity, HWB, and planetary sustainability. In essence, such contradiction reflects an unbalance among the ESs supply and HWB demand (Mashizi and Sharafatmandrad, 2021), and is the result of coupling unbalance between natural system and human system (Shen et al., 2023). How to reverse the degradation status of ecosystems, improve ESs functions, and coordinate the relationship between ecosystem protection and HWB has become a vital research topic for many global programs such as the Global Land Project. And it is also one of the cutting-edge scientific issues in the study of the Human-Natural coupling system at present.
ESs refer to the environmental benefits created and sustained by ecosystems (Millennium Ecosystem Assessment (MA), 2005). The value of these ESs (ie., ESV) represents the products and services provided by ecosystems, and has become one of the main indicator for evaluating ecological environment changes (Yang et al., 2023a). At present, studies on ESV have moved beyond the traditional economic output orientation, shifting its emphasis toward the comprehensive improvement of HWB (Yang et al., 2023b; Dong et al., 2024). The goal of this shift is to achieve the satisfaction of human demand on the basis of good living environment quality (Hanif et al., 2024). After the release of the MA (2005), research on the relationship between ESs and HWB has received increasing attention from scholars in ecology, geography, and other related fields, and evolved through three main stages: (1) The “influence chain” as the main idea has been used to analyze how ESs affect HWB (Al-Mulali et al., 2016). Such as the typical “Environmental Kuznets Curve” and the “Ecological Curse” phenomenon. Moreover, the impact of different types of ESs on HWB varies (Jonesa et al., 2016). For example, cultural services can meet the entertainment and recreation needs of residents (Tribot et al., 2018), while provision services can provide water and food to meet their survival needs, thereby improving happiness (Xu et al., 2019). (2) The “feedback chain” as the main idea has been used to reflect the feedback of HWB on ESs (Zhao et al., 2018). Research in this topic often reflects different welfare effects through subjective perceptions and differences of ESs demand in human society, such as residents’ perceived willingness to pay (Tibesigwa et al., 2020), farmers’ livelihoods (Robinson et al., 2019), and regional control and decision-making differences (Fulford et al., 2015), etc. And it has shown important turns such as the well-being of ESs, the multilevel and multi-dimensional needs of HWB, spatiotemporal trade-offs and social differentiation, the management application based on interaction (Yang et al., 2022; Shoji et al., 2024). (3) Frontier exploration of interactive relationships between ESs and HWB. In the process of deepening geography to Human-Natural coupling system, it becomes evident that ESs and HWB are increasingly interwoven. Consequently, their intercorrelation and coupling have gradually become the focus and frontier issues (Zhou et al., 2024). The researches on this topic primarily develops by integrating the “influence chain” and the “feedback chain”. On this basis, a loop cascading research framework—”ecosystem structure - process - function - ESs - HWB” predominantly by the “influence chain”—has gradually taken shape (Potschin-Young et al., 2018; Blythe et al., 2020).
Overall, existing studies play a crucial role in supporting in-depth analysis of ecological issues and subsequently developing management strategies to enhance HWB (Liu and Wu, 2021). However, the existing “cascading research framework” studies are difficult to directly explain the complex interaction between ESs and HWB. Therefore, it is urgent to expand the thinking from “cascading” research to “coupling” research, and analyze the relationship between the two from a more direct and comprehensive perspective (Fu et al., 2019; Qiu et al., 2021; Kibria et al., 2022). Additionally, existing research mostly takes ESs and HWB as two systems, exploring their simple relationship from the perspective of the whole system (Zhang et al., 2023a; Ji et al., 2024). However, the interactions between subsystems of ESs and HWB have received little attention.
The Yellow River Basin (YRB) is a critical ecological security barrier and a strategic economic zone in northern China (Xi, 2019). However, population growth, economic development, and urbanization have exerted immense pressure on the YRB’s ecosystems, leading to severe ecological issues such as soil erosion (Zhao et al., 2013), land desertification (Wohlfart et al., 2016), diminished water conservation functions (Fu et al., 2022). It is one of the regions in China where the conflict between ecosystem degradation and HWB improvement is most intense. How to synergistically improve the ecological environment and HWB has always been a core issue related to the YRB (Fu et al., 2021). In view of the above considerations, this study focuses on the significant demand for the coordinated development between ESs and HWB in the YRB, where the interactive mechanism between ESs and HWB is unclear. Therefore, our specific objectives are to (1) determine the spatiotemporal characteristics of ESV in the YRB from 2000 to 2020; (2) evaluate the HWB in the YRB from 2000 to 2020 through combing the SDGs framework and the guiding principles of MA; (3) investigate the interactive coercing relationship between ESV and HWB at both the system and subsystem levels; (4) predict future changes of such relationship. Finally, according to the research results, we put forward targeted policy suggestions for improving ESV and HWB together in the YRB. Compared with previous studies, this study also puts forward several innovative and transformative factors. Firstly, when calculating ESV, we make more detailed localized corrections to the equivalent factors using net primary productivity, rainfall, and soil retention, rather than relying solely on NDVI alone, or even without any correction, as in other studies (Ai et al., 2024). Secondly, when evaluating HWB, on one hand, we use Game Theory to combine subjective and objective weights, making the indicator weight results more accurate and authentic. On the other hand, we introduced Grey Relational Analysis (GRA) theory into the Technique for Order Preference by Similarity to Ideal Solution (TOPSIS) evaluation method. This integration, which uses relative closeness as a new criterion, improved the accuracy of HWB evaluation results. Thirdly, we carried out the prediction research, analyzed the future development trend of coupling coordination degree (CCD), and then provided more forward-looking decision-making basis.
2 Materials and methods
2.1 Study area
Combining the natural support, and completeness of administrative units, we take nine complete provinces through which the Yellow River flows (Figure 1a) as the scope of the YRB (Figure 1b), which is also the planning scope of the “Outline of the Ecological Protection and High-Quality Development Plan in the Yellow River Basin”. The YRB (26°2′N-53°21′N, 89°24′E-126°4′E) spans a vast area of 3.49 million km², traversing the eastern, central, and western geographical steps of northern China. The region exhibits significant differences in topography, ranging from -88m to 6661m (Figure 1c). The climate in the YRB varies significantly with terrain, mainly characterized by arid and semi-arid continental monsoon climate (Yang et al., 2023a). The average rainfall is 454.2mm, increasing from approximately 12.4mm in the northwest to 1,671.3 mm in the southeast (Figure 1d). The YRB is rich in land resources, with grassland being the dominant land use type, followed by barren land, farmland, and forestland, accounted for 39.99%, 21.27%, 18.65%, and 15.28% of the total area, respectively (Figure 1e). Additionally, most areas within the YRB are located in arid or semi-arid regions (Figure 1f), where sharp water supply and demand contradictions persist for a long time. Meanwhile, the complex geographical environment and uneven human activities also bring about obvious ecological and environmental issues (Zhao et al., 2013; Wohlfart et al., 2016). Especially since the 21st century, with the rapid growth of the national economy and population (Figure 1g), the pressure on the ecosystem has surged (Fu et al., 2021).
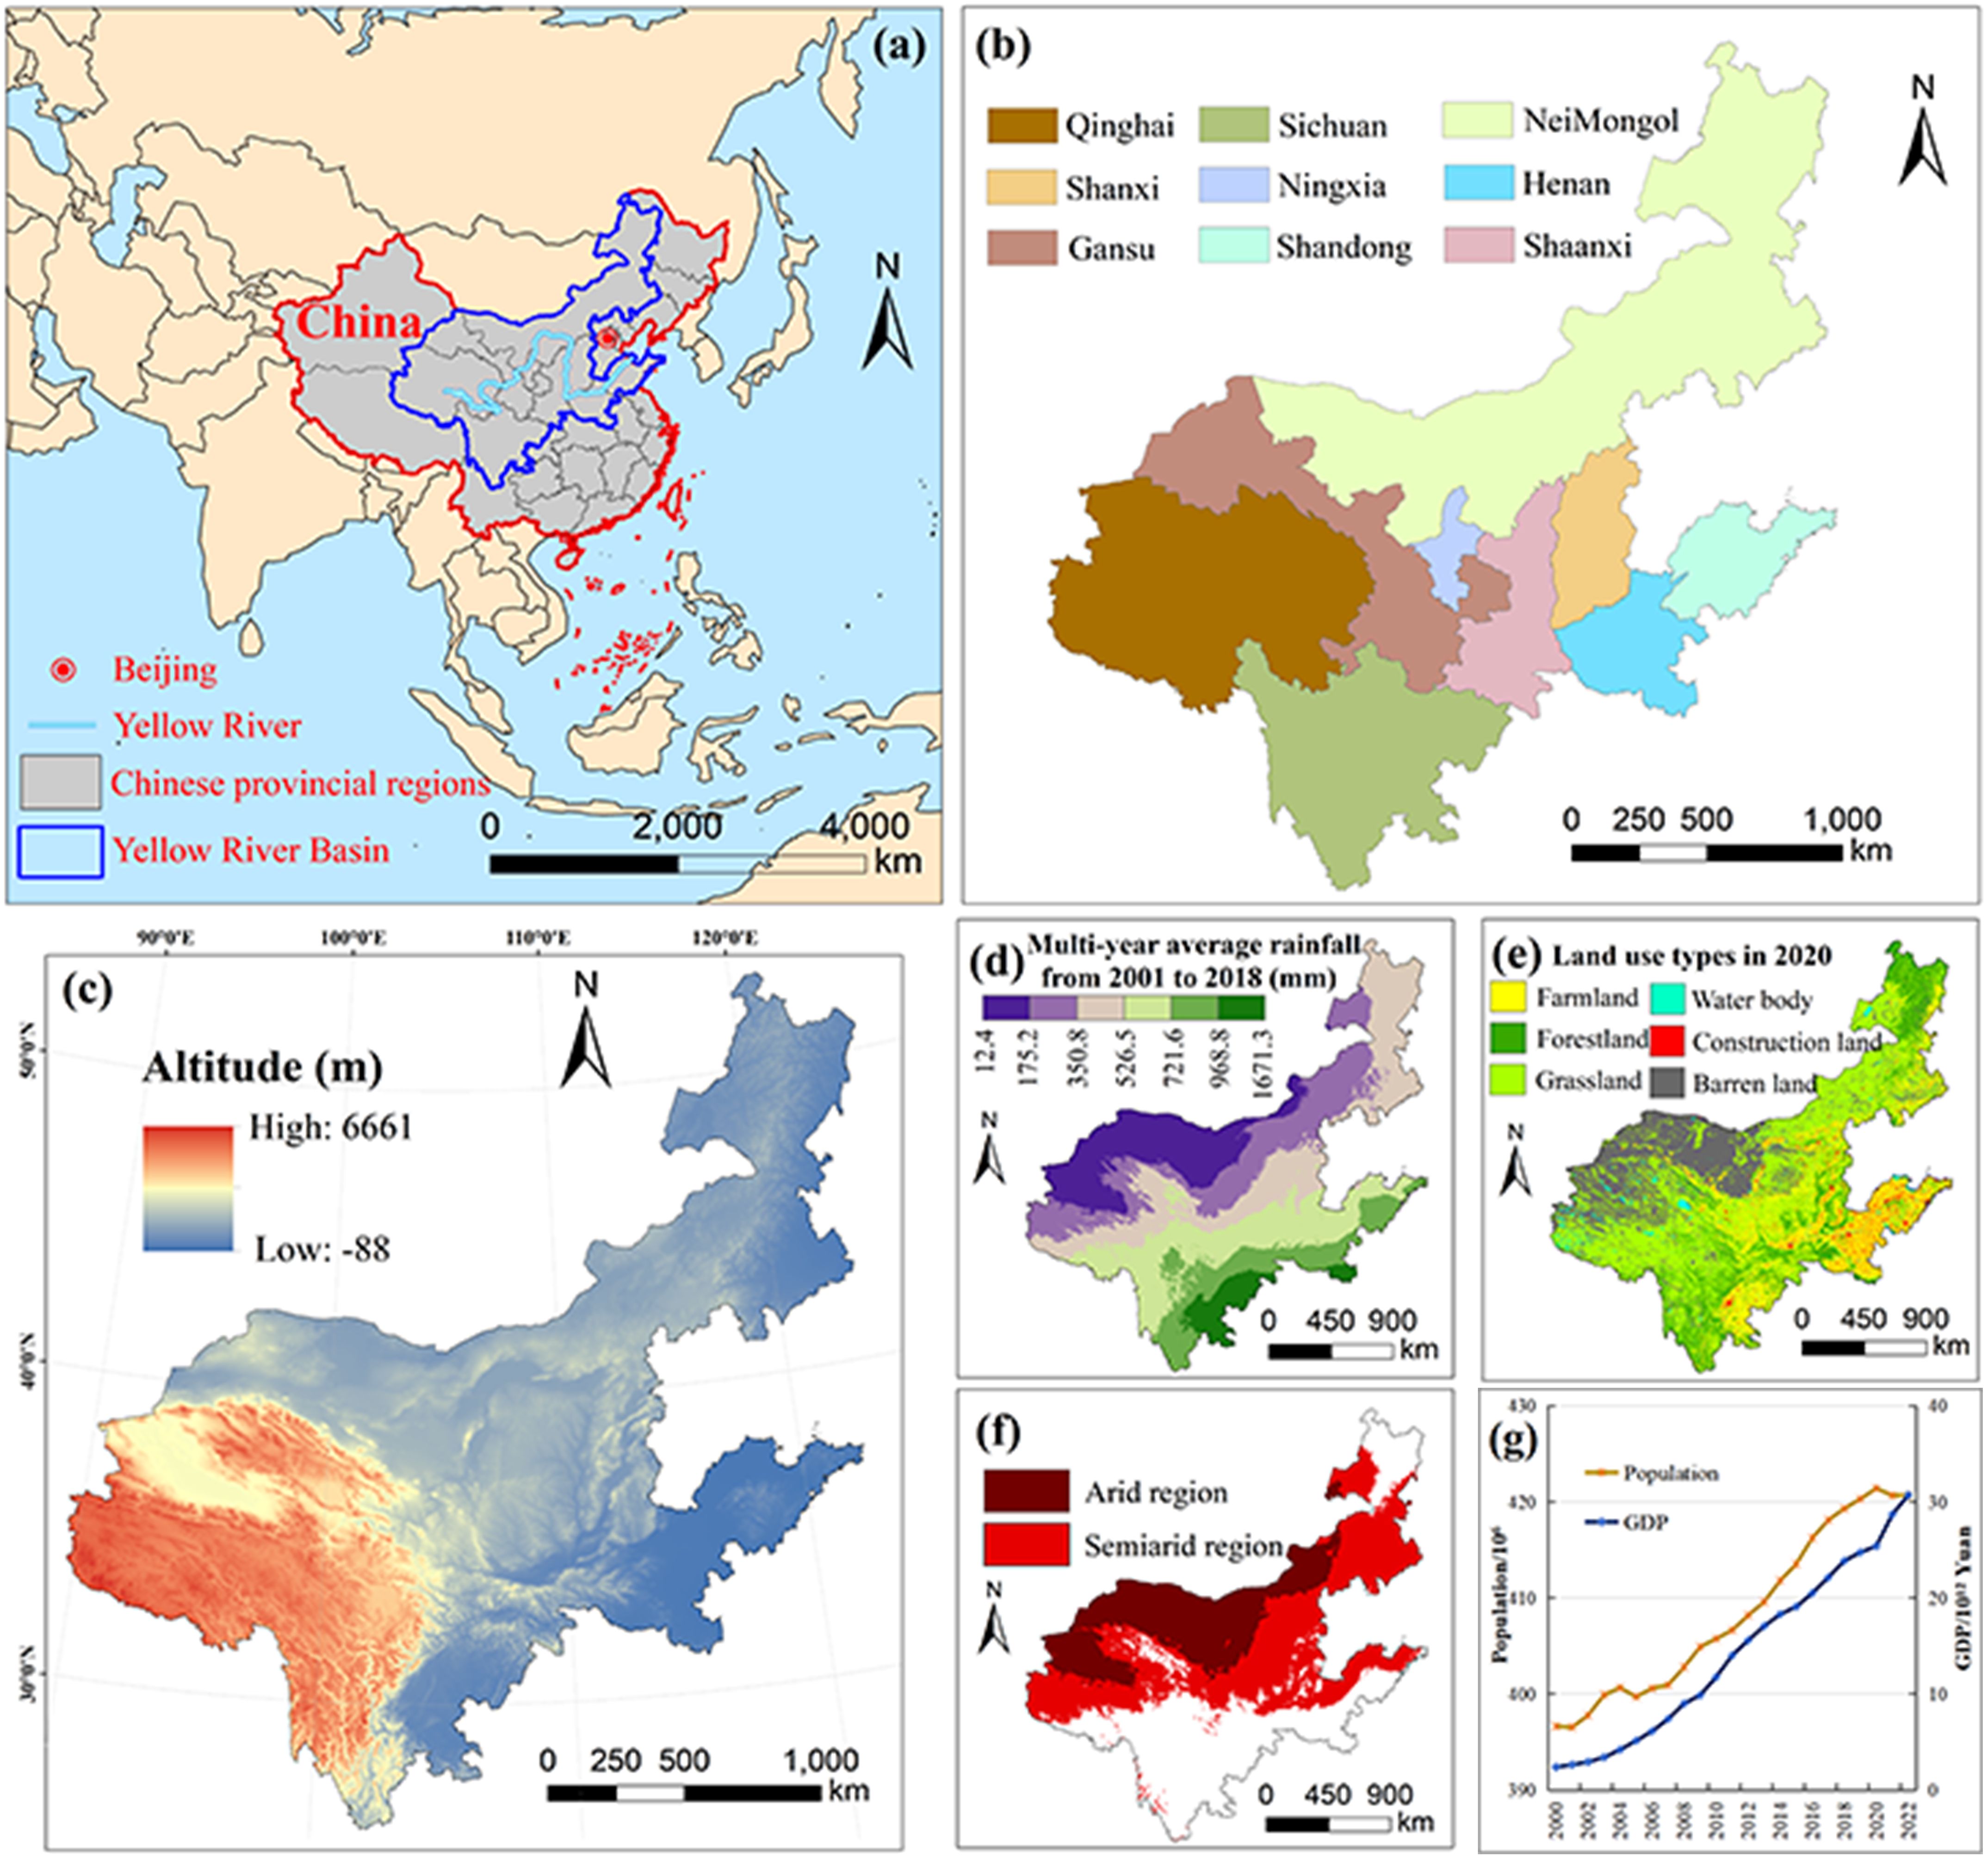
Figure 1. Study area: (a) location of Yellow River Basin, (b) administrative division, (c) altitude, (d) rainfall, (e) land use type, (f) arid region division, and (g) population and GDP.
In 2022, the total population within the YRB is 420 million, accounting for 29.8% of China’s population. The GDP of these provinces is 30.7 trillion yuan, representing 25.5% of China’s GDP. The YRB, serving as both an ecological barrier and a critical economic zone, plays a vital role in China’s development. However, the YRB is also a region with concentrated poverty and relatively lagging economic development. Five of the 14 contiguous poor areas in China are located within the YRB, where HWB remains generally low. The livelihoods of people in the YRB have long depended on the diverse ESs, and the fulfillment of HWB needs has long relied on the continuous supply of these ESs (Zhai et al., 2021). Given the significant disparities in natural and socioeconomic resources across the YRB, this basin presents an ideal study region for examining the characteristics of changes in ESs and HWB, as well as for exploring the interactive coercing mechanisms between them. Such research not only has strategic significance for the coordinated high-quality development between ecological protection and HWB in the YRB, but also can offer valuable scientific insights for sustainable development initiatives across similar regions.
2.2 Data descriptions
This study integrated the following multi-source data.
1. Data for calculating ESV, including land use types, crop yields and average crop prices. Land use datasets for the years 2000, 2005, 2010, 2015, and 2020, with a grid resolution of 30m × 30m, were supplied by the Resource and Environment Science and Data Center (RESDC, http://www.resdc.cn/). The datasets represent the most precise land use remote sensing monitoring products currently available and have been widely used in related research. Crop yield and average crop price data were extracted from the Yearbook on Food and Strategic Reserves in China (https://data.cnki.net/home).
2. Data for correcting ESV equivalent factors, including soil retention, rainfall and net primary productivity. Net primary productivity and rainfall data, with a grid resolution of 1000m × 1000m, were provided by the National Earth System Science Data Center (http://www.geodata.cn/), while soil retention data with a grid resolution of 1000m × 1000m was obtained from RESDC (http://www.resdc.cn/). These datasets have been widely used in related research and highly praised.
3. Statistical data for constructing the HWB evaluation indicator system. These data were sourced from the China Statistical Yearbook (http://www.stats.gov.cn/) for the years 2001, 2006, 2011, 2016, and 2021, were in text data format. Missing data were supplemented with targeted data from the Statistical Yearbooks of the nine provinces within the YRB (https://data.cnki.net/home).
2.3 Methodological process
We developed the following research framework to achieve our objectives (Figure 2). Firstly, we collected and processed the multi-source data. Then, we estimated the ESV level using the revised equivalent factor method. Thirdly, we constructed the HWB evaluation indicator system by combining the SDGs framework and the guiding principles, and then used the GRA-TOPSIS model to assess HWB level. Subsequently, we analyzed and predicted the coupling coordination relationship between ESs and HWB using CCD model and GM (1,1). Finally, we further revealed the interactive coercion mechanism between ESs and HWB, providing a basis to inform decision-making.
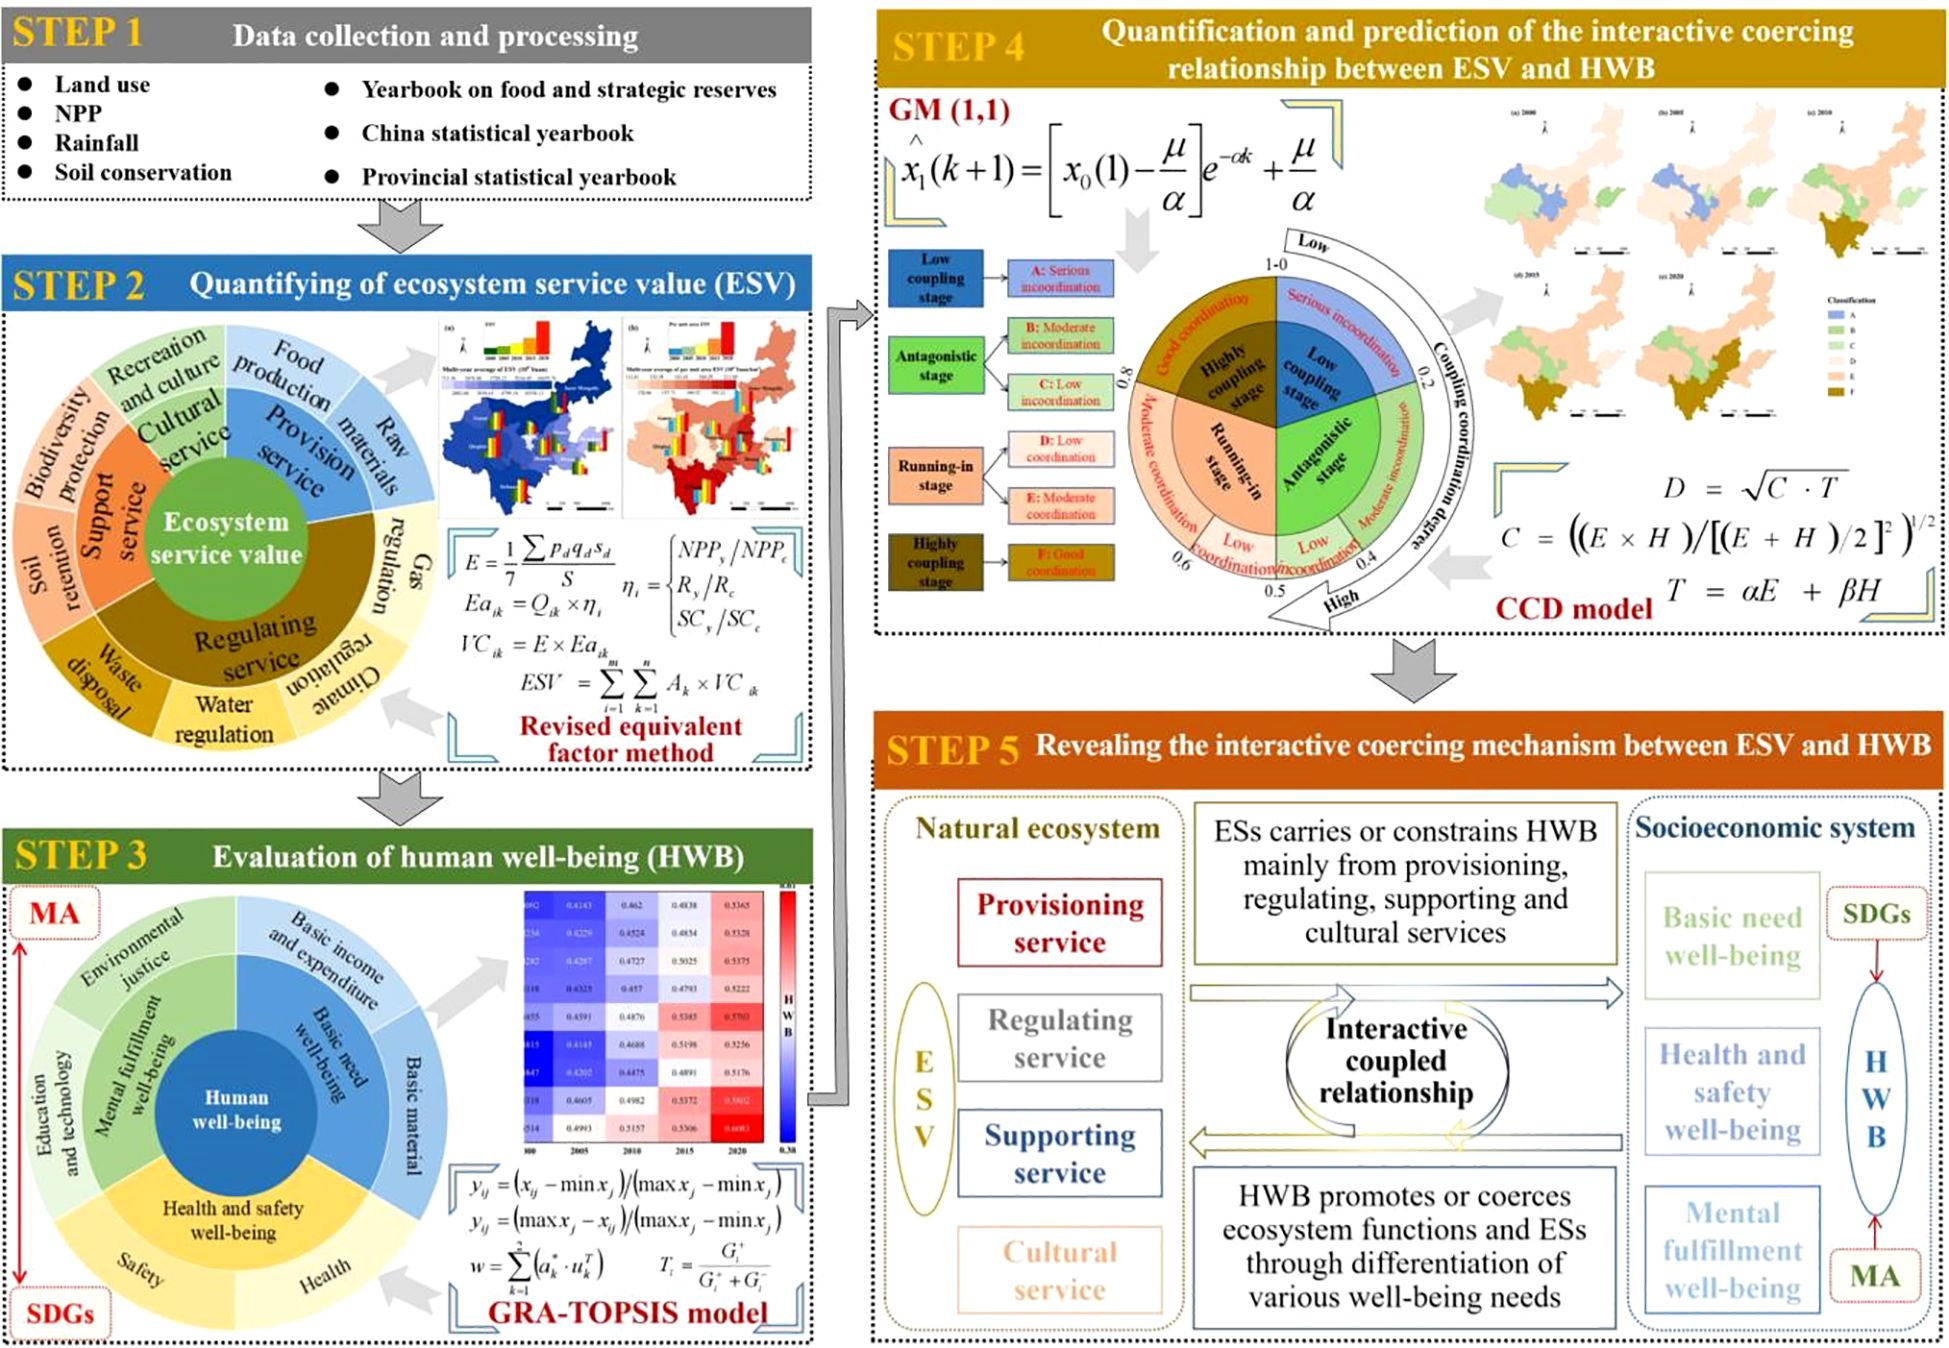
Figure 2. The overall research framework of this study.
2.3.1 Quantifying of ESV
Xie et al. (2003, 2008, 2017) modified the method proposed by Costanza et al. (1997), and then obtained ESV equivalent factor per unit area in China (see Supplementary Table S1 of Supplementary Material) based on China’s actual situation. They categorized ESs functions into four subtype and nine ESs indicators (see Supplementary Table S1). We further revised the equivalent factors according to the actual ecosystem of the YRB, and conducted sensitivity analyses to ensure that the quantification of ESV aligns with the actual conditions. The calculation processes are as follows.
2.3.1.1 Calculation of the economic value of an ESV equivalent factor (E)
We used Equation 1 to calculate the E for the YRB. To eliminate the impact of crop price fluctuations on the total ESV, the sown area and yield of the grain crops in the YRB and their corresponding average prices of each crop in 2020 were calculated as the basis.
Where is types of grain crops; is the average price of grain crops; is the yield of grain crops per unit area; is the area of grain crops; is the total area of all grain crops.
2.3.1.2 Calculation of the ESV per unit area of an ecosystem (VC)
The equivalent factors of Xie et al. (2008) are more suitable for VC estimation across the whole China. Thereby, we improved the equivalent factors based on the actual ecosystem conditions of the YRB. The detailed localization revision process can be found in the Supplementary Material. Subsequently, we used Equation 2 to determine the VC value, with the results shown in Table 1.
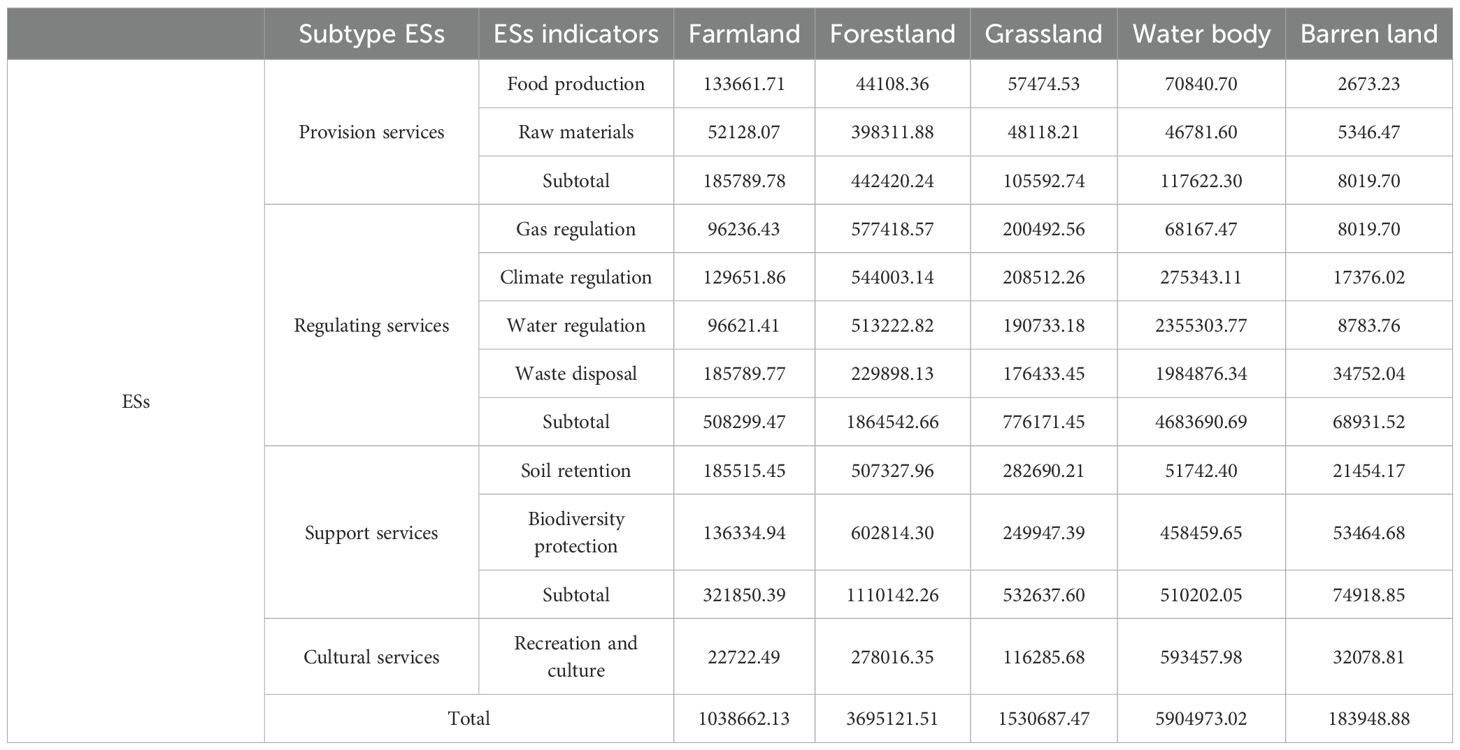
Table 1. ESV per unit area of different land use types in the YRB (yuan/km2).
Where is the revised equivalent factor value of ESs for land use type (see Supplementary Table S2).
2.3.1.3 Calculation of ESV
Using Equation 3 to calculate the ESV of YRB.
Where is the area of land use type.
2.3.1.4 Sensitivity analysis
We verified the reliability and rationality of the method and calculation results in our study (Supplementary Figure S1) by using the sensitivity index proposed in the sensitivity analysis section of Supplementary Material.
2.3.2 Evaluation of HWB
2.3.2.1 Indicator system establishment
According to the guiding principles of MA (2005), HWB refers to the activities and states that human consider valuable based on experience. It mainly refers to the material, mental, and health needs for humans, including the basic material conditions required to maintain a high-quality life, safety, health, good social relationships, and freedom of choice and action. HWB is complex and dynamic, with different scholars proposing various measurement indicators (e.g., Daw et al., 2016; Blythe et al., 2020; Kibria et al., 2022; Qiu et al., 2023). Considering the multi-dimensional character of HWB, based on the components of HWB in the authoritative MA (2005) and combined with SDGs framework, we summarized the HWB at the provincial level in the YRB into three aspects (ie., basic need well-being, health and safety well-being, and mental fulfillment well-being). Then, based on the selection range of HWB indicators from existing studies, we combined the natural and socioeconomic development characteristics of the YRB and the availability of data to establish the evaluation indicator system for HWB (Table 2). It should be noted that HWB generally has both subjective and objective attributes. Considering the research time dimension and data availability, we only focused on objective well-being, which is more suitable for measuring HWB on a large-scale region compared to subjective well-being (MA, 2005; Aguado et al., 2018; Zhang et al., 2023a). Furthermore, subjective well-being often depends on objective well-being, and in the coupling study of ESs and HWB, there is no need to distinguish the differences of population subjects (Qiu et al., 2023).
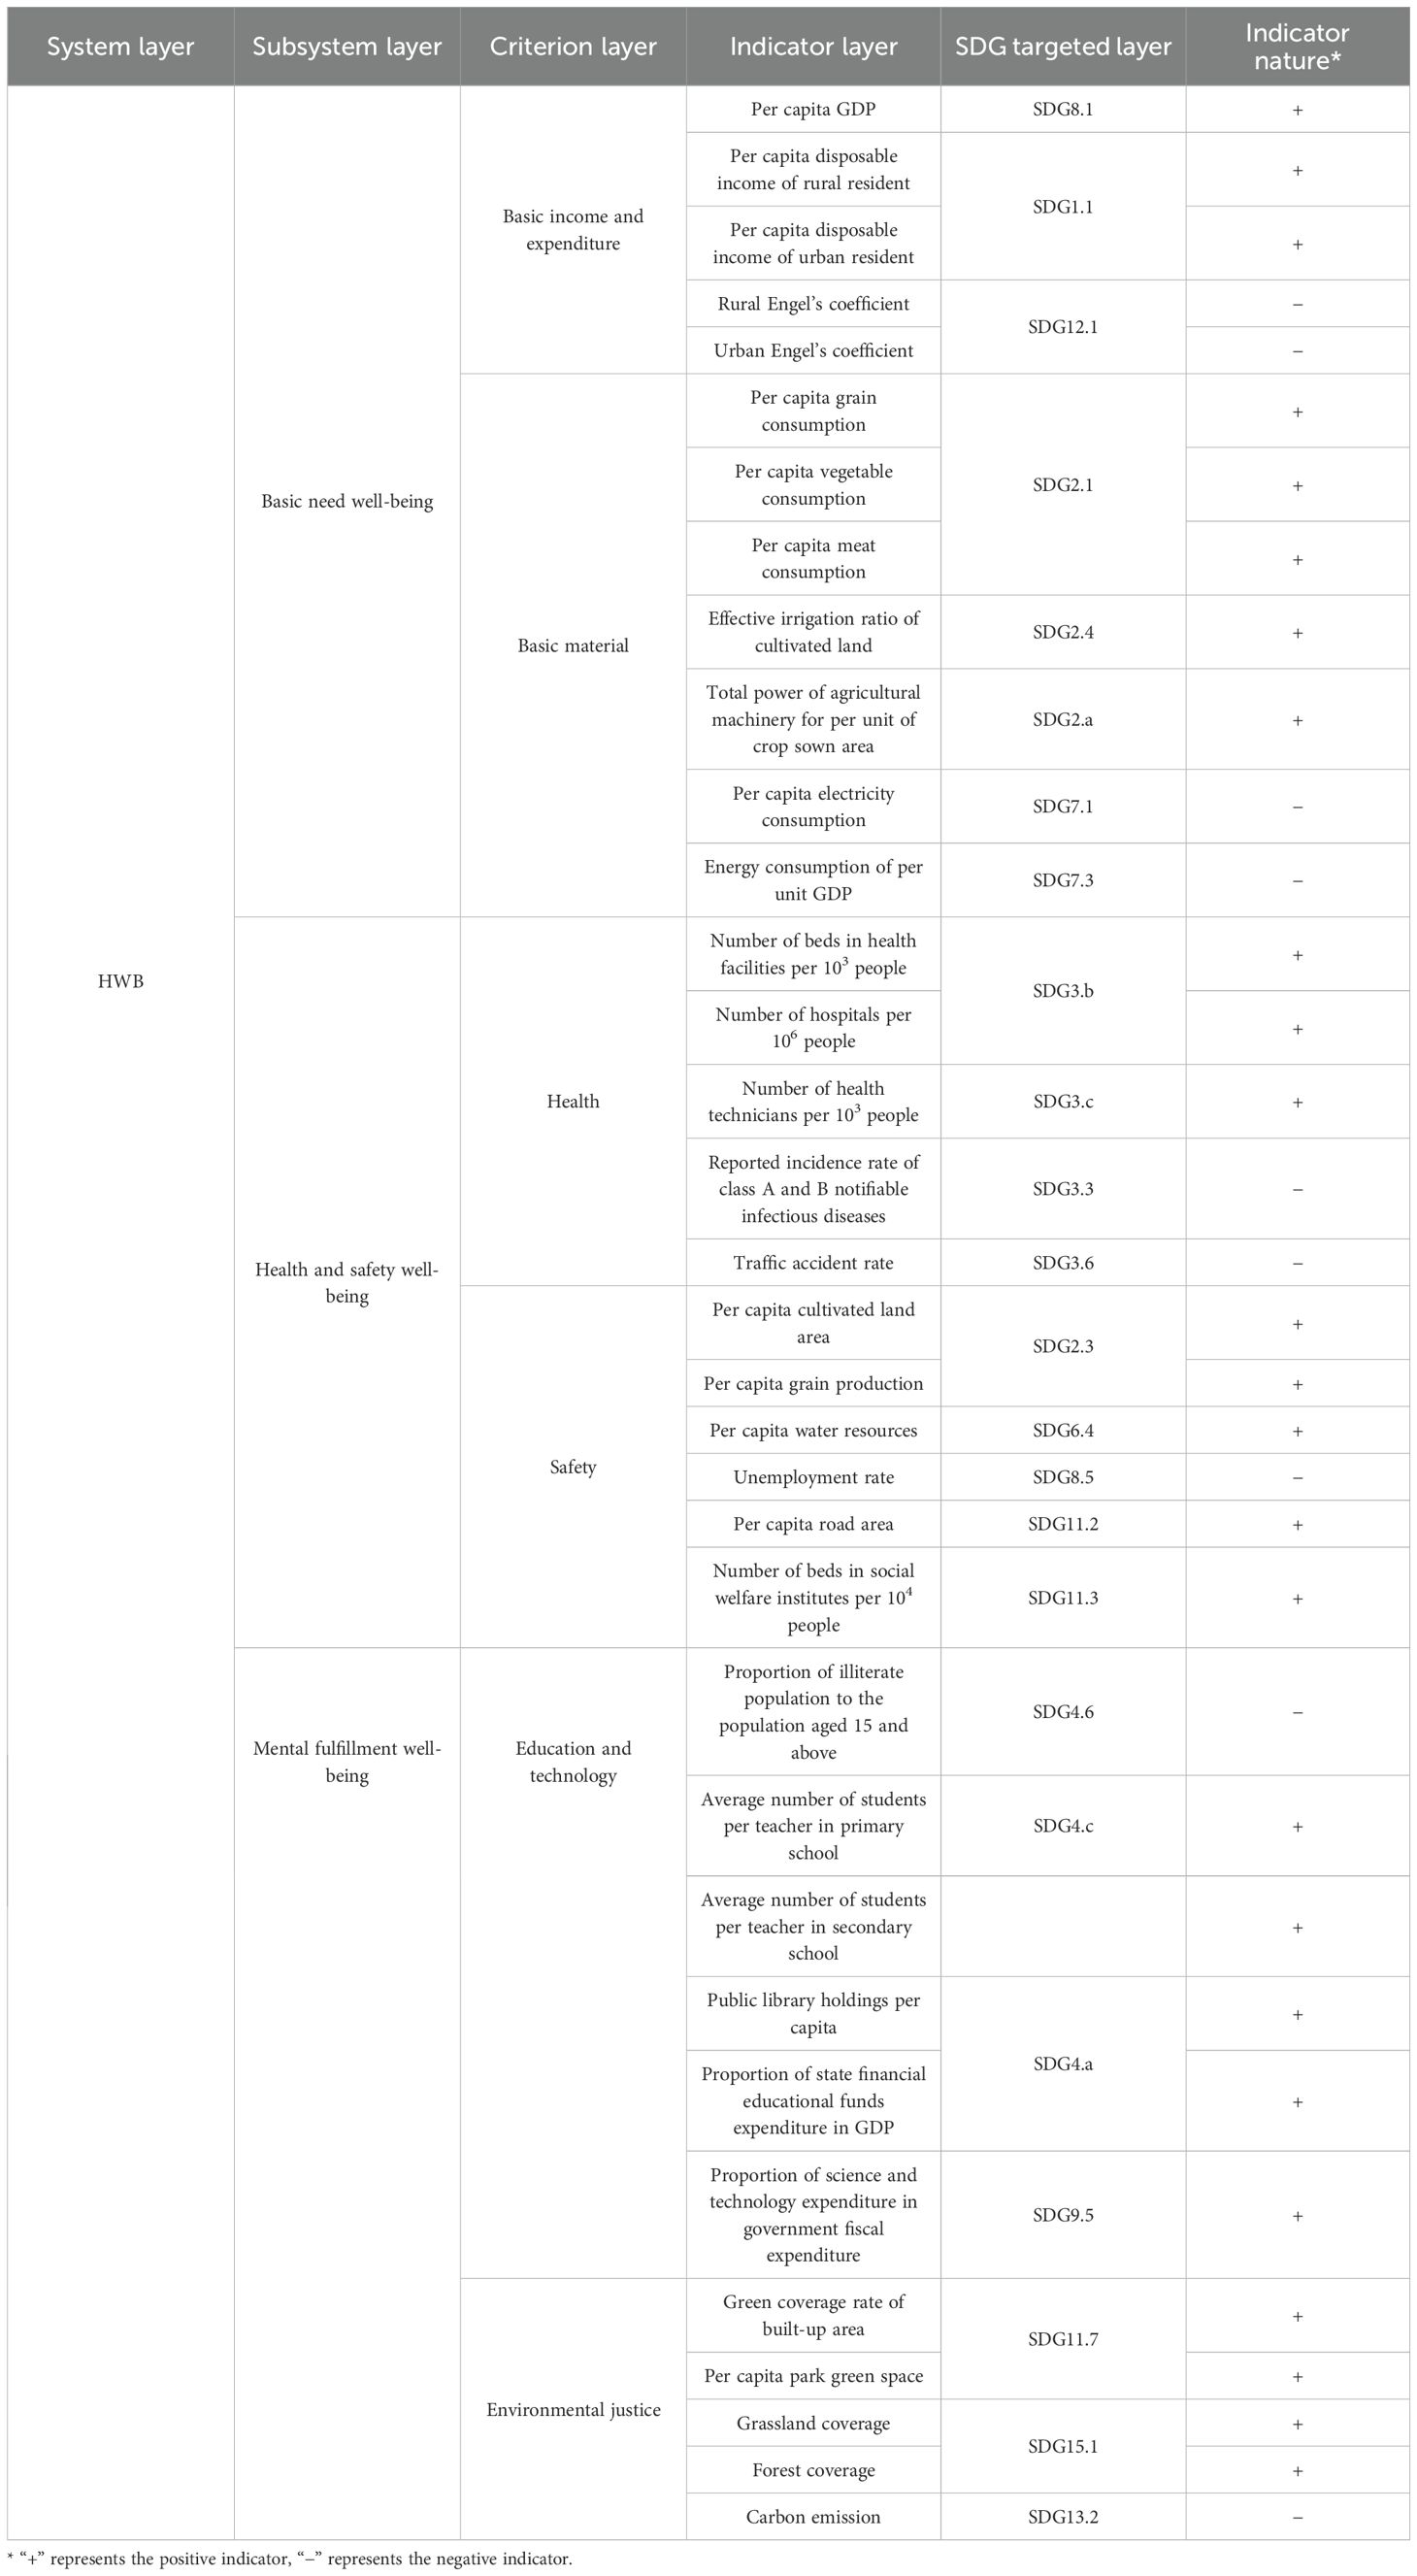
Table 2. Indicator system for HWB in the YRB.
2.3.2.2 Evaluation model building
2.3.2.2.1 Indicator Min/Max normalization
We used the normalization method of Min/Max normalization in the indicator layer, so as to ensure the comparability of each indicator and its use in our subsequent research. The formulas involved can be found in the Supplementary Material.
2.3.2.2.2 Determination of indicator comprehensive weight
Subjective weighting methods determine the weights according to the evaluators’ emphasis degree on the indicators. Although this type of methods is simple and practical, it heavily depends on the evaluators’ subjective judgement. Objective weighting methods can compensate for shortcomings of subjective weighting method such as subjective arbitrariness and poor objectivity. Therefore, we used the subjective Analytic hierarchy process and the objective Entropy weight method to preliminary quantify the weight of each indicator in this study (Russo and Camanho, 2015; Jamin and Humeau-Heurtier, 2020). And then, we combined the subjective weights (see Supplementary Table S4 of Supplementary Material) and objective weights (Supplementary Table S4) using Game Theory to obtain the comprehensive weights of the indicators, which serve as the final weight results for each indicator in this study (Supplementary Table S4). The Supplementary Material demonstrate the detailed steps for Analytic hierarchy process to determine subjective weights, Entropy weight method to determine objective weights, and Game Theory to determine final weights.
2.3.2.2.3 Evaluation of HWB by building GRA-TOPSIS model
TOPSIS only considers the relative position of each scheme to the positive and negative ideal solutions, but it neglects the dynamic change trend of each scheme (Shi et al., 2024). Moreover, when the indicator data approaches the distances of the positive and negative ideal solutions, it fails to accurately determine their superiority, thereby compromising the reliability of the evaluation results. GRA theory takes into account the shape similarity between the evaluated scheme and the reference scheme, allowing it to better reflect the internal change patterns of each scheme (Dwivedi et al., 2022). Therefore, we improved the traditional TOPSIS by incorporating GRA theory and constructing the GRA-TOPSIS model. This integration fully utilize the information contained in the evaluation indicators, thereby more systematically and accurately reflecting the closeness between the alternative and ideal solutions, and enhancing the scientificity and accuracy of the evaluation results. The GRA-TOPSIS model can be implemented in Matlab R2024a, and its methodological process can be found in the Supplementary Material.
2.3.3 CCD model
To analyze the relationship between ESV and HWB more precisely, we considered different types of ESs and aspects of HWB as subsystems of ESV and HWB, respectively. Then, we utilized the CCD model to reveal the interactive coercing relationship (Shi et al., 2024). We calculated the CCD both on the system and the subsystem levels using Equations 4–6.
Where is the CCD between ESV and HWB; is the coupling degree between ESV and HWB; and are the values of ESV and HWB standardized using the Min/Max normalization method, respectively; is comprehensive evaluation index between ESV and HWB; and are overall contribution level to the system, respectively. In this study, the contribution level is set at because ESV and HWB are considered equally important (Qiu et al., 2023). Referring to previous study results (Xiao et al., 2020), we divided the coupling coordination level into four different stages and six specific types (see Table 3).
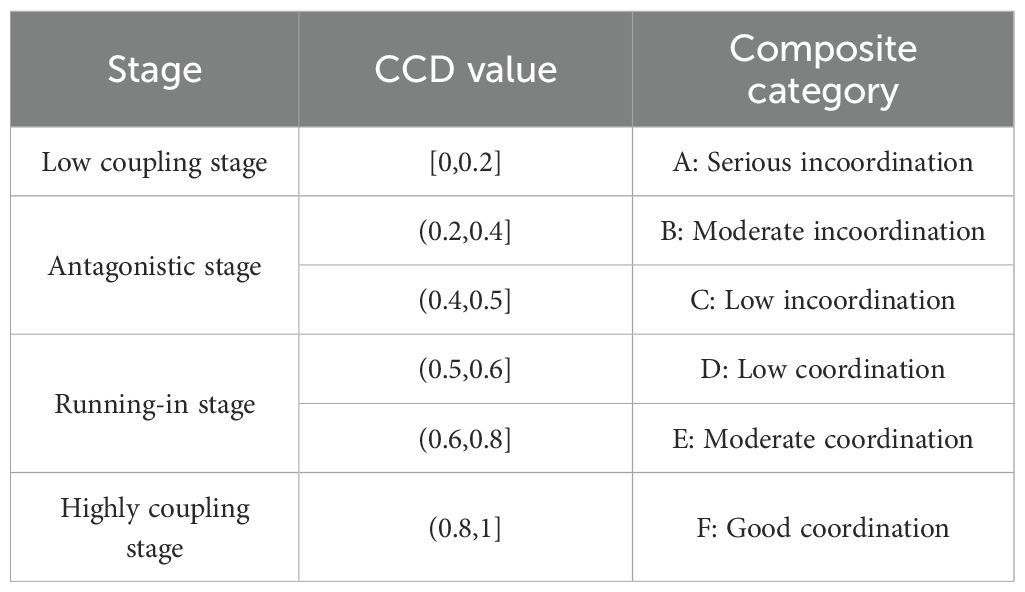
Table 3. The CCD classification levels between ESV and HWB.
2.3.4 Grey prediction model
The grey prediction model is a predictive model that reveals the continuous development and transformation process of internal things within a system, abbreviated as the GM (1,1). The GM (1,1) can achieve high precision under limited samples by constructing a mathematical model to analyze the development law of the past data and make scientific prediction about the future (Gong and Wang, 2019). Based on the above measurement results of the CCD between ESV and HWB, in order to further grasp the future trend of coupling and collaborative development, we conducted a prediction study on the CCD within YRB using the GM (1,1) in Matlab R2024a. The steps are as follows:
(1) Assuming are n observations in a time series, an accumulated sequence is formed by adding up the time series , and the differential equation of GM (1,1) is constructed (Equation 7):
Where is the development gray number; is the endogenous control gray number.
(2) Assuming is the parameter vector that needs to be estimated, then using the least squares method to solve the eqs equation: , , and then predicting the result using Equation 8:
(3) After the construction of the prediction model is completed, its accuracy should be tested based on the grading criteria provided in Table 4 (Gong and Wang, 2019; Zhang et al., 2023b). If posterior difference ratio and residual variance are both within the allowable range, the predicted value of this indicator can be calculated.
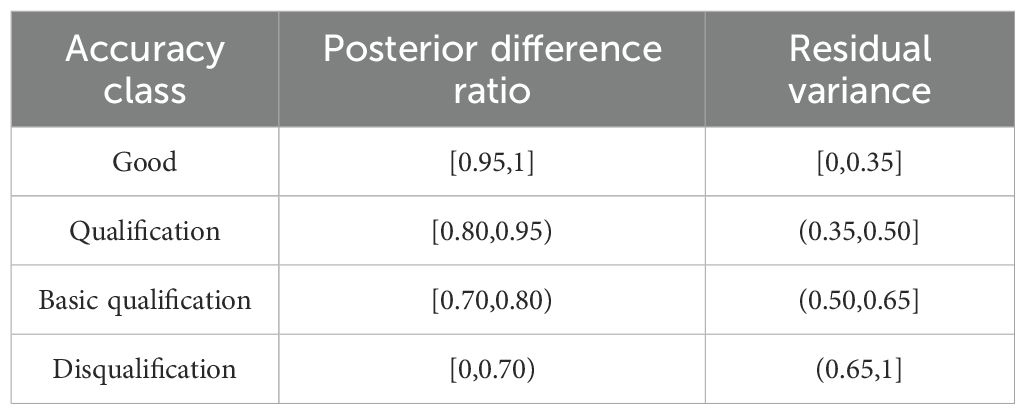
Table 4. The accuracy test table.
3 Results
3.1 Characteristics of ESV
3.1.1 Differences of ESV level
Figure 3 displays the total ESV of each province from 2000 to 2020, and explores the differences in ESV within the same size using the per unit area ESV. The results indicated that Sichuan had relatively high ESV and per unit area ESV, ranking 2nd in ESV and 1st in per unit area ESV among the nine provinces in the YRB. Shandong had relatively low ESV and per unit area ESV, with both ranking 8th in the YRB. The ESV ranking was Inner Mongolia>Sichuan>Qinghai>Gansu>Shaanxi>Shanxi>Henan>Shandong>Ningxia. The per unit area ESV ranking of provinces was Sichuan>Shanxi>Shaanxi>Henan>Inner Mongolia>Ningxia>Qinghai>Shandong>Gansu. The changes in EVS and per unit area ESV in each province from 2000 to 2020 were not significant.
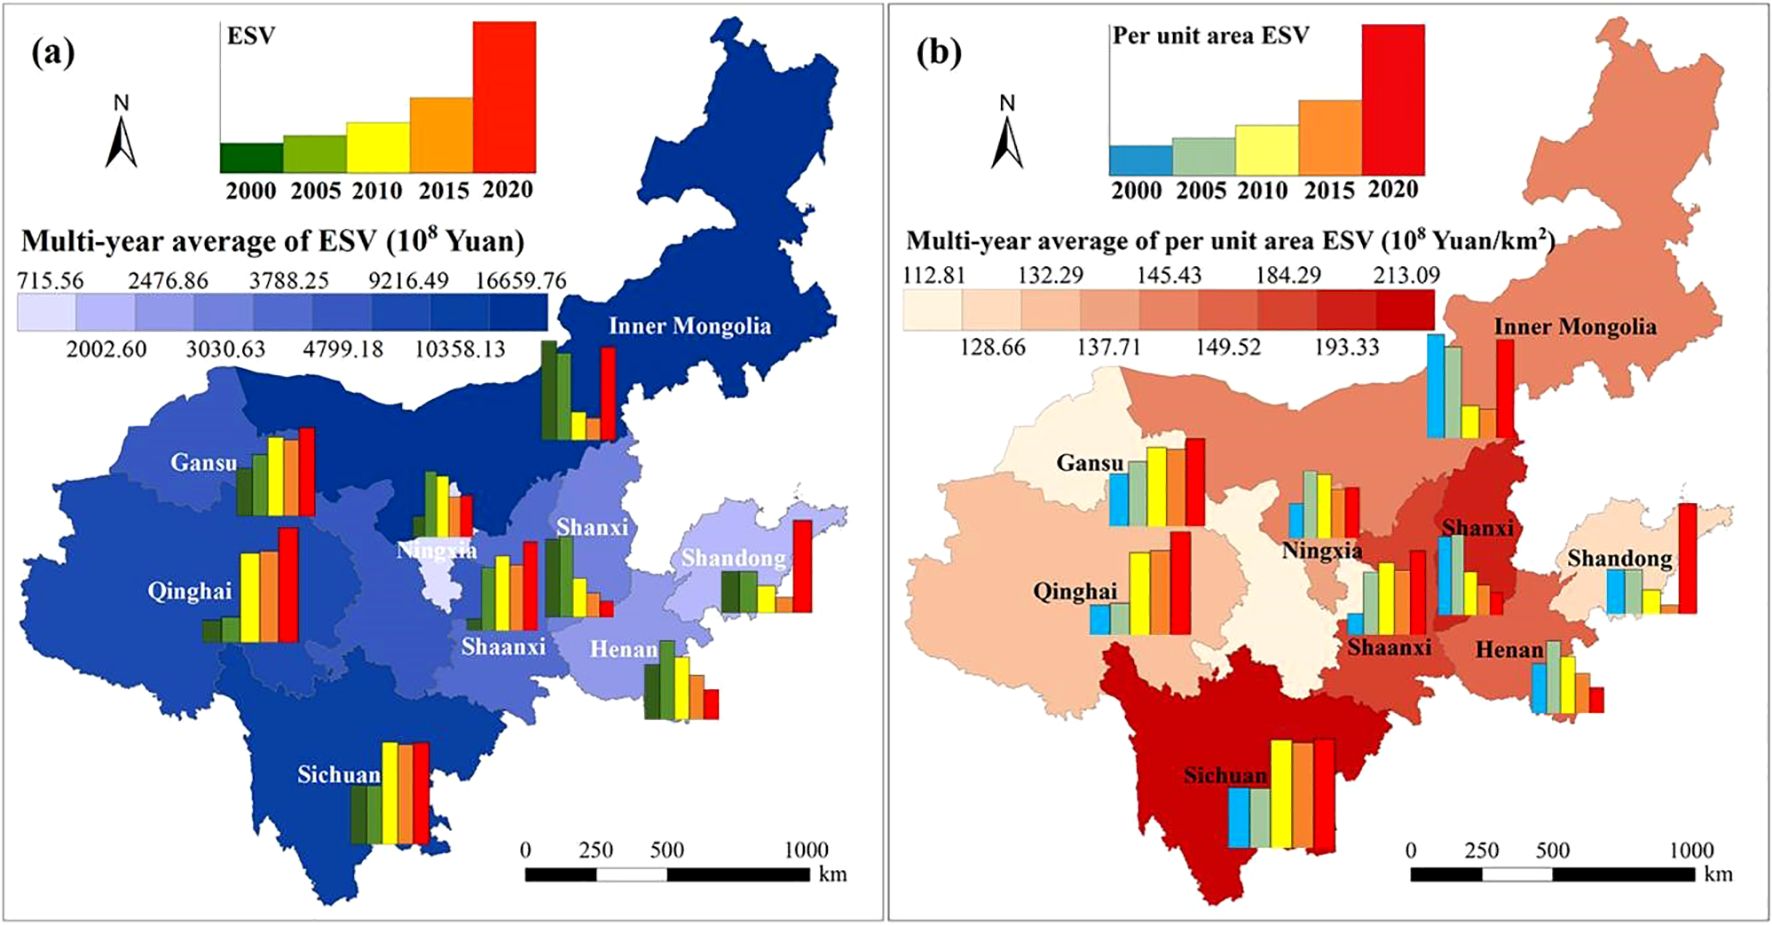
Figure 3. The total ecosystem services value (ESV) (a), and per unit area ESV (b) of different provinces of the Yellow River Basin from 2000 to 2020.
Moreover, preliminary calculations were performed on the results in Figure 3 to obtain the changes and change rates of ESV in each province of the YRB (Figure 4). Obviously, from 2000 to 2020, significant differences existed in the direction and magnitude of ESV changes across nine provinces. Overall, from 2000 to 2020, the ESV of Qinghai, Sichuan, Gansu, Ningxia, Shaanxi, and Shandong increased, while the other three provinces decreased. Specifically, the ESV of Qinghai consistently risen with a total increase of 56.2051 billion yuan from 2000 to 2020, particularly notable from 2005 to 2010 (an increase of 38.7623 billion yuan). Despite complex fluctuation patterns, Sichuan, Gansu, Ningxia and Shaanxi experienced overall increases in ESV, with relatively small decreases in ESV during certain phases. Shanxi and Henan showed an initial upward trend in ESV, followed by a continuous decline, but the decline rates slowed down. Inner Mongolia and Shandong exhibited a downward trend in ESV during the first three stages, with an upward trend in the final stage. It can also be seen from Figure 4 that the ESV changes in Ningxia, Sichuan and Henan were relatively small, and the ESV change rate in Ningxia was the least.
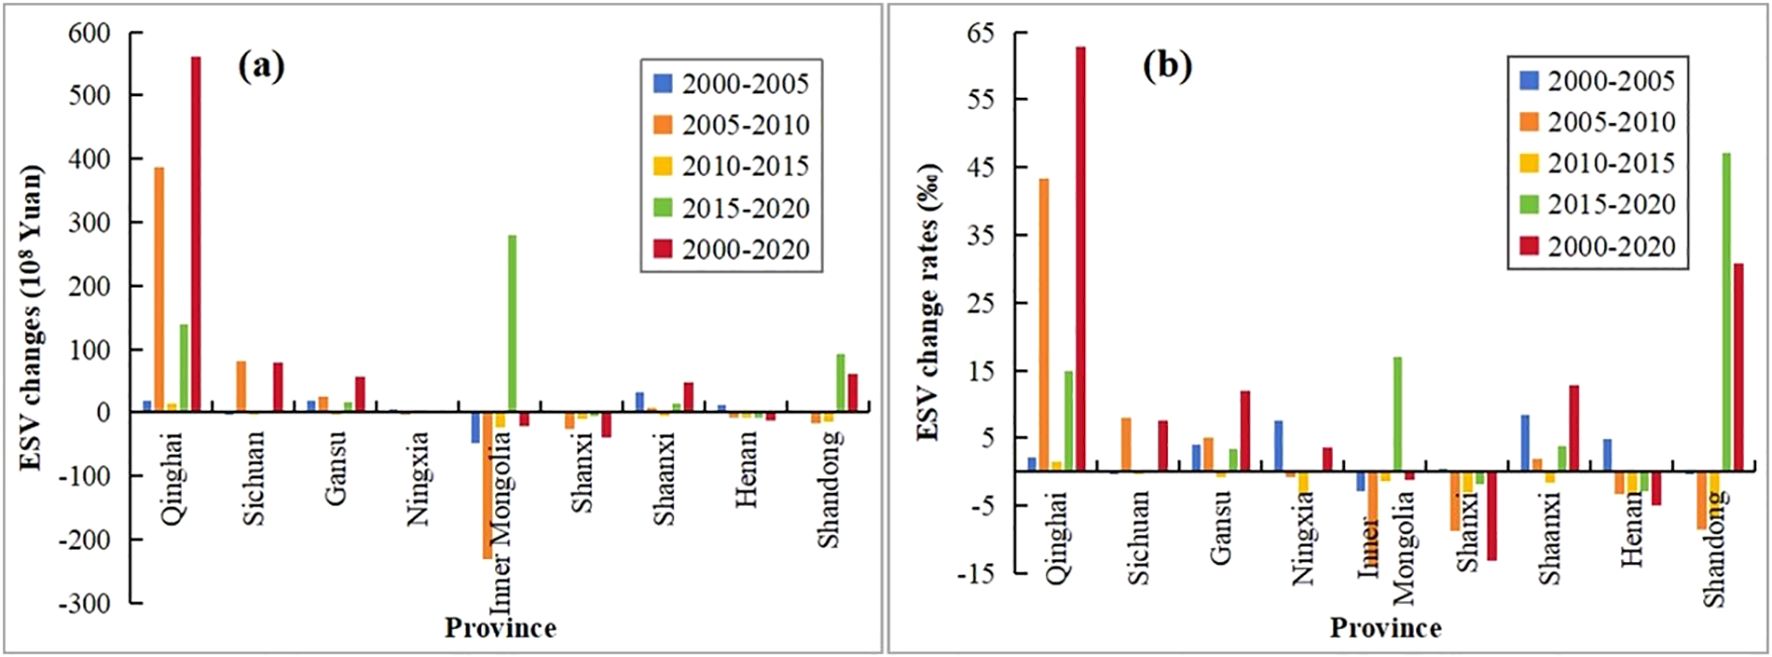
Figure 4. Ecosystem services value (ESV) changes (a), and ESV change rates (b) of different provinces in the Yellow River Basin during five stages.
3.1.2 ESV levels in subtype
Figure 5 shows the ESV in different subtypes. From 2000 to 2020, the changes of various subtype ESs of each province were slightly. Regulating services were the dominant function in all provinces, accounting for more than 50% of the total ESV over the years. Followed by support services, provinces accounted for about 30% over the years. Overall, the ESV in various subtypes in Qinghai were in the order of regulating>support>cultural>provision services, while the other eight provinces were in the order of regulating>support>provision>cultural services. From 2000 to 2020, we conducted a horizontal comparison among various provinces in the YRB and found that all subtypes exhibited spatial characteristics consistent with the total ESV, namely Inner Mongolia>Sichuan>Qinghai> Gansu>Shaanxi>Shanxi>Henan>Shandong>Ningxia.
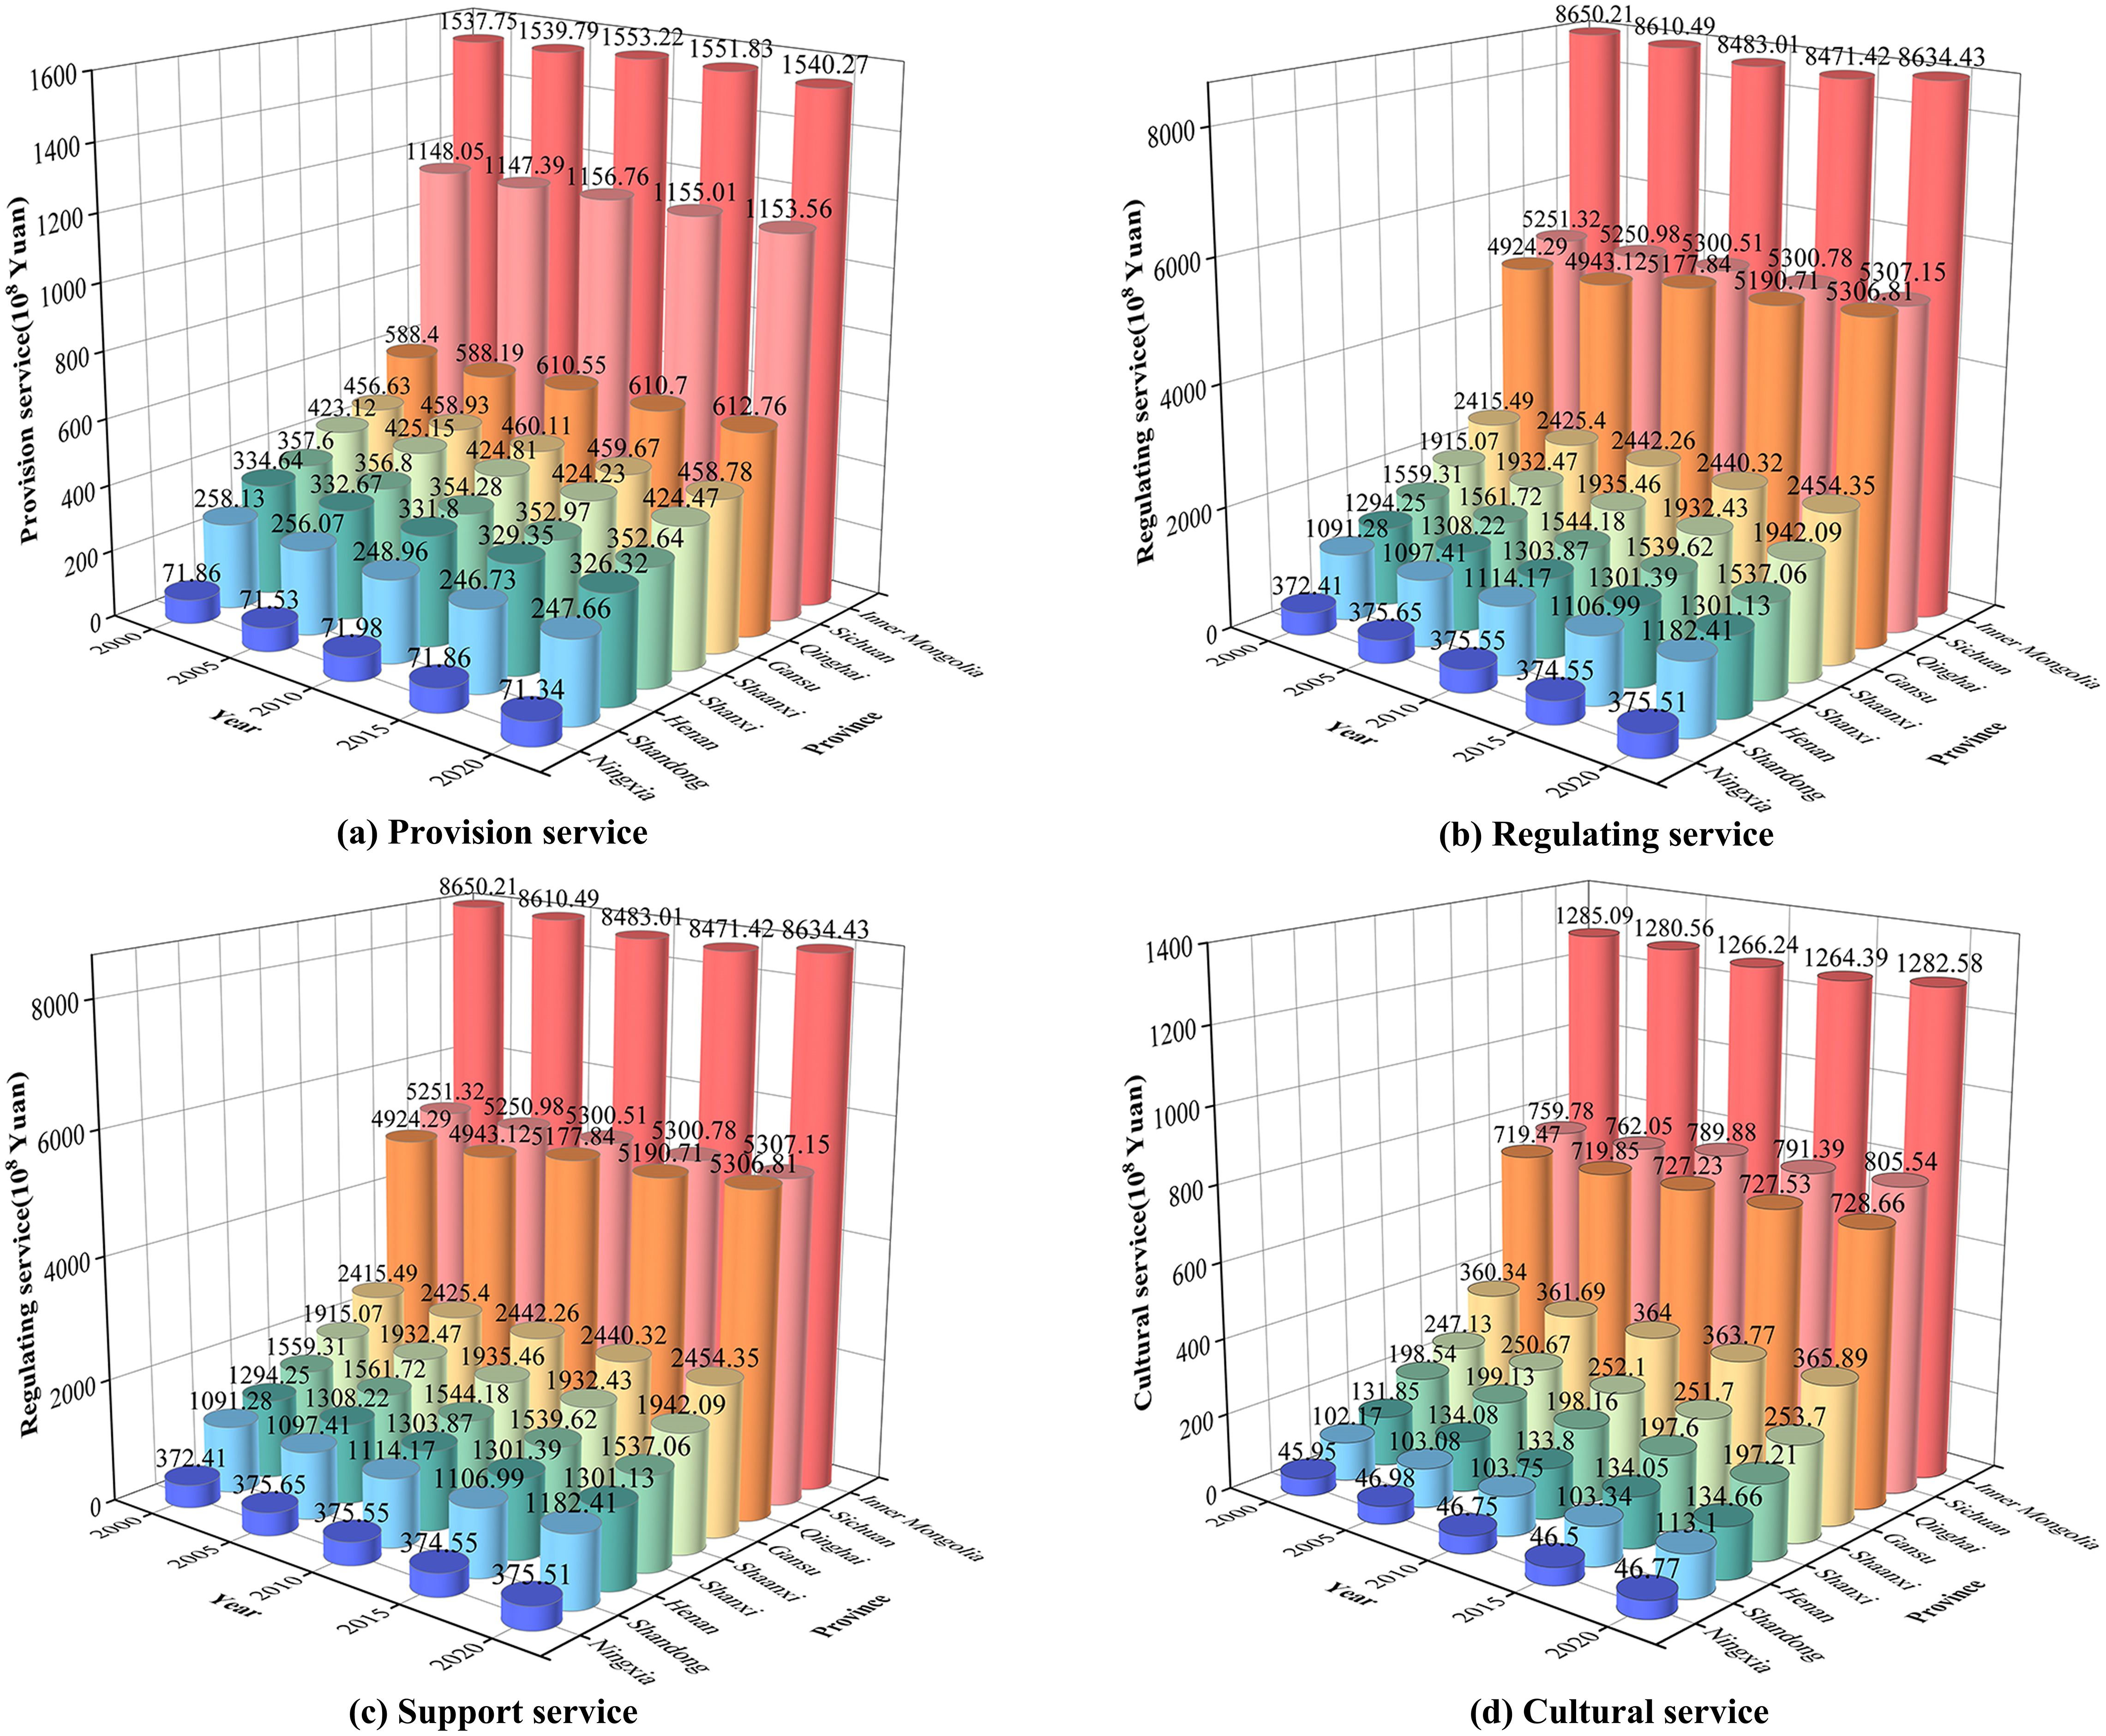
Figure 5. Levels of different substypes of Ecosystem services value (ESV) in different provinces of the Yellow River Basin from 2000 to 2020.
3.2 Characteristics of HWB
3.2.1 Differences of HWB level
Figure 6 illustrates the differences of HWB level across the provinces. The overall trend of HWB showed an upward trend from 2000 to 2020, but Henan experienced a slight, barely noticeable decline between 2000 and 2005, followed by a steady increase. Specifically, the improvement in HWB was relatively slow from 2000 to 2005, and it accelerated significantly from 2015 to 2020. Spatially, Qinghai had the highest HWB level, ranging from 0.4514 to 0.6083. Sichuan and Inner Mongolia followed, with levels ranging from 0.4318 to 0.5802, and 0.4455 to 0.5703, respectively. The other six provinces generally had generally low HWB level. In 2000, the HWB level were ranked as Shanxi>Shaanxi>Henan>Shandong>Gansu>Ningxia, and in 2020, the ranking was Shaanxi>Shandong>Henan>Ningxia>Shanxi>Gansu. Additionally, it is noteworthy that the improvement of HWB in Shanxi was the slowest compared to other provinces, followed by Shaanxi and Henan.
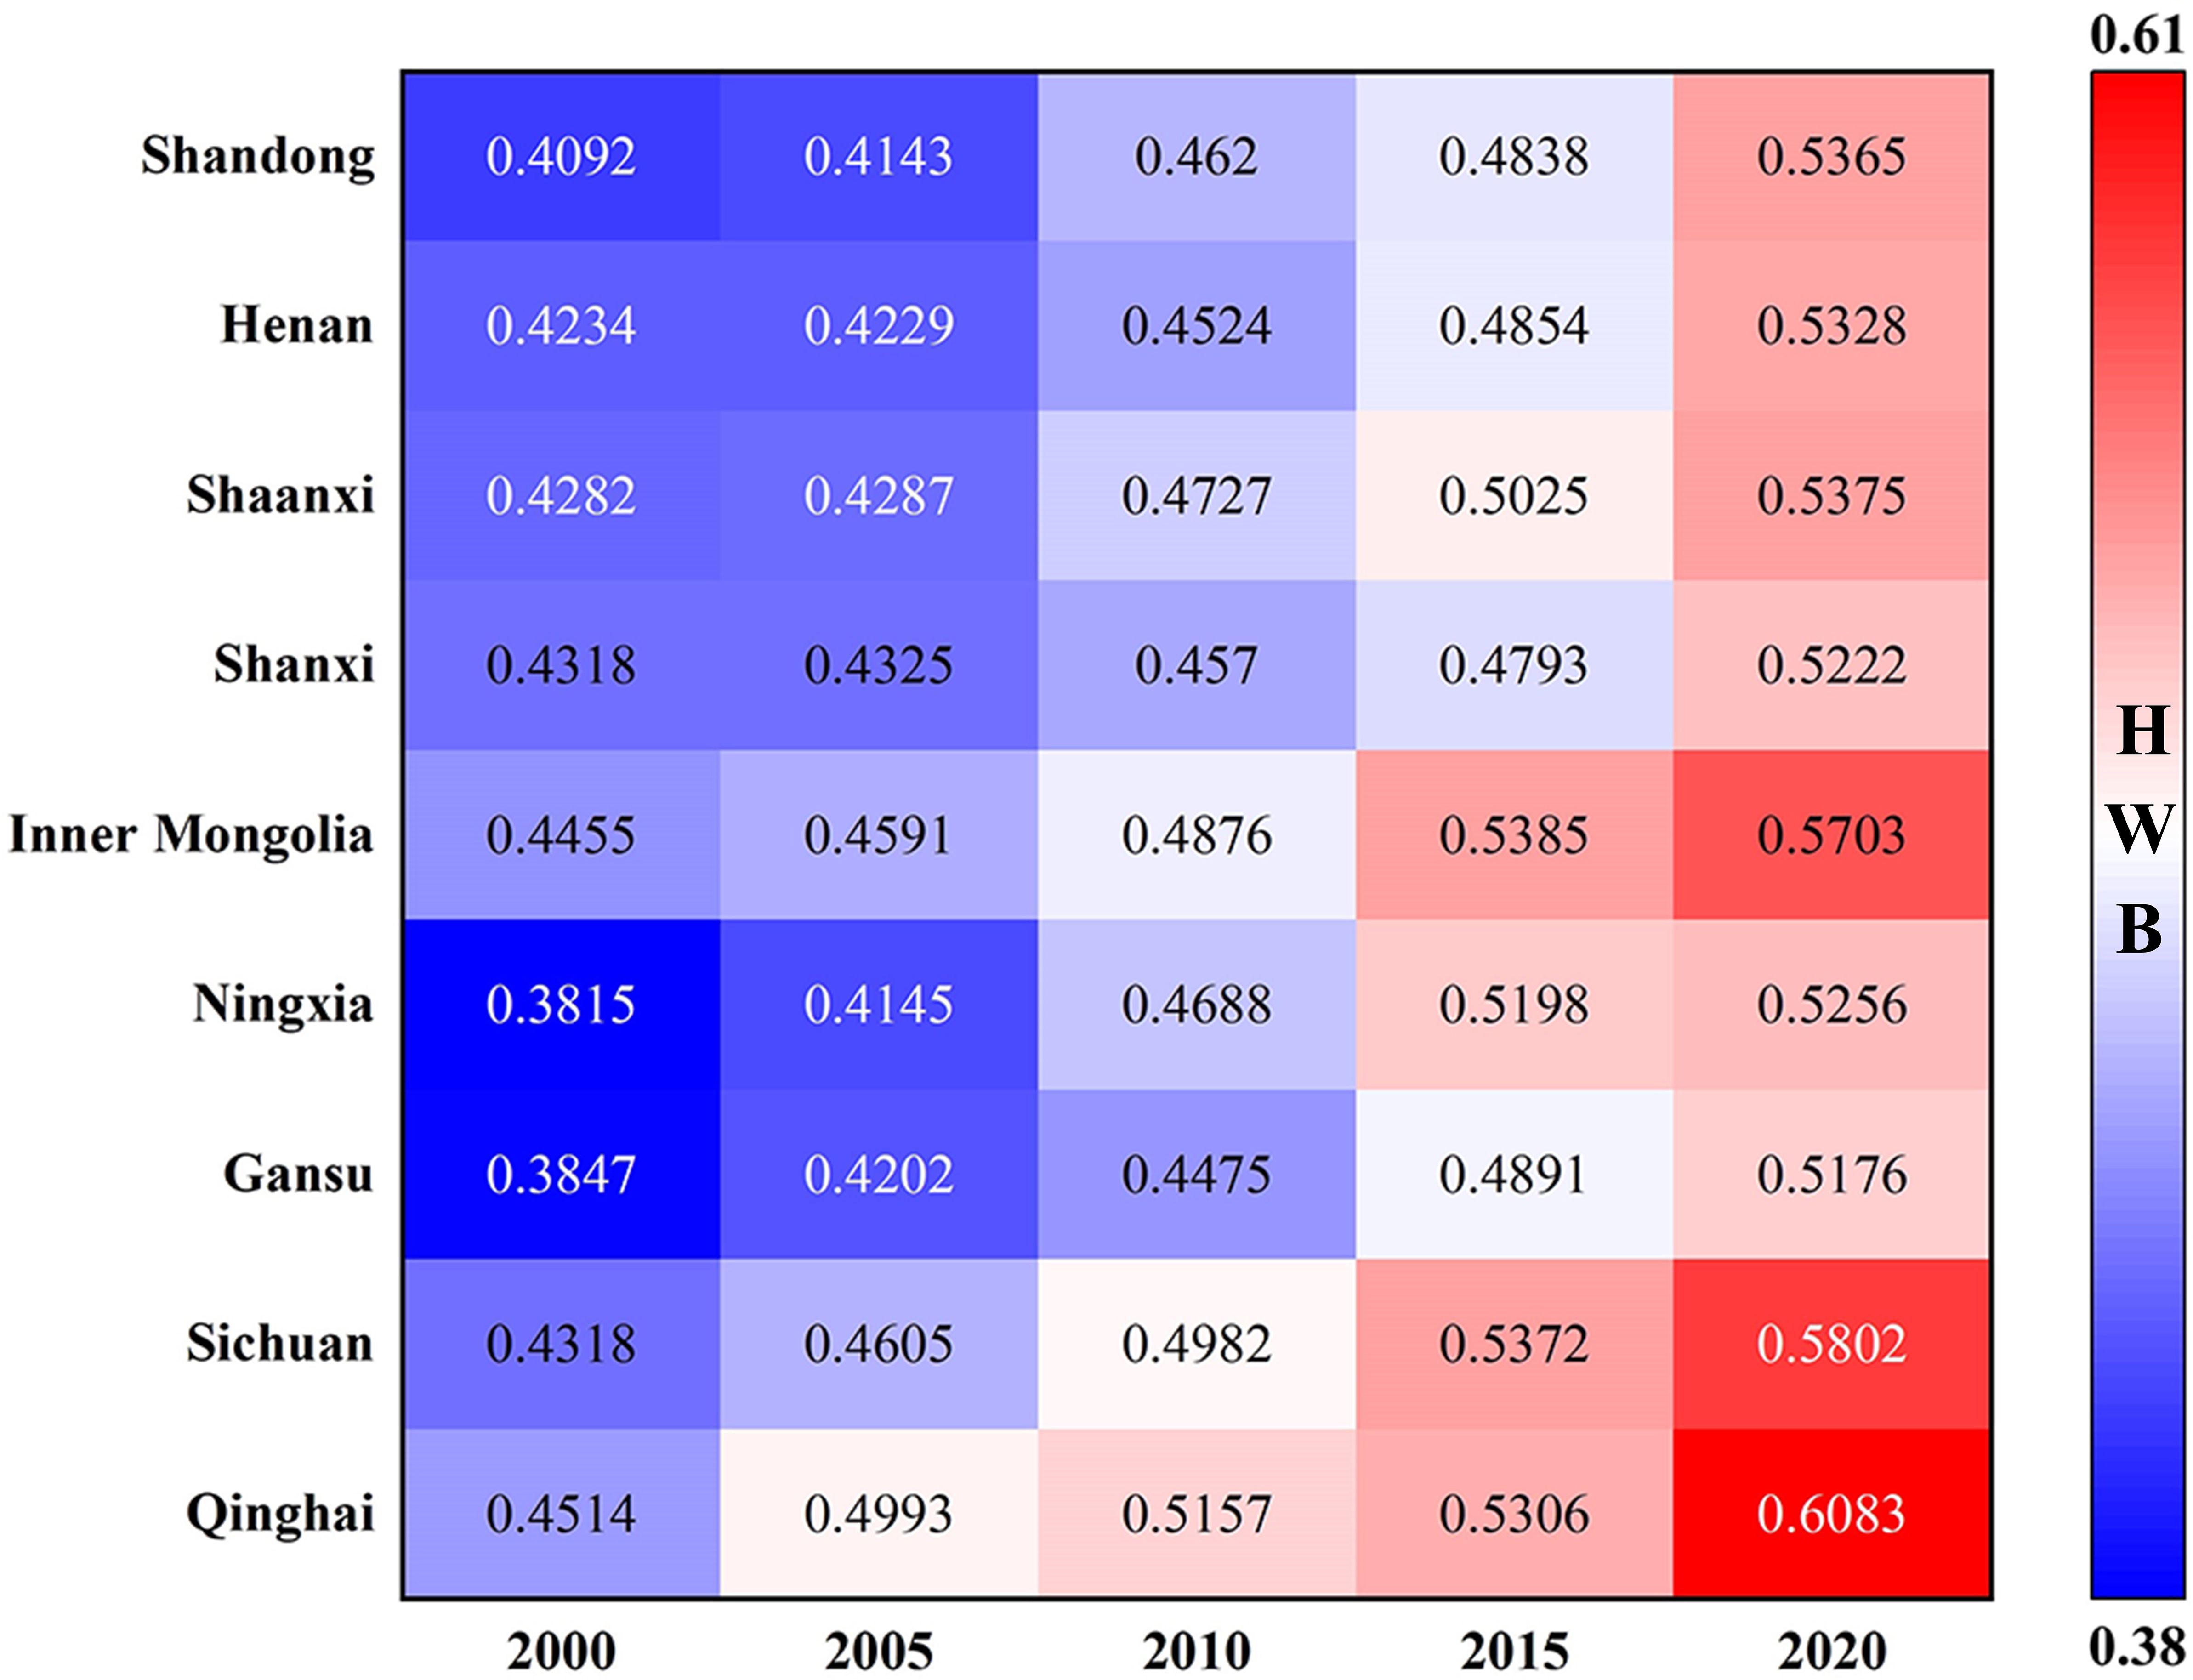
Figure 6. Human well-being (HWB) levels of different provinces in the Yellow River Basin from 2000 to 2020.
3.2.2 HWB levels in subsystem
Figure 7 shows the HWB level in subsystems. Overall, the health and safety well-being level in most provinces of the YRB were generally lower than other well-being levels. In the basic need well-being subsystem, Shandong had the highest level, followed by Sichuan and Henan, with Ningxia having the lowest level. In the health and safety well-being subsystem, Qinghai had the highest level, followed by Inner Mongolia, with Henan and Shanxi having the lowest levels. In the mental fulfillment well-being subsystem, Sichuan had the highest level, followed by Ningxia, with Shandong having the lowest level. Over time, the basic need well-being level of Sichuan improved the fastest, followed by Shaanxi and Henan, with Inner Mongolia, Qinghai, and Ningxia improving slowly. The health and safety well-being level of Sichuan also improved the fastest, followed by Ningxia and Gansu, with Shanxi improving the slowest. The mental fulfillment well-being level of Ningxia and Qinghai improved the fastest, while Shaanxi improved the slowest. The development trajectories of the three subsystems indicated that the basic need well-being level of Ningxia was both low and slow, and the health and safety well-being level of Shanxi was both low and slow. And although the mental fulfillment well-being level among various provinces were not the lowest, their improvement rates were the slowest, and even a decrease in mental fulfillment well-being level occurred in the most provinces from 2000 to 2005 and from 2010 to 2015.
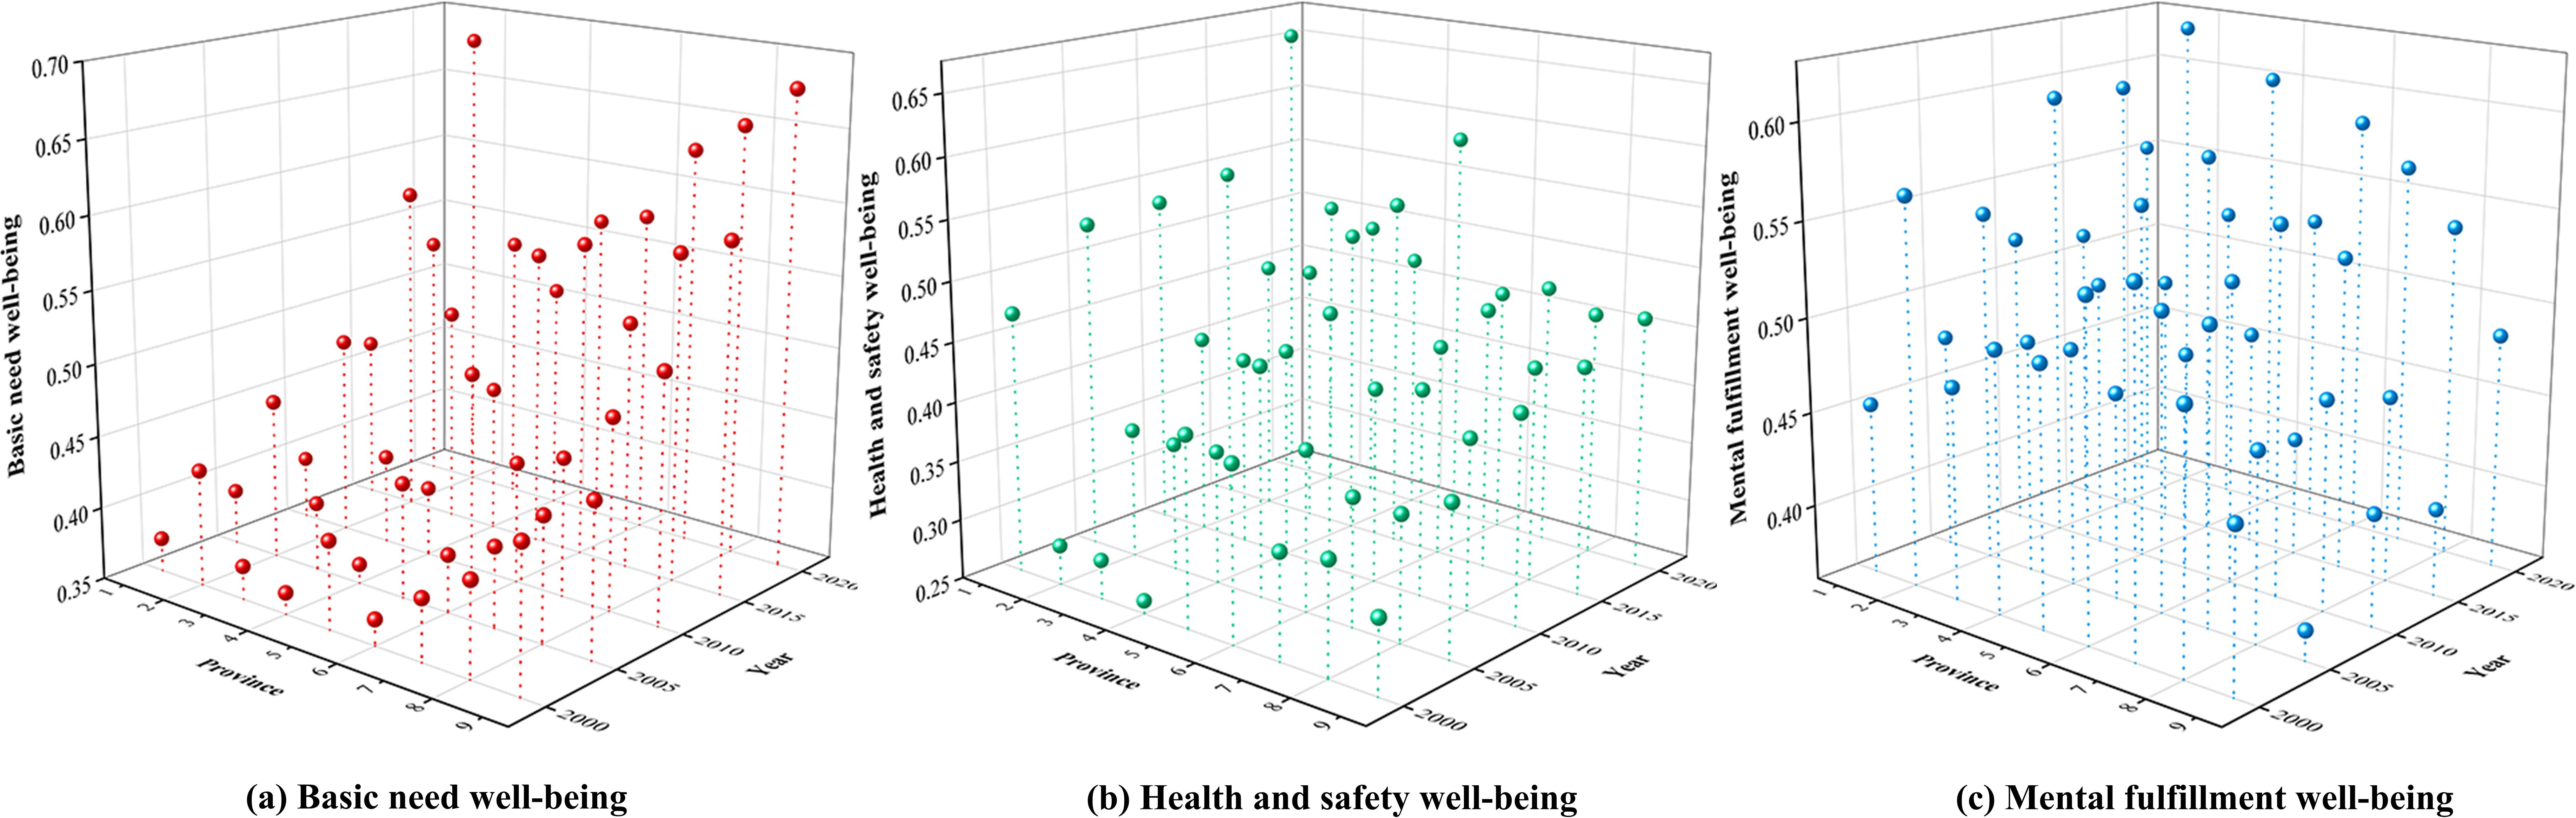
Figure 7. Levels of different subsystems of human well-being in different provinces of the Yellow River Basin from 2000 to 2020 (1: Qinghai; 2: Sichuan; 3: Gansu; 4: Ningxia; 5: Inner Mongolia; 6: Shanxi; 7: Shaanxi; 8: Henan; 9: Shandong).
3.3 Interactive coercing relationship
3.3.1 Whole interactive relationship
Figure 8 shows the CCDs results. From 2000 to 2020, the CCDs of the nine provinces showed a steady growth trend. Among them, Ningxia experienced the largest change for CCD, increasing by four grades, Shandong followed, with an increase of three grades, Qinghai moved up two grades, and the other provinces moved up one grade. Overall, Sichuan, Shanxi, and Shaanxi had higher CCD levels, consistently ranking at the moderate coordination category or above, while Gansu had the lowest CCD level, consistently remaining at the moderate incoordination category or below.
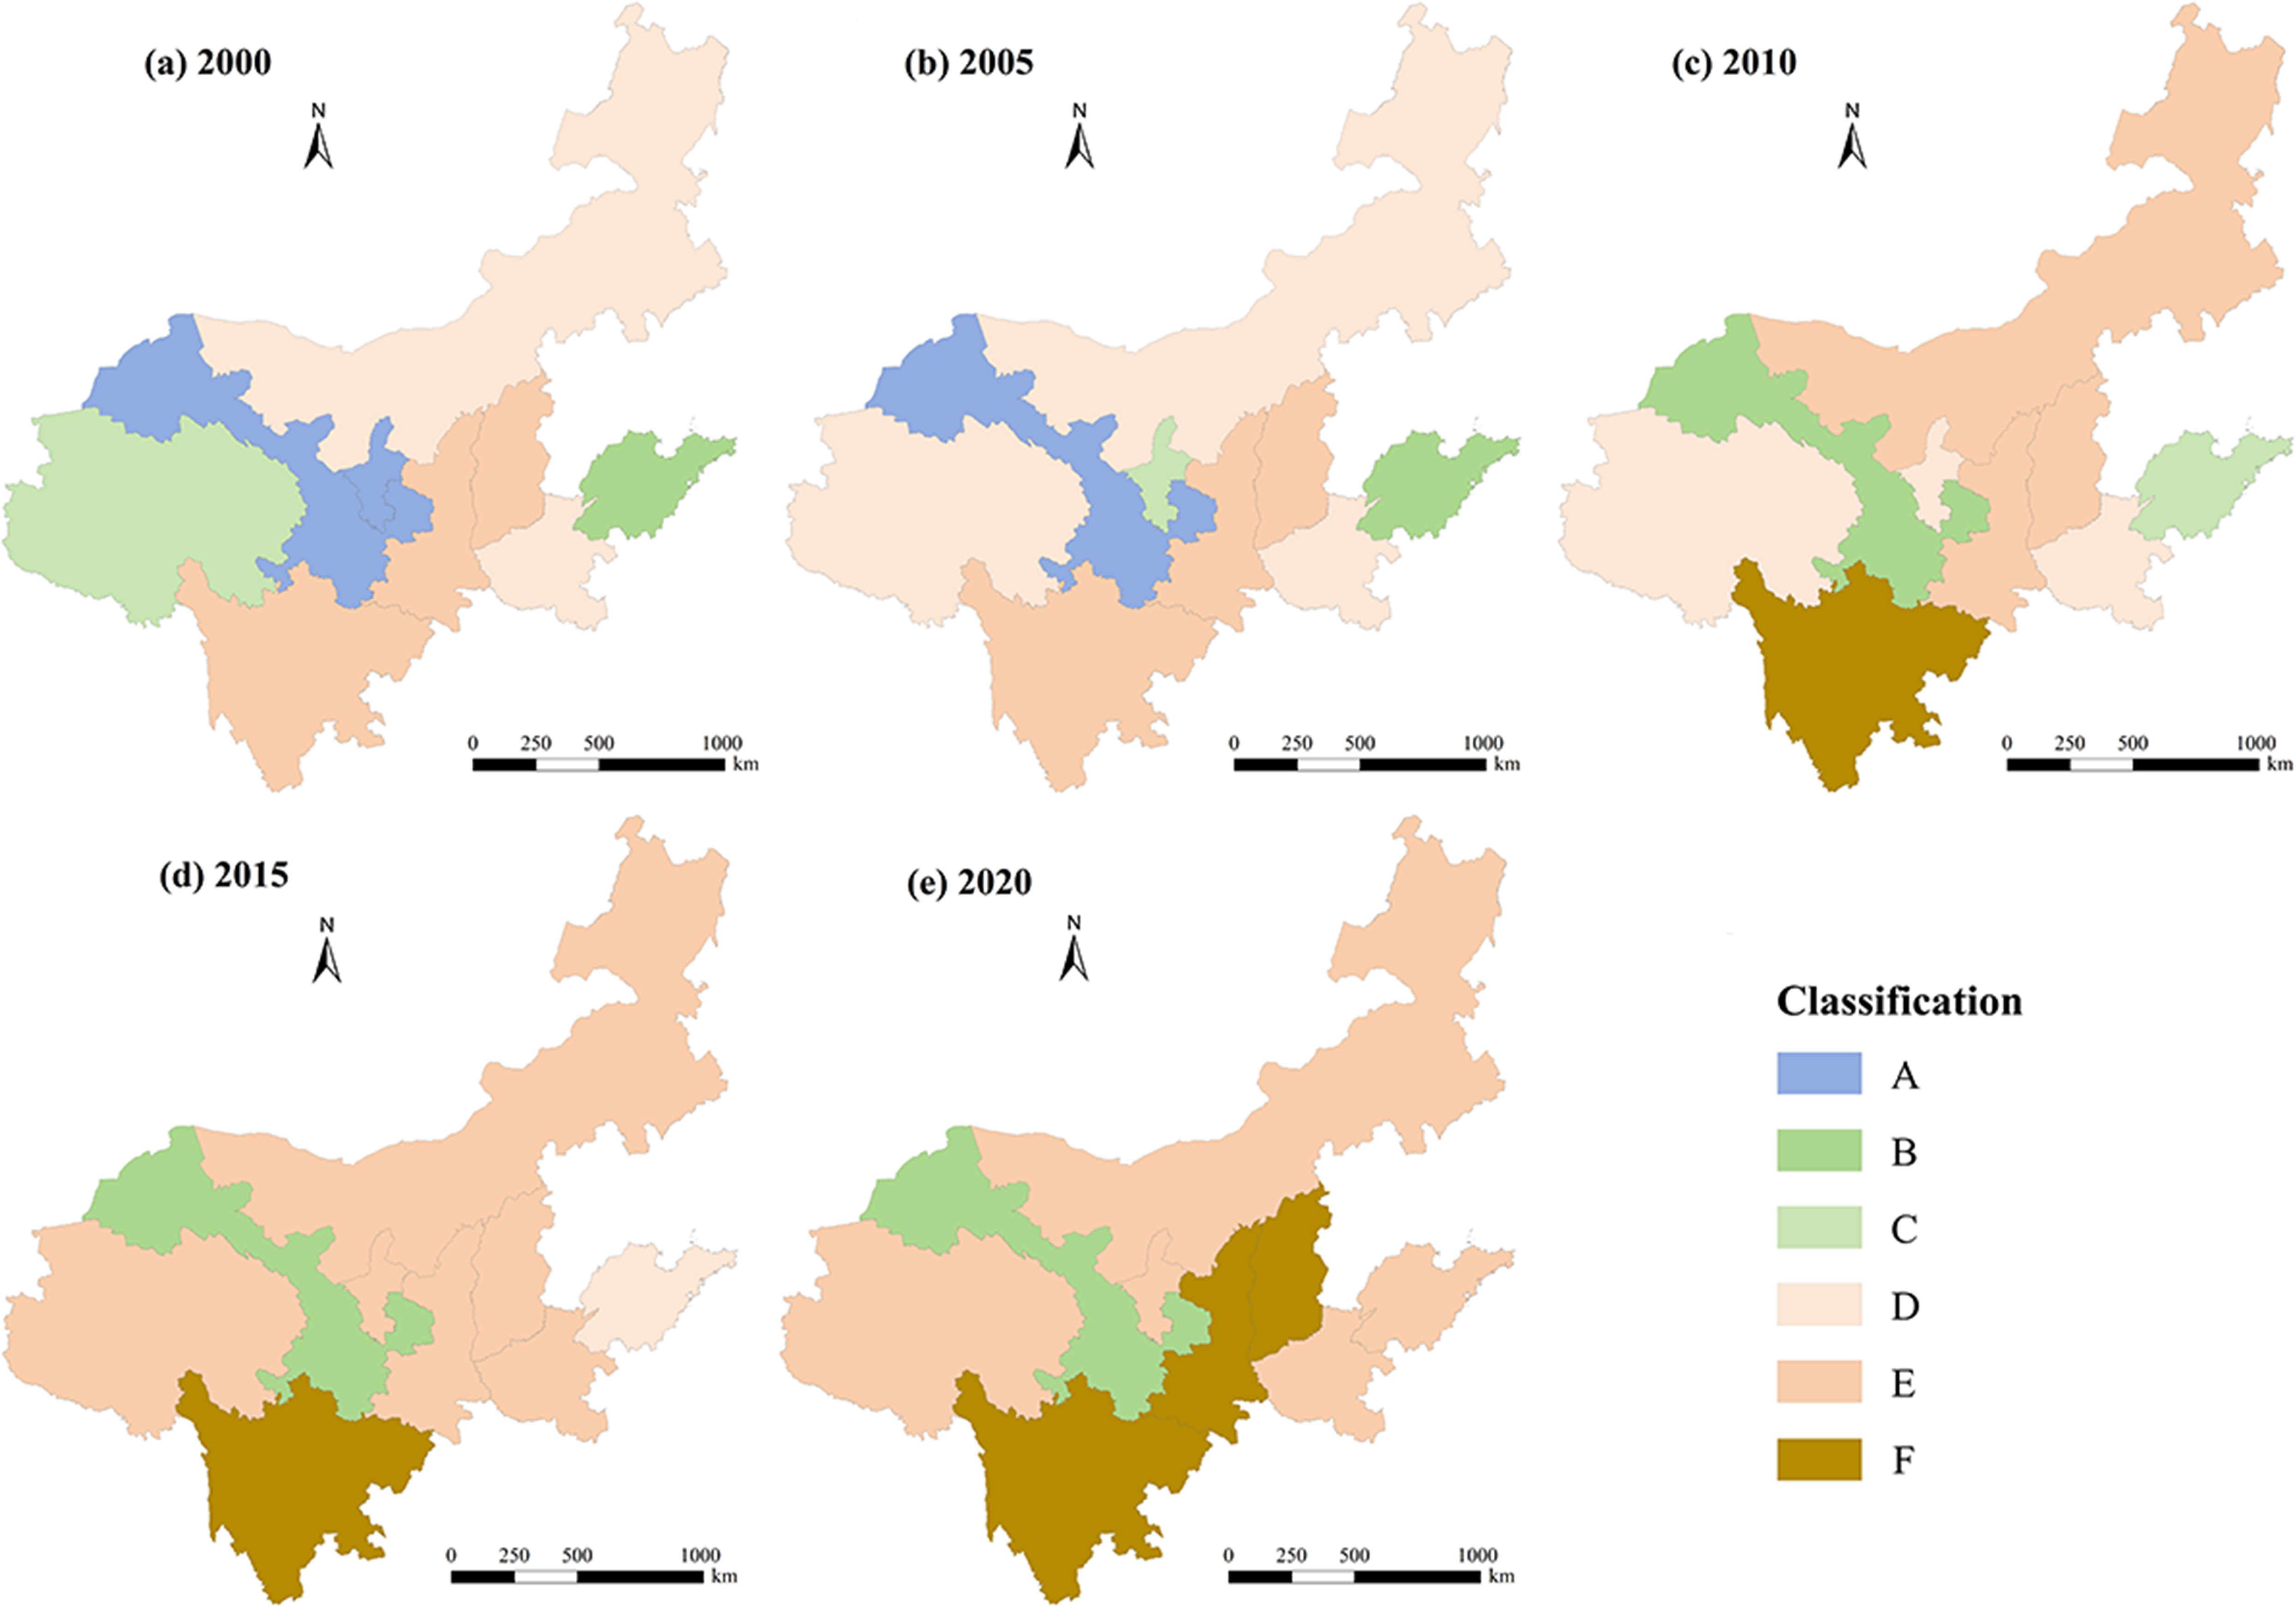
Figure 8. The coupling coordination degree levels between ecosystem services value and human well-being in the Yellow River Basin from 2000 to 2020 (A: Serious incoordination; B: Moderate incoordination; C: Low incoordination; D: Low coordination; E: Moderate coordination; F: Good coordination).
3.3.2 Relationship between ESV and subsystems of HWB
The CCDs between ESV and the subsystems of HWB are shown in Figure 9. The CCDs of basic need well-being, health and safety well-being, and mental fulfillment well-being in Sichuan were higher than other provinces over the years, approaching 1 in 2020. The CCDs of all three subsystems in Gansu were lower than other provinces, remaining below 0.3 from 2000 to 2020, falling into the moderate incoordination category or lower. Overall, the direction and magnitude for CCDs of all three subsystems changed vary among provinces. In all provinces, the CCDs of basic need well-being and health and safety well-being continuously increased over time, and the CCDs variation characteristics of mental fulfillment well-being exhibited significant differences in the change directions between different provinces. Among them, the CCDs of mental fulfillment well-being in Qinghai showed a continuous increasing trend, while the CCD of mental fulfillment well-being in Sichuan, Shanxi, Shandong, Shaanxi, Inner Mongolia, and Henan showed a “W”-shaped variation characteristic, with the most active changes over time. The CCDs of mental fulfillment well-being in Gansu showed an “N”-shaped variation characteristic, and the CCDs of mental fulfillment well-being in Ningxia showed a “V”-shaped variation characteristic. Additionally, in 2020, except for Gansu, where all three subsystems remained in the moderate incoordination category, the CCDs of the three subsystems in other provinces reached the low coordination category or above.
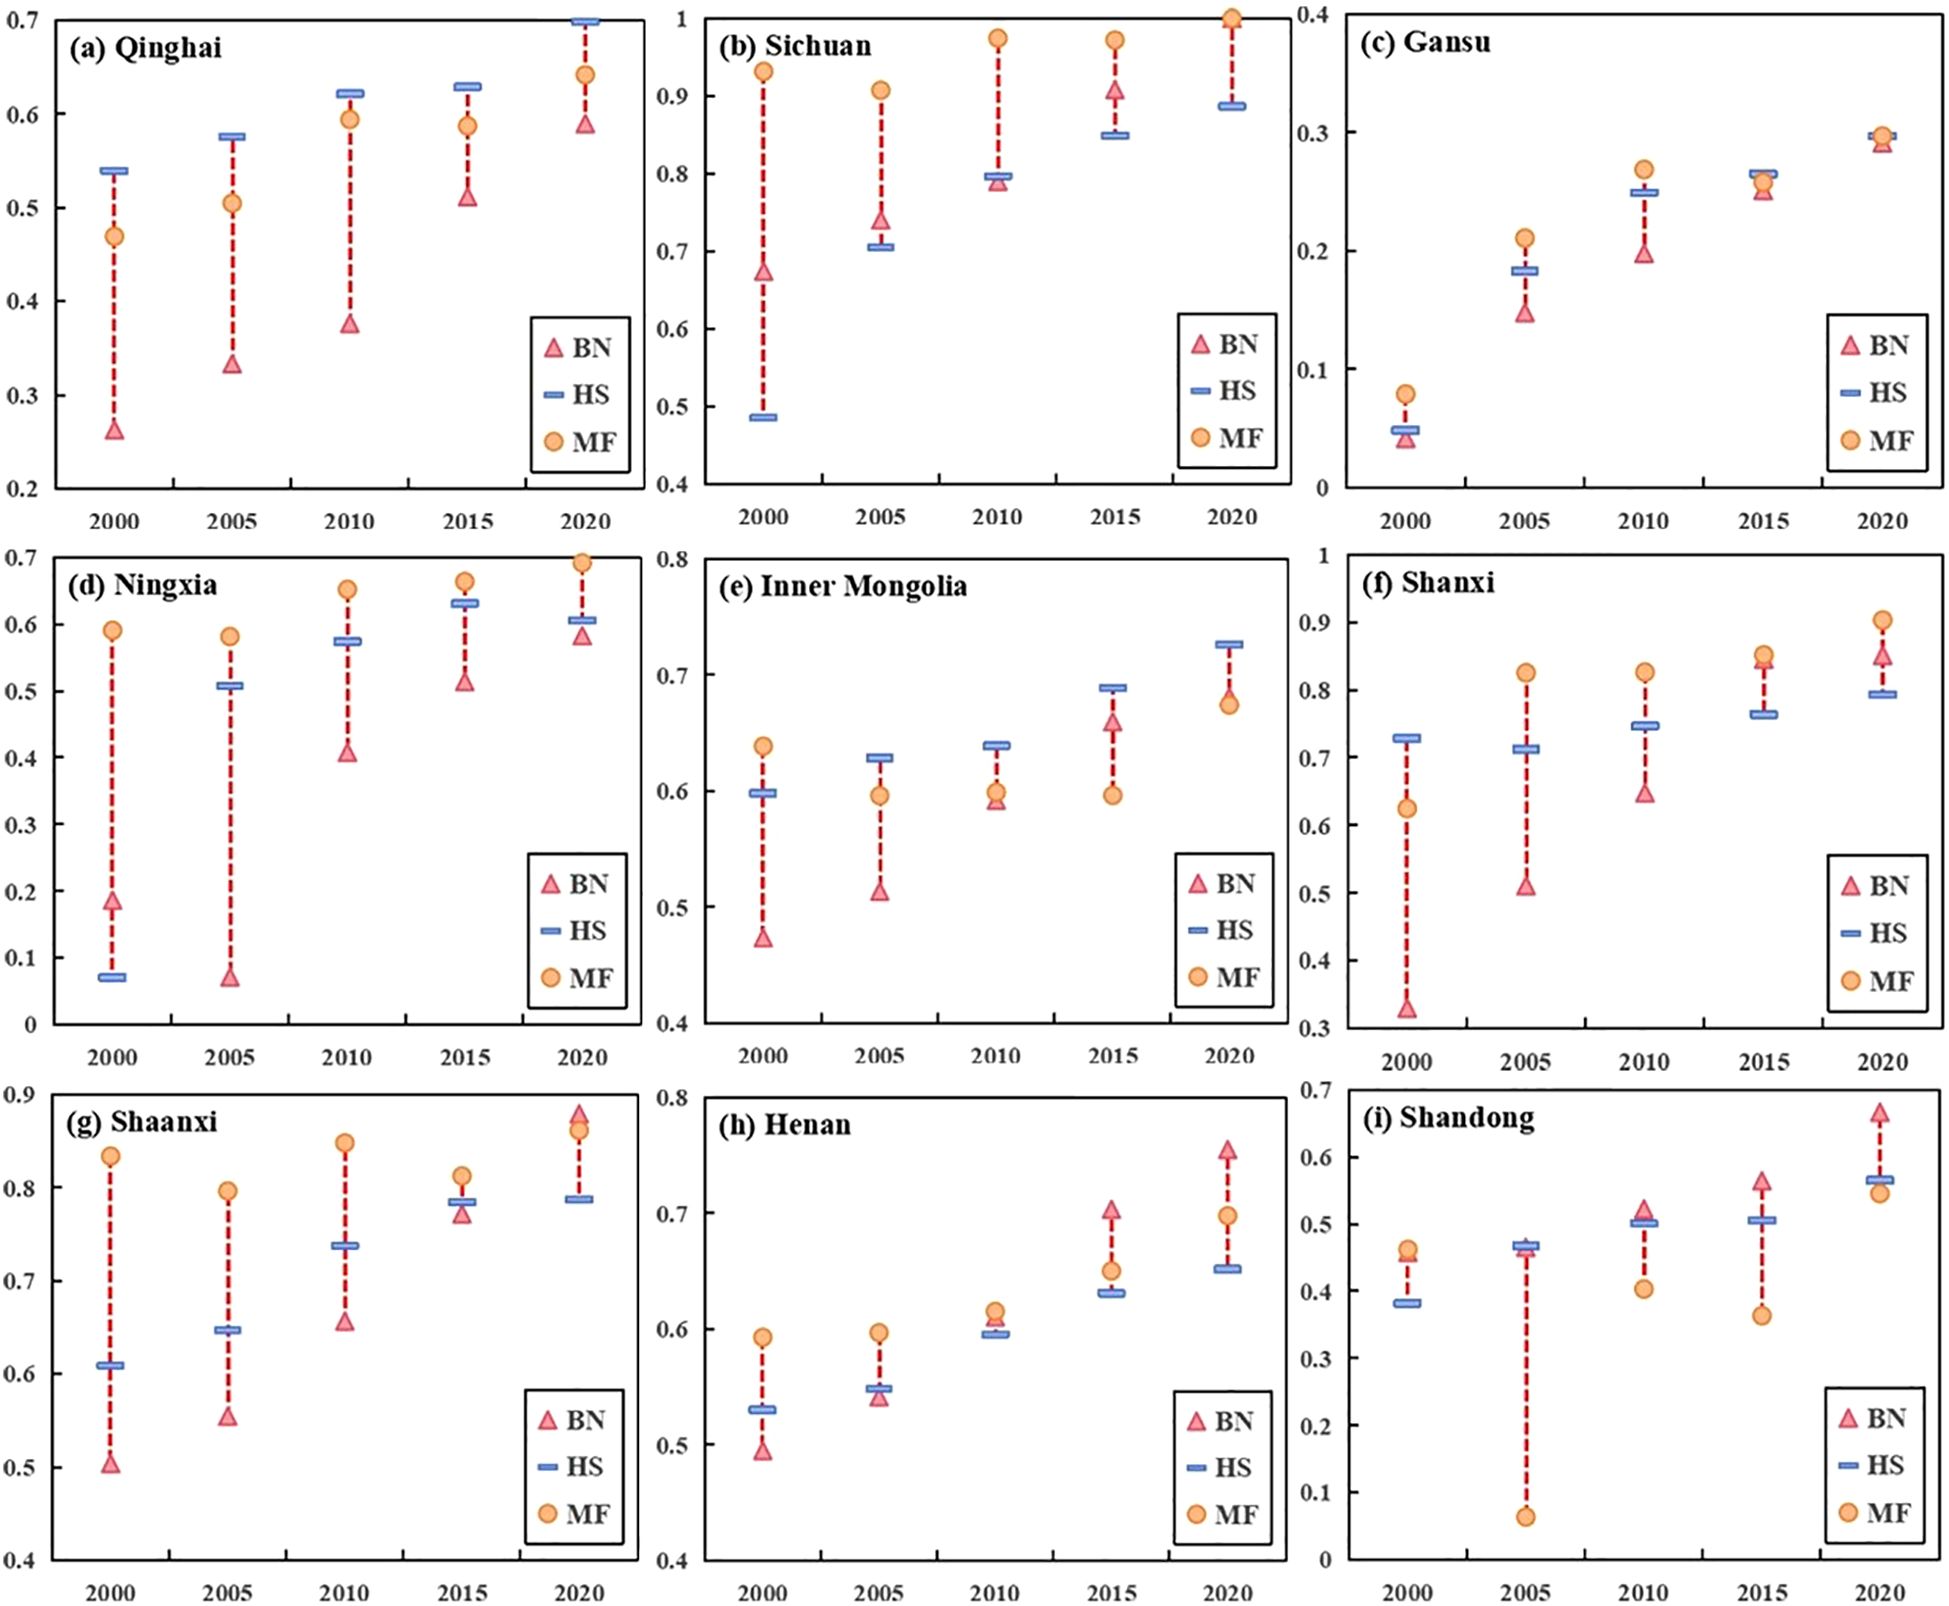
Figure 9. The coupling coordination degree between ecosystem services value and subsystems of human well-being in different provinces of the Yellow River Basin from 2000 to 2020 (BN, Basic need well-being; HS, Health and safety well-being; MF, Mental fulfillment well-being).
3.3.3 Relationship between HWB and subtypes of ESV
The CCDs between HWB and subtypes of ESV are shown in Figure 10. From 2000 to 2020, Sichuan represented the highest level, greater than 0.68. Qinghai displayed the lowest CCDs for provision services with all the values less than 0.39, Gansu had the lowest CCDs for regulating services with all the values less than 0.32, and Shandong had lowest CCDs for support services and cultural services with all the values less than 0.49. Overall, Shandong was an exception, where the CCDs of support services in 2020 (0.300) slightly decreased compared to 2000 (0.306). In contrast, all subtypes of ESV in other provinces showed varying degrees of increase compared to the beginning of the study period, and can even be said to show a positive trend of steady increase year by year. From the perspective of individual provinces, the CCDs between HWB and four subtypes of ESV were relatively balanced in Sichuan, Shanxi, Shaanxi, Ningxia, Inner Mongolia, and Henan. In Shandong, the CCDs between HWB and provision services, and regulating services were relatively high, while the CCDs between HWB and support services and cultural services lagged. Qinghai had a significantly lagging CCDs between HWB and provision services, but a relatively balanced CCDs between HWB and the other three subtypes. Gansu had a significantly lagging CCDs between HWB and regulating services.
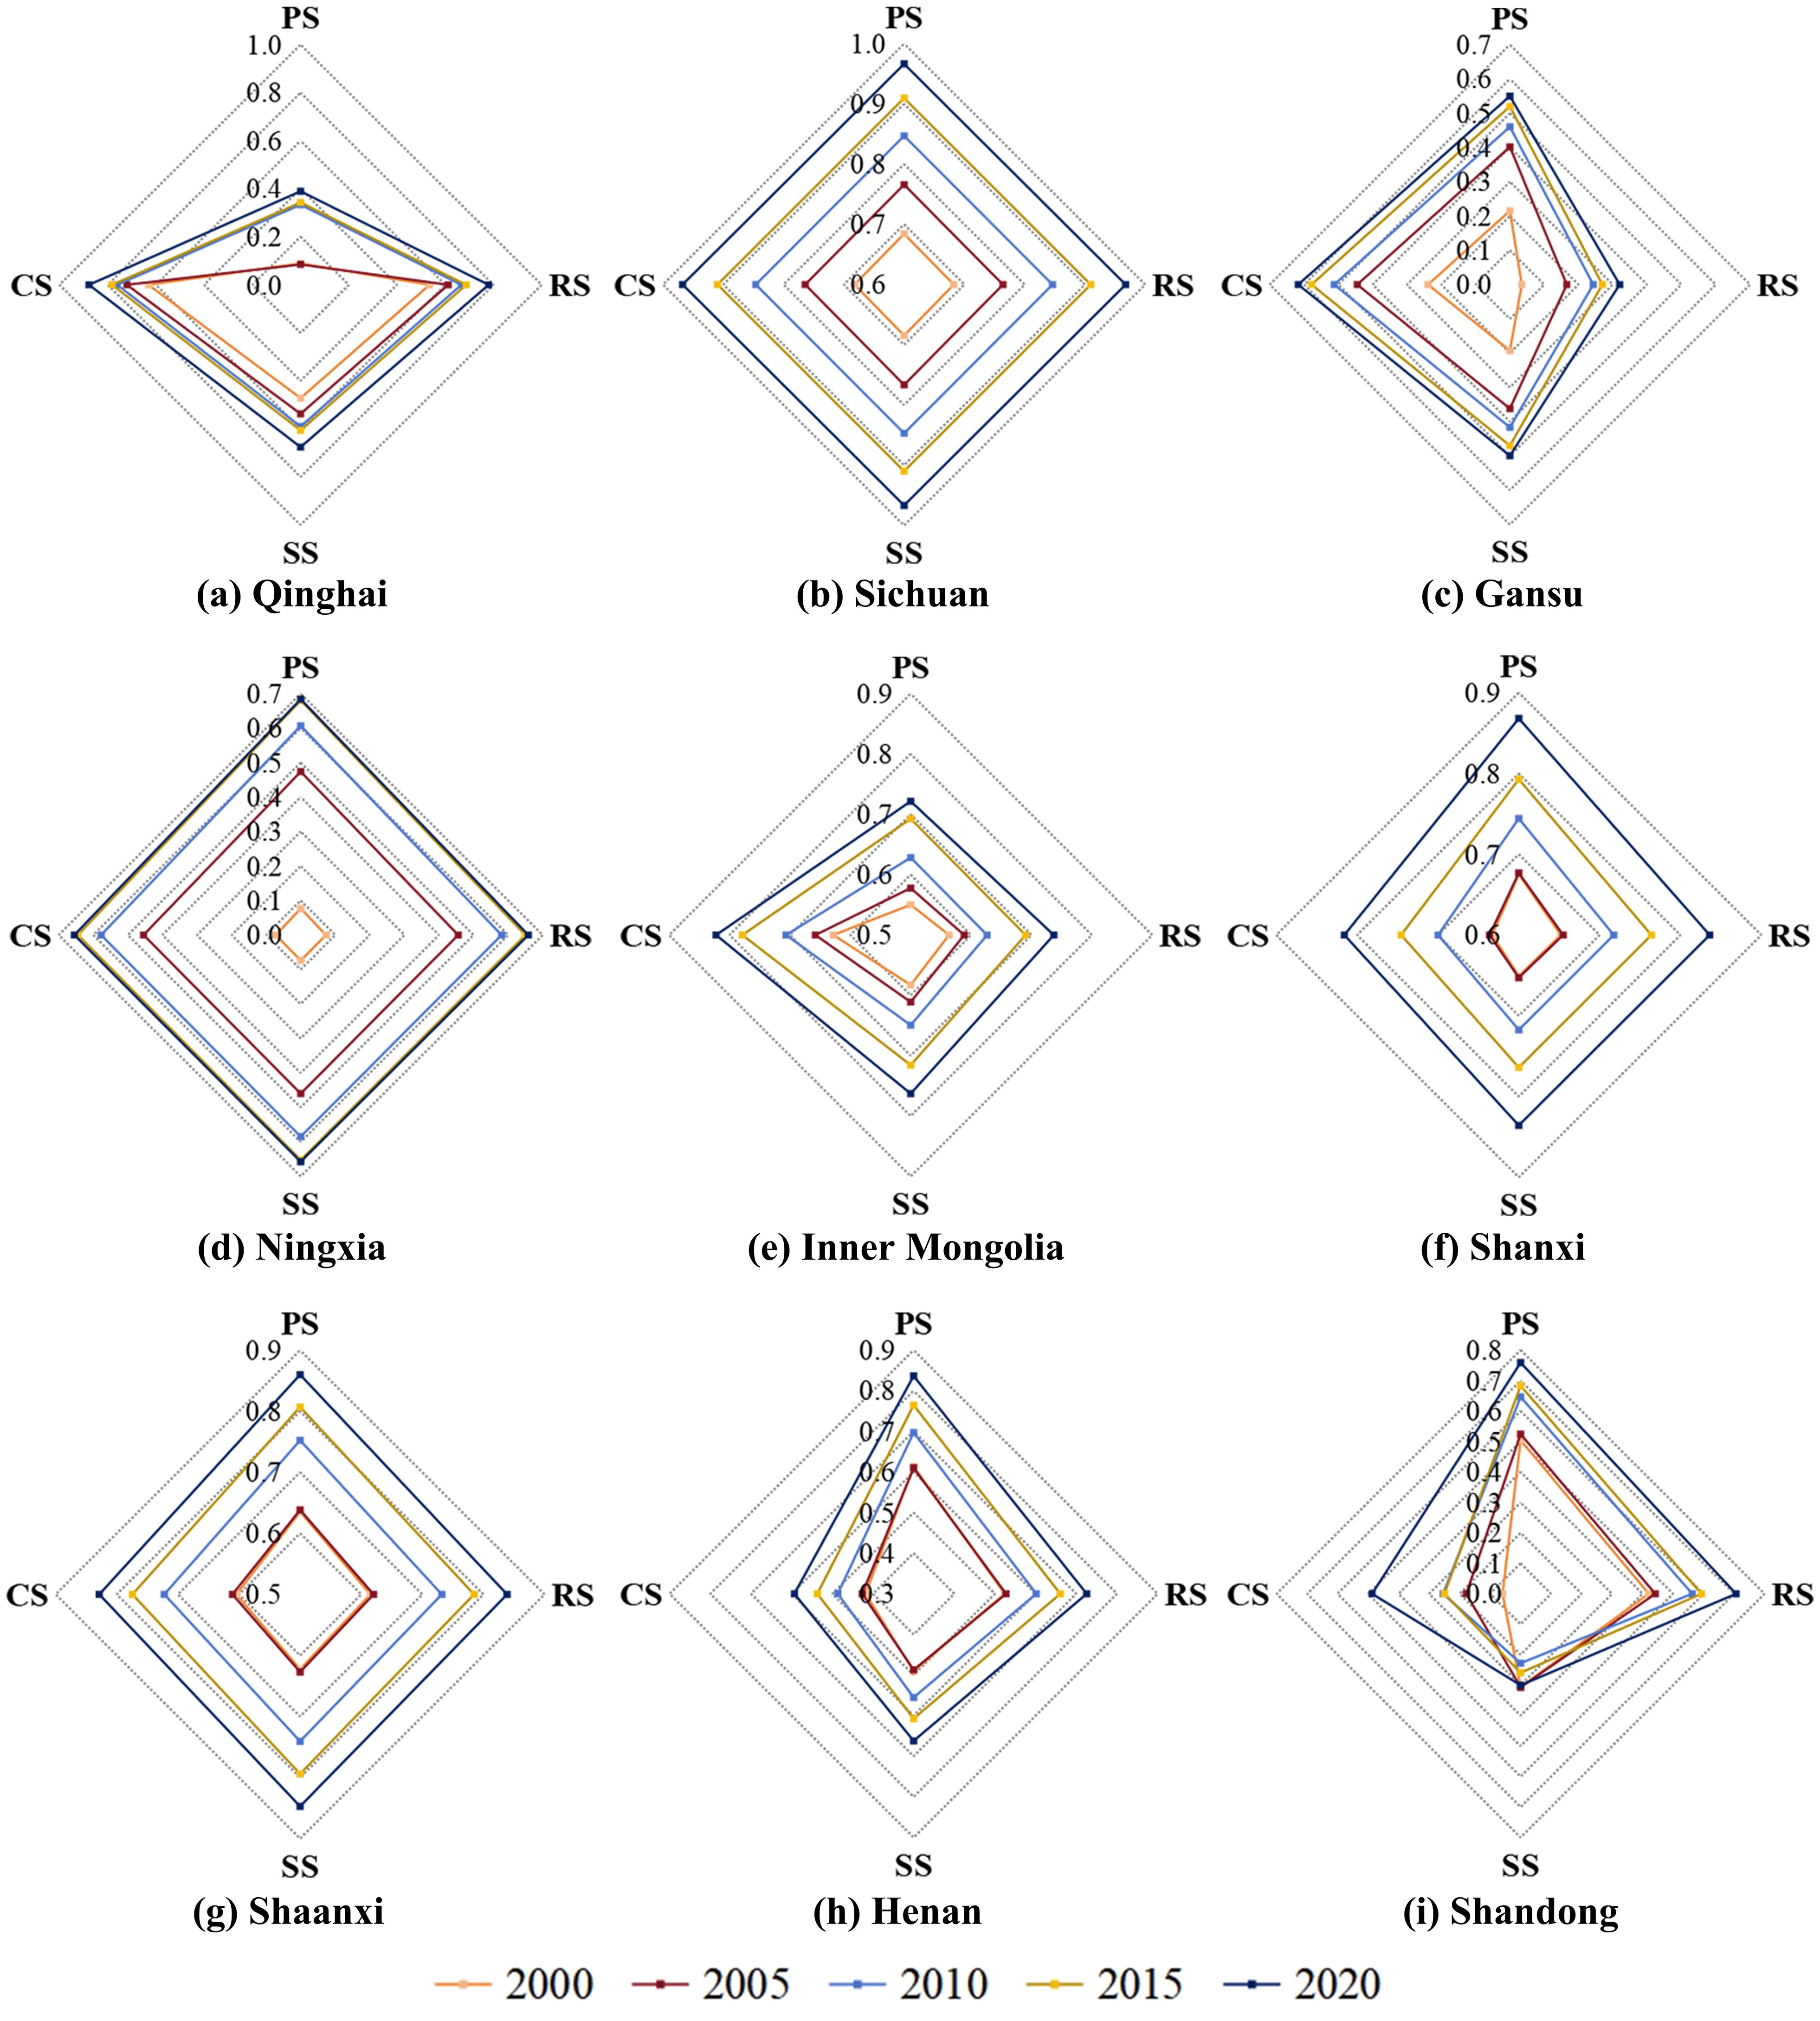
Figure 10. The coupling coordination degree between subtypes of ecosystem services value and human well-being in different provinces of the Yellow River Basin from 2000 to 2020 (PS, Provision services; RS, Regulating services; SS, Support services; CS, Cultural services).
3.4 Prediction results of interactive relationship
We made a 20-year forecasts for the CCDs between ESV and HWB of the nine provinces (Table 5). The highest residual variance value was 0.194, and the posterior difference ratio values were all 1, indicating that the simulations worked well and were able to accurately predict how the CCDs would change over time. The prediction results indicate that from 2025 to 2040, the CCD for each province will grow continually. In 2025, The CCD value of Sichuan will reach the highest, indicating a state of high-quality coordination. Over time, Shaanxi (2030), Shanxi (2035), Ningxia (2040), Henan (2040), and Shandong (2040) will successively reach their highest values. However, the CCDs in Qinghai, Inner Mongolia, and Gansu will not reach 1 within the prediction period, especially in Gansu, where the gap is the largest. In general, the coupling system between ESV and HWB in the YRB will show a positive development trend.
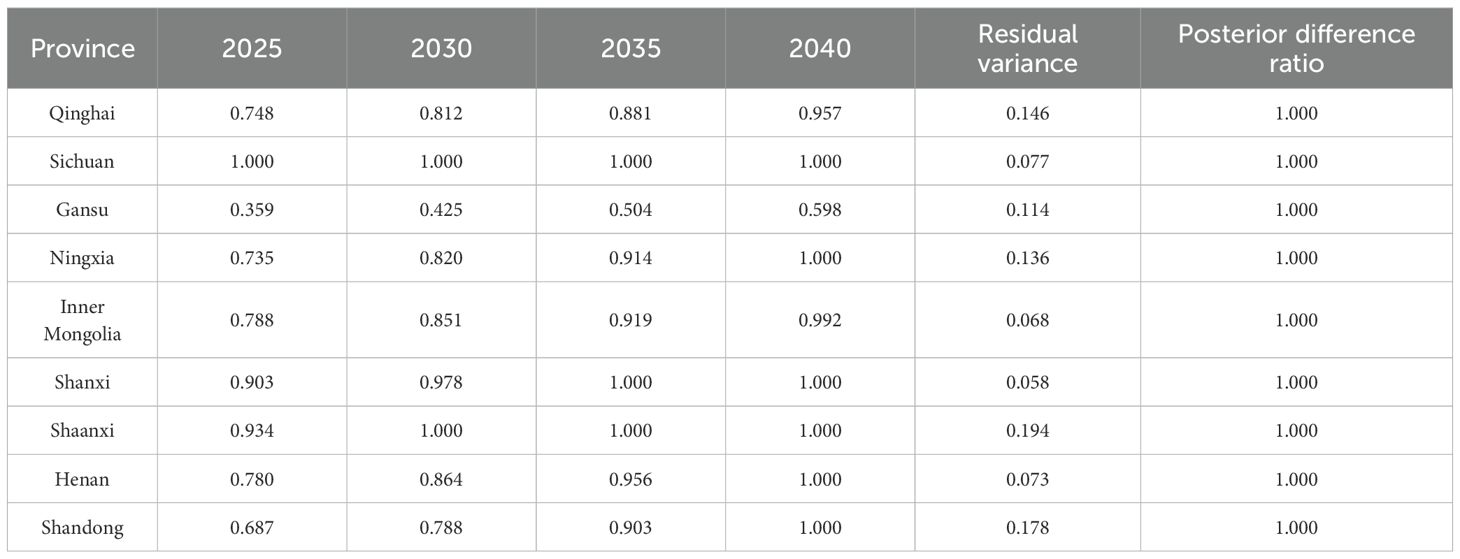
Table 5. The prediction values of CCD.
4 Discussion
4.1 Reasons for the changes of ESV and HWB
ESV and per unit area ESV in Sichuan were consistently high, while ESV and per unit area ESV in Shandong were relatively low. Such disparity is closely related to the entrenched land use structure of the two provinces during the study period. Sichuan predominantly comprises ecological lands like forestland and grassland (see Supplementary Figure S2 of Supplementary Material), with these two land types covering approximately 70% of the area throughout the study period. In contrast, the ecological land area such as forestland and grassland in Shandong is relatively small, accounting for about 10% over the years, with a weak ecological foundation and low ESV that can be provided. In addition, we also found that the ESV of Qinghai, Sichuan, Gansu, Ningxia, Shaanxi and Shandong increased over time, while the ESV of Shanxi, Henan and Inner Mongolia decreased. This divergent trend may be related to the shifting directions of land use types. During the study period, the three provinces where ESV decreased showed a trend of decreasing grassland and increasing forestland, but the decrease in grassland was significantly greater than the increase in forestland. Combined with the significant expansion of construction land in the three provinces had squeezed the ecological space, resulting in varying degrees of reduction in ESV. In the six provinces where ESV increased, the directions of land use change were more complex. Among them, the main reason for the increase of ESV in Gansu and Shaanxi was the significant increase of forestland and grassland brought about by the implementation of favorable projects such as the Grain for Green Project (Yang et al., 2022); the increase of ESV in Sichuan and Ningxia primarily resulted from the conversion of low-value land types to high-value land types; the increase of ESV in Qinghai was largely attributed to a significant expansion of grassland and water bodies; while Shandong’s increase stemmed from substantial ecological benefits associated with the enlargement of water bodies.
Our study found that HWB in all provinces of the YRB is showing a positive and favorable development trend. This trajectory not only aligns with China’s national conditions and reflects the people-centered philosophy upheld by the Communist Party of China, but is also in line with the research results of Zhang et al. (2023a) and Li et al. (2023). However, we found that the rate of improvement for HWB varied across different periods, with the fastest improvement occurring from 2015 to 2020. This period coincided with China’s vigorous implementation of targeted poverty alleviation policies. Generally speaking, for low-income or impoverished areas, economic factors are the key factors affecting HWB (Vollebregt et al., 2024). Due to various reasons such as history and natural conditions, economic and social development within the YRB is relatively lagging behind, and it is a region in China where the impoverished population is relatively concentrated. Since the implementation of the targeted poverty alleviation policies in 2015, there has been a significant improvement in HWB, which is in line with the research results of Li et al. (2023). In addition, HWB is largely dependent on the ESs provided by well-functioning ecosystems (Dawson and Martin, 2015), and changes in ESs can direct or indirect impact HWB (Jonesa et al., 2016). Thereby, the high ESV in Qinghai, Inner Mongolia and Sichuan significantly improved HWB, while the decrease of ESV in Shanxi and Henan inhibited the rate of improvement for HWB in these two provinces. In addition, we also found that the rate of improvement for HWB in subsystem of the mental fulfillment well-being was the slowest, and many provinces even experienced a decrease in some periods. As mentioned above, the improvement of economic level will significantly promote HWB, but blindly pursuing economic growth may bring negative impacts on the ecology and environment (Arora and Ratnasiri, 2015). Such impacts can thereby lead to people feeling unhappy at the level of mental fulfillment well-being. Moreover, with the improvement of socioeconomic level, people tend to prioritize the satisfaction of basic needs well-being, and health and safety well-being (Estes and Sirgy, 2019; Xu et al., 2019; Fan et al., 2024), only later focusing on the mental fulfillment well-being, which is consistent with Maslow’s hierarchy of needs theory.
4.2 Interactive mechanism between ESV and HWB
Breaking away from the traditional cascade framework and examining the interaction between ESs and HWB from a coupling perspective that integrates systems, is an inevitable choice for addressing Human-Natural coupling system issues under the context of the “Anthropocene” (Zhao et al., 2018; Fu et al., 2021). ESs and HWB are considered two interdependent systems, and properly coordinating their relationship is crucial to achieving SDGs (Kibria et al., 2022; King et al., 2024). The analysis conducted in our study revealed the coupling coercing relationship between ESs and HWB, and its concrete manifestation, including detailed analysis at both the system and subsystem levels. On the whole, we observed a long-term increasing trend of the CCD between ESV and HWB across various provinces, with projections extending into the next 20 years. However, the complex interactive relationship between ESV and HWB in the YRB has not been well optimized. First, there was an imbalance in the relationship among ESV and the subsystems of HWB across the YRB. And we could even see significant differences among ESV and the subsystems of HWB within the province, as well as between HWB and subtypes of ESV. Notably, during certain periods, the coupling coordination relationship between mental fulfillment well-being and ESV in some provinces deteriorated. And the relationship between support services and HWB in Shandong also deteriorated. These results reflect both a positive resonance effect of coupling and mutual promotion between ESV and HWB, as well as a coercive correlation effect.
ESs are influenced by natural endowments and landscape patterns, leading to significant spatial heterogeneity (Yang et al., 2021). HWB is influenced not only by geographical location and natural conditions but also by other factors such as society and economy (Yee et al., 2021), leading to a spatial distribution that does not always align with ESs (Fan et al., 2024). Consequently, notable differences emerged in ESV, HWB, and their relationship among provinces in the YRB. Moreover, ESs and HWB both belong to multi-scale, multi-level, and complex dynamic open systems (Qiu et al., 2021). The former mainly carries or constrains HWB through provision, regulating, support and cultural services (MA, 2005), while the latter promotes or coerces ESs through distinguishing economic, social, and environmental well-being needs (Xu et al., 2019). Ecosystems can sustainably provide ESs in a healthy state, ensuring the maintenance or protection of HWB. At the same time, improving HWB will promote the conservation of ecosystems or increase the development of natural capital, and the demand preferences of HWB can also directly or indirectly feed back to the adjustment of ecosystem structure and function. This feedback mechanism ultimately alters ESs and impacts HWB anew (Wang et al., 2013; Lu et al., 2021), thereby forming a close bi-directional coupling relationship between the two (Figure 11). For instance, human change land use types, patterns, and intensities to satisfy their own needs, resulting in changes of ecosystem types and ESs. This alteration affects key ecological processes such as material cycling and energy flow, which in turn impact HWB (Mashizi and Sharafatmandrad, 2021; Thakrar et al., 2023). Even in ecologically fragile areas with limited arable land or low productivity, local residents facing livelihood difficulties may increase their efforts to utilize fragile environments to improve their own well-being, which will further lead to ecosystem degradation and increased poverty (Pan et al., 2020). This situation ultimately results in a vicious cycle of “ecological degradation - HWB decline”. Fortunately, our study did not find such a vicious cycle in the YRB. However, based on our results, Gansu, as the province with the worst relationship between ESV and HWB in the last 20 years, will still not achieve good coordination in the next 20 years. Such phenomenon not only exposes some problems in the development process of this province, but also means that it will face greater challenges in foreseeable future.
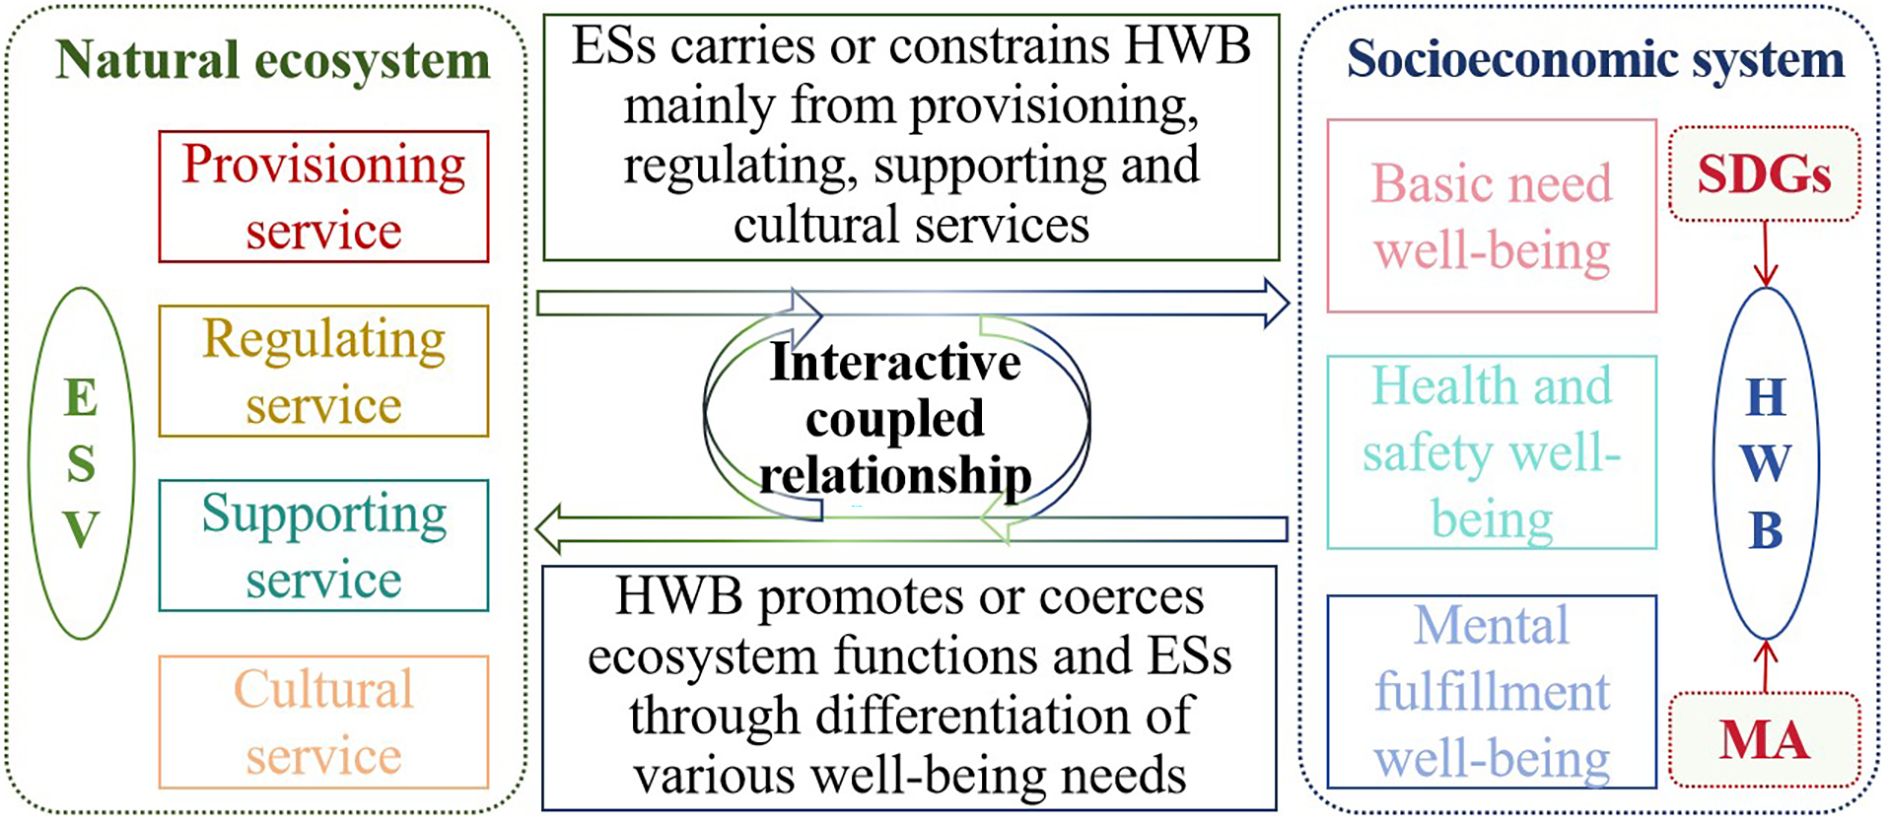
Figure 11. The interactive coercing mechanism between ecosystem services value (ESV) and human well-being (HWB).
4.3 Implications for promoting sustainable development
Evaluating the relationship between ESV and HWB is a necessary condition for assessing whether the regional development paths are reasonable and align with sustainable development standards, which helps the government to adjust future development policies. Currently, China attaches great importance to the development of YRB (Xi, 2019), in order to coordinate ecological protection with the improvement of HWB (Fu et al., 2021). Based on the coordination analysis between ESV and HWB, we further compared the evolution paces of the two (see Figure 12), so as to accurately identify development shortcomings and implement region-specific management for the YRB.
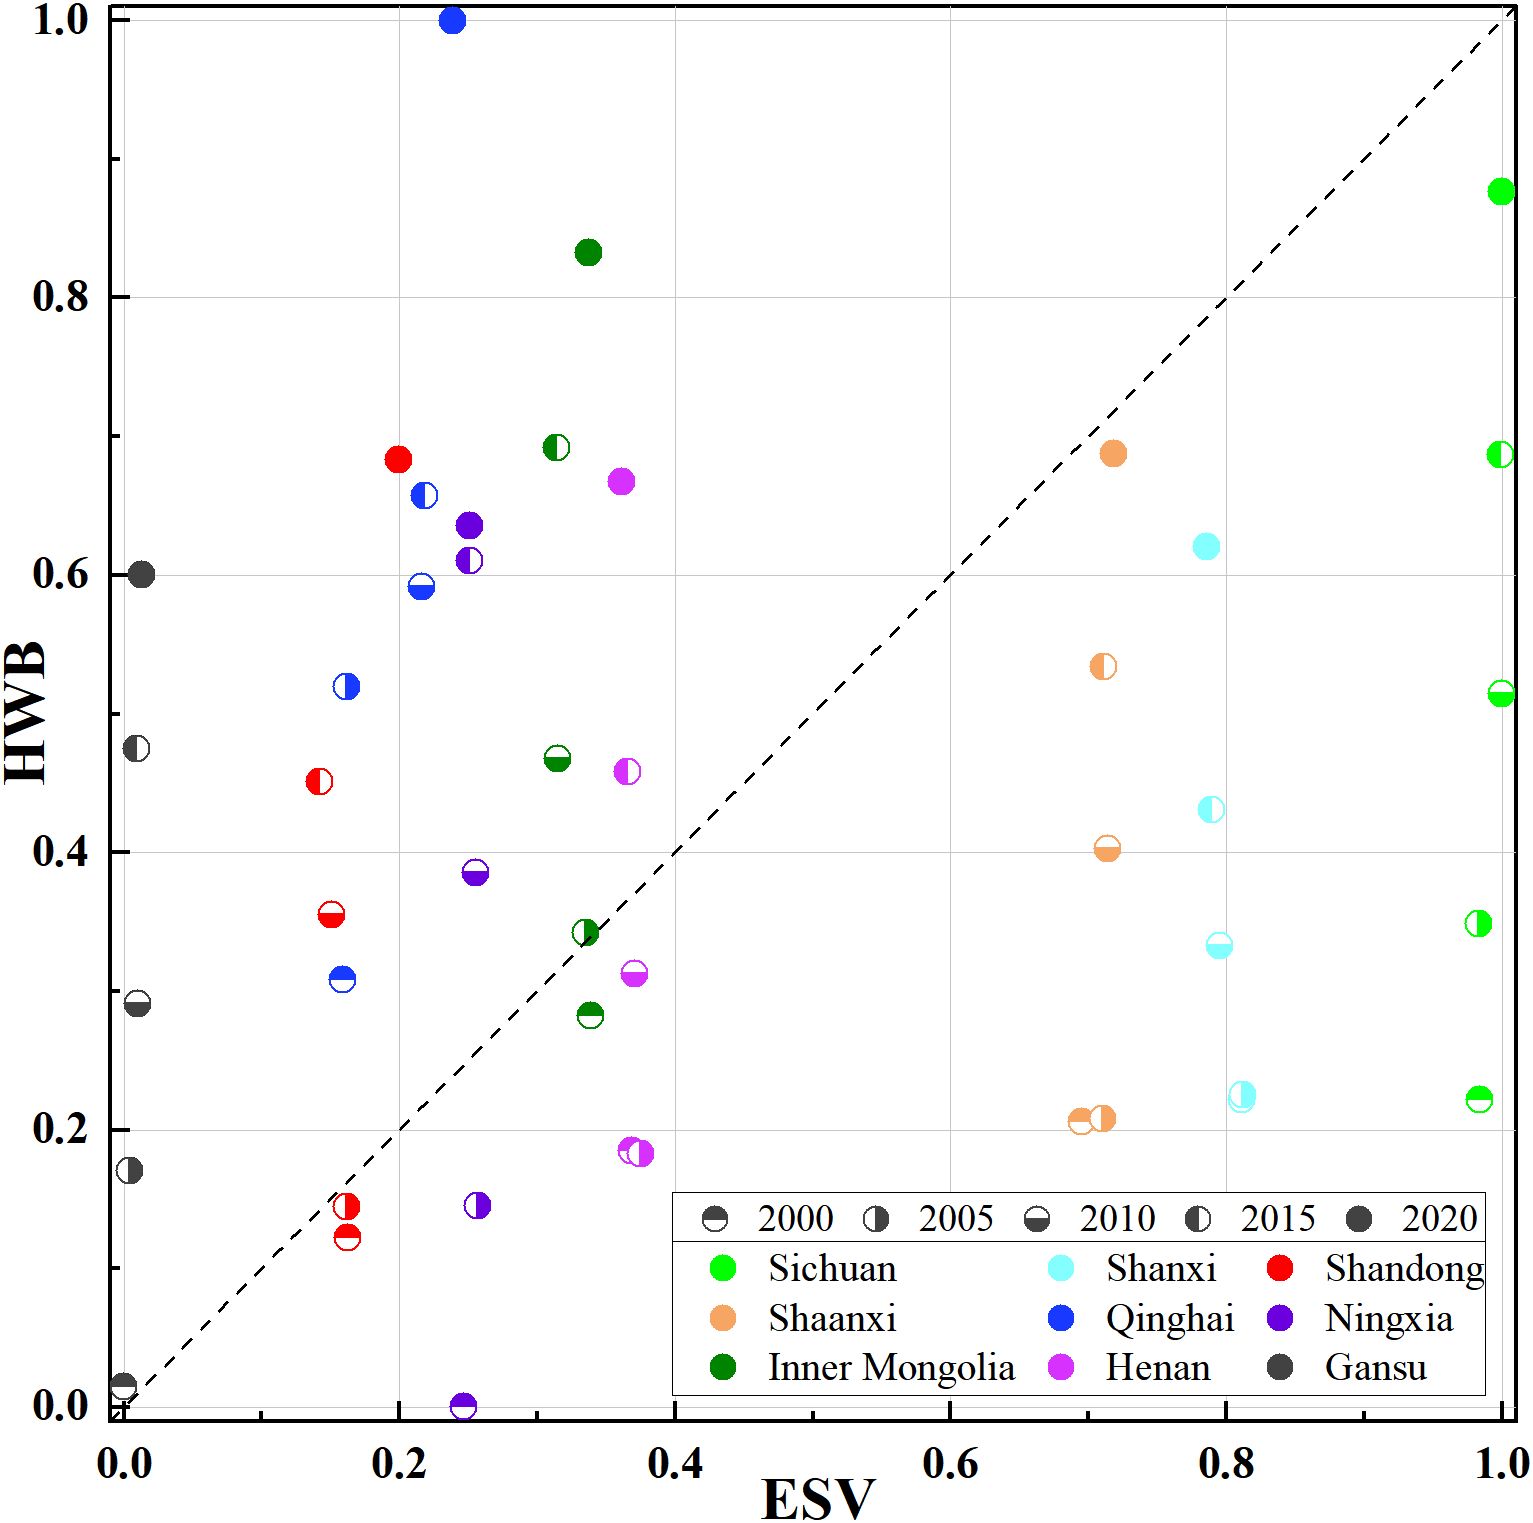
Figure 12. The level comparison between ecosystem services value (ESV) and human well-being (HWB) in the Yellow River Basin from 2000 to 2020.
In the early stages of the development for ESV and HWB, the coupling relationship between ESV and HWB in most provinces of the YRB showed lagging HWB, which was due to the historical background of large-scale implementation of ecological construction projects such as the Grain for Green Project in the YRB after 2000 and relatively lagging local economic and social development. At present, although the ESV levels in Sichuan, Shanxi, and Shaanxi were still higher than the HWB level, they were basically in a high-level relatively balanced development stage. Therefore, on the one hand, ecological industries and ecological tourism can be developed according to local conditions, and capital can be guided to fully transform the ecological value of ecological resources into economic and cultural values based on favorable factors such as policies and market prospects. Such approach ensures that ecological economic development can benefit all people and provides a solid material foundation for improving HWB. On the other hand, attention should be paid to strengthening the regional spillover of ESs and high-quality deepening of well-being, thereby fostering improved coupling coordination between services and well-being. For Qinghai, Ningxia, Inner Mongolia, Henan and Shandong, where were in the coordination stage of their relationship but had the problem of ESV lagging behind HWB, the reasons for this problem are different. For Qinghai and Inner Mongolia, due to their abundant natural environmental resources, HWB was at a relatively high level. In the future, greater efforts should be made in the coordinated development of people and the environment. This requires a focus on optimizing land use structure, enhancing ecological environment restoration, and improving the efficiency of ecological environment governance to solve the problem of ecological environment protection struggling to keep up with the pace of improving residents’ well-being. For Henan and Shandong, where have large populations and relatively developed economies but weak ecosystem supply capacities. On the one hand, the government should strictly control the space for ecological land use, enrich the multi-dimensional connotations of urban development space. Meanwhile, it must organically link “three-lines” control with “production-living-ecological” space, and comprehensively manage the Human-Natural coupling system. On the other hand, the government can strengthen urban green space construction and wetland protection, and bolster the green modern industry. Concurrently, it should implement policies to promote sustainable consumption practices, advocate for eco-friendly consumption, and mitigate unnecessary waste of ESs during rapid social and economic advancement. For Ningxia, under the context of ecological civilization construction, the priority for high-quality development is to steadily improve ecological benefits. On the one hand, it advocates promoting the green development of the tertiary industry by leveraging the abundant cultivated land resources in the local area. This will further increase residents’ income, thereby continuously enhancing their sense of gain and happiness. On the other hand, for enterprises characterized by high energy consumption and emissions in this province, environmental assessment approval should be strictly controlled, environmental risk prevention should be strengthened. Simultaneously, the ecological protection compensation mechanism should be deepened and the concept of “lucid waters and lush mountains are invaluable assets” fully implemented, thereby creating a solid ecological background foundation. What worries us most is Gansu, where ESV lags far behind HWB, and the relationship between ESV and HWB has been at an uncoordinated level for a long time. In Gansu, the economy started late, the development model is also slightly conservative, coupled with the relatively poor natural environment, the ecological foundation is weak, resulting in a long-term low level of both ESV and HWB. In the future, the government can focus on the following aspects to solve the problem of difficulty in coordinating ecological protection and the improvement of HWB. One is to formulate reasonable land use planning, give full play to the advantages of the large quantity, wide distribution, and promising development prospects of barren land resources within this province, and strengthen the development of abundant barren land resources to improve ecological well-being. The second is to formulate reasonable policies to attract investment, which can develop the local economy and increase per capita income by receiving enterprises from the surrounding development and transformation areas. This will improve economic well-being. The third is to enhance the connections between intra-provincial and extra-provincial city clusters to increase tourism promotion efforts. Moreover, in Gansu, it is very crucial to devote to establish a regulatory mechanism of benign spatial mutual promotion of ESs and HWB. This will gradually form a synergistic effect between ESs and HWB, and tending towards coordinated development in the benign spatial interaction.
4.4 Limitations and prospects
Based on the analysis of the spatiotemporal dynamics and the coupling feedback relationship between ESV and HWB, the critical importance of coordinated development between ESV and HWB is emphasized in our study. By adapting the value coefficients for ESV and the evaluation indicator system for HWB to suit regional characteristics, our framework can also be adapted for application in other regions. Nevertheless, there remains scope for enhancement.
Regarding ESV, we revised the equivalent factors using net primary productivity, rainfall, and soil retention to account for regional heterogeneity. Nevertheless, the vast scope of the YRB means that variations in ecosystems across different provinces may not have been fully captured, potentially impacting the accuracy of the ESV assessment. Additionally, when estimating ESV using equivalent factors, we assumed that the ESV of construction land is 0. But in reality, human activities and other processes occurring on construction land would produce pollutants, which will also affect the ESs function (Yang et al., 2023a). Therefore, there is still room for further improvement in the measurement of absolute value of ESs. Regarding HWB, the limitations mainly come from the data collection process. For one thing, as we mentioned above, HWB has rich connotations. This study constructed the evaluation indicator system for HWB based on the existing data, narrowing down the scope of the construction of the evaluation indicator system for the YRB. For another thing, this study extensively used macroscopic data and focused on studying HWB at the macroscopic provincial scale because of the lack of microscopic data, resulting in a relatively rough spatial dimension, which limits our discussion level on HWB in the YRB. Besides the macroscopic HWB, the performance characteristics of HWB at other scales may vary because of the existence of scale effects (Li et al., 2023). In future, we plan to collect more abundant and comprehensive data as much as possible, including collecting some subjective information on HWB through survey questionnaires, expert consultations, household surveys, and departmental interviews. Building on this, we will analyze the interactive coercing relationship between ESV and HWB across more spatial scales to improve and deepen the knowledge and information of the relationship between the two. The GM (1,1) mainly relies on historical data to mine future trends, and is suitable for the prediction needs of this study. However, this model lacks consideration of external factors such as regional differences and policy guidance, which brings certain uncertainty to the prediction results and is also a research direction that we need to further strengthen.
5 Conclusions
This study assessed the spatiotemporal characteristics of ESV and HWB under the SDGs framework in the YRB, investigated their interactive coercing relationship at both the system and subsystem levels. On this basis, we proposed pertinent solutions for the sustainable management of the coupled ESs-HWB system. The conclusions were as follows: (1) The ESV of Sichuan in the YRB was relatively high, while that in Shandong was low. Due to differences in the direction and intensity of ecosystem structure adjustments across various provinces, the ESV of Qinghai, Sichuan, Gansu, Ningxia, Shaanxi and Shandong provinces increased, while the ESV of Shanxi, Henan, and Inner Mongolia decreased during the study period. Regulating services emerged as the predominant function within the YRB, playing a crucial role in sustaining ecosystem stability across each province. (2) HWB levels of Qinghai, Sichuan, and Inner Mongolia were relatively high, whereas Gansu had the lowest level. From 2000 to 2020, the HWB in each province of the YRB showed an upward and positive development trend, with a faster improvement rate from 2015 to 2020 because of the implementation of targeted poverty alleviation policies. At the subsystem level, there was a common phenomenon in the YRB where the health and safety well-being level was lower than other well-being levels, but the improvement rate for mental fulfillment well-being was the slowest. (3) The relationship between ESV and HWB in the YRB presented an optimistic trend towards coupled coordination. However, the relationship between some subsystem levels of ESV and HWB was unbalanced, among which the coupling coordination relationship between SS and HWB in Shandong deteriorated, while ESV in Gansu lagged far behind HWB, and the relationship in Gansu is in and will be in a long-term uncoordinated stage.
Data availability statement
The original contributions presented in the study are included in the article/Supplementary Material. Further inquiries can be directed to the corresponding author.
Author contributions
MY: Conceptualization, Formal Analysis, Funding acquisition, Methodology, Writing – original draft, Writing – review & editing. MW: Conceptualization, Data curation, Investigation, Methodology, Writing – original draft. HZ: Conceptualization, Funding acquisition, Supervision, Writing – review & editing. LC: Funding acquisition, Methodology, Project administration, Supervision, Writing – review & editing.
Funding
The author(s) declare financial support was received for the research, and/or publication of this article. This research was funded by the National Natural Science Foundation of China (42401384), the Humanities and Social Sciences Foundation of Ministry of Education of China (24YJCZH376), and the Key Scientific Research Projects of Colleges and Universities in Henan Province (25A170008).
Conflict of interest
The authors declare that the research was conducted in the absence of any commercial or financial relationships that could be construed as a potential conflict of interest.
Generative AI statement
The author(s) declare that no Generative AI was used in the creation of this manuscript.
Any alternative text (alt text) provided alongside figures in this article has been generated by Frontiers with the support of artificial intelligence and reasonable efforts have been made to ensure accuracy, including review by the authors wherever possible. If you identify any issues, please contact us.
Publisher’s note
All claims expressed in this article are solely those of the authors and do not necessarily represent those of their affiliated organizations, or those of the publisher, the editors and the reviewers. Any product that may be evaluated in this article, or claim that may be made by its manufacturer, is not guaranteed or endorsed by the publisher.
Supplementary material
The Supplementary Material for this article can be found online at: https://www.frontiersin.org/articles/10.3389/fevo.2025.1666034/full#supplementary-material
Abbreviations
ESs, ecosystem services; ESV, ecosystem services value; HWB, human well-being; CCD, coupling coordination degree; YRB, Yellow River Basin; MA, Millennium Ecosystem Assessment.
References
Aguado M., González J. A., Bellott K., López-Santiago C., and Montes C. (2018). Exploring subjective well-being and ecosystem services perception along a rural- urban gradient in the high Andes of Ecuador. Ecosyst. Serv. 34, 1–10. doi: 10.1016/j.ecoser.2018.09.002
Ai M., Chen X., and Yu Q. (2024). Spatial correlation analysis between human disturbance intensity (HDI) and ecosystem services value (ESV) in the Chengdu-Chongqing urban agglomeration. Ecol. Indic. 158, 111555. doi: 10.1016/j.ecolind.2024.111555
Al-Mulali U., Solarin S. A., and Ozturk I. (2016). Investigating the presence of the environmental Kuznets curve (EKC) hypothesis in Kenya: an autoregressive distributed lag (ARDL) approach. Nat. Hazards 80, 1729–1747. doi: 10.1007/s11069-015-2050-x
Arora R. U. and Ratnasiri S. (2015). Economic reforms, growth and well-being: evidence from India. J. Econ. Policy Reform 18, 16–33. doi: 10.1080/17487870.2014.920706
Blythe J., Armitage D., Alonso G., Campbell D., Dias A. C. E., Epstein G., et al. (2020). Frontiers in coastal well-being and ecosystem services research: a systematic review. Ocean Coast. Manage. 185, 105028. doi: 10.1016/j.ocecoaman.2019.105028
Costanza R., d’Arge R., de Groot R., Farber S., Grasso M., Hannon B., et al. (1997). The value of the world’s ecosystem services and natural capital. Nature 387, 253–260. doi: 10.1038/387253a0
Daw T. M., Hicks C. C., Brown K., Chaigneau T., Januchowski-Hartley F. A., Cheung W. W. L., et al. (2016). Elasticity in ecosystem services: exploring the variable relationship between ecosystems and human well-being. Eco. Soc 21, 11. doi: 10.5751/ES-08173-210211
Dawson N. and Martin A. (2015). Assessing the contribution of ecosystem services to human wellbeing: a disaggregated study in western Rwanda. Ecol. Econ. 117, 62–72. doi: 10.1016/j.ecolecon.2015.06.018
Dong Y., Kuang W., Ren Z., Dou Y., and Deng X. (2024). Green or grain? Impact of green space expansion on grain production in Chinese cities and its implications for national urban greening schemes. Landscape Eco. 39, 117. doi: 10.1007/s10980-024-01921-0
Dwivedi A., Kumar A., and Goel V. (2022). Selection of nanoparticles for battery thermal management system using integrated multiple criteria decision-making approach. Int. J. Energ. Res. 46, 22558–22584. doi: 10.1002/er.8561
Estes R. J. and Sirgy M. J. (2019). Global advances in quality of life and well-Being: past, present, and future. Soc Indic. Res. 141, 1137–1164. doi: 10.1007/s11205-018-1869-4
Fan W., Meng M., and Zhou C. (2024). Research on the impact of economic development and environmental security on human well-being in typical cities on the Qinghai-Tibet Plateau. Environ. Dev. Sustain. 27, 15677–15702. doi: 10.1007/s10668-024-04560-2
Fu B., Li Y., Wang S., Feng X., Shen Y., Liu Y., et al. (2021). Mechanisms of humannatural system coupling and optimization of the Yellow River Basin. Bull. Nat. Nat. Sci. Found. China 35, 504–509. doi: 10.16262/j.cnki.1000-8217.2021.04.002
Fu B., Tian T., Liu Y., and Zhao W. (2019). New developments and perspectives in physical geography in China. Chin. Geogr. Sci. 29, 363–371. doi: 10.1007/s11769-019-1038-y
Fu B., Wu X., Wang Z., Wu X., and Wang S. (2022). Coupling human and natural systems for sustainability: experience from China’s Loess Plateau. Earth Syst. Dynam. 13, 795–808. doi: 10.5194/esd-13-795-2022
Fulford R. S., Smith L. M., Harwell M., Dantin D., Russell M., and Harvey J. (2015). Human well-being differs by community type: toward reference points in a human well-being indicator useful for decision support. Ecol. Indic. 56, 194–204. doi: 10.1016/j.ecolind.2015.04.003
Gong L. and Wang C. (2019). Model of automobile parts sale prediction based on nonlinear periodic gray GM(1,1) and empirical research. Math. Probl. Eng. 1), 3620120. doi: 10.1155/2019/3620120
Grimm N. B., Faeth S. H., Golubiewski N. E., Redman C. L., Wu J., Bai X., et al. (2008). Global change and the ecology of cities. Science 319, 756–760. doi: 10.1126/science.1150195, PMID: 18258902
Hanif A., Jabbar M., and Yusoff M. M. (2024). Exploring key indicators for quality of life in urban parks of Lahore, Pakistan: toward the enhancement of sustainable urban planning. Int. J. Sust. Dev. World 6, 1–18. doi: 10.1080/13504509.2024.2359040
Jamin A. and Humeau-Heurtier A. (2020). (Multiscale) cross-entropy methods: a review. Entropy 22, 45. doi: 10.3390/e22010045, PMID: 33285820
Ji Z., Zou S., Zhang W., Song F., Yuan T., and Xu B. (2024). Optimizing zoning for ecological management in alpine region by combining ecosystem service supply and demand with ecosystem resilience. J. Environ. Manage. 365, 121508. doi: 10.1016/j.jenvman.2024.121508, PMID: 38924889
Jonesa L., Norton L., Austinc Z., Browne A. L., Donovan D., Emmett B. A., et al. (2016). Stocks and flows of natural and human-derived capital in ecosystem services. Land Use Policy 52, 151–162. doi: 10.1016/j.landusepol.2015.12.014
Kibria A. M. G., Costanza R., and Soto J. R. (2022). Modeling the complex associations of human wellbeing dimensions in a coupled human-natural system: in contexts of marginalized communities. Eco. Model. 466, 109883. doi: 10.1016/j.ecolmodel.2022.109883
King S., Agra R., Zolyomi A., Keith H., Nicholson E., de Lamo X., et al. (2024). Using the system of environmental-economic accounting ecosystem accounting for policy: A case study on forest ecosystems. Environ. Sci. Policy 152, 103653. doi: 10.1016/j.envsci.2023.103653
Li S., Yu D., and Li X. (2023). Exploring the impacts of ecosystem services on human well-being in Qinghai Province under the framework of the sustainable development goals. J. Environ. Manage. 345, 118880. doi: 10.1016/j.jenvman.2023.118880, PMID: 37660425
Liu Y. (2020). Modern human-earth relationship and human-earth system science. Sci. Geogr. Sin. 40, 1221–1234. doi: 10.13249/j.cnki.sgs.2020.08.001
Liu Y., Fu B., Wang S., Rhodes J. R., Li Y., Zhao W., et al. (2023). Global assessment of nature’s contributions to people. Sci. Bull. 68, 424–435. doi: 10.1016/j.scib.2023.01.027, PMID: 36732118
Liu L. and Wu J. (2021). Ecosystem services-human wellbeing relationships vary with spatial scales and indicators: the case of China. Resour. Conserv. Recy. 172, 105662. doi: 10.1016/j.resconrec.2021.105662
Lu N., Liu L., Yu D., and Fu B. (2021). Navigating trade-offs in the social-ecological systems. Curr. Opin. Env. Sust. 48, 77–84. doi: 10.1016/j.cosust.2020.10.014
Luo Y., Lü Y., Fu B., Harris P., Wu L., and Comber A. (2019). When multi-functional landscape meets Critical Zone science: advancing multi-disciplinary research for sustainable human well-being. Nat. Sci. Rev. 6, 349–358. doi: 10.1093/nsr/nwy003, PMID: 34691873
Mashizi A. K. and Sharafatmandrad M. (2021). Investigating tradeoffs between supply, use and demand of ecosystem services and their effective drivers for sustainable environmental management. J. Environ. Manage. 289, 112534. doi: 10.1016/j.jenvman.2021.112534, PMID: 33857711
Millennium ecosystem assessment (2005). Ecosystems and human well-being (Washington, DC: Island Press).
Pan X., Wu N., Xu Z., Deng X., Song X., and Shi P. (2020). Coordination difference between ecosystem service and multidimensional poverty under precise poverty alleviation standpoints: a case study of Gansu Qinba Mountain Poverty-stricken Core Areas. J. Ecol. Rural Environ. 36, 879–889. doi: 10.19741/j.issn.1673-4831.2019.0604
Potschin-Young M., Haines-Young R., Görg C., Heink U., Jax K., and Schleyer C. (2018). Understanding the role of conceptual frameworks: reading the ecosystem service cascade. Ecosyst. Serv. 29, 428–440. doi: 10.1016/j.ecoser.2017.05.015, PMID: 31008045
Qiu J., Liu Y., Yuan L., Chen C., and Huang Q. (2021). Research progress and prospect of the interrelationship between ecosystem services and human well-being in the context of coupled human and natural system. Prog. Geog. 40, 1060–1072. doi: 10.18306/dlkxjz.2021.06.015
Qiu J., Liu Y., Yuan L., Chen C., and Huang Q. (2023). Spatial structure and driving pathways of the coupling between ecosystem services and human well-beings: a case study of Guangzhou. J. Nat. Resour. 38, 760–778. doi: 10.31497/zrzyxb.20230313
Robinson B. E., Zheng H., and Peng W. (2019). Disaggregating livelihood dependence on ecosystem services to inform land management. Ecosyst. Serv. 36, 100902. doi: 10.1016/j.ecoser.2019.100902
Russo R. D. F. S. M. and Camanho R. (2015). Criteria in AHP: A systematic review of literature. Proc. Comput. Sci. 55, 1123–1132. doi: 10.1016/j.procs.2015.07.081
Shen J., Li S., Wang H., Wu S., Liang Z., Zhang Y., et al. (2023). Understanding the spatial relationships and drivers of ecosystem service supply-demand mismatches towards spatially-targeted management of social-ecological system. J. Clean. Prod. 406, 136882. doi: 10.1016/j.jclepro.2023.136882
Shi H., Hu Y., and Gan L. (2024). Assessing urban resilience based on production-living-ecological system using degree of coupling coordination: A case of Sichuan. PloS One 19, e0304002. doi: 10.1371/journal.pone.0304002, PMID: 38781134
Shoji J., Hori J., Kitagawa T., Sugimoto R., and Makino M. (2024). Regional comparison of the structure of human well-being related to ecosystem services in coastal areas of Japan: possible effect of anxiety unique to the ria coast. Sustain. Sci. 19, 1751–1762. doi: 10.1007/s11625-024-01508-3
Sitotaw T. M., Willemen L., Meshesha D. T., Weldemichael M., and Nelson A. (2025). Modelling the impact of ecosystem fragmentation on ecosystem services in the degraded Ethiopian highlands. Ecol. Inform. 87, 103100. doi: 10.1016/j.ecoinf.2025.103100
Thakrar S. K., Johnson J. A., and Polasky S. (2023). Land-use decisions have substantial air quality health effects. Environ. Sci. Technol. 58, 381–390. doi: 10.1021/acs.est.3c02280, PMID: 38101325
Tibesigwa B., Ntuli H., and Lokina R. (2020). Valuing recreational ecosystem services in developing cities: the case of urban parks in Dares Salaam, Tanzania. Cities 106, 102853. doi: 10.1016/j.cities.2020.102853
Tribot A. S., Deter J., and Mouquet N. (2018). Integrating the aesthetic value of landscapes and biological diversity. P. R. Soc B-biol. Sci. 285, 20180971. doi: 10.1098/rspb.2018.0971, PMID: 30185647
Ulrich W., Batáry P., Baudry J., Beaumelle L., Bucher R., Cerevková A., et al. (2023). From biodiversity to health: quantifying the impact of diverse ecosystems on human well-being. People Nat. 5, 69–83. doi: 10.1002/pan3.10421
Vollebregt M., Mugge R., Thuerridl C., and van Dolen W. (2024). Reducing without losing: reduced consumption and its implications for well-being. Sustain. Prod. Consump. 45, 91–103. doi: 10.1016/j.spc.2023.12.023
Wang Y., Xu Z., Yu S., Xia P., Zhang Z., Liu X., et al. (2024). Exploring watershed ecological risk bundles based on ecosystem services: A case study of Shanxi Province, China. Environ. Res. 245, 118040. doi: 10.1016/j.envres.2023.118040, PMID: 38154566
Wang D., Zheng H., and Ouyang Z. (2013). Ecosystem services supply and consumption and their relationships with human well-being. Chin. J. Appl. Ecol. 24, 1747–1753. doi: 10.13287/j.1001-9332.2013.0354
Wohlfart C., Kuenzer C., Chen C., and Liu G. (2016). Social-ecological challenges in the Yellow River basin (China): a review. Environ. Earth Sci. 75, 1066. doi: 10.1007/s12665-016-5864-2
Wood S. L. R., Jones S. K., Johnson J. A., Brauman K. A., Chaplin-Kramer R., Fremier A., et al. (2018). Distilling the role of ecosystem services in the Sustainable Development Goals. Ecosyst. Serv. 29, 70–82. doi: 10.1016/j.ecoser.2017.10.010
Xi J. (2019). Speech at the symposium on ecological protection and high-quality development in the Yellow River Basin. Water Resour. Dev. Manage. 11), 1–4. doi: 10.16616/j.cnki.10-1326/TV.2019.11.01
Xiao R., Lin M., Fei X., Li Y., Zhang Z., and Meng Q. (2020). Exploring the interactive coercing relationship between urbanization and ecosystem service value in the Shanghai-Hangzhou Bay Metropolitan Region. J. Clean. Prod. 253, 119803. doi: 10.1016/j.jclepro.2019.119803
Xie G., Lu C., Leng Y., Zheng D., and Li S. (2003). Ecological assets valuation of the Tibetan Plateau. J. Nat. Resour. 18, 189–196. doi: 10.3321/j.issn:1000-3037.2003.02.010
Xie G., Zhang C., Zhen L., and Zhang L. (2017). Dynamic changes in the value of China’s ecosystem services. Ecosyst. Serv. 26, 146–154. doi: 10.1016/j.ecoser.2017.06.010
Xie G., Zhen L., Lu C., Xiao Y., and Chen C. (2008). Expert knowledge-based valuation method of ecosystem services in China. J. Nat. Resour. 23, 911–919. doi: 10.11849/zrzyxb.2008.05.019
Xu Z., Wei H., Fan W., Wang X., Zhang P., Ren J., et al. (2019). Relationships between ecosystem services and human well-being changes based on carbon flow: a case study of the Manas River Basin, Xinjiang, China. Ecosyst. Serv. 37, 100934. doi: 10.1016/j.ecoser.2019.100934
Yang M., Gao X., Siddique K. H. M., Wu P., and Zhao X. (2023a). Spatiotemporal exploration of ecosystem service, urbanization, and their interactive coercing relationship in the Yellow River Basin over the past 40 years. Sci. Total Environ. 858, 159757. doi: 10.1016/j.scitotenv.2022.159757, PMID: 36349629
Yang M., Gao X., Zhao X., and Wu P. (2021). Scale effect and spatially explicit drivers of interactions between ecosystem services: a case study from the Loess Plateau. Sci. Total Environ. 785, 147389. doi: 10.1016/j.scitotenv.2021.147389
Yang H., Gou X., Xue B., Xu J., Wei Y., and Ma W. (2023b). Measuring the cross-border spillover effects and telecoupling processes of ecosystem services in Western China. Environ. Res. 239, 117291. doi: 10.1016/j.envres.2023.117291, PMID: 37832764
Yang M., Zhao X., Wu P., Hu P., and Gao X. (2022). Quantification and spatially explicit driving forces of the incoordination between ecosystem service supply and social demand at a regional scale. Ecol. Indic. 137, 108764. doi: 10.1016/j.ecolind.2022.108764
Yee S. H., Paulukonis E., Simmons C., Russell M., Fulford R., Harwell L., et al. (2021). Projecting effects of land use change on human well-being through changes in ecosystem services. Ecol. Model. 440, 109358. doi: 10.1016/j.ecolmodel.2020.109358, PMID: 34017153
Zhai T., Zhang D., and Zhao C. (2021). How to optimize ecological compensation to alleviate environmental injustice in different cities in the Yellow River Basin? A case of integrating ecosystem service supply, demand and flow. Sustain. Cities Soc 75, 103341. doi: 10.1016/j.scs.2021.103341
Zhang K., Dong Z., Guo L., Boyer E. W., Liu J., Chen J., et al. (2023b). Coupled coordination spatiotemporal analyses inform sustainable development and environmental protection for the Yellow River Basin of China. Ecol. Indic. 151, 110283. doi: 10.1016/j.ecolind.2023.110283
Zhang P., Li X., and Yu Y. (2023a). Relationship between ecosystem services and farmers’ well-being in the Yellow River Wetland Nature Reserve of China. Ecol. Indic. 146, 109810. doi: 10.1016/j.ecolind.2022.109810
Zhao W., Liu Y., Feng Q., Wang Y., and Yang S. (2018). Ecosystem services for coupled human and environment systems. Prog. Geogr. 37, 139–151. doi: 10.18306/dlkxjz.2018.01.015
Zhao G., Mu X., Wen Z., Wang F., and Gao P. (2013). Soil erosion, conservation, and Eco-environment changes in the Loess Plateau of China. Land Degrad. Dev. 24, 499–510. doi: 10.1002/ldr.2246
Keywords: ecosystem service value, human well-being, interactive coercing mechanism, coupling coordination, SDGs framework, Yellow River Basin
Citation: Yang M, Wang M, Zhang H and Cao L (2025) Coordinated development of ecosystem services and human well-being is increasing in the Yellow River Basin, though some regions lag behind. Front. Ecol. Evol. 13:1666034. doi: 10.3389/fevo.2025.1666034
Received: 15 July 2025; Accepted: 14 October 2025;
Published: 30 October 2025.
Edited by:
Darren Norris, Universidade Federal do Amapá, BrazilReviewed by:
Manjari Upreti, Central University of Jharkhand, IndiaKai Zhang, Xi’an University of Architecture and Technology, China
Copyright © 2025 Yang, Wang, Zhang and Cao. This is an open-access article distributed under the terms of the Creative Commons Attribution License (CC BY). The use, distribution or reproduction in other forums is permitted, provided the original author(s) and the copyright owner(s) are credited and that the original publication in this journal is cited, in accordance with accepted academic practice. No use, distribution or reproduction is permitted which does not comply with these terms.
*Correspondence: Lianhai Cao, Y2FvbGlhbmhhaUBuY3d1LmVkdS5jbg==