 Benyan Ren1
 Yuelong Su
- 1Zhejiang University of Finance and Economics Dongfang College, Haining, China
- 2Huazhong Agricultural University, Wuhan, China
- 3The College of Urban & Environmental Sciences, Central China Normal University, Wuhan, China
This study aims to address the challenges of insufficient regional adaptability and complex non-linear relationships in land carrying capacity (LCC) assessment by constructing a comprehensive evaluation framework tailored to geographically diverse regions such as Hubei Province (HP). We developed an improved projection pursuit model optimized by a differential evolution algorithm (DEA-PTM) to evaluate LCC through a four-dimensional system encompassing water and soil resource carrying capacity (WSCC), social carrying capacity (SCC), economic carrying capacity (ECC), and ecological and environmental carrying capacity (EECC). Empirical analysis was conducted using data from HP from 2010 to 2023. An obstacle degree model (ODM) and an autoregressive integrated moving average (ARIMA) model were further integrated to identify limiting factors and predict future trends. The results indicate that the LCC of HP showed a sustained growth trend from 2010 to 2023, with a cumulative increase of 24.7%, and exhibited a distinct “east-high, west-low” spatial pattern. Significant heterogeneity existed among subsystems, with WSCC higher in the east and EECC stronger in the west. Ecological pressure and water-soil resource constraints were identified as the core obstacles to LCC improvement. The ARIMA model predicts a continued increase in overall LCC to 1.671 by 2035, but a decline in EECC, highlighting the risk of ecological degradation. This study provides a scientifically robust framework for regional land resource optimization and sustainable development policy-making.
1 Introduction
Global population expansion, accelerated urbanization, and the increasing impact of climate change have posed unprecedented challenges to the sustainable carrying capacity of land resources (Grimmond, 2007). Against the backdrop of China’s rapid development, the imbalance between the supply and demand of regional land resources is particularly prominent (Yang et al., 2024). The 19th National Congress of the Communist Party of China proposed the “Rural Revitalization Strategy”, which has pointed out the direction for enhancing the carrying capacity of rural land and conducting village and town construction (Yaohong et al., 2025). Hubei Province (HP), located in the core area of central China and a key node of the Yangtze River Economic Belt, has a unique topographic pattern of “high in the west and low in the east” and an economic structure that gives equal importance to agriculture and industry, resulting in significant regional variations in the intensity of land resource utilization and the carrying capacity of land resources. Scientific assessment of the spatial and temporal evolution of land carrying capacity (LCC) and identification of key limiting factors are crucial for optimizing land resource allocation, avoiding ecological risks, and safeguarding sustainable development in the region. This study aims to construct an improved assessment framework to provide a decision-making basis for the optimization of land space in this province and similar regions.
Research on the evaluation index system of LCC has achieved many results, and many scholars have constructed corresponding index systems from different perspectives (Qian et al., 2015; Wu and Hu, 2020; Peng and Deng, 2021; Huang et al., 2023; Hu et al., 2023; Wang et al., 2023). For instance, studies in the Yangtze River Delta Plain emphasized economic and social indicators but often overlooked ecological resilience (Wang and Liu, 2024), while assessments in Northeast China’s grain-producing regions focused on soil and water resources but underplayed socioeconomic dynamics (Ren et al., 2023). However, the existing indicator systems are still insufficient in terms of comprehensiveness and pertinence. On the one hand, some indicator systems fail to fully consider regional specificity, which leads to their limited applicability in different regions; on the other hand, some indicator systems do not adequately consider the interactions among LCC subsystems, which makes it difficult to comprehensively reflect the overall LCC situation. This lack of a balanced and regionally-adapted framework is a significant gap this study aims to fill. Compared with previous studies, the indicator system constructed in this study exhibits both similarities and differences. The similarity lies in the fact that many of the selected indicators (e.g., per capita water resources, population density, per capita GDP, forest coverage) are commonly used in established LCC research (Zhou et al., 2023a; Wang et al., 2024), reflecting a consensus on the core elements that constitute land carrying capacity. However, the key difference and innovation of our framework are twofold. First, rather than adopting the Pressure-State-Response (PSR) or Drivers-Pressure-State-Impact-Response (DPSIR) model which often leans towards environmental dimensions, we propose a more balanced and parallel structure consisting of four distinct yet interconnected capacity pillars (WSCC, SCC, ECC, EECC). This structure avoids the potential oversimplification of socio-economic drivers in PSR or the complexity and indicator redundancy often encountered in DPSIR. Second, the selection and weighting of specific indicators within each pillar are rigorously tailored to the specific geographical and socio-economic context of Hubei Province, particularly its distinct topographic gradient and economic structure, enhancing the regional relevance and applicability of the assessment beyond the generic frameworks often seen in previous studies. Therefore, the primary motivation of this study is to develop a more regionally adaptive and computationally robust evaluation framework that can effectively capture the complex, non-linear interactions among LCC subsystems, thereby providing a scientifically sound basis for land resource management in geographically diverse regions like Hubei Province. This paper innovatively constructs a comprehensive evaluation index system covering four dimensions, i.e., water and soil resource carrying capacity (WSCC), social carrying capacity (SCC), economic carrying capacity (ECC), and ecological and environmental carrying capacity (EECC), which considers not only the geographic, economic and social characteristics of the HP in the study area but also the intrinsic links among the subsystems to make the evaluation results more scientific and practical.
However, assessing LCC in a geographically complex region like Hubei presents significant challenges. The pronounced topographic gradient from western mountains to eastern plains results in high spatial heterogeneity and non-linear interactions among ecological, resource, and socio-economic factors. Traditional linear methods often fail to adequately capture these complexities, necessitating the adoption of advanced non-parametric and optimization-based approaches. In terms of evaluation methods for LCC, most existing studies have used traditional methods such as hierarchical analysis (Lu et al., 2017; Tsou et al., 2017; Ebrahimi et al., 2019; Wang et al., 2019; Hsu et al., 2021; Chen and Wang, 2023) and principal component analysis (PCA). These methods can be used to quantitatively evaluate LCC to a certain extent, but some limitations exist. For example, the hierarchical analysis method relies on expert scoring and is highly subjective (Kaur et al., 2020; Akhtar et al., 2021; Li et al., 2022); the PCA method requires high data normality and linear relationships and has difficulty addressing complex nonlinear relationships (Yang et al., 2020; Zhao et al., 2020, 2021). These limitations are particularly pronounced when assessing LCC in geographically complex regions like Hubei, where significant spatial heterogeneity and non-linear interactions among ecological, resource, and socio-economic factors are the norm.
Beyond the conventional methods, recent advancements in computational and spatial analysis have begun to reshape the assessment of LCC. In the past two years, the field has witnessed a growing emphasis on integrating spatial explicit modeling and complex system theories to capture the interdependencies and flow dynamics within land systems. For instance, connectivity analysis based on Graph Theory has emerged as a powerful tool for evaluating ecological security patterns and the functional connectivity of landscapes at national or regional scales, moving beyond static indicator evaluation to a more dynamic, network-based perspective (Jiang et al., 2024; Lin et al., 2025). Furthermore, the application of machine learning (ML) and deep learning algorithms—such as Random Forest (RF), Support Vector Machines (SVM), and neural networks—has gained significant traction. These data-driven methods excel in handling high-dimensional, non-linear datasets without imposing strict assumptions on data distribution, thereby offering enhanced objectivity and predictive accuracy for comprehensive carrying capacity evaluations (Dong et al., 2024; Kim et al., 2024; Zhang et al., 2024b). This study aligns with these latest developments by employing a Differential Evolution Algorithm-optimized Projection Pursuit Model (DEA-PTM), which synergizes the advantages of global optimization intelligence with non-parametric statistical analysis. This approach is particularly adept at deciphering the complex, non-linear relationships inherent in the LCC system of geographically diverse regions like Hubei Province, thus contributing to this evolving methodological frontier. In this paper, a projection tracking model (PTM) is introduced and improved by combination with a differential evolutionary algorithm (DEA). PTM, as a non-parametric high-dimensional data analysis method, is able to effectively address high-dimensional data with non-linear and non-Gaussian distributions, optimize the direction of the low-dimensional projections, and reveal the complex patterns hidden in the data (Andresen et al., 2020; Tong et al., 2020). DEA, on the other hand, has a powerful global search capability, which can effectively solve the optimization in projection tracking problems and improve the accuracy and reliability of evaluation results (Xia et al., 2021; Xu et al., 2021).
The unique topographic pattern of Hubei Province, characterized by high mountains in the west (e.g., Qinba Mountains, Wushan region) and vast plains in the east (Jianghan Plain), results in significant spatial heterogeneity and complex non-linear relationships in its resource endowment, socio-economic development, and ecological conditions. Traditional linear evaluation methods may struggle to fully capture these intricate patterns. The PTM, as a non-parametric method, is particularly adept at handling high-dimensional data with non-linear and non-Gaussian distributions, effectively revealing hidden structures within complex datasets (Grear et al., 2021; Chang et al., 2023). Furthermore, the DEA complements PTM by providing a robust global optimization capability to solve the non-convex optimization problem inherent in determining the optimal projection direction (Fan et al., 2022; Movassagh et al., 2023). This DEA-PTM combination is therefore well-suited to address the challenges posed by Hubei’s diverse geographical conditions, ensuring a more objective and accurate assessment of its LCC.
While established frameworks like the Pressure-State-Response (PSR) and the Driving Forces-Pressure-State-Impact-Response (DPSIR) have been widely adopted for environmental and carrying capacity assessments, their application often exhibits limitations in the context of multi-dimensional, spatially heterogeneous LCC evaluation. The PSR model, focusing on causal chains from human pressures to environmental state and societal response, often lacks sufficient granularity in socioeconomic dimensions. The DPSIR framework, though more comprehensive by including driving forces and impacts, can be complex for weight determination and may not adequately capture the complex, non-linear interactions among subsystems within a specific regional context. To address these gaps and provide a more tailored, computationally robust assessment for regions like Hubei, this study proposes a novel integrated framework. As delineated in Table 1, our approach differentiates itself through a region-specific indicator system structured around four explicit carrying capacity pillars (WSCC, SCC, ECC, EECC) and the application of an advanced DEA-PTM for analysis. This comparative analysis highlights the marginal contributions of this study: (1) the development of a more balanced and regionally adapted indicator system that moves beyond the often environmentally-centric focus of PSR/DPSIR; (2) the introduction of a powerful non-parametric, self-optimizing modeling technique that overcomes the linearity assumptions and subjectivity inherent in methods commonly paired with traditional frameworks; and (3) the provision of a cohesive diagnostic-predictive pipeline by integrating obstacle degree modeling and ARIMA forecasting for holistic spatial-temporal analysis and future scenario projection.
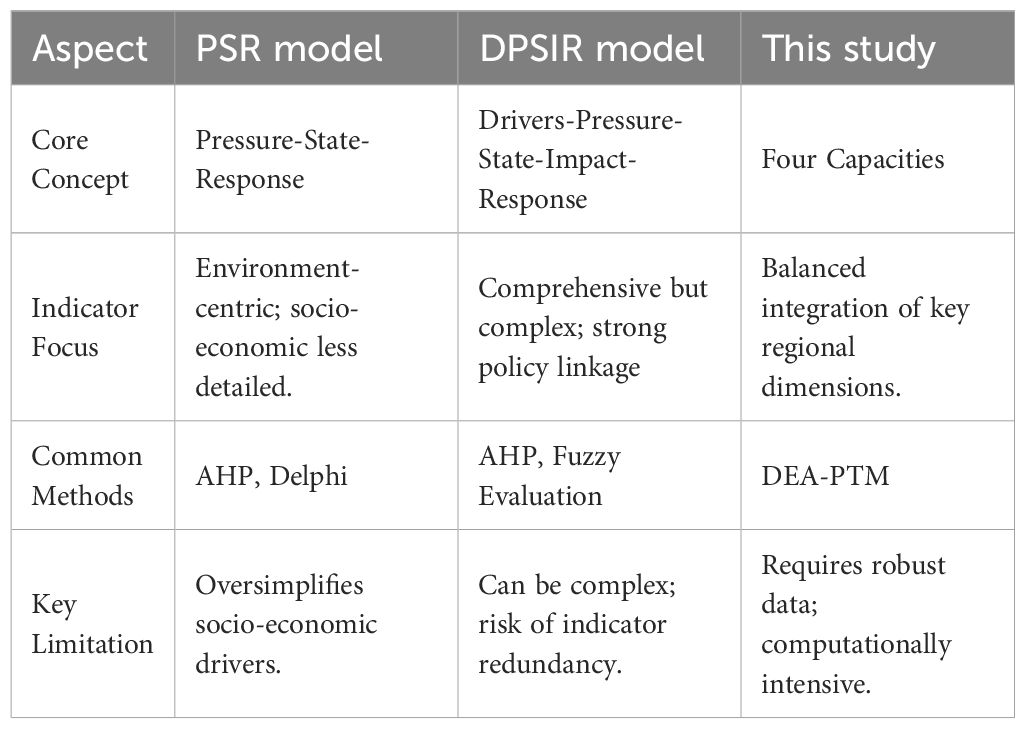
Table 1. Comparative analysis of different assessment frameworks for LCC.
To address key problems of existing LCC assessment, such as insufficient regional applicability of the indicator system, limited consideration of the correlation of subsystems, strong subjective dependence of the traditional assessment method, and weak ability to address complex non-linear relationships, this study focuses on the HP and aims to construct a more scientific and objective LCC comprehensive assessment and prediction framework that is in line with the characteristics of the region. The core content and methodology of this study are shown in Figure 1. First, a comprehensive LCC assessment index system for HP containing four dimensions, namely, the WSCC, SCC, ECC, and EECC, is constructed to enhance the regional relevance and systematicity of the assessment. Second, to effectively overcome the limitations of traditional methods and accurately resolve the complex patterns of high-dimensional data, this study introduces and improves the PTM by combining it with the DEA, which has a powerful global optimization capability. This combined DEA-PTM model can effectively address non-linear, non-Gaussian distributed data and significantly improve the objectivity and accuracy of the assessment by revealing the data structure through optimizing the projection direction. Furthermore, to identify constraints in depth and predict future trends, this study integrates the BDM and ARIMA. The BDM is used to quantitatively diagnose the core obstacle factors hindering LCC improvement on the basis of the indicator weights and deviations, and the ARIMA model is used to predict the dynamic evolution of the LCC and its sub-systems in the HP. This study provides a solid scientific basis and decision support for the optimal allocation of regional land resources, ecological risk prevention and sustainable development.

Figure 1. Technology roadmap.
2 Study area and data
2.1 Study area
The HP is located in the core region of Central China (Figure 2), with a distinct geographical pattern characterized by higher elevations in the west and lower elevations in the east (Liu et al., 2023a). The western and northern regions are home to mountain ranges such as the Wuling Mountains, Daba Mountains, and Dabie Mountains, whereas the central and southern parts are dominated by the vast and fertile Jianghan Plain, which is formed by the alluvial deposits of the Yangtze River and its largest tributary, the Han River (Yu et al., 2024). The region is crisscrossed by a dense network of rivers and is dotted with numerous lakes. The Yangtze River flows eastward across the entire province, whereas the Han River flows from the northwest, together forming the backbone of the province’s water system. The province has a temperate monsoon climate, with distinct seasons and rainfall coinciding with the warm season. Benefiting from the Yangtze River, Han River, and numerous lakes, the province has extremely abundant water resources, including the Three Gorges Dam (Liu et al., 2023b). It also has notable resources such as hydropower and phosphate mines. Economically, Hubei Province is a major industrial and agricultural province: the Jianghan Plain serves as an important commodity grain, cotton, and oil base and a “land of fish and rice”, with freshwater product production leading the nation; industry is supported by automobiles, steel, optoelectronics and information technology, chemicals, and equipment manufacturing (Zhou et al., 2023b; Tan et al., 2024).

Figure 2. Study area.
A land use type map for the HP area for the year 2023 was produced via ArcGIS 10.8 and is shown in Figure 3. HP’s land use exhibits distinct diversity and regional differentiation, with farmland and water bodies constituting the main components of their land use. Extensive arable land is primarily concentrated in the Jianghan Plain and the eastern riverine plains. Water bodies cover a vast area and are widely distributed, particularly in the central regions of the Jianghan Plain and along the main stems of the Yangtze and Han Rivers. Forested areas constitute another important land cover type and are primarily concentrated in the mountainous regions of western Hubei and the hilly areas of southeastern and northeastern Hubei. These forest resources serve as important ecological barriers. In contrast, grassland areas are relatively limited, possibly scattered across the slopes of low mountains and hills or certain riverbank areas, accounting for a small proportion of the map. Construction land is primarily distributed in the Jianghan Plain urban agglomeration, which is centered on Wuhan, county seats, and major transportation routes. Unutilized land typically accounts for a small proportion of the map. Overall, the land use structure of HP is the result of the interaction between natural geographical conditions and long-term human socioeconomic activities. The eastern plain area is dominated by farmland and water bodies, whereas the western and marginal mountainous areas are primarily forested. Construction land is highly concentrated in the population and economic core areas. This significant spatial heterogeneity makes Hubei Province a highly typical and representative case for studying regional LCC. The pronounced east-west topographic gradient creates a natural laboratory where the interplay between natural constraints (e.g., water and soil resources in the mountains, ecological sensitivity) and human activities (e.g., intensive agriculture and urbanization in the plains) is starkly visible. The coexistence of a major agricultural base and a potent industrial hub within the same province leads to complex and often competing demands on land resources, resulting in distinct spatial patterns and pressures on the carrying capacity. These characteristics—encompassing issues of resource distribution, socio-economic development imbalance, and ecological conservation—are emblematic of challenges faced by many regions undergoing rapid development across China and similar geographical settings worldwide. Therefore, studying the spatial-temporal evolution of LCC in Hubei provides valuable insights that can be extrapolated to other regions with significant internal geographical and socio-economic disparities.

Figure 3. HBP land use type map.
This significant spatial variation in topography and land use types creates com-plex, non-linear relationships among ecological, resource, and socio-economic indica-tors, posing a challenge for comprehensive regional assessment which this study aims to address.
2.2 Data sources
This paper takes the 13 prefectures of the HP as its research subjects, with the 25 selected indicator datasets sourced from the HP Statistical Yearbook (2010–2023), the municipal statistical yearbooks of the 13 prefectures, the Hubei Provincial Ecological Status Bulletin, the Hubei Provincial Water Resources Bulletin, the Hubei Provincial Comprehensive Natural Resources Statistical Yearbook, and the Hubei Provincial Soil and Water Conservation Bulletin. The raw panel data for the 25 indicators across 13 prefecture-level cities from 2010 to 2023 were first cleaned. Three city-year samples were identified and removed as outliers due to extreme values resulting from administrative changes or data reporting errors. Subsequently, to eliminate the influence of different units and scales, the data for each indicator were standardized using the Z-score method , where is the original value, is the mean of the indicator, and is its standard deviation. This resulted in a normalized dataset ready for model input.
In addition to the statistical data, Landsat series satellite imagery (30m resolution) from the same period was employed to verify and refine the land use type classification presented in Figure 3. This process helped to enhance the spatial accuracy and reliability of the land use data used in the subsequent analysis. To address potential limitations in the spatial resolution of statistical yearbook data and to enhance the characterization of spatial heterogeneity, the land use classification map (Figure 3) was validated using remote sensing imagery. Landsat 5 TM, Landsat 8 OLI, and Landsat 9 OLI-2 images with a 30-meter spatial resolution were acquired from the USGS Earth Explorer platform. Preprocessing steps, including radiometric calibration and atmospheric correction (Nazeer et al., 2021; Doxani et al., 2023). To ensure data consistency and comparability, all indicator data were integrated into a panel dataset. Given the varying units and magnitudes of the original indicators, min-max normalization was applied to each indicator to eliminate scale effects, transforming all values to a dimensionless range of [0, 1] prior to model computation. This preprocessing step is crucial for the subsequent projection pursuit optimization.
2.3 Establishment of an evaluation indicator system
The construction of the evaluation indicator system is theoretically grounded in the principles of sustainable development, human-land system theory, and the Pressure-State-Response (PSR) framework, which collectively emphasize the interdependence among resource utilization, socioeconomic development, and ecological conservation (Turner et al., 1993; Repar et al., 2017). While this study adopts a parallel four-pillar structure (WSCC, SCC, ECC, EECC) rather than a strict PSR causal chain, the selection of indicators within each pillar is informed by these foundational theories to ensure a holistic representation of land carrying capacity. This approach allows for a more balanced and regionally tailored assessment, capturing both the static endowments and dynamic pressures inherent in complex human-environment systems. On the basis of previous research (Hu and Han, 2023; Tang et al., 2023; Xu et al., 2023; Yin et al., 2025) and the characteristics of Hubei Province, we have divided the LCC evaluation indicator system into four aspects: WSCC, SCC, ECC, and EECC. The specific indicators are shown in Table 2.

Table 2. HB LCC evaluation system.
3 Methods
The methodology employed in this study was specifically selected and designed to address the core research question: accurately assessing the spatial-temporal evolution and driving mechanisms of Land Carrying Capacity (LCC) in a geographically complex region, which involves handling high-dimensional, non-linear data and providing actionable insights for policy-making. The integrated framework, comprising an improved Projection Pursuit Model optimized by a Differential Evolution Algorithm (DEA-PTM), an Obstacle Degree Model (ODM), and an Autoregressive Integrated Moving Average (ARIMA) model, works synergistically to overcome the limitations of traditional methods and achieve these objectives. The following subsections detail each method, with explicit justification for their application in this specific research context.
3.1 Projective tracer modeling for differential evolution algorithm
To address the critical challenge of capturing the complex, non-linear, and high-dimensional relationships among LCC indicators induced by Hubei’s diverse topography and socio-economic gradients, we introduced and improved a non-parametric modeling approach. The integration of the Projection Pursuit Model (PTM) with the Differential Evolution Algorithm (DEA), forming the DEA-PTM model, was primarily adopted for two reasons: (1) to objectively determine indicator weights without subjective expert scoring, thus enhancing the objectivity of the assessment and overcoming a common limitation in traditional LCC studies, and (2) to effectively project high-dimensional data into a lower-dimensional space that reveals intrinsic structures and patterns, which is essential for deciphering the complex interplay within the LCC system and accurately evaluating its status.
3.1.1 Projection tracer model
PTM is a nonparametric high-dimensional data analysis method that optimizes the low-dimensional projection direction to maximize the distribution of the projected data, thereby revealing the hidden non-Gaussian structure in the original high-dimensional space (Ouyang et al., 2021). This model is particularly suitable for handling high-dimensional data with nonlinear, non-Gaussian distributions (Ouyang et al., 2021). Compared with linear dimension reduction methods such as PCA, it is more effective at discovering complex patterns in the data (Wang et al., 2021). The specific calculation steps are as follows:
3.1.1.1 Data projection process
Assume that there is a set of high-dimensional data , where each sample is ( is the dimension of characterization). For the unit projection vector , the formula for projecting data onto a 1-dimensional space is expressed in Equation 1:
The projected dataset is the mapping of the high-dimensional data in the direction .
3.1.1.2 Projection metric function
The key to projection tracing lies in defining a metric to measure the quality of the projection direction . Common projection metrics include the following:
The sample variance of the variance-based metric projection data is expressed in Equation 2:
where is the projected mean and where is the original data mean.
Indicator format (Equation 3):
The goal is to maximize , which is equivalent to finding the direction that maximizes the variance of the projection data.
The kurtosis of the projected data is expressed in Equation 4:
where is the projection variance. Kurtosis reflects the degree of “peaks” in the data distribution. The kurtosis of a normal distribution is 0, whereas the absolute value of the kurtosis of a non-normal distribution (such as clustered data) is greater.
The projected density function is defined via kernel density estimation (Equation 5):
where is the kernel function and where is the bandwidth.
Indicator format (Equation 6):
The goal is to maximize , i.e., to find the direction that makes the projection data density distribution more “concentrated” and highlights the local structure of the data.
3.1.1.3 Optimization problems and solutions
The core optimization problem of projection tracing is as follows (Equation 7):
Since is usually a nonlinear function, iterative optimization methods are required to solve this problem. This paper uses gradient ascent, and the iterative formula is expressed in Equation 8:
where is the learning rate and where is the gradient of the indicator function.
In regression analysis, projection pursuit can be extended to nonlinear models (Equation 9):
where is the predicted value of the -th sample. is the number of projection directions in the model. is the weight coefficient of the -th basis function, and is the constant term. is the -th basis function, which maps the projection value to the target space. is the -th projection vector, which is determined by maximizing the corresponding projection index and satisfies .
3.1.2 Differential evolution algorithm
DEA is a population-based iterative global optimization algorithm that generates mutation vectors through individual differences (Bilal et al., 2020). It is suitable for optimizing non-convex, high-dimensional, and non-linear projection metrics in projection pursuit. Compared with traditional gradient methods, DEA does not require gradient calculations and has stronger global search capabilities, making it particularly suitable for the following scenarios (Deng et al., 2021a, b). The projection vector is treated as an individual in the DEA population and iteratively optimized through the mutation, crossover, and selection operations of DEA to maximize the projection metric .
3.1.2.1 Population initialization
Each individual is defined as follows: Each individual is a unit projection vector that satisfies . Initialization method (Equation 10):
where is a random vector within , ensuring that the initial population is evenly distributed. is the data dimension.
3.1.2.2 Mutation operations
3.1.2.2.1 Classic DEA mutation strategy
The specific calculation is as shown in Equation 11.
3.1.2.2.2 Variation strategy expansion
DEA/best/1, using the current best individual to guide the search (Equation 12):
DEA/rand/2, enhanced disturbance capability.
In Equation 13, where is the -th mutation vector of the -th generation; is a randomly selected index from the population, and ; and is the mutation factor ), which controls the scaling of the difference vector, typically taken as = 0.5–1.0.
3.1.2.3 Cross-operation
The binomial cross formula is expressed in Equation 14:
In the equation, is the cross-over test vector; is the dimension index; is the crossover probability (), which controls the mixing ratio between the parent vector and the mutation vector, typically set to ; and is a randomly selected dimension index, ensuring that at least one dimension comes from the mutation vector.
3.1.2.4 Selection operations
Greedy selection criterion:
In Equation 15, where is the projection indicator function.
3.1.3 Applicability of the DEA-PTM model for complex terrain
The pronounced topographic diversity of HP, encompassing the high-altitude Qinba and Wushan mountainous regions in the west and the low-lying Jianghan Plain in the east, inherently generates complex, high-dimensional, and likely non-normally distributed data for LCC evaluation. Traditional parametric or linear dimension reduction techniques often fail to adequately capture the intricate non-linear relationships and spatial heterogeneities arising from such diverse geographical conditions. The DEA-PTM framework is specifically selected to address these challenges based on its intrinsic methodological strengths:
3.1.3.1 Non-linearity handling
As a non-parametric method, PTM does not require assumptions of linear relationships among variables or specific data distributions (e.g., Gaussian). This allows it to effectively uncover the complex, non-linear interactions between terrain, resources, economy, and ecology that collectively define the LCC in different sub-regions of Hubei.
3.1.3.2 Robust global optimization
The DEA component provides a powerful global search capability within the high-dimensional projection space. This ensures the identification of the global optimal projection direction, effectively avoiding suboptimal solutions that simpler gradient-based optimizers might converge to, which is crucial for reliably distinguishing the LCC characteristics of vastly different areas like the western mountains and the east-ern plains.
3.1.3.3 Revealing intrinsic patterns
The core mechanism of the model—finding the optimal projection direction that maximizes the projection index—effectively synthesizes the multi-dimensional indicator data into a one-dimensional comprehensive value. This value intrinsically reflects the overall LCC level, thereby clearly revealing the underlying spatial differentiation patterns dictated by the topographic and socio-economic gradients across Hubei. Consequently, the DEA-PTM framework is not only methodologically advanced but also particularly well-suited and applicable for assessing LCC in geographically com-plex and heterogeneous regions like Hubei Province.
3.1.4 Interpretability of the DEA-PTM
While the DEA-PTM model handles high-dimensional, non-linear data effectively, its interpretability is a crucial aspect addressed in this study. Contrary to a complete “black-box” model, the core output of the DEA-PTM—the optimal projection direction vector—provides direct insights into the model’s decision-making process. The absolute values of the components of this unit vector are normalized to derive the weights of each evaluation indicator. These weights quantitatively represent the relative contribution of each indicator to the comprehensive LCC assessment. Therefore, by examining the optimal projection direction, the intrinsic influence of each variable on the final evaluation result can be explicitly interpreted, mitigating the black-box nature.
Furthermore, to enhance the practical interpretability and translate the comprehensive assessment into actionable insights, this study incorporates the ODM. The ODM utilizes the indicator weights derived from the DEA-PTM and couples them with the degree of indicator deviation from an ideal state. This combination allows for a quantitative diagnosis of the key limiting factors that hinder the improvement of LCC for each region. Consequently, the ODM serves as a powerful ex-post explanation framework, effectively deciphering the complex results generated by the DEA-PTM and clearly identifying the primary obstacles and their magnitudes, which is of para-mount importance for strategic decision-making.
3.1.5 Parameter configuration of the differential evolution algorithm
The configuration of parameters in the Differential Evolution Algorithm significantly influences its performance in optimizing the projection pursuit model. The scientific rationale for selecting the key parameters in this study is elaborated as follows:
3.1.5.1 Population size (NP=30)
The population size was set to 30. This value represents a balance between computational efficiency and global exploration capability. A smaller population might lack the diversity necessary to effectively explore the high-dimensional search space, while a larger population would substantially increase computational overhead without guaranteeing proportional performance gains. A population size around 30 is a common and empirically effective choice for problems of similar complexity in the literature (Yu et al., 2020; Gu et al., 2022; Wu et al., 2022; Su et al., 2024). This size is a common and empirically effective choice for problems of similar complexity in the literature.
3.1.5.2 Maximum number of iterations (Gmax=500)
The maximum iteration was set to 500. This value was determined through preliminary experiments to ensure sufficient generations for the algorithm to stabilize and converge towards the global optimum. The convergence was monitored by observing the stabilization of the projection index value across successive generations. Beyond 200 iterations, no significant improvement in the objective function was observed, indicating convergence. The convergence was monitored by observing the stabilization of the best projection index value across successive generations. After 500 iterations, the change in the objective function was negligible (< 1e-5), confirming convergence.
3.1.5.3 Scale factor (F=0.6) and crossover rate (CR=0.9)
The scale factor, which controls the amplification of the differential variation, was set to 0.6. The crossover rate, which determines the probability of parameter exchange between the mutant and target vectors, was set to 0.9. These values fall within the widely recommended and effective ranges (F∈[0.5,1], CR∈[0.8,1]) established in foundational DEA research. This combination promotes a balance between exploration (searching new areas) and exploitation (refining existing solutions), facilitating robust global optimization. This combination (moderate F, high CR) promotes a balance between exploration (searching new areas) and exploitation (refining existing solutions), facilitating robust global optimization (Yu et al., 2020; Gu et al., 2022; Wu et al., 2022; Su et al., 2024).
3.1.5.4 Search space ([0,1])
The search boundaries for each dimension of the projection vector were set to [0,1]. This range is appropriate as the projection vector is a unit vector, and its direction, rather than the magnitude of its components, is the primary concern. The optimization process naturally converges to a vector satisfying the unit constraint due to the structure of the projection index.
This parameter configuration was carefully chosen to ensure the robustness, efficiency, and convergence of the DEA in identifying the optimal projection direction for the LCC assessment.
3.2 Barrier degree model
Merely assessing the comprehensive LCC value is insufficient for informing targeted policy interventions. To directly address the research objective of identifying key limiting factors hindering LCC improvement—a crucial step towards proposing strategic management—the Obstacle Degree Model (ODM) was employed. This model quantitatively diagnoses the primary obstacles by integrating the indicator weights with the degree of deviation of each indicator from an ideal state, thereby pinpointing the most constraining factors within the WSCC, SCC, ECC, and EECC subsystems. The BDM is an important tool used to analyze the extent to which indicators in a comprehensive evaluation system impede system development, and its core idea is to quantify the “degree of impediment” of each indicator through a combination of indicator weights and indicator deviations. The formula is as follows:
The indicator weights () are not assigned subjectively but are directly derived from the optimal projection direction vector () obtained from the DEA-PTM model. The absolute values of the components of this unit vector are normalized to ensure they sum to 1, mathematically representing the relative contribution of each indicator to the comprehensive evaluation (Equation 16):
where denotes the weight of the th indicator, satisfying . is the total number of indicators, is the number of samples, and is the vector of optimal projection directions obtained via projection tracing that satisfies .
The degree of deviation is defined on the basis of the attributes of the indicator:
In Equation 17, where , and a larger value indicates a greater deviation from the ideal state.
The barrier degree of the th indicator for the th sample is expressed in Equation 18:
The combined handicap degree of the ith sample is expressed in Equation 19:
3.3 Autoregressive integral sliding average model
To extend the analysis beyond a static assessment and project future trajectories of LCC—addressing the temporal evolution aspect of the research question and providing forward-looking insights for sustainable management—the Autoregressive Integrated Moving Average (ARIMA) model was utilized. This classical time-series forecasting model was applied to the historical data of the overall LCC and its subsystem values to predict their trends up to 2035. This forecasting aims to reveal potential risks and support proactive policy planning under the assumption of current development patterns.
ARIMA is a classical time series forecasting method that combines the components of autoregression (AR), differencing (I), and sliding average (MA) and is suitable for forecasting non-stationary time series (Du et al., 2020; Salman and Kanigoro, 2021). The specific parameters (p, d, q) of the ARIMA model for each time series (overall LCC, WSCC, SCC, ECC, EECC) were determined through the standard procedure: (1) The order of differencing (d) was determined by applying the Augmented Dickey-Fuller (ADF) test to ensure stationarity. (2) The orders of the autoregressive (p) and moving average (q) terms were identified by examining the Autocorrelation Function (ACF) and Partial Autocorrelation Function (PACF) plots of the stationary series. The optimal model was selected based on the Bayesian Information Criterion (BIC), seeking the model with the lowest BIC value for robustness and parsimony. For instance, the final model for the overall LCC series was identified as ARIMA (1,1,1).
The combined formula is expressed in Equation 20:
where denotes the value of the sequence at moment after differencing the time series . is a constant term. are the autoregressive coefficients, which correspond to the degree of influence of different lags of the difference series on the current value of the difference series, respectively, and denotes the order of the autoregressive term. denote the values at moments to after differencing of the time series , respectively, which are used as explanatory variables in the autoregressive part to predict the value of the differenced series at the current moment . is the white noise error term, representing random disturbances or errors at time . It is typically assumed to have a mean of 0 and a constant variance. is the moving average coefficient, which corresponds to the degree of influence of the error term at different times on the current difference sequence value. represents the order of the moving average term.
3.4 A diagnostic-predictive modeling framework
The ODM and the ARIMA model are integrated into a coherent diagnostic-predictive modeling framework in this study to systematically assess the current status, limiting factors, and future trends of the LCC. These two models do not operate in isolation but assume clear and complementary functional roles, connected by an intrinsic causal logic chain (Figure 4).
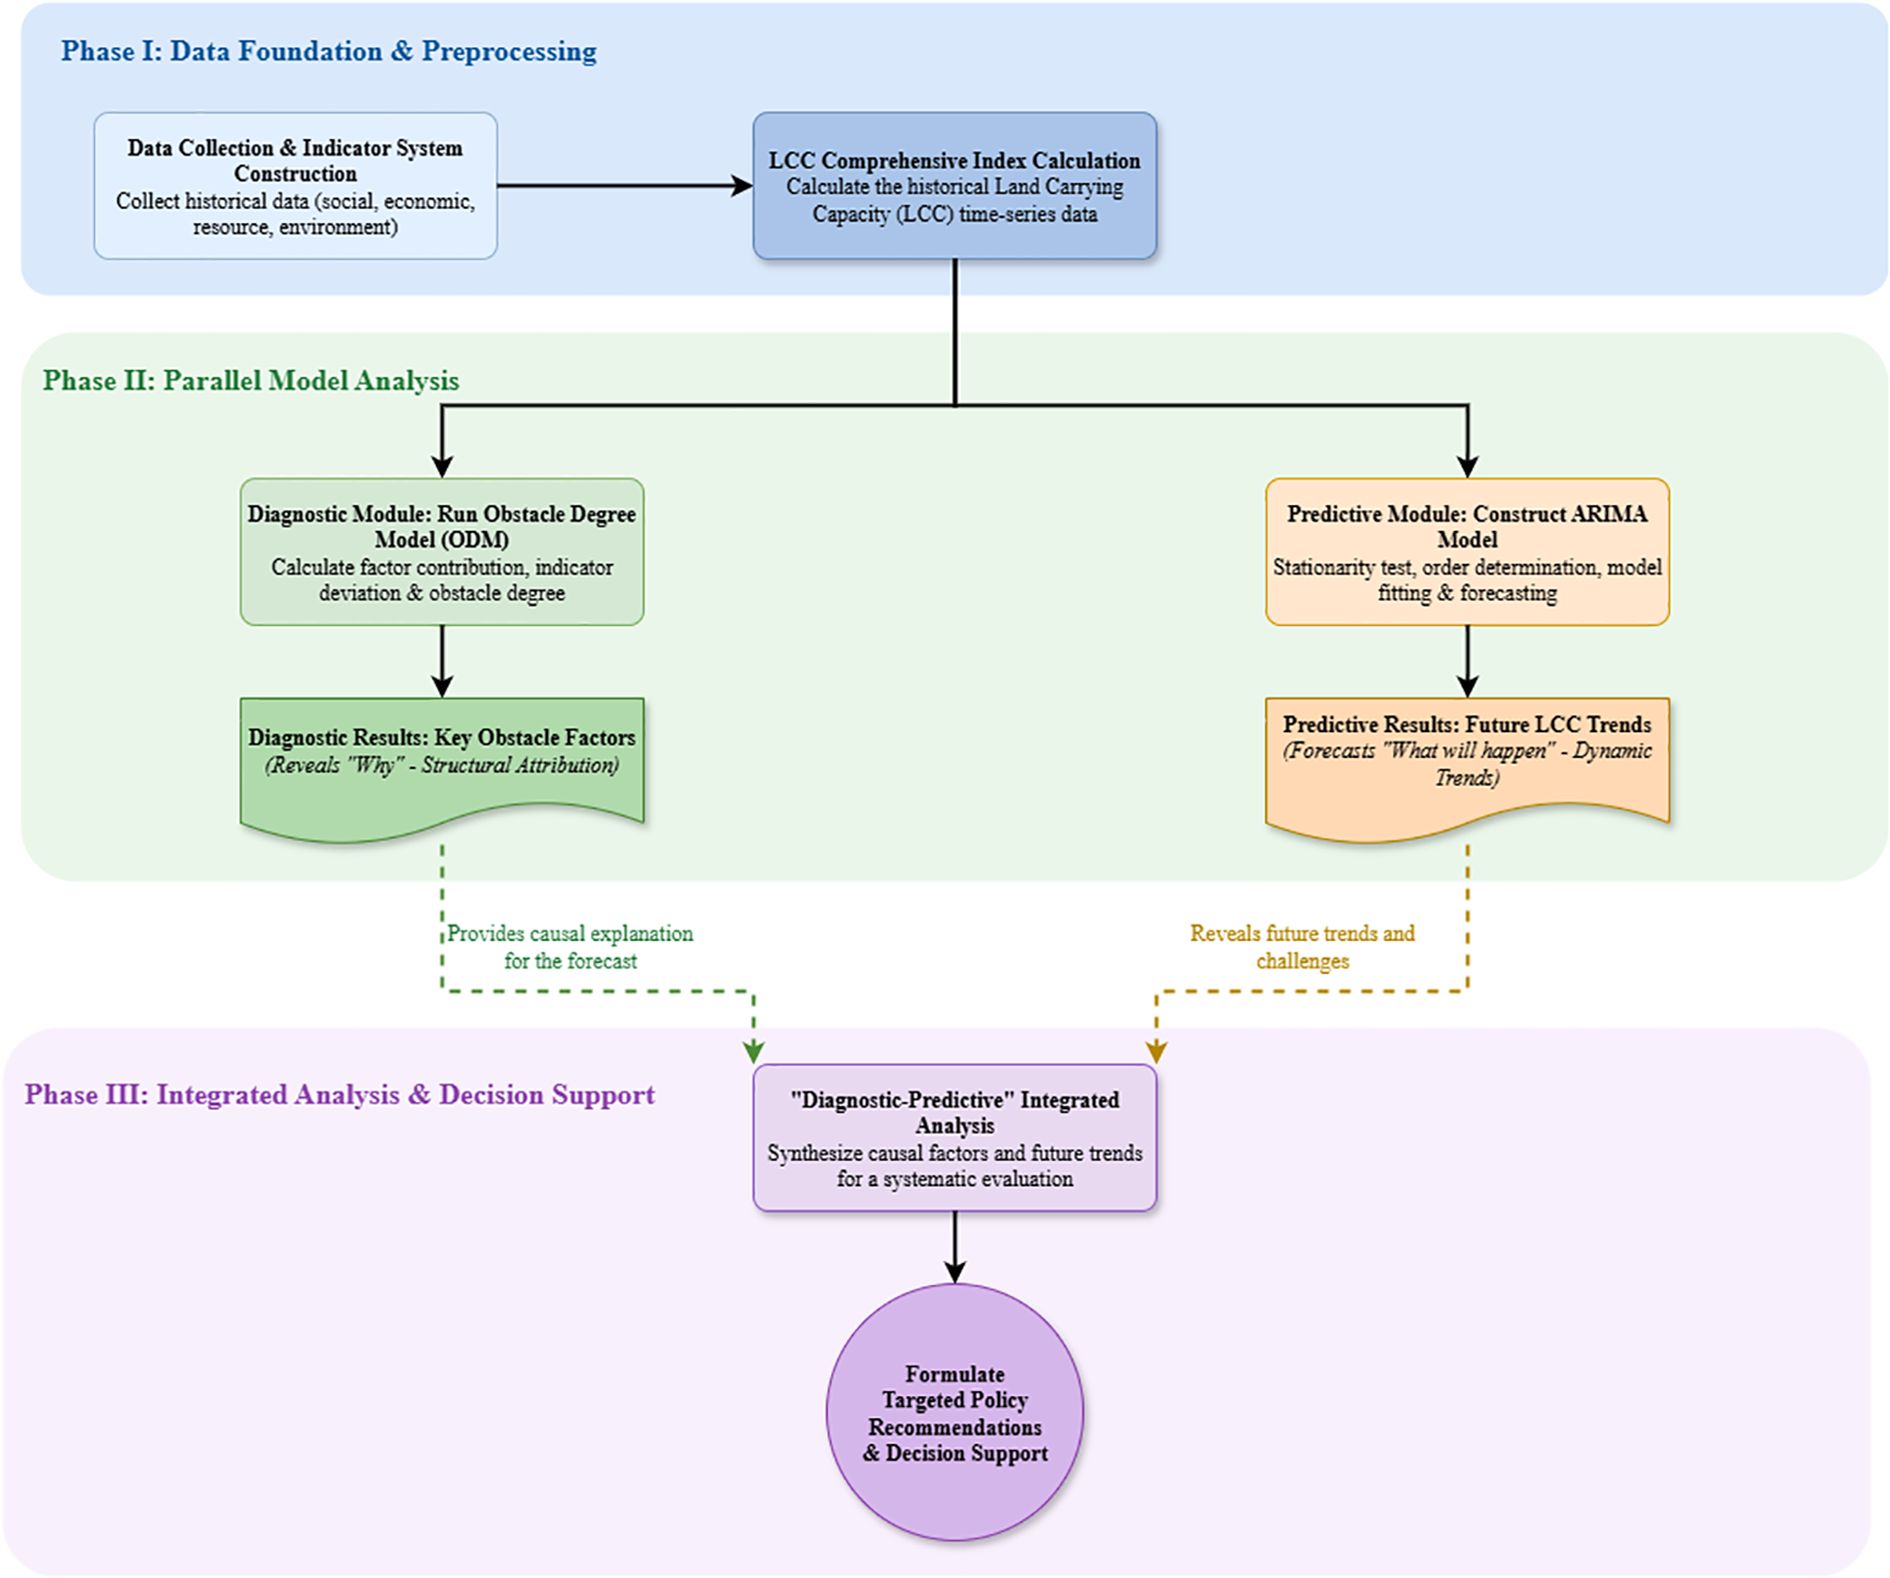
Figure 4. Flowchart of the collaborative ODM and ARIMA models within the “Diagnostic-Predictive” framework.
The core function of the ODM is to diagnose the present. It utilizes the indicator weights derived from the DEA-PTM model and the normalized data to quantitatively diagnose the core obstacle factors hindering LCC improvement in each region, along with their corresponding obstacle degrees. This process reveals the intrinsic pressures and weaknesses within the current system, answering the question: “What are the current main problems limiting development, and how severe are they?” The core function of the ARIMA model is to forecast the future. It models the dynamic evolution based on the historical time-series data of the comprehensive LCC and its subsystem values, extrapolating their future development trajectories. This process aims to answer the question: “What will the future hold if the current development pattern persists?”
The logic of integration lies in forming a causal explanation chain: the diagnostic results from the ODM provide a mechanistic explanation for the prediction results generated by the ARIMA model. For instance, if the ODM identifies the Ecological and Environmental Carrying Capacity (EECC) as the current core obstacle with a persistently increasing obstacle degree, then a declining trend in EECC predicted by the ARIMA model receives strong causal support. Conversely, the negative trends predicted by ARIMA also validate the long-term consequences if the current obstacle factors remain unaddressed. Therefore, the ODM explains the causes behind the current system state, while the ARIMA projects the future outcomes resulting from the persistence of that state. This mutual corroboration between diagnosis and prediction significantly enhances the reliability of the study’s conclusions. Together, they form a complete analytical closed loop, from current analysis to future early warning, providing a solid scientific basis for formulating precise and forward-looking land spatial optimization policies.
4 Results
4.1 HP LCC analysis
4.1.1 Timing variation analysis of HB’s LCC and subsystems
The parameter settings of the differential evolution algorithm are as described in Section 3.1.5, with a maximum iteration count of 500, population size of 30, search space [0,1], scaling factor of 0.6, and crossover rate CR of 0.9 to ensure optimization effectiveness.
During the period from 2010 to 2023, the overall LCC of the HP has shown a sustained increase (Figure 5). The initial value of 2010 was 1.1325, and a significant jump occurred in 2011, with an increase of 16.8%. After 2012, it entered a steady growth phase, with only a small correction in 2016. It reaches a peak value of 1.4125 by 2023, with a cumulative increase of 24.7% over 14 years, indicating that the combined pressure of regional development on LCC continues to increase and that the carrying capacity gradually approaches a critical state.

Figure 5. Overall LCC and subsystem carrying capacity of the HP.
The WSCC subsystem is highly stable, with a baseline value of 1.0335 in 2010, fluctuating within a very small range in subsequent years, and rising only slightly to 1.0658 in 2023, with an interannual variability of less than 3%, which is the most stable of the four subsystems, reflecting a long-term balance between the basic supply and demand of soil and water resources but with limited room for improvement. The SCC remained relatively stable from 2010 to 2021, with a value range of 1.0365-1.0854 and no significant trend change. However, in 2023, it increases abruptly to 1.8054, increasing 67.2% from the previous year. The ECC shows steady growth until 2021, gradually increasing from 1.0289 in 2010 to 1.0835 in 2021, with an average annual increase of approximately 0.4%. The EEC subsystem has a steady fluctuation overall, except in 2014. The value is stable in the range of 1.0329-1.0854 from 2010-2021, with no significant trend change. in the range of 1.0329-1.0654 and remains at the level of 1.03-1.04 after 2022.
4.1.2 Spatial differentiation of the LCC of HP
The LCC of the HP is divided into five levels: I (the highest carrying capacity area), II (the highest carrying capacity area), III (the medium carrying capacity area), IV (the lowest carrying capacity area) and V (the lowest carrying capacity area). Combined with the typical spatial distribution law, its spatial differentiation characteristics are shown in Figure 6.

Figure 6. Spatial dissimilarity map of the LCC of the HP.
Overall, the spatial differentiation of the land carrying capacity in Hubei Province presents a distinctive “east high, west low” stepped pattern. In general, the spatial differentiation of land carrying capacity in Hubei Province shows a distinctive “high in the east and low in the west” ladder pattern. Level I cities are centrally distributed in the core zone of the Jianghan Plain and include mainly the cities of Wuhan, Xiantao, Qianjiang, Tianmen and their surrounding areas. The region has flat and open terrain and fertile soil. At the same time, as the core area of the province’s economy, population and urbanization, the infrastructure is well developed, and the intensity of agricultural science and technology and economic inputs is high, which supports high-density population agglomeration and active economic activities, forming a contiguous high carrying capacity zone. The higher carrying capacity zone (Level II) surrounds the periphery of the Level I zone and extends to the riverine zone in East Hubei, covering Xiaogan, Ezhou, Huangshi, northern Xianning and southeastern Jingmen. The area is dominated by plains and low and gentle hills, with a small number of hills. The quality of arable land is generally good. The medium carrying capacity zone (Grade III) is located mainly in the granite fields of North E and the hilly areas of Central E, including Xiangyang, Suizhou, northwestern Jingmen and eastern Yichang. This zone is a transition zone from plains to mountains. As a transition zone from plains to mountains, this area is dominated by hills and mountains, with relatively fragmented arable land. The lower carrying capacity zone (Level IV) is distributed mainly in the periphery of mountainous areas in West E and hilly areas in Southeast E, such as eastern Shiyan, eastern Enshi, northern Huanggang and western Yichang. The region has middle and low mountainous terrain, the terrain slope has increased, and arable land resources are scarce and scattered. The lowest carrying capacity area (level V) is concentrated in the west and north of the province in the high-altitude Qinba-Wuling deep mountain ecological barrier area; the core area includes the entire Shennongjia forest area, the western part of Shiyan (e.g., Zhuxi, Zhushan, etc.), and the southwestern part of Enshi. The area is dominated by steep mountains with extremely high forest cover and very little flat land available for development.
4.1.3 Spatial differentiation of subsystems for HP LCCs
The four subsystems of the evaluation index system of the HP LCC are divided into level I (the highest carrying capacity area), level II (the higher carrying capacity area), level III (the middle carrying capacity area), level IV (the lower carrying capacity area) and level V (the lowest carrying capacity area) from high to low, and the spatial differentiation is plotted in Figures 7–10.

Figure 7. Spatial differentiation of the WSCC subsystems in the HP.

Figure 8. Spatial differentiation of the ECC subsystems in the HP.

Figure 9. Spatial differentiation of the SCC subsystems in the HP.

Figure 10. Spatial differentiation of the EECC subsystems in the HP.
The spatial differentiation of the HP WSCC presents the basal pattern of “east high and west low”, the Jianghan plain is continuously optimal, and the deep mountainous areas in western Hubei are the lowest; level I stably occupies the hinterland of the Jianghan plain, Jingzhou, Xiantao, Qianjiang, Tianmen, and southern Wuhan to Huangshi along the river belt in eastern Hubei. Level I stably occupies Jingzhou, Xiantao, Qianjiang, and Tianmen in the hinterland of the Jianghan Plain and the southern part of Wuhan to Huangshi in the riverine belt of eastern E. The level II distribution is around the Jianghan Plain, and the level II distribution is from Wuhan to Huangshi in the hinterland. Grade II glaciers are distributed around the transition zone of the Jianghan Plain, the hills in central Ezhou, and the river valleys in southwestern Ezhou, such as along the rivers in Yichang and the Enshi Basin. Level III cities are distributed mainly at the periphery of the urban agglomeration in the northern E region, the transitional zone of the western E mountainous region, the suburbs of Wuhan, Yichang Dijun, and so on. The level IV area is mainly distributed in the deep mountains of Qinba in West E, the high mountains of Wuling in South E, and the mountains of Mufu in Southeast E. The level V area is sporadically distributed in the ecologically extreme vulnerability zones, such as Enshi Gorge, the rocky desertification area in Northwest E, and the alpine steep slope zone.
The ECC of the HP is “high in the east, low in the west, and led by the dual core of Wuhan and Yichang”. Level I cities are distributed in the Wuhan metropolitan area and Yichang area. The main areas of level II cities are the industrial belt of East Hubei and the node cities of the Jianghan Plain, such as Jingmen and Xiaogan. Level III cities are distributed in the agricultural areas of the Jianghan Plain, such as Tianmen, Xiantao, and Qianjiang, and in the transition zones of northern Ezhou, such as Suizhou and northern Xiaogan. Level IV cities, such as Shiyan, Enshi Prefecture and Shennongjia Forestry District, are concentrated in the ecological zone of West China. Level V cities are sporadically distributed in remote mountainous counties of Enshi Prefecture, such as Hefeng, Xuan’en, part of the townships, and the western mountainous areas of Shiyan, such as the Zhuxi and Zhushan fringe zones.
The SCC of the HP shows a distribution pattern of “Wuhan is the strongest, followed by neighboring cities, and weaker, the further west the mountainous areas are”. Level I is the whole area of Wuhan. Level II includes provincial sub-centers such as Xiangyang and Yichang; East Hubei urban agglomerations such as Huangshi and Huanggang along the river; and Jingmen and Jingzhou at the hub of the Jianghan Plain. Level III cities are distributed in the Xiantao, Qianjiang, Tianmen, and Suizhou urban areas and Xianning. Level IV areas are concentrated in the mountainous areas of the West E and Shennongjia forest areas. Level V cities are sporadically distributed in remote townships in Enshi Prefecture, deep mountain villages in Shiyan Qinba, and around the pristine forest area of Shennongjia.
HP’s EECC shows a distinct pattern of “strong in the west and weak in the east”: class I is distributed throughout Shennongjia in the deep mountainous area of west Hubei, the alpine belt of Enshi, and the west of Shiyan; class II is distributed east of Shiyan in northwestern Hubei, and west of Yichang in southwestern Hubei; class III is distributed in Suizhou in the granite area in northern Hubei, and Jingmen in the hills in central Hubei; class IV is distributed in Tianmen and Xiantao in the agricultural area of the Jianghan Plain; and class V is distributed in the Wuhan metropolitan area.
4.2 Analysis of factors influencing LCC in HP
4.2.1 Analysis of factors affecting provincial LCCs
The evolution of barriers to LCC in HP as measured by ODM is charted in Figure 11. The EECC barrier degree increases in a stepwise manner from 0.3804 in 2010 to 0.44 in 2023 and is always at the top of the four indicators. This indicates that ecological pressure is a fundamental constraint on sustainable land use in HP. The pressure on the WSCC is moderate but still severe, decreasing annually from 0.3054 in 2010 to 0.25154 in 2018 and rebounding to 0.26 in 2023. The ECC and SCC show divergent evolutions. The degree of ECC obstacles increases slowly from 0.18908 in 2010 to 0.20149 in 2010 but decreases to 0.14 in 2023. The pressure on the SCC climbed steadily from 0.12512 in 2010 to 0.16 in 2023.

Figure 11. HP’s overall LCC barrier level.
4.2.2 Factors analyzed for LCCs at the HP municipal level
The ODM diagnostic results of LCC based on HP from 2010 to 2023 are shown in Figure 12. The temporal and spatial evolution characteristics of its limiting factors show significant regularity. From the time dimension, the position of the EECC as the core constraint factor continues to strengthen, and the mean value of the degree of provincial constraint increases from 0.502 at the beginning of the period to 0.636 at the end of the period, a phenomenon that is particularly prominent in cities with rapid industrialization, such as Wuhan, Yichang, and Ezhou, where the increase is generally more than 20 pp. The constraint of the SCC is dramatically weakened, with the mean value of the degree of constraint of the province decreasing from 0.086 to 0.006. The WSCC and ECC show volatility differentiation, with the former mean value from 0.284 slowly declining to 0.232, of which the plains cities improve significantly, whereas Enshi and other mountainous areas, owing to the natural conditions of the constraints, are still maintained at a high level; the latter oscillates in the range of 0.126 to 0.135, and Suizhou and other underdeveloped areas, due to lagging industrial transformation, appear not to decline but to rise in reverse evolution. Analyzed from the spatial pattern, the distribution of obstacle factors shows significant geographical differentiation. The Jianghan Plain and Wuhan Metropolitan Area are dominated by strong ecological and environmental constraints, especially Wuhan and Ezhou with dense waters, whose ecological and environmental obstacles at the end of the period exceeded 0.65, whereas the mountainous areas in western Hubei formed a compound obstacle zone of WSCC-EECC; for example, the obstacle degree of soil and water in Enshi Prefecture continues to be higher than the average value of the whole province by 23%, and the superimposed ecological and environmental obstacles have risen by 16%. Although the EECC constraints of Huanggang and Xianning in East Hubei are relatively moderate, the degree of EECC obstacles is increasing.
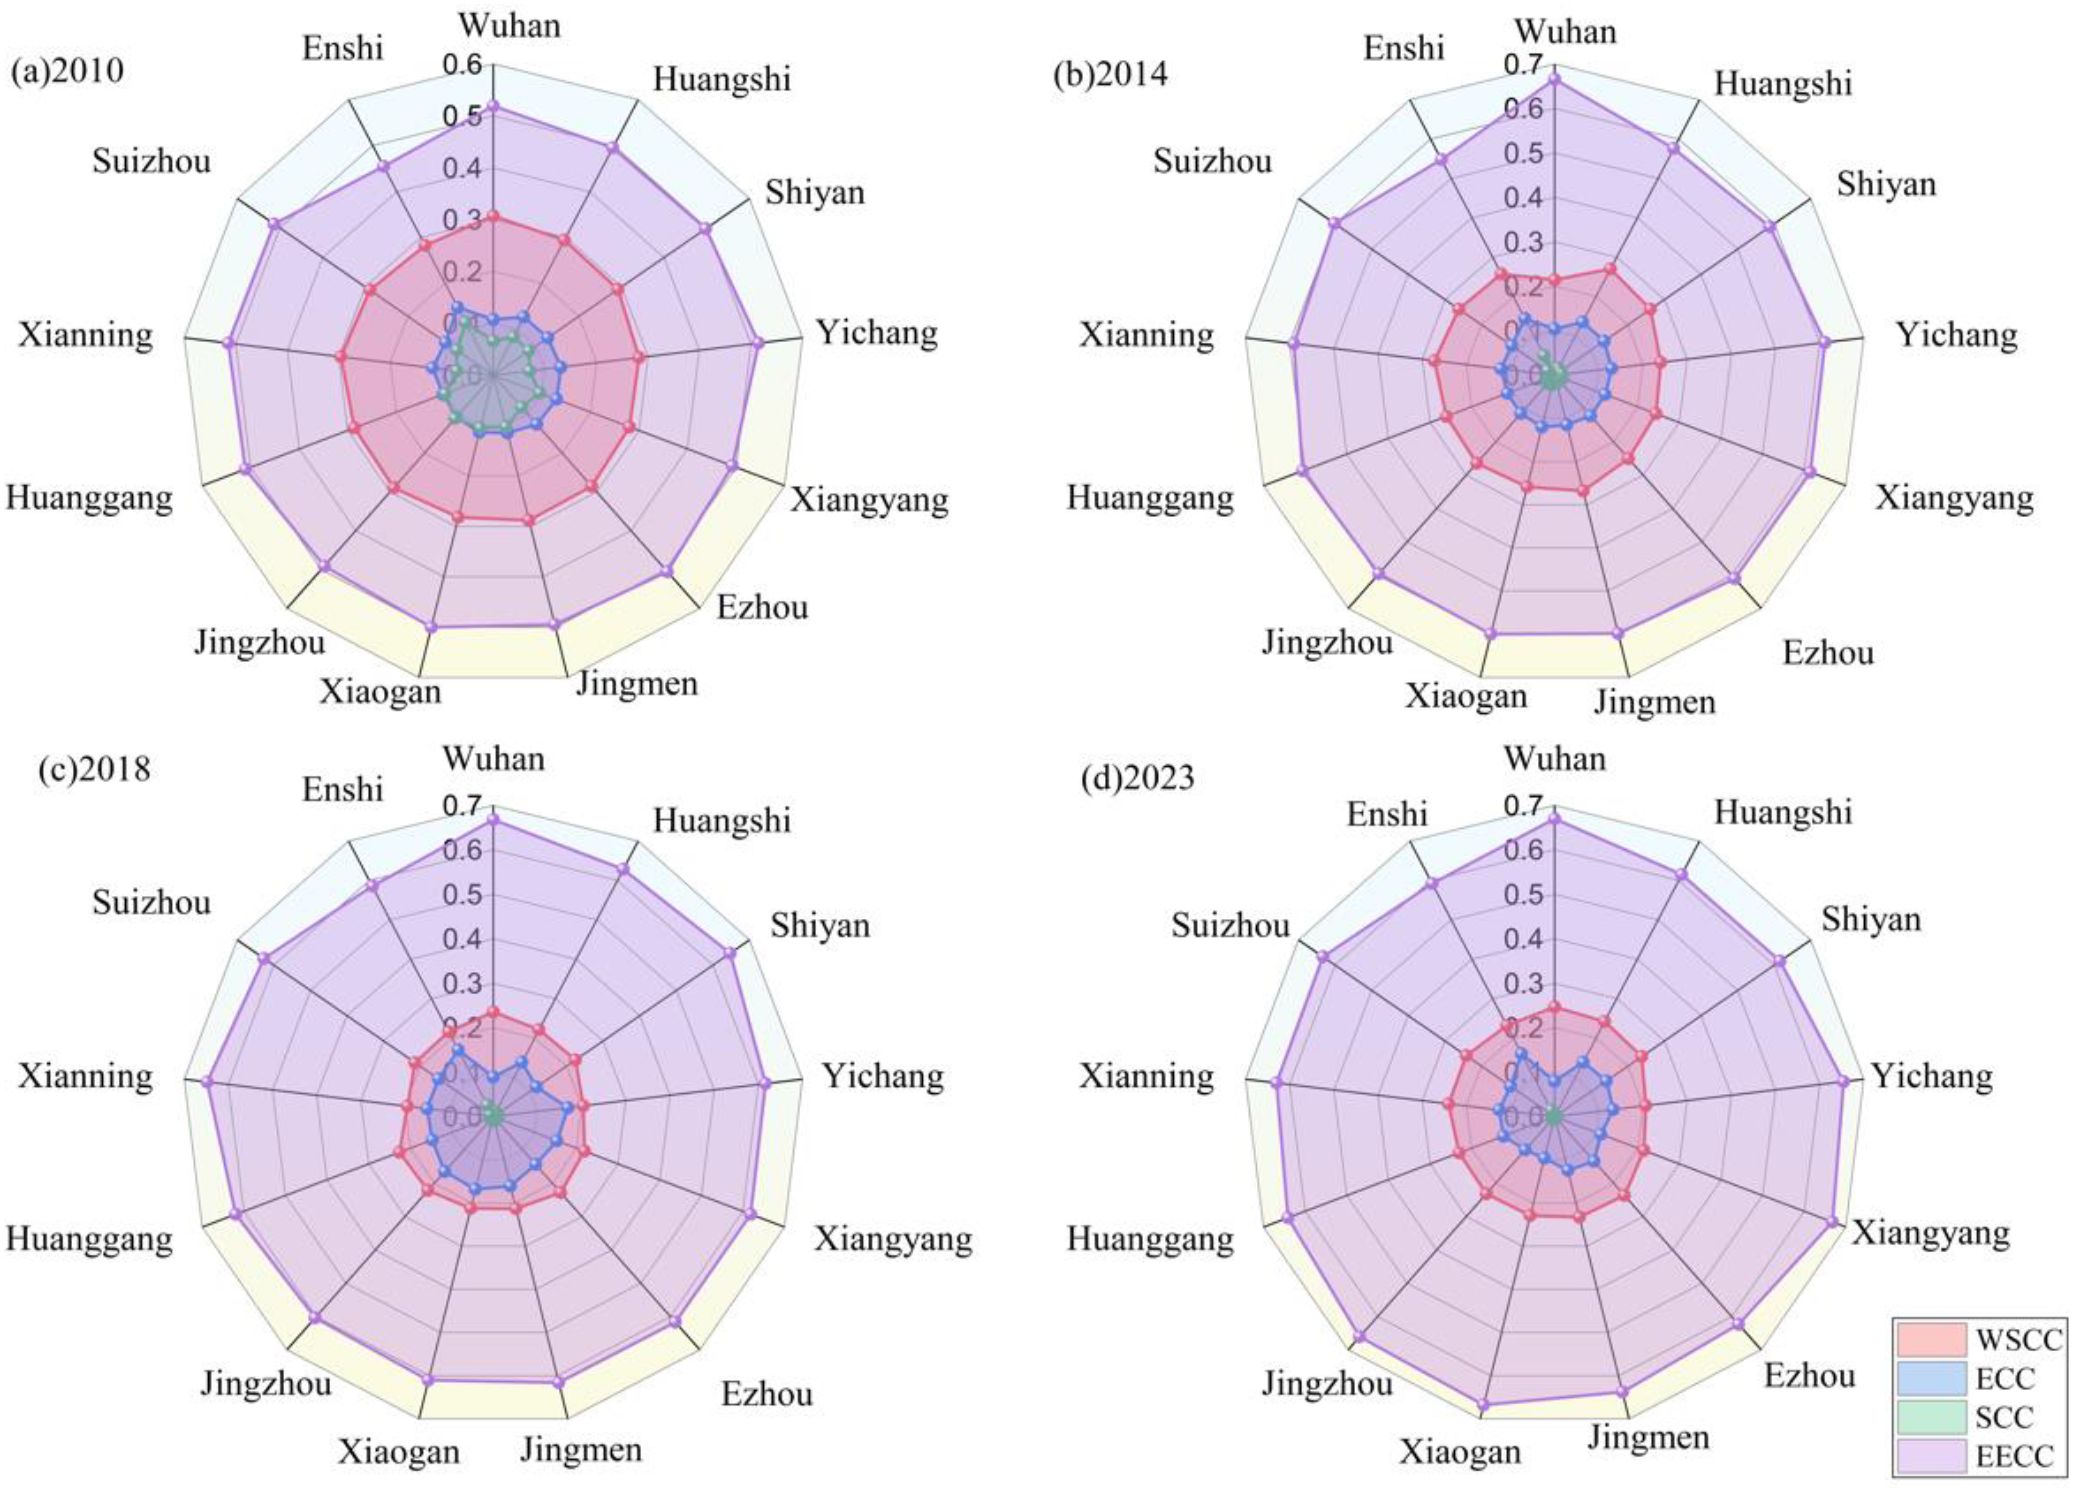
Figure 12. HP LCC barrier factor analysis by municipality.
This spatial-temporal evolution of obstacle factors underscores a critical regional dilemma: the eastern plains, as economic powerhouses, face intensifying ecological-environmental pressures, while the western mountains, serving as ecological barriers, grapple with compound constraints of water-soil resources and ecological vulnerability. This pattern highlights the trade-off and potential synergy between economic development and ecological conservation across different regions within Hubei Province, providing a precise target for formulating differentiated management policies.
4.3 Prediction of the LCC and subsystem values of the HP
The ARIMA model was used to predict the LCC values of HP (Table 3). Historical data on HP’ LCC values show that the actual values generally align well with the predicted values, with small residuals, indicating that the prediction model has a certain degree of reliability. The model indicates that the land carrying capacity will continue to rise steadily, increasing from 1.434 in 2024 to 1.671 in 2035, with an average annual growth rate of approximately 1.1%, indicating that the LCC of HP will continue to increase.

Table 3. HP LCC value prediction.
Table 4 presents the predictions of the WSCC indicator in the LCC indicator system of HP via the ARIMA model. A comparison of the actual values and predicted values from 2010 to 2023 shows that the residual values predicted by the model are sometimes positive and sometimes negative, indicating that there is a certain deviation between the predicted values and the actual values. However, the absolute value of the deviation is relatively small, suggesting that the ARIMA model can reasonably fit the WSCC values to a certain extent. The predicted values for 2024–2035 show a sustained upward trend, indicating that the WSCC of HP will continue to strengthen, providing support for the overall improvement in LCC. This prediction result is helpful for advance planning and rational utilization of water and soil resources, promoting sustainable development in HP.

Table 4. Prediction of WSCC values for the HP LCC subsystem.
Table 5 presents the application of the ARIMA model to predict the SCC of the LCC indicator system for HP. During the period from 2010 to 2023, there were certain discrepancies between the actual values and the predicted values, manifested as residual values that were both positive and negative. This indicates that the predicted values were higher than the actual values in some years and lower than the actual values in others. However, overall, the model was able to generally capture the trend in the SCC values. On the basis of the actual values from 2010 to 2023, the carrying capacity values of the social subsystem exhibit certain fluctuations, reflecting changes influenced by various factors, such as socio-economic development. For the predicted values from 2024 to 2035, the trend shows an upward trajectory until 2027, reaching 1.740, followed by a gradual decline. This may suggest that there is room for improvement in the SCC during the earlier period, but it may be constrained by certain factors in the later period, leading to a decline. This prediction can help AP take proactive measures to optimize the development of the social subsystem and enhance LCC.
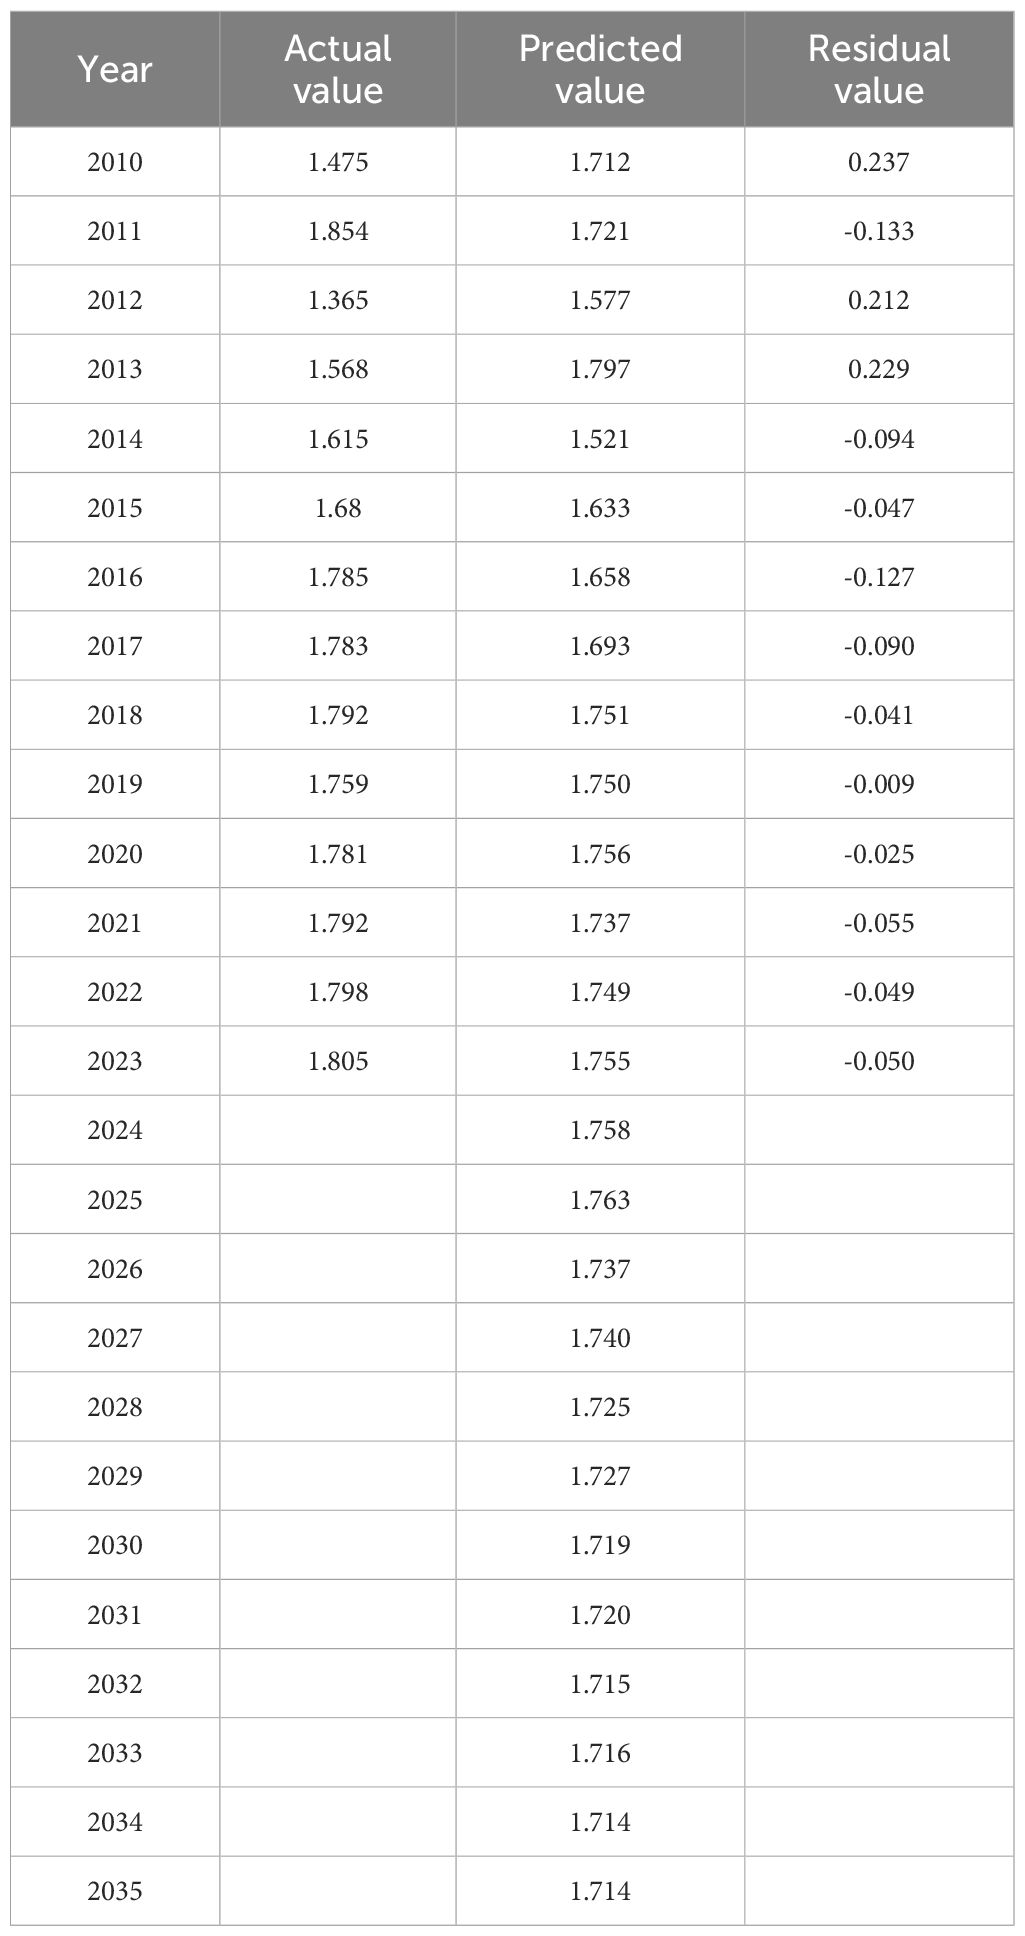
Table 5. Prediction of the SCC values for the HP LCC subsystem.
The ARIMA model is used to predict the ECC of the LCC indicator system of HP, as shown in Table 6. During the period from 2010 to 2023, there is a certain discrepancy between the actual values and the predicted values, with residual values being both positive and negative. However, overall, the model’s predicted values align with the trend of the actual values over time, generally reflecting the fluctuating characteristics of the ECC values. Looking at the predicted values for the period from 2024 to 2035, the ECC values show a continuous upward trend, rising from 1.910 in 2024 to 2.306 in 2035. This suggests that, driven by relevant factors, the ECC of HP is expected to continue to strengthen in the future, providing positive support for the enhancement of the land carrying capacity. This forecast result holds significant reference value for Hubei Province in terms of advancing economic development planning, optimizing resource allocation, and ensuring the sustainable use of land.

Table 6. Prediction of the ECC values for the HP LCC subsystem.
Table 7 presents the results of predicting the EECC of the LCC indicator system for HP via the ARIMA model. For the predicted values from 2024 to 2035, the EECC values show a continuous downward trend, decreasing from 1.318 in 2024 to 1.077 in 2035. This may suggest that under the combined influence of relevant factors, the EECC will face certain challenges in the future. This forecast result can provide data support for HP to formulate ecological and environmental protection and sustainable development strategies in advance to address potential ecological and environmental pressures.

Table 7. Prediction of EECC values for the HP LCC subsystem.
5 Discussion
This study addresses the problems of insufficient regional adaptability of the indicator system and difficulties in addressing complex non-linear relationships in LCC assessment. The marginal contributions of this research are twofold. First, it constructs a balanced and regionally adaptable four-dimensional evaluation system (WSCC, SCC, ECC, EECC), overcoming the narrow focus of traditional models like PSR and DPSIR. Second, it develops the DEA-PTM model, which significantly enhances methodological objectivity in weight determination and capability in deciphering complex, non-linear data patterns. The integration of this novel framework with ODM and forecasting ARIMA provides a cohesive diagnostic-predictive pipeline for holistic spatial-temporal analysis and informed policy-making. The DEA-PTM model proved particularly effective in handling the high-dimensional and likely non-linear data arising from Hubei’s complex terrain, providing a robust tool to decipher the spatial differentiation patterns of LCC. The spatial differentiation of the four major subsystems is significant, with the eastern part of the WSCC being superior and the western part of the EECC being stronger; the obstacle diagnosis reveals that ecological pressure and soil and water constraints are the core constraints, a finding consistent with studies in other rapidly industrializing regions where ecological degradation often becomes a primary limiting factor for sustainable development (Henderson and Loreau, 2023; Rong et al., 2024); and the prediction shows that the overall carrying capacity will continue to be enhanced by 2035, but the EECC is in a declining trend, and the risk of ecological degradation needs to be guarded against. The results provide an important scientific basis for regional land space optimization.
The results of this study share a consensus and differ from the established literature in terms of the methodological framework and core findings. At the methodological level, this study adopts the DEA-PTM, which is consistent with the objective of the established studies in applying intelligent methods such as particle swarm optimization and genetic algorithms to enhance the objectivity of LCC assessment, and together, they verify the effectiveness of the fusion of intelligent algorithms in solving the problem of subjectivity in traditional assessment. In terms of spatial patterns, the ‘east-high, west-low’ stepped pattern of the HP contrasts with that of Sun et al (Sun et al., 2020). ‘s conclusion of ‘significant differences between cities and counties, but no gradient pattern’ in their study of the Yangtze River Delta Plain, which is attributed to the strong coupling between the topographic gradient and the economic core, whereas the plains area is more susceptible to the influence of local policies to form the distribution of plaquettes.
With respect to the obstacles, this study reveals that ecological pressure and soil and water resource constraints are the core limitations, which is significantly different from the conclusion of Gao et al.’s (Gao et al., 2022) study in Northeast China that “ecology is not the main obstacle”. This discrepancy underscores the context-dependent nature of LCC obstacles. In Hubei, the combined pressures of rapid industrialization, urbanization, and agricultural intensity on a relatively fragile ecological base in the west and a dense water network in the east amplify ecological concerns (Luo et al., 2018; Zhang et al., 2024a),which is attributed mainly to the superimposed effects of fragmentation of arable land in the mountainous areas west of the ARP and pollution of the water bodies in the eastern plains, highlighting the moderating effect of geographic patterns on the obstacles. In particular, the ARIMA prediction reveals that the overall carrying capacity continues to rise but that the EECC significantly decreases, which has not been reported in the literature. This unique finding stems from the regional development characteristic of accelerated expansion of ecological deficits in the process of industrialization, which provides an early warning of ecological risks in similar regions.
To translate these forecasts into actionable insights for land management, targeted strategies are imperative. The logic of integration lies in forming a causal explanation chain: the diagnostic results from the ODM provide a mechanistic explanation for the prediction results generated by the ARIMA model. For instance, if the ODM identifies the Ecological and Environmental Carrying Capacity (EECC) as the current core obstacle with a persistently increasing obstacle degree, then a declining trend in EECC predicted by the ARIMA model receives strong causal support. Conversely, the negative trends predicted by ARIMA also validate the long-term consequences if the current obstacle factors remain unaddressed. Therefore, the ODM explains the causes behind the current system state, while the ARIMA projects the future outcomes resulting from the persistence of that state. This mutual corroboration between diagnosis and prediction significantly enhances the reliability of the study’s conclusions. Together, they form a complete analytical closed loop, from current analysis to future early warning, providing a solid scientific basis for formulating precise and forward-looking land spatial optimization policies. The projected overall LCC growth to 1.671 by 2035 indicates a positive trajectory that should be sustained through optimized intensive land use, particularly in the high-capacity eastern plains. This necessitates strict enforcement of urban growth boundaries and the revitalization of inefficient urban land. Conversely, the predicted decline in EECC to 1.077 underscores a critical need for immediate intervention. Policy measures must prioritize stricter pollution control (e.g., enforcing industrial wastewater standards, enhancing waste treatment capacity) and promoting green, low-carbon development to mitigate environmental pressures, especially in industrialized zones and the Wuhan metropolitan area. Furthermore, ecological conservation and restoration projects should be amplified, particularly in the western mountainous ecological barriers, to enhance ecosystem resilience. For the stable yet constrained WSCC, management should focus on improving resource utilization efficiency, such as promoting water-saving irrigation and precision agriculture. The steady ECC provides a foundation to address SCC fluctuations by improving social welfare and spatial equity across regions. These derived measures provide a strategic framework for policymakers to leverage positive trends, preemptively address risks, and steer regional development toward genuine sustainability.
Translating these warnings into actionable policy is crucial. The projected EECC decline demands targeted interventions informed by the obstacle analysis. For western mountainous regions like Enshi, ecological resettlement programs could alleviate compound water-soil and ecological pressures by reducing population density and agricultural intensity. This would directly mitigate key obstacle factors. For eastern industrial clusters, policies enforcing industrial transformation and stricter pollution controls are essential to reduce wastewater discharge intensity. Such targeted measures could potentially curb the growth of the EECC obstacle degree and alter the negative forecasted trajectory.
By constructing a four-dimensional assessment system that integrates intelligent algorithms, this study reveals the gradient differentiation law and subsystem evolution characteristics of the HP LCC, which provides an important scientific basis for the optimization of regional land space. However, owing to the limitations of data acquisition and the methodological framework, the following limitations still need to be considered:
1. Data timeliness and precision constraints. While Landsat imagery was incorporated to validate and refine the land use classification (Figure 3), enhancing spatial accuracy, a significant portion of the indicator data (e.g., socioeconomic metrics, resource consumption statistics) was still primarily derived from statistical yearbooks. The lack of higher-resolution spatial data or real-time monitoring for these specific indicators may affect the fine-grained portrayal of local heterogeneity characteristics.
2. The dynamic perturbation response is missing. ARIMA forecasts do not integrate key perturbation factors such as extreme climatic events and policy regulation, limiting the reliability of long-term trend warnings.
3. Study area extension should be supplemented. The assessment framework constructed on the basis of the topographic gradient of the HP needs to verify the synergistic influence mechanism of economic agglomeration and topographic relief when expanding to similar regions.
4. The assessment framework and primary conclusions of this study were derived from an empirical analysis of Hubei Province, characterized by a distinct “high-west and low-east” topographic pattern. Although the proposed framework demonstrates methodological advantages in handling complex non-linear relationships, its direct applicability to other types of complex terrains (e.g., the Yungui Plateau, Loess Plateau) remains untested. The dominant obstacle factors and evolution patterns of LCC may vary significantly across different regions due to their unique geographical contexts and socio-economic conditions.
On the basis of the above limitations, future research can be deepened in three ways. First, multi-source data fusion is carried out, integrating dynamic data such as remote sensing ecological indices and mobile phone signaling population movement to build a real-time monitoring platform for LCC. Second, multiscenario simulations and predictions are carried out. A system dynamics model is introduced to assess the resilient response path of the carrying capacity under the superimposed scenarios of carbon neutrality targets and climate risk. Finally, the regional adaptation mechanism should be optimized. A topography–economy two-parameter correction coefficient is established to form a customized scheme for cross-scale assessment of the Yangtze River Economic Zone.
6 Conclusions
In this study, to address the problems of insufficient regional adaptability and complex non-linear relationships in LCC assessment, we constructed a four-dimensional evaluation system that integrates the WSCC, SCC, ECC and EECC and developed PTM-DEA. Using HP as the empirical area, combined with ODM diagnosis and ARIMA prediction, we draw the following core conclusions:
1. From 2010–2023, the LCC of HP increased by 24.7% cumulatively, indicating a significant spatial differentiation of ‘high in the east and low in the west’, with the core area of the Jianghan Plain as the high carrying capacity agglomeration zone and the ecological barrier area of the Qinba Mountainous Region as the lowest carrying capacity.
2. The WSCC and EECC exhibit east–west reverse divergence, reflecting the deep-seated contradiction between resource endowment and ecological protection in regional development.
3. Ecological pressure and soil and water constraints are the core factors that constrain the LCC, and the ecological barriers show a continuous strengthening trend.
4. The overall LCC is predicted to increase to 1.671 by 2035, but the EECC will decline to 1.077, highlighting the expansion of ecological risk.
The innovations of this study are threefold:
1. Theoretically, we propose a balanced four-dimensional LCC evaluation framework (WSCC, SCC, ECC, EECC) that moves beyond the environmentally-centric bias of traditional PSR/DPSIR models, thereby offering a more holistic and regionally adaptable structure for geographically complex areas.
2. Methodologically, the integration of the Differential Evolution Algorithm with the Projection Pursuit Model (DEA-PTM) enhances the objectivity of weight determination and the capability to handle non-linear, high-dimensional data, overcoming the subjectivity and linearity limitations inherent in commonly used methods like AHP or PCA.
3. Practically, the combined application of the Obstacle Degree Model (ODM) and ARIMA forecasting provides a cohesive diagnostic-predictive pipeline, enabling not only a static assessment but also a dynamic analysis of limiting factors and future trends, which offers actionable insights for strategic land management.
Data availability statement
The raw data supporting the conclusions of this article will be made available by the authors, without undue reservation.
Author contributions
BR: Conceptualization, Data curation, Writing – original draft. TS: Formal Analysis, Project administration, Supervision, Visualization, Writing – original draft, Writing – review & editing. YS: Conceptualization, Methodology, Visualization, Writing – original draft, Writing – review & editing.
Funding
The author(s) declare that no financial support was received for the research, and/or publication of this article.
Conflict of interest
The authors declare that the research was conducted in the absence of any commercial or financial relationships that could be construed as a potential conflict of interest.
Generative AI statement
The author(s) declare that no Generative AI was used in the creation of this manuscript.
Any alternative text (alt text) provided alongside figures in this article has been generated by Frontiers with the support of artificial intelligence and reasonable efforts have been made to ensure accuracy, including review by the authors wherever possible. If you identify any issues, please contact us.
Publisher’s note
All claims expressed in this article are solely those of the authors and do not necessarily represent those of their affiliated organizations, or those of the publisher, the editors and the reviewers. Any product that may be evaluated in this article, or claim that may be made by its manufacturer, is not guaranteed or endorsed by the publisher.
References
Akhtar N., Ishak M. I. S., Ahmad M. I., Umar K., Md Yusuff M. S., Anees M. T., et al. (2021). Modification of the water quality index (WQI) process for simple calculation using the multi-criteria decision-making (MCDM) method: A review. Water 13, 905. doi: 10.3390/w13070905
Andresen C. G., Lawrence D. M., Wilson C. J., McGuire A. D., Koven C., Schaefer K., et al. (2020). Soil moisture and hydrology projections of the permafrost region – a model intercomparison. Cryosphere 14, 445–459. doi: 10.5194/tc-14-445-2020
Bilal, Pant M., Zaheer H., Garcia-Hernandez L., and Abraham A. (2020). Differential Evolution: A review of more than two decades of research. Eng. Appl. Artif. Intell. 90, 103479. doi: 10.1016/j.engappai.2020.103479
Chang L., Mohsin M., Hasnaoui A., and Taghizadeh-Hesary F. (2023). Exploring carbon dioxide emissions forecasting in China: A policy-oriented perspective using projection pursuit regression and machine learning models. Technol. Forecasting Soc. Change 197, 122872. doi: 10.1016/j.techfore.2023.122872
Chen G. and Wang S. (2023). Evaluation of urban resource environmental carrying capacity and land spatial development suitability in a semiarid area of the yellow river basin. Sustainability 15, 12411. doi: 10.3390/su151612411
Deng W., Shang S., Cai X., Zhao H., Song Y., and Xu J. (2021a). An improved differential evolution algorithm and its application in optimization problem. Soft Comput. 25, 5277–5298. doi: 10.1007/s00500-020-05527-x
Deng W., Xu J., Song Y., and Zhao H. (2021b). Differential evolution algorithm with wavelet basis function and optimal mutation strategy for complex optimization problem. Appl. Soft Computing 100, 106724. doi: 10.1016/j.asoc.2020.106724
Dong J., Wang Z., Wu J., Cui X., and Pei R. (2024). A novel runoff prediction model based on support vector machine and gate recurrent unit with secondary mode decomposition. Water Resour Manage 38, 1655–1674. doi: 10.1007/s11269-024-03748-5
Doxani G., Vermote E. F., Roger J.-C., Skakun S., Gascon F., Collison A., et al. (2023). Atmospheric Correction Inter-comparison eXercise, ACIX-II Land: An assessment of atmospheric correction processors for Landsat 8 and Sentinel-2 over land. Remote Sens. Environ. 285, 113412. doi: 10.1016/j.rse.2022.113412
Du H., Zhao Z., and Xue H. (2020). ARIMA-M: A new model for daily water consumption prediction based on the autoregressive integrated moving average model and the Markov chain error correction. Water 12, 760. doi: 10.3390/w12030760
Ebrahimi M., Nejadsoleymani H., and Mansouri Daneshvar M. R. (2019). Land suitability map and ecological carrying capacity for the recognition of touristic zones in the Kalat region, Iran: a multi-criteria analysis based on AHP and GIS. Asia-Pac J. Reg. Sci. 3, 697–718. doi: 10.1007/s41685-019-00123-w
Fan M., Chen J., Xie Z., Ouyang H., Li S., and Gao L. (2022). Improved multi-objective differential evolution algorithm based on a decomposition strategy for multi-objective optimization problems. Sci. Rep. 12, 21176. doi: 10.1038/s41598-022-25440-7
PubMed Abstract | PubMed Abstract | Crossref Full Text | Google Scholar
Gao J., Zhao R., and Zhan Y. (2022). Land comprehensive carrying capacity of major grain-producing areas in northeast China: spatial–temporal evolution, obstacle factors and regulatory policies. Sustainability 14, 11322. doi: 10.3390/su141811322
Grear T., Avery C., Patterson J., and Jacobs D. J. (2021). Molecular function recognition by supervised projection pursuit machine learning. Sci. Rep. 11, 4247. doi: 10.1038/s41598-021-83269-y
PubMed Abstract | PubMed Abstract | Crossref Full Text | Google Scholar
Grimmond S. (2007). Urbanization and global environmental change: Local effects of urban warming. Geogr. J. 173, 83–88. doi: 10.1111/j.1475-4959.2007.232_3.x
Gu X. B., Shao J. L., Wu S. T., Wu Q. H., and Bai H. (2022). The risk assessment of debris flow hazards in Zhouqu based on the projection pursuit classification model. Geotech Geol Eng. 40, 1267–1279. doi: 10.1007/s10706-021-01961-2
Henderson K. and Loreau M. (2023). A model of Sustainable Development Goals: Challenges and opportunities in promoting human well-being and environmental sustainability. Ecol. Model. 475, 110164. doi: 10.1016/j.ecolmodel.2022.110164
Hsu W.-L., Shen X., Xu H., Zhang C., Liu H.-L., and Shiau Y.-C. (2021). Integrated evaluations of resource and environment carrying capacity of the Huaihe river ecological and economic belt in China. Land 10, 1168. doi: 10.3390/land10111168
Hu H. and Han L. (2023). Evaluation of land carrying capacity of 31 provinces in China based on a natural-societal-supply-demand framework. Sustainability 15, 1037. doi: 10.3390/su15021037
Hu W., Zhang S., Fu Y., Jia G., Yang R., Shen S., et al. (2023). Objective diagnosis of machine learning method applicability to land comprehensive carrying capacity evaluation: A case study based on integrated RF and DPSIR models. Ecol. Indic. 151, 110338. doi: 10.1016/j.ecolind.2023.110338
Huang A., Tian L., Li Q., Li Y., Yu J., Gao Y., et al. (2023). Land-use planning serves as a critical tool for improving resources and environmental carrying capacity: A review of evaluation methods and application. Int. J. Environ. Res. Public Health 20, 2370. doi: 10.3390/ijerph20032370
PubMed Abstract | PubMed Abstract | Crossref Full Text | Google Scholar
Jiang H., Peng J., Liu M., Dong J., and Ma C. (2024). Integrating patch stability and network connectivity to optimize ecological security pattern. Landsc Ecol. 39, 54. doi: 10.1007/s10980-024-01852-w
Kaur L., Rishi M. S., and Siddiqui A. U. (2020). Deterministic and probabilistic health risk assessment techniques to evaluate non-carcinogenic human health risk (NHHR) due to fluoride and nitrate in groundwater of Panipat, Haryana, India. Environ. pollut. 259, 113711. doi: 10.1016/j.envpol.2019.113711
PubMed Abstract | PubMed Abstract | Crossref Full Text | Google Scholar
Kim J. H., Lee D. H., Mendoza J. A., and Lee M.-Y. (2024). Applying machine learning random forest (RF) method in predicting the cement products with a co-processing of input materials: Optimizing the hyperparameters. Environ. Res. 248, 118300. doi: 10.1016/j.envres.2024.118300
PubMed Abstract | PubMed Abstract | Crossref Full Text | Google Scholar
Li Z., Luo Z., Wang Y., Fan G., and Zhang J. (2022). Suitability evaluation system for the shallow geothermal energy implementation in region by Entropy Weight Method and TOPSIS method. Renewable Energy 184, 564–576. doi: 10.1016/j.renene.2021.11.112
Lin J., Wang Y., Lin Z., and Li S. (2025). National-scale connectivity analysis and construction of forest networks based on graph theory: A case study of China. Ecol. Eng. 216, 107639. doi: 10.1016/j.ecoleng.2025.107639
Liu X., Yuan L., and Tan G. (2023b). Identification and hierarchy of traditional village characteristics based on concentrated contiguous development-taking 206 traditional villages in Hubei province as an example. Land 12, 471. doi: 10.3390/land12020471
Liu M., Zhang C., Sun X., Zhang X., Liao D., Hou J., et al. (2023a). Spatial differentiation and driving mechanisms of ecosystem service value change in rural land consolidation: evidence from Hubei, China. Land 12, 1162. doi: 10.3390/land12061162
Lu Y., Xu H., Wang Y., and Yang Y. (2017). Evaluation of water environmental carrying capacity of city in Huaihe River Basin based on the AHP method: A case in Huai’an City. Water Resour. Industry 18, 71–77. doi: 10.1016/j.wri.2017.10.001
Luo W., Bai H., Jing Q., Liu T., and Xu H. (2018). Urbanization-induced ecological degradation in Midwestern China: An analysis based on an improved ecological footprint model. Resources Conserv. Recycling 137, 113–125. doi: 10.1016/j.resconrec.2018.05.015
Movassagh A. A., Alzubi J. A., Gheisari M., Rahimi M., Mohan S., Abbasi A. A., et al. (2023). Artificial neural networks training algorithm integrating invasive weed optimization with differential evolutionary model. J. Ambient Intell. Hum. Comput. 14, 6017–6025. doi: 10.1007/s12652-020-02623-6
Nazeer M., Ilori C. O., Bilal M., Nichol J. E., Wu W., Qiu Z., et al. (2021). Evaluation of atmospheric correction methods for low to high resolutions satellite remote sensing data. Atmospheric Res. 249, 105308. doi: 10.1016/j.atmosres.2020.105308
Ouyang X., Wang J., Chen X., Zhao X., Ye H., Watson A. E., et al. (2021). Applying a projection pursuit model for evaluation of ecological quality in Jiangxi Province, China. Ecol. Indic. 133, 108414. doi: 10.1016/j.ecolind.2021.108414
Peng T. and Deng H. (2021). Evaluating urban resource and environment carrying capacity by using an innovative indicator system based on eco-civilization—a case study of Guiyang. Environ. Sci. pollut. Res. 28, 6941–6955. doi: 10.1007/s11356-020-11020-7
PubMed Abstract | PubMed Abstract | Crossref Full Text | Google Scholar
Qian Y., Tang L., Qiu Q., Xu T., and Liao J. (2015). A comparative analysis on assessment of land carrying capacity with ecological footprint analysis and index system method. PLoS One 10, e0130315. doi: 10.1371/journal.pone.0130315
PubMed Abstract | PubMed Abstract | Crossref Full Text | Google Scholar
Ren G., Song G., Wang Q., and Sui H. (2023). Impact of “Non-grain” in cultivated land on agricultural development resilience: A case study from the major grain-producing area of northeast China. Appl. Sci. 13, 3814. doi: 10.3390/app13063814
Repar N., Jan P., Dux D., Nemecek T., and Doluschitz R. (2017). Implementing farm-level environmental sustainability in environmental performance indicators: A combined global-local approach. J. Cleaner Production 140, 692–704. doi: 10.1016/j.jclepro.2016.07.022
Rong L., Wang Z., and Li Z. (2024). Unraveling the role of Financial Risk, social globalization and Economic Risk towards attaining sustainable environment in China: Does resources curse still holds. Resour. Policy 88, 104375. doi: 10.1016/j.resourpol.2023.104375
Salman A. G. and Kanigoro B. (2021). Visibility forecasting using autoregressive integrated moving average (ARIMA) models. Proc. Comput. Sci. 179, 252–259. doi: 10.1016/j.procs.2021.01.004
Su Y., Liu Y., Zhou Y., and Liu J. (2024). Research on the coupling and coordination of land ecological security and high-quality agricultural development in the Han River basin. Land 13, 1666. doi: 10.3390/land13101666
Sun M., Wang J., and He K. (2020). Analysis on the urban land resources carrying capacity during urbanization——A case study of Chinese YRD. Appl. Geogr. 116, 102170. doi: 10.1016/j.apgeog.2020.102170
Tan G., Zhu J., and Chen Z. (2024). Deep learning based identification and interpretability research of traditional village heritage value elements: a case study in Hubei Province. Herit. Sci. 12, 200. doi: 10.1186/s40494-024-01322-1
Tang Y., Yuan Y., and Tian B. (2023). Analysis of the driving mechanism of land comprehensive carrying capacity from the perspective of urban renewal. Land 12, 1377. doi: 10.3390/land12071377
Tong D., Cheng J., Liu Y., Yu S., Yan L., Hong C., et al. (2020). Dynamic projection of anthropogenic emissions in China: methodology and 2015–2050 emission pathways under a range of socio-economic, climate policy, and pollution control scenarios. Atmospheric Chem. Phys. 20, 5729–5757. doi: 10.5194/acp-20-5729-2020
Tsou J., Gao Y., Zhang Y., Genyun S., Ren J., and Li Y. (2017). Evaluating urban land carrying capacity based on the ecological sensitivity analysis: A case study in Hangzhou, China. Remote Sens. 9, 529. doi: 10.3390/rs9060529
Turner B., Moss R. H., and Skole D. L. (1993).Relating land use and global land-cover change. Available online at: https://www.scopus.com/pages/publications/85040957216 (Accessed September 15, 2025).
Wang Z. and Liu W. (2024). A comparative study of urban ecological resilience in the Yangtze River Economic Belt and the Yellow River Basin. Humanit Soc. Sci. Commun. 11, 1471. doi: 10.1057/s41599-024-04017-x
Wang J., Mu X., Chen S., Liu W., Wang Z., and Dong Z. (2021). Dynamic evaluation of water resources carrying capacity of the Dianchi Lake Basin in 2005–2015, based on DSPERM framework model and simulated annealing-projection pursuit model. Regional Sustainability 2, 189–201. doi: 10.1016/j.regsus.2021.06.003
Wang J., Peng L., Chen J., and Deng X. (2024). Impact of rural industrial integration on farmers’ income: Evidence from agricultural counties in China. J. Asian Econ 93, 101761. doi: 10.1016/j.asieco.2024.101761
Wang Z., Wang Y., Wang L., Zhang T., and Tang Z. (2019). Research on the comprehensive evaluation system of eco-geological environmental carrying capacity based on the analytic hierarchy process. Cluster Comput. 22, 5347–5356. doi: 10.1007/s10586-017-1242-4
Wang S., Zhang Y., Fan J., Zhang H., and Fang H. (2023). Comprehensive sustainability indicator for land resource-carrying capacity in a farming-pastoral region. Remote Sens. 15, 3726. doi: 10.3390/rs15153726
Wu X. and Hu F. (2020). Analysis of ecological carrying capacity using a fuzzy comprehensive evaluation method. Ecol. Indic. 113, 106243. doi: 10.1016/j.ecolind.2020.106243
Wu S., Tian C., Li B., Wang J., and Wang Z. (2022). Ecological environment health assessment of lake water ecosystem system based on simulated annealing-projection pursuit: A case study of plateau lake. Sustain. Cities Soc. 86, 104131. doi: 10.1016/j.scs.2022.104131
Xia X., Gui L., Zhang Y., Xu X., Yu F., Wu H., et al. (2021). A fitness-based adaptive differential evolution algorithm. Inf. Sci. 549, 116–141. doi: 10.1016/j.ins.2020.11.015
Xu Z., Han G., Liu L., Martínez-García M., and Wang Z. (2021). Multi-energy scheduling of an industrial integrated energy system by reinforcement learning-based differential evolution. IEEE Trans. Green Commun. Networking 5, 1077–1090. doi: 10.1109/TGCN.2021.3061789
Xu C., Hu X., Liu Z., Wang X., Tian J., and Zhao Z. (2023). Predicting the evolution trend of water and land resource carrying capacity based on CA-Markov model in an arid region of northwest China. Sustainability 15, 1269. doi: 10.3390/su15021269
Yang W., Huang R., and Li D. (2024). China’s high-quality economic development: A study of regional variations and spatial evolution. Econ. Change Restruct. 57, 86. doi: 10.1007/s10644-024-09676-z
Yang W., Zhao Y., Wang D., Wu H., Lin A., and He L. (2020). Using principal components analysis and IDW interpolation to determine spatial and temporal changes of surface water quality of Xin’anjiang River in Huangshan, China. Int. J. Environ. Res. Public Health 17, 2942. doi: 10.3390/ijerph17082942
PubMed Abstract | PubMed Abstract | Crossref Full Text | Google Scholar
Yaohong W., Firdaus R. B. R., Xu J., Dharejo N., and Jun G. (2025). China’s rural revitalization policy: A PRISMA 2020 systematic review of poverty alleviation, food security, and sustainable development initiatives. Sustainability 17, 569. doi: 10.3390/su17020569
Yin L., Li H., Liu D., Zhang L., Wang C., Li M., et al. (2025). Interpretation and comprehensive evaluation of regional water-land-energy coupling system carrying capacity. Sustainability 17, 1669. doi: 10.3390/su17041669
Yu L., Li Z., and Liu D. (2024). Return-migrant urbanisation in inland China: the case of Hubei province. Land 13, 190. doi: 10.3390/land13020190
Yu X., Xie J., Jiang R., Zuo G., and Liang J. (2020). Assessment of water resource carrying capacity based on the chicken swarm optimization-projection pursuit model. Arab J. Geosci 13, 39. doi: 10.1007/s12517-019-5010-z
Zhang Q., Li Y., Kong Q., and Huang H. (2024a). Coupling coordination analysis and key factors between urbanization and water resources in ecologically fragile areas: a case study of the Yellow River Basin, China. Environ. Sci. pollut. Res. 31, 10818–10837. doi: 10.1007/s11356-024-31900-6
PubMed Abstract | PubMed Abstract | Crossref Full Text | Google Scholar
Zhang X., Shen H., Huang T., Wu Y., Guo B., Liu Z., et al. (2024b). Improved random forest algorithms for increasing the accuracy of forest aboveground biomass estimation using Sentinel-2 imagery. Ecol. Indic. 159, 111752. doi: 10.1016/j.ecolind.2024.111752
Zhao R., Zhan L., Yao M., and Yang L. (2020). A geographically weighted regression model augmented by Geodetector analysis and principal component analysis for the spatial distribution of PM2.5. Sustain. Cities Soc. 56, 102106. doi: 10.1016/j.scs.2020.102106
Zhao L., Zhao X., Zhou H., Wang X., and Xing X. (2021). Prediction model for daily reference crop evapotranspiration based on hybrid algorithm and principal components analysis in Southwest China. Comput. Electron. Agric. 190, 106424. doi: 10.1016/j.compag.2021.106424
Zhou J., Chen H., Bai Q., Liu L., Li G., and Shen Q. (2023a). Can the integration of rural industries help strengthen China’s agricultural economic resilience? Agriculture 13, 1813. doi: 10.3390/agriculture13091813
Keywords: land carrying capacity, projection pursuit model, differential evolution algorithm, obstacle degree model, Hubei Province
Citation: Ren B, Shao T and Su Y (2025) Strategic management of regional land carrying capacity: evidence from Hubei Province using an improved projection pursuit model. Front. Ecol. Evol. 13:1667787. doi: 10.3389/fevo.2025.1667787
Received: 18 July 2025; Accepted: 19 September 2025;
Published: 02 October 2025.
Edited by:
Shikuan Zhao, Chongqing University, ChinaCopyright © 2025 Ren, Shao and Su. This is an open-access article distributed under the terms of the Creative Commons Attribution License (CC BY). The use, distribution or reproduction in other forums is permitted, provided the original author(s) and the copyright owner(s) are credited and that the original publication in this journal is cited, in accordance with accepted academic practice. No use, distribution or reproduction is permitted which does not comply with these terms.
*Correspondence: Tianshu Shao, MjAxNzAzMDNAenVmZWRmYy5lZHUuY24=; Yuelong Su, bWVyc3V5bEBtYWlscy5jY251LmVkdS5jbg==